sal mo nella en terica se ro type en ter itidis states de part ment of ag ri cul ture ani mal and...
TRANSCRIPT
United States De part mentof Ag ri cul ture
Ani mal andPlant HealthIn spec tionServ ice
Vet eri naryServ ices
Sal mo nella en terica se ro type En ter itidis
in Ta ble Egg Layers in the U.S.
Na tional Ani mal Health Moni tor ing Sys tem October 2000
Ac knowl edg ments
This report has been prepared from material received and analyzed by the U.S. Department ofAgriculture (USDA), Animal and Plant Health Inspection Service (APHIS), Veterinary Services (VS)during a nationwide study of management and flock health on layer operations.
The Layers ‘99 study was a cooperative effort between State and Federal agricultural statisticians,animal health officials, university researchers, extension personnel, and table egg layer operators. Wewant to thank the industry members who helped determine the direction and objectives of this studyby participating in focus groups.
Thanks to the National Agricultural Statistics Service (NASS) enumerators and State and FederalVeterinary Medical Officers (VMO’s) and Animal Health Technician’s (AHT’s) for their hard workvisiting the operations and collecting the data and for their dedication to the National Animal HealthMonitoring System (NAHMS). The roles of the producer, Area Veterinarian in Charge (AVIC),NAHMS Coordinator, VMO, AHT, and NASS enumerator were critical in providing quality data forLayers ‘99 reports. Special recognition goes to the following individuals for their guidance andadvice:
• Dr. Charles Beard, U.S. Poultry & Egg Ass’n • Dr. Kenton Kreager, Hy-Line International
• Mr. Don Bell, University of California • Dr. John Mason, Food Safety Consultant Services
• Dr. Dave Castellan, California Dept. of Food & Ag. • Dr. Martin Smeltzer, USDA:APHIS:VS
• Dr. Richard Gast, USDA:Ag. Research Service • Dr. Chuck Strong, Grove River Mills
• Mr. Doug Hoffer, Creighton Brothers
Thanks also to the Centers for Epidemiology and Animal Health (CEAH) for their efforts ingenerating and distributing reports from Layers ‘99 data.
All participants are to be commended for their efforts, particularly the producers whose voluntaryefforts made the Layers ‘99 study possible.
Thomas E. Walton, DirectorCenters for Epidemiology and Animal Health
Sug gested Bib lio graphic Ci ta tion for This Re port:USDA. 2000. Sal mo nella en terica se ro type Enteri ti dis in Ta ble Egg Lay ers in the U.S. USDA:APHIS:VS, CEAH, Na tional Ani mal Health Moni tor ing Sys tem. Fort Col lins, CO. #N333.1000.
Con tacts for Fur ther In for ma tion:Ques tions or com ments on Lay ers ‘99 study meth od ol ogy or data analy sis:................Dr. Lind sey Gar berIn for ma tion on re prints or other NAHMS re ports:.........................................................Ms. Nina Stan ton Tele phone: (970) 490- 8000 E- mail: NAHM [email protected]
Ta ble of Con tents
In tro duc tion . . . . . . . . . . . . . . . . . . . . . . . . . . . . . . . . . . . . . . . . . . . . . . . . . . 1
Sal mo nella . . . . . . . . . . . . . . . . . . . . . . . . . . . . . . . . . . . . . . . . . . . . . . . . . 1Lay ers ‘99 Study . . . . . . . . . . . . . . . . . . . . . . . . . . . . . . . . . . . . . . . . . . . . . . 2Terms used in this re port . . . . . . . . . . . . . . . . . . . . . . . . . . . . . . . . . . . . . . . . . . 3
Sec tion I: Popu la tion Es ti mates . . . . . . . . . . . . . . . . . . . . . . . . . . . . . . . . . . . . . . . . 5
A. SE Moni tor ing/Pre ven tion Prac tices . . . . . . . . . . . . . . . . . . . . . . . . . . . . . . . . . . 5
1. SE pro grams dur ing the pul let grow ing pe riod . . . . . . . . . . . . . . . . . . . . . . 52. Test ing feed . . . . . . . . . . . . . . . . . . . . . . . . . . . . . . . . . . . . . . . . 83. Test ing in the layer house. . . . . . . . . . . . . . . . . . . . . . . . . . . . . . . . . 94. SE qual ity as sur ance pro grams . . . . . . . . . . . . . . . . . . . . . . . . . . . . . 12
B. En vi ron men tal Cul ture Re sults . . . . . . . . . . . . . . . . . . . . . . . . . . . . . . . . . . . . 14
1. De scrip tive results . . . . . . . . . . . . . . . . . . . . . . . . . . . . . . . . . . . . 142. Risk fac tors for hav ing a posi tive flock . . . . . . . . . . . . . . . . . . . . . . . . . 16
C. Mouse Cul ture Re sults . . . . . . . . . . . . . . . . . . . . . . . . . . . . . . . . . . . . . . . . 20
1. De scrip tive results . . . . . . . . . . . . . . . . . . . . . . . . . . . . . . . . . . . . 20
D. Egg Yolk An ti body Test . . . . . . . . . . . . . . . . . . . . . . . . . . . . . . . . . . . . . . . 23
Sec tion II: Methodology . . . . . . . . . . . . . . . . . . . . . . . . . . . . . . . . . . . . . . . . . . . 24
A. Needs assessment . . . . . . . . . . . . . . . . . . . . . . . . . . . . . . . . . . . . . . . . . . . 24B. Sam pling and es ti ma tion . . . . . . . . . . . . . . . . . . . . . . . . . . . . . . . . . . . . . . . 24C. Data col lec tion . . . . . . . . . . . . . . . . . . . . . . . . . . . . . . . . . . . . . . . . . . . . 25D. Data analy sis . . . . . . . . . . . . . . . . . . . . . . . . . . . . . . . . . . . . . . . . . . . . . 26
Appendix I: Sam ple Profile . . . . . . . . . . . . . . . . . . . . . . . . . . . . . . . . . . . . . . . . . 28
A. Num ber of Houses Sam pled . . . . . . . . . . . . . . . . . . . . . . . . . . . . . . . . . . . . . 28
Ap pen dix II: State SE Programs . . . . . . . . . . . . . . . . . . . . . . . . . . . . . . . . . . . . . . 29
Ap pen dix III: U.S. Ta ble Egg Layers . . . . . . . . . . . . . . . . . . . . . . . . . . . . . . . . . . . . 30
In tro duc tionSalmonella
What is Sal mo nella?Salmonella is a group of bacteria that can cause diarrheal illness in humans and animals and is asafety issue for foods from all animal sources. There are many different kinds of Salmonella bacteria. Sal mo nella typhimurium and Sal mo nella en terica se ro type Enteritidis are the most common serotypesin the United States.1
What are the signs of sal mo nel lo sis in hu mans?Signs of illness due to Salmonella infection, including diarrhea, fever, and abdominal cramps, appear12 to 72 hours after infection. The illness usually lasts 4 to 7 days, and most people recover withouttreatment. In some patients, the Salmonella infection may spread from the intestines to the bloodstream and to other body sites. Severe dehydration may require hospitalization and fluid treatment.The elderly, infants, and those with impaired immune systems are more likely to develop severeillness. Acute salmonellosis may cause death without prompt antibiotic treatment, although deathsare rare.
A small number of people infected with Salmonella will develop pains in their joints, irritation of theeyes, and painful urination. This is called Reiter’s syndrome. It can lead to chronic arthritis which isdifficult to treat.
Sal mo nella en terica se ro type Enteri ti disSal mo nella en terica se ro type Enteritidis is referred to as SE throughout this report. SE is the primaryserotype of concern with regard to food safety from poultry sources and is of particular concern in the U.S. to the layer industry as SE can infect the reproductive tracts of laying hens. Eggs can becontaminated if the layers are infected and the SE is deposited in or on the egg. The birds show nosign of infection, and the eggs they produce appear normal. The rate of egg contamination with SE is sporadic and is estimated between 1 and 11 positive eggs per 100,000 eggs.2
What can pro duc ers and con sum ers do to re duce the risk of SE in fec tion?Producers potentially can reduce risk of spreading SE infection and other disease problems in theirflocks by cleaning and disinfecting layer houses thoroughly between flocks and using good rodentcontrol practices. Immediate refrigeration of eggs will also prevent multiplication of bacteria in theeggs. Quality assurance programs have been developed to help producers implement bestmanagement practices to reduce risk of SE in eggs.
Consumers can prevent illness by discarding cracked eggs, thoroughly cooking eggs, keeping eggsand egg-containing foods refrigerated, and washing hands and utensils in hot, soapy water afterhandling raw eggs.
USDA:APHIS:VS 1 Layers ‘99
In tro duc tion Salmonella
1 Salmonellosis. U.S. Department of Health and Human Services; Centers for Disease Control and Prevention. 2000.(www.cdc.gov/ncidod/dbmd/diseaseinfo/salmonellosis_g.htm)
2 Salmonella Enteritidis Risk Assessment: Shell Eggs and Egg Products. USDA:APHIS, Food Safety and Inspection Service. 1998. (www.fsis.usda.gov/OPHS/risk/index.htm)

Lay ers ‘99 Study
The Na tional Ani mal Health Moni tor ing Sys tem’s (NAHMS) Lay ers ‘99 study was de signed topro vide both par tici pants and the in dus try with in for ma tion on the na tion’s ta ble egg layer popu la tionfor edu ca tion and re search. NAHMS is spon sored by the USDA:APHIS:Vet eri nary Serv ices (VS).
Lay ers ‘99 is the first NAHMS na tional study of the layer in dus try. NAHMS de vel oped studyob jec tives by ex plor ing ex ist ing lit era ture and con tact ing in dus try mem bers and re search ers abouttheir in for ma tional needs and pri ori ties. The ob jec tives are listed in side the back cover of this re port.
The US DA’s Na tional Ag ri cul tural Sta tis tics Serv ice (NASS) col labo rated with VS to se lect astatistically- valid sam ple from 15 states for Lay ers ‘99 (see map below). The 15- state tar getpopu la tion ac counted for over three- quarters of the ta ble egg lay ers in the U.S. on December 1, 1998.
NASS enu mera tors col lected data for Part I:Re ference of 1999 Ta ble Egg Layer Man age mentin the U.S. from 208 sin gle- and mul ti ple- farmcompanies via a ques tion naire ad min is teredFeb ru ary 1-26, 1999. These re spon dents pro vided in for ma tion on 526 farm sites which formed theba sis of that re port.
The sec ond phase of data col lec tion was done byfed eral and state Vet eri nary Medi cal Of fi cers(VMO’s) and Ani mal Health Tech ni cians (AHT’s) in the 15 states. Data were col lected on 252 farmsites for Part II: Ref er ence of 1999 Ta ble EggLayer Man age ment in the U.S. via a ques tion nairead min is tered from March 22 through April 30, 1999.
In for ma tion in both Parts I and II is operator- reported re flect ing the op era tor’s knowl edge or opinion,which may or may not be based on labo ra tory re sults or vet eri nary ad vice (see Sec tion II formeth od ologic in for ma tion).
Environmental sampling was conducted in 200 layer houses from May 3 through October 22, 1999.Ro dents were trapped in a a subset of these houses (137) to measure rodent index and house micewere cultured. Eggs were collected from 97 houses for yolk antibody testing for SE.
Re sults of the Lay ers ‘99 and other NAHMS stud ies are ac ces si ble on the World Wide Web athttp://www.aphis.usda.gov/vs/ceah/cahm. For ques tions about this re port or ad di tional Lay ers ‘99and NAHMS re sults, please con tact:
Cen ters for Epi de mi ol ogy and Ani mal HealthUSDA:APHIS:VS, attn. NAHMS; 555 South Howes; Fort Col lins, CO 80521
Tele phone: (970) 490- 8000; NAHM [email protected]/vs/ceah/cahm
* Iden ti fi ca tion num bers are as signed to each graph of this re port for pub lic ref er ence.
Lay ers ‘99 Study In tro duc tion
Layers ‘99 2 USDA:APHIS:VS
States Participating in the Layers '99 Study
#3950*
Terms Used in This Report
Bac terin: A killed bac te rial prod uct ad min is tered to im mu nize the host against a spe cific bac te rialdis ease.
Com peti tive ex clu sion: Ad min istra tion of a prod uct con tain ing bac te ria that com pete with SEbac te ria in the di ges tive tract, thereby lim it ing growth of SE bac te ria.
Egg yolk antibody test: A measurement of exposure to SE via an ELISA test to detect antibodies toSE in the yolk.
Environmental sample: Swabs were taken from sur faces in the layer house which included ma nurepiles, egg belts, elevator/equipment, and walkways.
Farm site: A con tigu ous land unit that makes up a sin gle prem ises. A farm site may have one ormore layer houses on it.
Flock: A group of birds of simi lar age (ages may have varied sev eral weeks from the me dian age ofthe flock) con sid ered as a pro duc tion unit. A flock usu ally fills only one layer house, but it may takeup more or less than one house.
Last com pleted flock: The most re cent flock that com pleted its pro duc tion cy cle and then wasre moved from the farm.
Layer: A chicken that pro duces eggs for ta ble use or egg products.
Molt: That pe riod of time when birds are taken out of pro duc tion (usu ally around 65-70 weeks ofage) un til they re turn ap proxi mately to their 18- week weight. Af ter a rest pe riod, they are re turned topro duc tion for an other lay ing cy cle.
N/A: Not ap pli ca ble.
Non- business visi tor: Any one who did not have a busi ness rea son for vis it ing the op era tion, such asfriends, fam ily mem bers, and tours.
Odds ratio: Es ti mate of rela tive risk, or in creased risk, com pared to ref er ence level (where oddsra tio=1).
P-value: Prob abil ity of ob tain ing a dif fer ence at least as large as the ob served dif fer ence by chancealone given that the null hy pothe sis is true.
Popu la tion es ti mates: Av er ages and pro por tions weighted to rep re sent the popu la tion. For thisre port, the ref er ence popu la tion was all company- owned and con tract farms as so ci ated with(com pa nies) op era tions that had 30,000 or more lay ers on De cem ber 1, 1998, in the 15 par tici pat ingstates. Most of the es ti mates in this re port are pro vided with a meas ure of pre ci sion called thestan dard er ror. If the only er ror is sam pling er ror, chances are 95 out of 100 that the in ter val cre atedby the es ti mate plus or mi nus two stan dard er rors will con tain the true popu la tion value. In theex am ple il lus trated on the next page, an es ti mate of 7.5 with a stan dard er ror of 1.0 re sults in a rangeof 5.5 to 9.5 (two times the stan dard er ror above and be low the es ti mate). The sec ond es ti mate of 3.4
In tro duc tion Terms Used in This Report
USDA:APHIS:VS 3 Layers ‘99
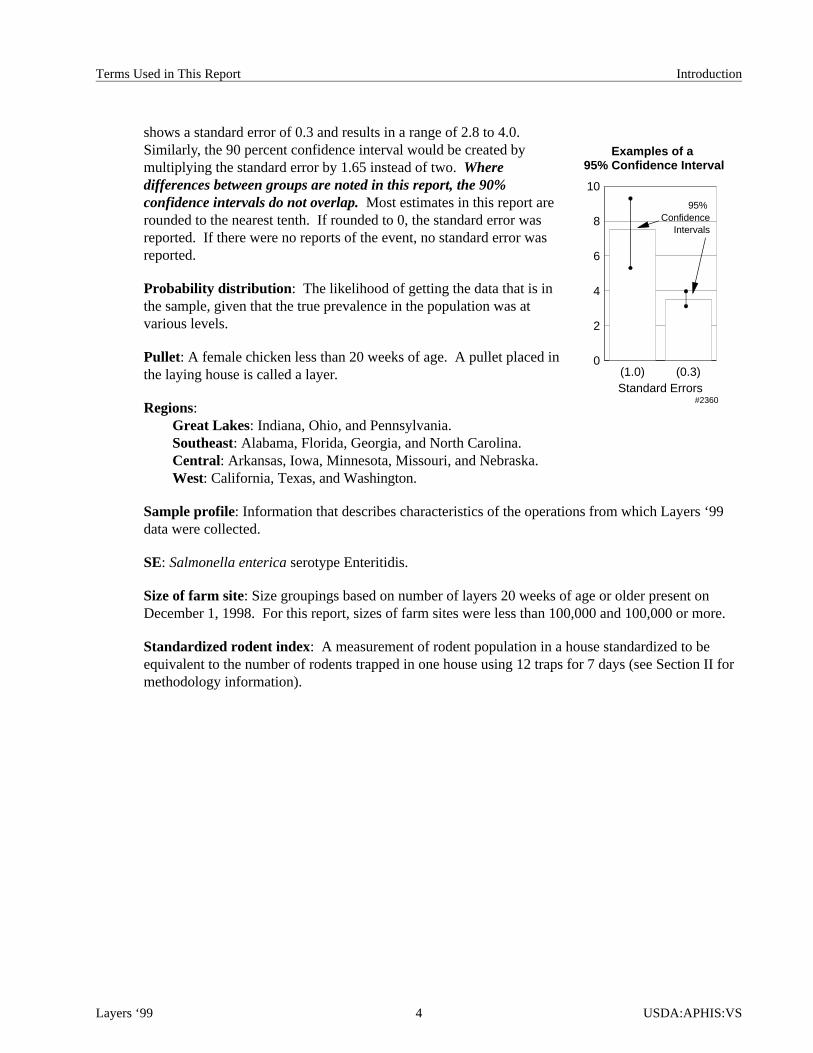
shows a stan dard er ror of 0.3 and re sults in a range of 2.8 to 4.0.Simi larly, the 90 per cent con fi dence in ter val would be cre ated bymul ti ply ing the stan dard er ror by 1.65 in stead of two. Wheredif fer ences be tween groups are noted in this re port, the 90%con fi dence in ter vals do not over lap. Most es ti mates in this re port arerounded to the near est tenth. If rounded to 0, the stan dard er ror wasre ported. If there were no re ports of the event, no stan dard er ror wasre ported.
Probability distribution: The like li hood of get ting the data that is inthe sam ple, given that the true prevalence in the population was atvarious levels.
Pul let: A fe male chicken less than 20 weeks of age. A pul let placed inthe lay ing house is called a layer.
Re gions:Great Lakes: In di ana, Ohio, and Penn syl va nia.South east: Ala bama, Flor ida, Geor gia, and North Caro lina.
Cen tral: Ar kan sas, Iowa, Min ne sota, Mis souri, and Ne braska.West: Cali for nia, Texas, and Wash ing ton.
Sam ple pro file: In for ma tion that de scribes char ac ter is tics of the op era tions from which Lay ers ‘99data were col lected.
SE: Sal mo nella en terica se ro type Enteri ti dis.
Size of farm site: Size group ings based on number of lay ers 20 weeks of age or older pres ent onDe cem ber 1, 1998. For this re port, sizes of farm sites were less than 100,000 and 100,000 or more.
Standardized rodent index: A measurement of rodent population in a house stan dard ized to beequiva lent to the number of ro dents trapped in one house us ing 12 traps for 7 days (see Sec tion II formethod ol ogy in for ma tion).
Layers ‘99 4 USDA:APHIS:VS
Terms Used in This Report In tro duc tion
Examples of a 95% Confidence Interval
(1.0) (0.3)Standard Errors
0
2
4
6
8
10
#2360
95% Confidence
Intervals

Sec tion I: Popu la tion Es ti matesA. SE Monitoring/Prevention Practices
1. SE pro grams dur ing the pul let grow ing period
Over all, lay ers on 69.6 per cent of farm sites came from pul let fa cili ties that moni tored for SE. The Westre gion had the larg est per centage of farm sites (83.0 per cent) that ob tained their lay ers from SEmoni tored pul let fa cili ties.
Note: Es ti mates for farm sites that moni tored for SE may be low be cause about 4 per cent of pro duc ersover all (20 per cent of pro duc ers in the Cen tral re gion) did not know whether or not these pro ce dureswere done. These farm sites were in cluded among those farm sites where moni tor ing was not done.
a. Percent of layer farm sites that used the following methods to monitor SE in pullets at the growingoperation by region:
Per cent Farm Sites by Region*
Great Lakes Southeast Cen tral* West All Farm Sites
SE Moni tor ing Methods PercentStan dard
Er ror PercentStan dard
Er ror Per ce ntStan dard
Er ror Per ce ntStan dard
Er ror Per ce ntStan dard
Er ror
Dead chick/chick papertesting 41.5 (7.4) 41.3 (9.5) 13.9 (2.8) 70.6 (4.2) 43.5 (3.9)
Environmental/manureculture 55.6 (8.1) 54.7 (9.4) 54.0 (6.7) 43.8 (5.6) 52.4 (4.1)
Bird culture 4.2 (1.2) 1.7 (0.8) 8.2 (2.3) 23.9 (4.1) 8.9 (1.2)
Serology 4.6 (1.6) 17.0 (4.9) 13.4 (3.1) 49.3 (6.5) 19.2 (2.7)
Any of the above 63.6 (8.4) 69.1 (7.7) 65.1 (6.0) 83.0 (2.6) 69.6 (3.9)
* Producers on 20 percent of farm sites in the Central region did not know if these procedures were done. The remaining regionshad less than 2 percent of producers who did not know.
USDA:APHIS:VS 5 Layers ‘99
Sec tion I: Popu la tion Es ti mates A. SE Monitoring/Prevention Practices
83
65.1 63.6 69.1
West Central Great Lakes SoutheastRegion
0
25
50
75
100Percent Farm Sites
West
Central
Southeast
Great Lakes
Percent Layer Farm Sites that Used Any Method to Monitor SE in Pullets at the Growing Operation by Region
#4292
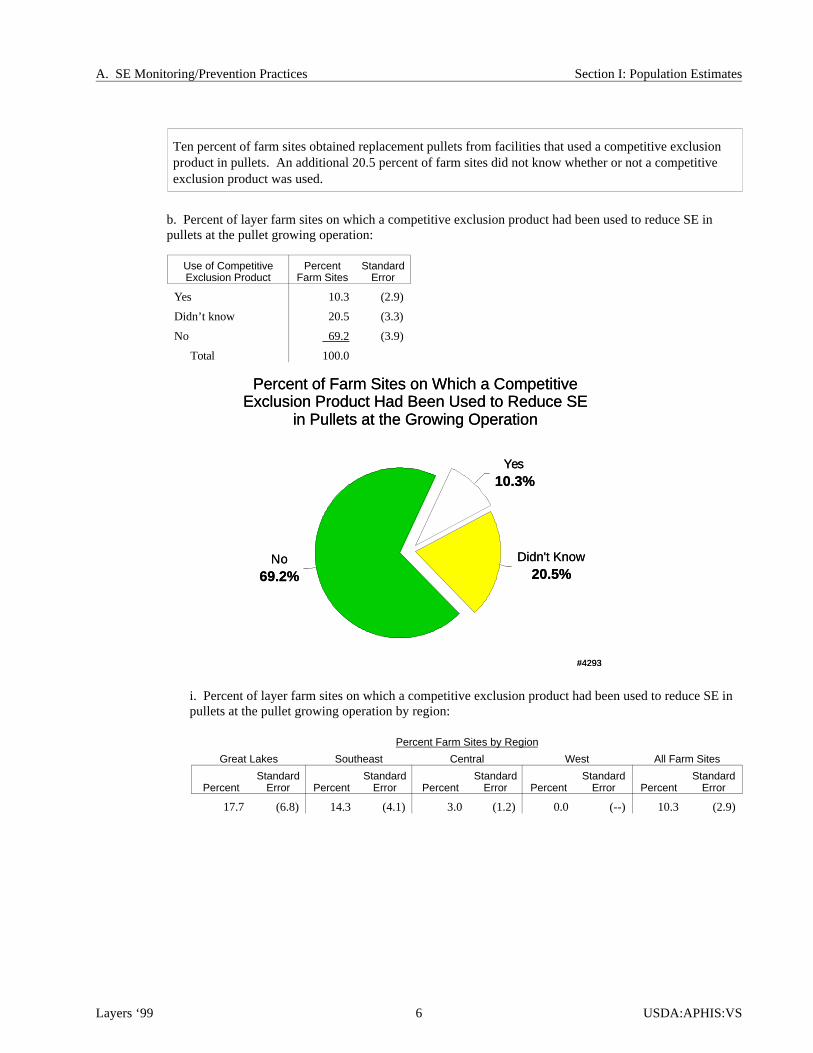
Ten per cent of farm sites ob tained re place ment pul lets from fa cili ties that used a com peti tive ex clu sionpro duct in pul lets. An ad di tional 20.5 per cent of farm sites did not know whether or not a com peti tiveex clu sion prod uct was used.
b. Percent of layer farm sites on which a competitive exclusion product had been used to reduce SE inpullets at the pullet growing operation:
Use of Com peti tiveExclusion Product
Per centFarm Sites
Stan dardEr ror
Yes 10.3 (2.9)
Didn’t know 20.5 (3.3)
No 69.2 (3.9)
Total 100.0
i. Percent of layer farm sites on which a competitive exclusion product had been used to reduce SE inpullets at the pullet growing operation by region:
Per cent Farm Sites by Region
Great Lakes Southeast Central West All Farm Sites
PercentStan dard
Er ror PercentStan dard
Er ror Per ce ntStan dard
Er ror Per ce ntStan dard
Er ror Per ce ntStan dard
Er ror
17.7 (6.8) 14.3 (4.1) 3.0 (1.2) 0.0 (--) 10.3 (2.9)
Layers ‘99 6 USDA:APHIS:VS
A. SE Monitoring/Prevention Practices Sec tion I: Popu la tion Es ti mates
Percent of Farm Sites on Which a Competitive Exclusion Product Had Been Used to Reduce SE
in Pullets at the Growing Operation
#4293
Yes10.3%
Didn't Know20.5%
No69.2%
Percent of Farm Sites on Which a Competitive Exclusion Product Had Been Used to Reduce SE
in Pullets at the Growing Operation
#4293
Yes10.3%
Didn't Know20.5%
No69.2%
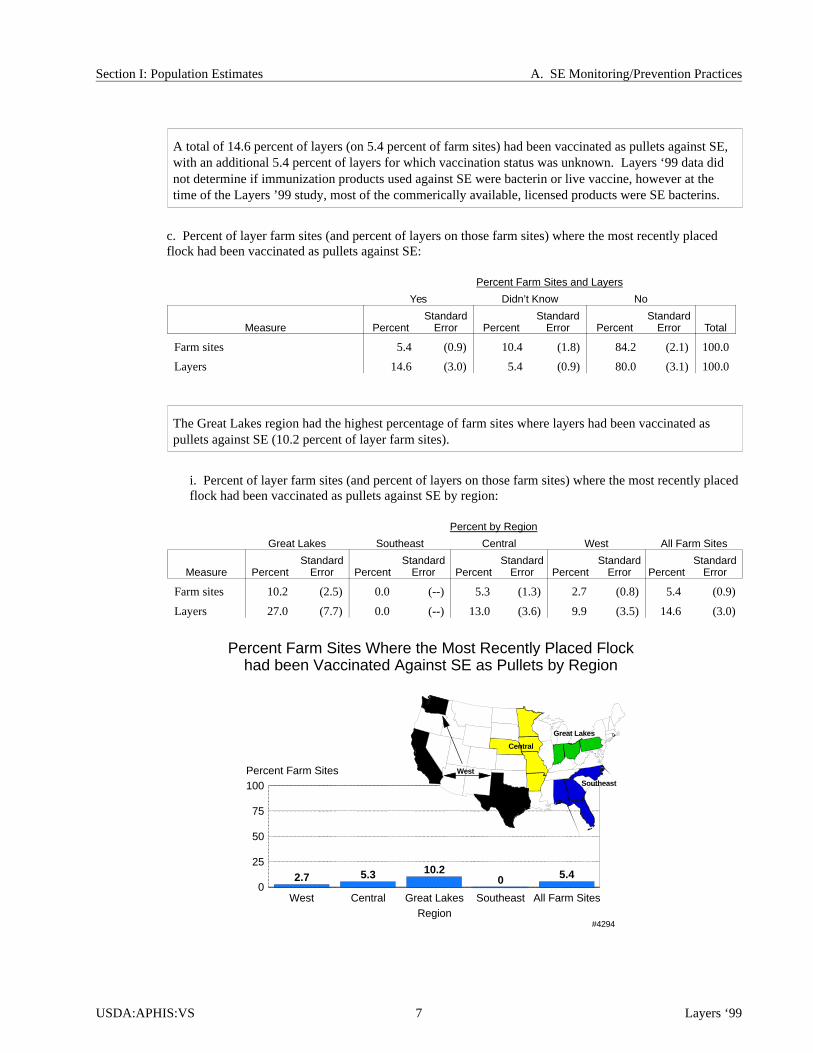
A to tal of 14.6 per cent of lay ers (on 5.4 per cent of farm sites) had been vac ci nated as pul lets against SE,with an ad di tional 5.4 per cent of lay ers for which vac ci na tion status was un known. Lay ers ‘99 data didnot de ter mine if im mu ni za tion prod ucts used against SE were bac terin or live vac cine, how ever at thetime of the Lay ers ’99 study, most of the com meri cally avail able, licensed prod ucts were SE bac ter ins.
c. Percent of layer farm sites (and percent of layers on those farm sites) where the most recently placedflock had been vaccinated as pullets against SE:
Per cent Farm Sites and Lay ers
Yes Didn’t Know No
Measure PercentStan dard
Er ror PercentStan dard
Er ror PercentStan dard
Er ror Total
Farm sites 5.4 (0.9) 10.4 (1.8) 84.2 (2.1) 100.0
Layers 14.6 (3.0) 5.4 (0.9) 80.0 (3.1) 100.0
The Great Lakes re gion had the high est per cent age of farm sites where lay ers had been vac ci nated aspul lets against SE (10.2 per cent of layer farm sites).
i. Percent of layer farm sites (and percent of layers on those farm sites) where the most recently placedflock had been vaccinated as pullets against SE by region:
Per cent by Region
Great Lakes Southeast Central West All Farm Sites
Measure PercentStan dard
Er ror PercentStan dard
Er ror Per ce ntStan dard
Er ror Per ce ntStan dard
Er ror Per ce ntStan dard
Er ror
Farm sites 10.2 (2.5) 0.0 (--) 5.3 (1.3) 2.7 (0.8) 5.4 (0.9)
Layers 27.0 (7.7) 0.0 (--) 13.0 (3.6) 9.9 (3.5) 14.6 (3.0)
USDA:APHIS:VS 7 Layers ‘99
Sec tion I: Popu la tion Es ti mates A. SE Monitoring/Prevention Practices
2.7 5.3 10.20 5.4
West Central Great Lakes Southeast All Farm SitesRegion
0
25
50
75
100Percent Farm Sites West
Central
Southeast
Great Lakes
Percent Farm Sites Where the Most Recently Placed Flock had been Vaccinated Against SE as Pullets by Region
#4294

2. Test ing feed
The per cent ages of farm sites where ei ther fin ished feed or feed in gre di ents were tested for SE ranged from28.8 per cent of farm sites in the Cen tral re gion to 80.7 per cent of farm sites in the West. Test ing of feedin gre di ents was most com mon for farm sites in the West (76.0 per cent) and South east (74.5 per cent) re gions.
a. Percent of farm sites that routinely tested finished feed or any feed ingredients for SE by region:
Per cent Farm Sites by Region
Great Lakes Southeast Central West All Farm Sites
Item Tested for SE PercentStan dard
Er ror PercentStan dard
Er ror Per ce ntStan dard
Er ror Per ce ntStan dard
Er ror Per ce ntStan dard
Er ror
Finished feed 41.0 (7.8) 51.5 (9.9) 25.9 (4.9) 67.6 (5.1) 46.8 (4.1)
Any feed ingredients 38.9 (7.7) 74.5 (6.7) 18.5 (4.5) 76.0 (3.8) 51.6 (4.0)
Either feed or feedingredients 43.8 (7.8) 78.5 (6.6) 28.8 (5.1) 80.7 (3.4) 57.2 (4.0)
Both feed and feedingredients 36.1 (7.7) 47.5 (9.8) 15.6 (4.3) 62.8 (5.5) 41.2 (4.1)
Layers ‘99 8 USDA:APHIS:VS
A. SE Monitoring/Prevention Practices Sec tion I: Popu la tion Es ti mates
Percent of Farm Sites that Routinely Tested Finished Feed or Any Feed Ingredients for SE
#4295
46.8
51.6
57.2
41.2
Finished feed
Any feed ingredients
Feed or feed ingredients
Feed & feed ingredients
Item Tested
0 25 50 75 100
Percent
3. Test ing in the layer house
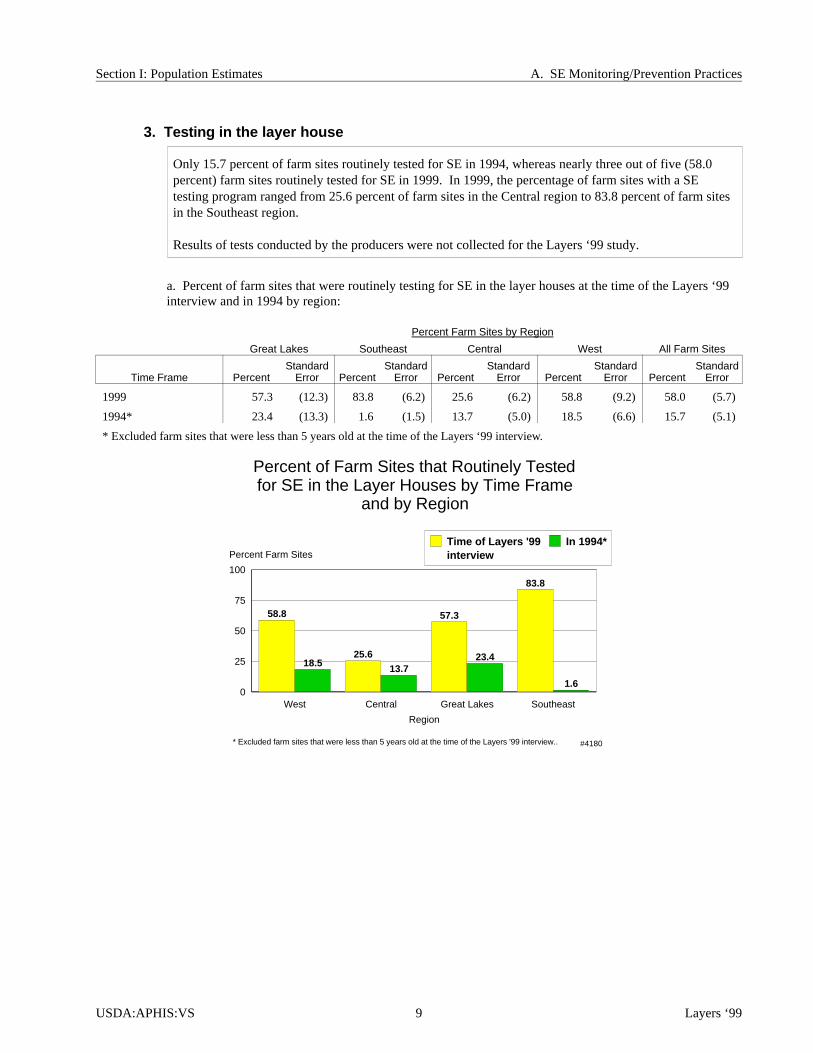
Only 15.7 per cent of farm sites rou tinely tested for SE in 1994, whereas nearly three out of five (58.0per cent) farm sites rou tinely tested for SE in 1999. In 1999, the per centage of farm sites with a SEtest ing program ranged from 25.6 per cent of farm sites in the Cen tral re gion to 83.8 per cent of farm sitesin the South east re gion.
Re sults of tests con ducted by the pro duc ers were not col lected for the Lay ers ‘99 study.
a. Percent of farm sites that were routinely testing for SE in the layer houses at the time of the Layers ‘99interview and in 1994 by region:
Per cent Farm Sites by Region
Great Lakes Southeast Central West All Farm Sites
Time Frame PercentStan dard
Er ror PercentStan dard
Er ror Per ce ntStan dard
Er ror Per ce ntStan dard
Er ror Per ce ntStan dard
Er ror
1999 57.3 (12.3) 83.8 (6.2) 25.6 (6.2) 58.8 (9.2) 58.0 (5.7)
1994* 23.4 (13.3) 1.6 (1.5) 13.7 (5.0) 18.5 (6.6) 15.7 (5.1)
* Excluded farm sites that were less than 5 years old at the time of the Layers ‘99 interview.
USDA:APHIS:VS 9 Layers ‘99
Sec tion I: Popu la tion Es ti mates A. SE Monitoring/Prevention Practices
Percent of Farm Sites that Routinely Tested for SE in the Layer Houses by Time Frame
and by Region
#4180
18.5 13.723.4
1.6
58.8
25.6
57.3
83.8
West Central Great Lakes Southeast
Region
0
25
50
75
100
Percent Farm SitesTime of Layers '99interview
In 1994*
* Excluded farm sites that were less than 5 years old at the time of the Layers '99 interview..
NOTE: The fol low ing ta bles describe those farm sites that tested for SE at the time of the Lay ers ‘99in ter view and those farm sites that tested for SE in 1994. Fewer than one in five farm sites tested in1994, whereas nearly three in five farm sites tested dur ing Lay ers ‘99 (Ta ble I.A.3.a).
The most com mon method of test ing for SE was by ma nure cul ture (89.7 per cent of farm sites thattested). Ap proxi mately one- half of the farm sites that tested for SE cul tured swabs from egg belts andele va tor equip ment. More than one test method may have been used on a farm site.
i. For farm sites that tested for SE in the layer houses for each time period, percent of farm sites thatused the following methods to test for SE in the layer houses at the time of the Layers ‘99 interviewand in 1994:
Per cent Farm Sites by Time Frame
1999 1994
Method of Testing (Source) Per centStan dard
Er ror PercentStan dard
Er ror
Culture
Manure (swab)* 89.7 (3.6) 84.2 (11.1)
Egg belts (swab)* 52.6 (9.2) 41.3 (18.2)
Elevator/equipment (swab)* 42.0 (8.7) 34.7 (16.7)
Egg 10.4 (3.5) 26.8 (12.1)
Serology 12.7 (3.9) 27.7 (13.0)
Other 0.6 (0.4) 0.0 (--)
* For those farm sites that had such equipment.
Com pany or farm per son nel col lected sam ples for SE test ing in 1999 on nearly three out of four farmsites (70.1 per cent). A pri vate vet eri nar ian was the most fre quent sam ple col lec tor in cluded in the Othercate gory.
ii. For farm sites that tested for SE in the layer houses, percent of farm sites by primary samplecollector for SE testing at the time of the Layers ‘99 interview and in 1994:
Per cent Farm Sites by Time Frame
1999 1994
Pri mary Sam ple Col lec tor PercentStan dard
Er ror Per centStan dard
Er ror
Company or farm personnel 70.1 (6.3) 59.1 (15.3)
State or Federal personnel 8.5 (2.4) 17.2 (10.9)
Other 21.4 (5.4) 23.7 (13.0)
Total 100.0 100.0
Layers ‘99 10 USDA:APHIS:VS
A. SE Monitoring/Prevention Practices Sec tion I: Popu la tion Es ti mates
In 1999, approxi mately equal percentages of farm sites tested (by any sam pling method) for SE be foreand dur ing the last 4 weeks of pro duc tion. Test ing dur ing the last 4 weeks of pro duc tion was morecom mon in 1999 than in 1994 for farm sites that tested for SE. About one in three farm sites in each time frame tested be fore lay ers were placed. Farm sites may have tested more than once dur ing a productioncy cle.
iii. For farm sites that tested for SE in the layer houses, percent of farm sites by when testing for SEwas usually performed at the time of the Layers ‘99 interview and in 1994:
Per cent Farm Sites by Time Frame
1999 1994
Time Test ing Was Performed Per centStan dard
Er ror Per centStan dard
Er ror
Before layers were placed 29.4 (6.7) 33.7 (12.8)
After layers were placed but before the last 4 weeks of production 59.8 (8.1) 62.1 (15.1)
During the last 4 weeks of production 59.2 (9.0) 24.5 (9.9)
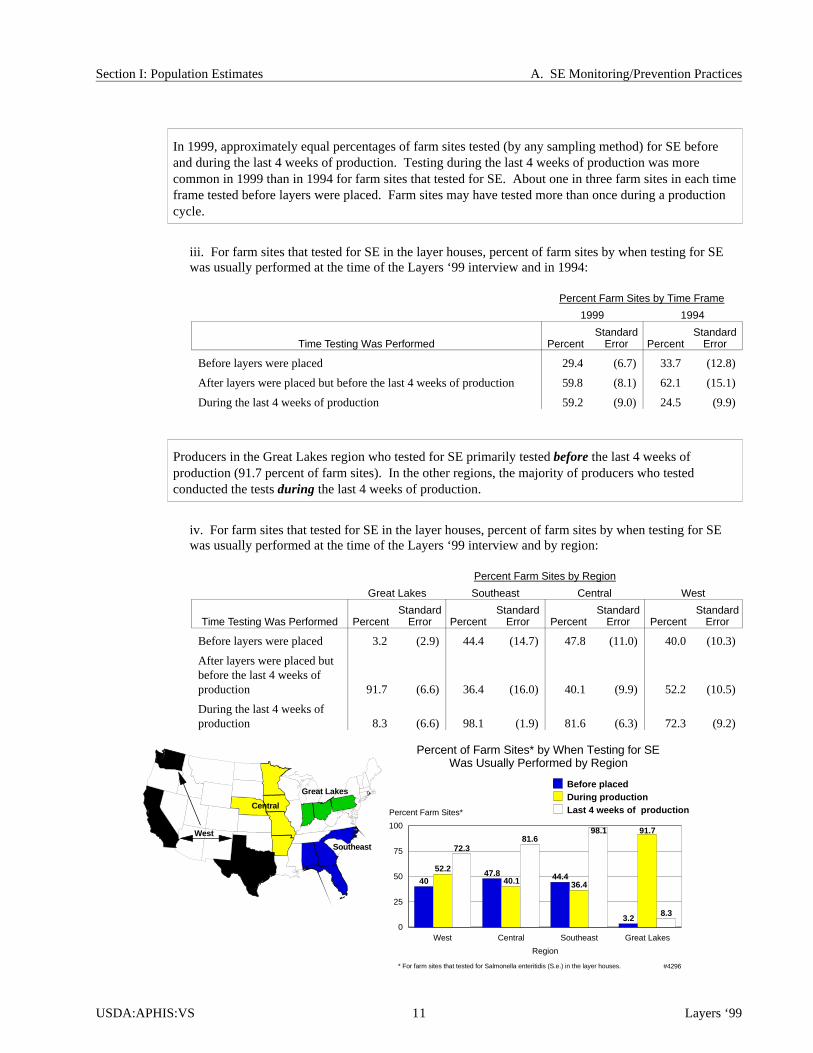
Pro duc ers in the Great Lakes re gion who tested for SE pri mar ily tested be fore the last 4 weeks ofpro duc tion (91.7 per cent of farm sites). In the other re gions, the ma jor ity of pro duc ers who testedcon ducted the tests dur ing the last 4 weeks of pro duc tion.
iv. For farm sites that tested for SE in the layer houses, percent of farm sites by when testing for SEwas usually performed at the time of the Layers ‘99 interview and by region:
Per cent Farm Sites by Region
Great Lakes Southeast Central West
Time Test ing Was Performed PercentStan dard
Er ror PercentStan dard
Er ror Per ce ntStan dard
Er ror Per ce ntStan dard
Er ror
Before layers were placed 3.2 (2.9) 44.4 (14.7) 47.8 (11.0) 40.0 (10.3)
After layers were placed butbefore the last 4 weeks ofproduction 91.7 (6.6) 36.4 (16.0) 40.1 (9.9) 52.2 (10.5)
During the last 4 weeks ofproduction 8.3 (6.6) 98.1 (1.9) 81.6 (6.3) 72.3 (9.2)
USDA:APHIS:VS 11 Layers ‘99
Sec tion I: Popu la tion Es ti mates A. SE Monitoring/Prevention Practices
Percent of Farm Sites* by When Testing for SE Was Usually Performed by Region
#4296
72.381.6
98.1
8.3
52.240.1 36.4
91.7
4047.8 44.4
3.2
West Central Southeast Great Lakes
Region
0
25
50
75
100
Percent Farm Sites*
Before placedDuring productionLast 4 weeks of production
* For farm sites that tested for Salmonella enteritidis (S.e.) in the layer houses.
West
Central
Southeast
Great Lakes

4. SE qual ity as sur ance pro grams
Over one- half (56.1 per cent) of farm sites par tici pated in a SE qual ity as sur ance pro gram, with the mostcom mon be ing a com pany spon sored pro gram (40.3 per cent of farm sites). The per centage of farm sitespar tici pat ing in any pro gram ranged from 22.9 per cent in the Cen tral re gion to 83.8 per cent in theSouth east. In some states, a state or company pro gram may have been the same as the com mod itypro gram and may have been in cluded in one or both cate go ries.
Esti mates of par tici pa tion in pro grams were based on pro ducer re ports with no fur ther con fir ma tion. Note that the per cent ages of farm sites par tici pat ing in any qual ity as sur ance pro gram are simi lar to theper cent ages of farm sites test ing for SE (see Ta ble I.A.3.a).
a. Percent of farm sites that participated in the following SE quality assurance programs by region:
Per cent Farm Sites by Region
Great Lakes Southeast Central West All Farm Sites
SE Quality As sur ance Pro gram Percent
Stan dardEr ror Percent
Stan dardEr ror Per ce nt
Stan dardEr ror Per ce nt
Stan dardEr ror Per ce nt
Stan dard Er ror
State program 25.1 (13.4) 9.4 (3.6) 0.0 (--) 48.2 (8.4) 22.7 (5.3)
Company sponsoredprogram 29.5 (9.7) 72.4 (8.5) 21.8 (5.5) 39.5 (8.8) 40.3 (5.3)
Commodity groupprogram (e.g., UnitedEgg Producers) 18.1 (12.1) 59.6 (12.1) 10.2 (3.0) 27.2 (6.8) 28.4 (6.2)
Other 0.0 (--) 0.0 (--) 0.0 (--) 0.0 (--) 0.0 (--)
Any 52.0 (12.4) 83.8 (6.2) 22.9 (5.5) 60.2 (9.2) 56.1 (5.7)
Layers ‘99 12 USDA:APHIS:VS
A. SE Monitoring/Prevention Practices Sec tion I: Popu la tion Es ti mates
Percent of Farm Sites that Participated in the Following SE Quality Assurance Programs
#4297
22.7
40.3
28.4
0
56.1
State program
Co. sponsored program
Commodity group program
Other
Any program
SE Quality Assurance Program
0 25 50 75 100
Percent Farm Sites
e.g., United Egg Producers

Over one- half (55.0 per cent) of farm sites that par tici pated in a SE qual ity as sur ance pro gram had anin spec tion by some one not as so ci ated with the farm (i.e., in de pend ent third- party veri fi ca tion). Theper cent age ranged from 6.1 per cent of farm sites in the Cen tral re gion to 88.0 per cent of farm sites in theWest re gion. State in volve ment in veri fi ca tion of SE qual ity as sur ance plans is de scribed for Lay ers ‘99 states in Ap pen dix II.
i. For farm sites that participated in a SE quality assurance program, percent of farm sites that had aninspection by someone not associated with the farm site or company to verify compliance with the SEquality assurance program by region:
Per cent Farm Sites by Region
Great Lakes Southeast Central West All Farm Sites
PercentStan dard
Er ror PercentStan dard
Er ror Per ce ntStan dard
Er ror Per ce ntStan dard
Er ror Per ce ntStan dard
Er ror
48.2 (18.8) 46.3 (14.7) 6.1 (4.8) 88.0 (3.8) 55.0 (8.2)
USDA:APHIS:VS 13 Layers ‘99
Sec tion I: Popu la tion Es ti mates A. SE Monitoring/Prevention Practices

B. Environmental Culture Results
1. De scrip tive results
Over all, SE was found in 7.1 per cent of layer houses. Re gional preva lence es ti mates ranged from 0percent in the South east to 17.2 per cent in the Great Lakes re gion. Note the large stan dard er ror in theGreat Lakes re gion due to a small sam ple size as a re sult of low par tici pa tion in this re gion. How ever,this small sam ple was simi lar to the large sam ple from this re gion that par tici pated in Phase I of the study in terms of many man age ment prac tices (see the discussion at the end of Sec tion II). These re sults arespe cific for SE; pres ence of other ser otypes were not re corded.
a. Percent of layer houses with at least one environmental culture swab positive for SE by region:
Per cent Layer Houses by Region
Great Lakes Southeast Central West All Farm Sites
PercentStan dard
Er ror PercentStan dard
Er ror Per ce ntStan dard
Er ror Per ce ntStan dard
Er ror Per ce ntStan dard
Er ror
17.2 (13.7) 0.0 (--) 9.0 (7.2) 4.4 (2.5) 7.1 (3.6)
Layers ‘99 14 USDA:APHIS:VS
B. Environmental Culture Results Sec tion I: Popu la tion Es ti mates
4.4 917.2
07.1
West Central Great Lakes Southeast All Farm SitesRegion
0
25
50
75
100Percent Layer Houses West
Central
Southeast
Great Lakes
Percent Layer Houses with at Least One Environmental Culture Swab Positive for SE by Region
#4298
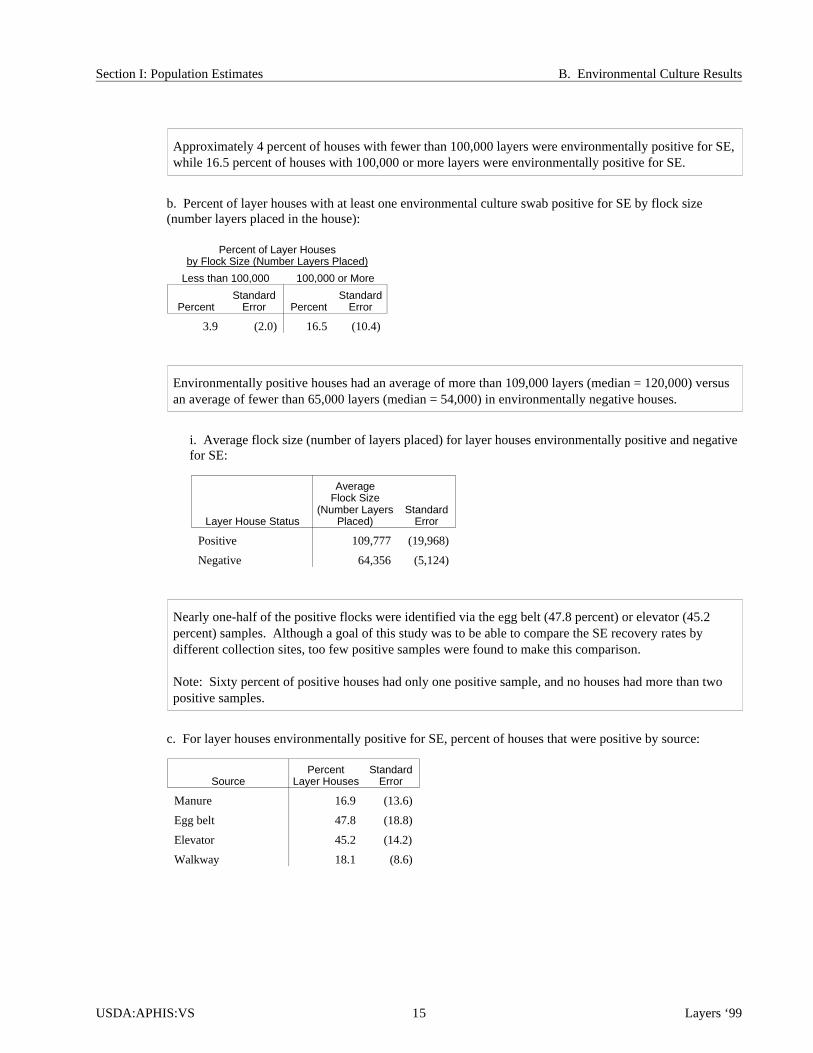
Ap proxi mately 4 per cent of houses with fewer than 100,000 lay ers were en vi ron men tally posi tive for SE, while 16.5 per cent of houses with 100,000 or more lay ers were en vi ron men tally posi tive for SE.
b. Percent of layer houses with at least one environmental culture swab positive for SE by flock size(number layers placed in the house):
Per cent of Layer Housesby Flock Size (Num ber Lay ers Placed)
Less than 100,000 100,000 or More
PercentStan dard
Er ror PercentStan dard
Er ror
3.9 (2.0) 16.5 (10.4)
En vi ron men tally posi tive houses had an av er age of more than 109,000 lay ers (me dian = 120,000) ver susan av er age of fewer than 65,000 lay ers (me dian = 54,000) in en vi ron men tally nega tive houses.
i. Average flock size (number of layers placed) for layer houses environmentally positive and negativefor SE:
Layer House Status
Av er ageFlock Size
(Num ber Lay ersPlaced)
Stan dardEr ror
Positive 109,777 (19,968)
Negative 64,356 (5,124)
Nearly one- half of the posi tive flocks were iden ti fied via the egg belt (47.8 per cent) or ele va tor (45.2per cent) sam ples. Al though a goal of this study was to be able to com pare the SE re cov ery rates bydif fer ent col lec tion sites, too few posi tive sam ples were found to make this comparison.
Note: Sixty per cent of posi tive houses had only one posi tive sam ple, and no houses had more than twoposi tive sam ples.
c. For layer houses environmentally positive for SE, percent of houses that were positive by source:
SourcePer cent
Layer HousesStan dard
Er ror
Manure 16.9 (13.6)
Egg belt 47.8 (18.8)
Elevator 45.2 (14.2)
Walkway 18.1 (8.6)
USDA:APHIS:VS 15 Layers ‘99
Sec tion I: Popu la tion Es ti mates B. Environmental Culture Results

The odds of a flock hav ing at least one en vi ron mental sam ple test ing posi tive for SE was evalu ated for ro dentin dex (Ta ble I.B.2.a), sev eral flock char ac ter is tics (Ta ble I.B.2.b), farm man age ment prac tices (Ta ble I.B.2.c),and clean ing and dis in fect ing prac tices (Ta ble I.B.2.d). These vari ables were mod eled with re gion and flocksize as co vari ates to ad just for pos si ble con found ing in flu ences. Other po ten tial con foun ders may ex ist, butdue to the low number of posi tive flocks, ad di tional co vari ates could not be mod eled. Ta bles in this sec tionshow po ten tial fac tors re lated to pres ence of SE, the per cent of flocks with the fac tor that were posi tive forSE (and stan dard er ror), the odds ra tio (ad justed for re gion and flock size), and the p- value.
2. Risk fac tors for hav ing a posi tive flock
Af ter ad just ing for re gion and flock size, houses with a stan dard ized ro dent in dex of 20 or more werenearly nine times more likely to have SE found within the house than were houses with a ro dent in dex ofless than 20. Cal cu la tion of the ro dent in dex is de scribed in the Meth od ol ogy sec tion (Sec tion II.D.1) ofthis report.
a. Percent of layer houses with at least one environmental culture swab positive for SE by standardizedrodent index (rodents trapped in 12 traps per week):
Ro dent Index
Per centLayer Houses
Posi tiveOddsRatio p-value
0 - 19 2.0 1 .04
20 or more 10.1 8.9
The av er age ro dent in dex in SE posi tive houses was more than twice that of nega tive houses.
i. Average rodent index for layer houses environmentally positive and negative for SE:
Layer House StatusAv er age
Ro dent IndexStan dard
Er ror
Positive 38.9 (7.1)
Negative 16.7 (2.4)
Layers ‘99 16 USDA:APHIS:VS
B. Environmental Culture Results Sec tion I: Popu la tion Es ti mates
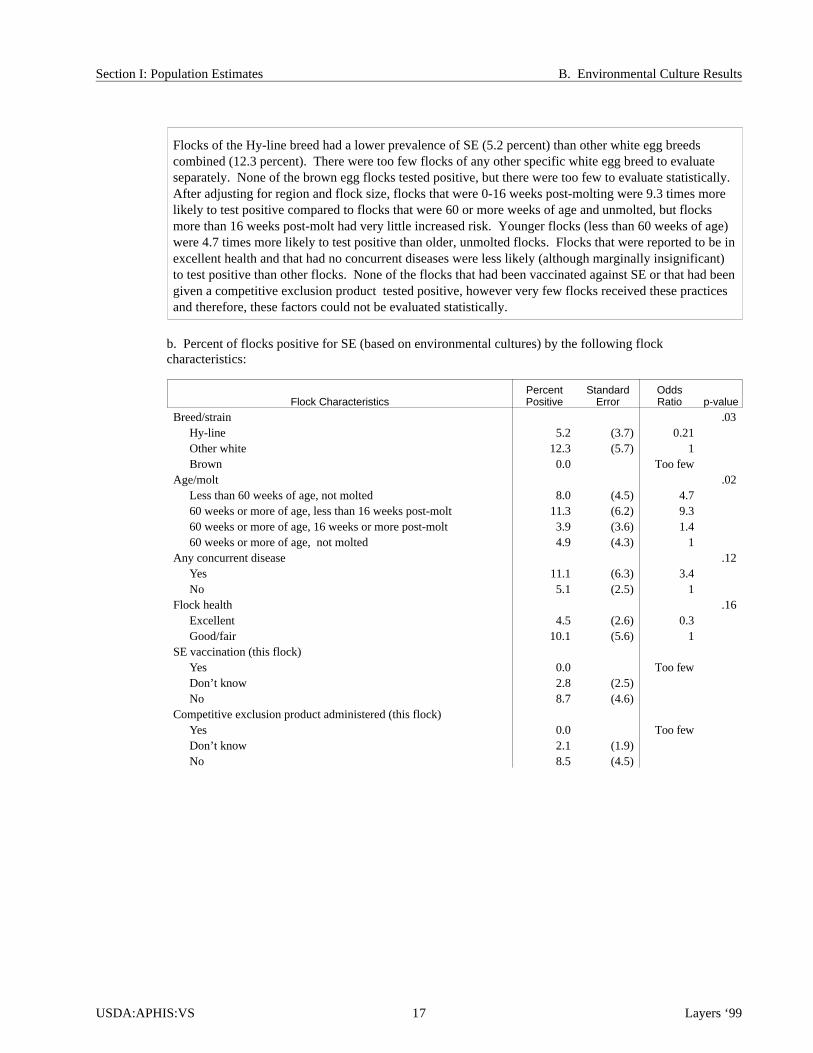
Flocks of the Hy -line breed had a lower preva lence of SE (5.2 per cent) than other white egg breedscom bined (12.3 per cent). There were too few flocks of any other spe cific white egg breed to evalu atesepa rately. None of the brown egg flocks tested posi tive, but there were too few to evalu ate sta tis ti cally.Af ter ad just ing for re gion and flock size, flocks that were 0-16 weeks post-molt ing were 9.3 times morelikely to test posi tive com pared to flocks that were 60 or more weeks of age and un molted, but flocksmore than 16 weeks post- molt had very lit tle in creased risk. Younger flocks (less than 60 weeks of age)were 4.7 times more likely to test posi tive than older, un molted flocks. Flocks that were re ported to be in ex cel lent health and that had no con cur rent dis eases were less likely (al though mar gin ally in sig nifi cant)to test posi tive than other flocks. None of the flocks that had been vac ci nated against SE or that had been given a com peti tive ex clu sion prod uct tested posi tive, how ever very few flocks re ceived these prac ticesand there fore, these fac tors could not be evalu ated sta tis ti cally.
b. Percent of flocks positive for SE (based on environmental cultures) by the following flockcharacteristics:
Flock CharacteristicsPer centPositive
Stan dardEr ror
OddsRatio p- value
Breed/strain .03Hy-line 5.2 (3.7) 0.21Other white 12.3 (5.7) 1Brown 0.0 Too few
Age/molt .02Less than 60 weeks of age, not molted 8.0 (4.5) 4.760 weeks or more of age, less than 16 weeks post-molt 11.3 (6.2) 9.360 weeks or more of age, 16 weeks or more post-molt 3.9 (3.6) 1.460 weeks or more of age, not molted 4.9 (4.3) 1
Any concurrent disease .12Yes 11.1 (6.3) 3.4No 5.1 (2.5) 1
Flock health .16Excellent 4.5 (2.6) 0.3Good/fair 10.1 (5.6) 1
SE vaccination (this flock)Yes 0.0 Too fewDon’t know 2.8 (2.5)No 8.7 (4.6)
Competitive exclusion product administered (this flock)Yes 0.0 Too fewDon’t know 2.1 (1.9)No 8.5 (4.5)
USDA:APHIS:VS 17 Layers ‘99
Sec tion I: Popu la tion Es ti mates B. Environmental Culture Results
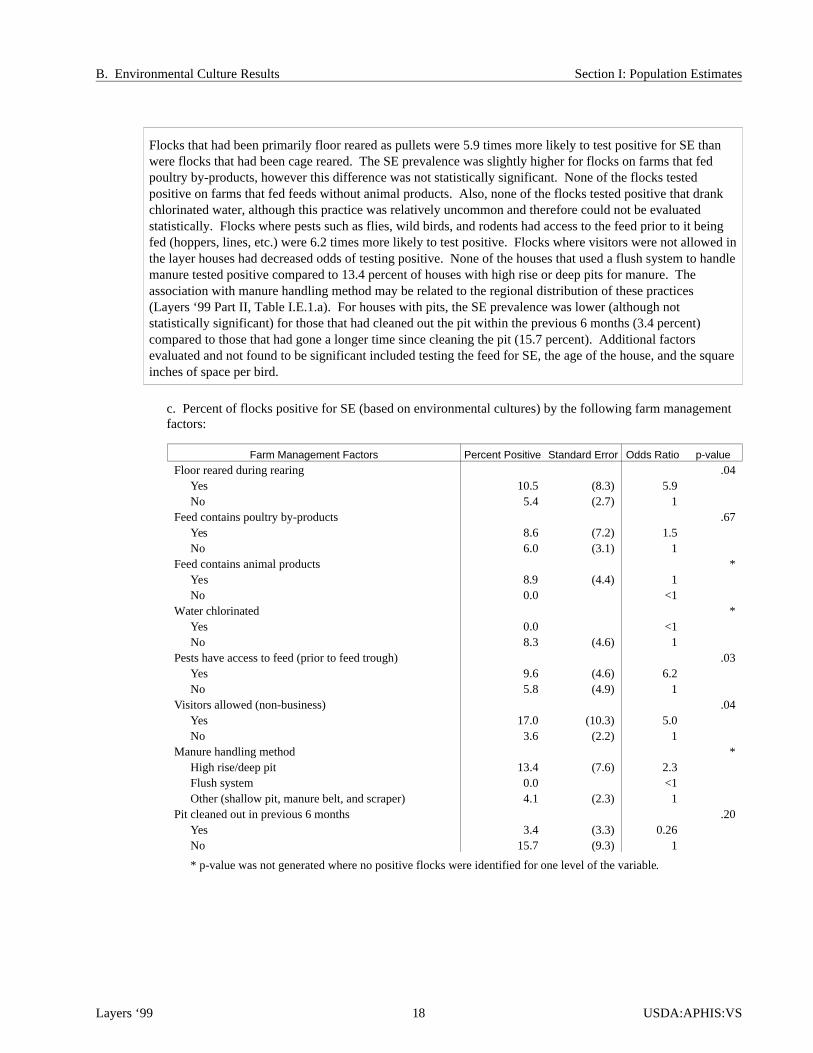
Flocks that had been pri mar ily floor reared as pul lets were 5.9 times more likely to test posi tive for SE thanwere flocks that had been cage reared. The SE preva lence was slightly higher for flocks on farms that fedpoul try by- products, how ever this dif fer ence was not sta tis ti cally sig nifi cant. None of the flocks testedposi tive on farms that fed feeds with out ani mal prod ucts. Also, none of the flocks tested posi tive that drankchlo rin ated wa ter, al though this prac tice was rela tively un com mon and there fore could not be evalu atedsta tis ti cally. Flocks where pests such as flies, wild birds, and ro dents had ac cess to the feed prior to it be ingfed (hop pers, lines, etc.) were 6.2 times more likely to test posi tive. Flocks where visi tors were not al lowed in the layer houses had de creased odds of test ing posi tive. None of the houses that used a flush sys tem to han dle ma nure tested posi tive com pared to 13.4 per cent of houses with high rise or deep pits for ma nure. Theas so cia tion with ma nure han dling method may be re lated to the re gional dis tri bu tion of these prac tices(Lay ers ‘99 Part II, Ta ble I.E.1.a). For houses with pits, the SE preva lence was lower (al though notsta tis ti cally sig nifi cant) for those that had cleaned out the pit within the pre vi ous 6 months (3.4 per cent)com pared to those that had gone a longer time since clean ing the pit (15.7 per cent). Ad di tional fac tors evalu ated and not found to be sig nifi cant in cluded test ing the feed for SE, the age of the house, and the square inches of space per bird.
c. Percent of flocks positive for SE (based on environmental cultures) by the following farm managementfactors:
Farm Man age ment Factors Per cent Positive Stan dard Er ror Odds Ratio p- value
Floor reared during rearing .04Yes 10.5 (8.3) 5.9No 5.4 (2.7) 1
Feed contains poultry by-products .67Yes 8.6 (7.2) 1.5No 6.0 (3.1) 1
Feed contains animal products *Yes 8.9 (4.4) 1No 0.0 <1
Water chlorinated *Yes 0.0 <1No 8.3 (4.6) 1
Pests have access to feed (prior to feed trough) .03Yes 9.6 (4.6) 6.2No 5.8 (4.9) 1
Visitors allowed (non-business) .04Yes 17.0 (10.3) 5.0No 3.6 (2.2) 1
Manure handling method *High rise/deep pit 13.4 (7.6) 2.3Flush system 0.0 <1Other (shallow pit, manure belt, and scraper) 4.1 (2.3) 1
Pit cleaned out in previous 6 months .20Yes 3.4 (3.3) 0.26No 15.7 (9.3) 1
* p-value was not generated where no positive flocks were identified for one level of the variable.
Layers ‘99 18 USDA:APHIS:VS
B. Environmental Culture Results Sec tion I: Popu la tion Es ti mates

None of the houses tested posi tive for SE on farms where the feed ers or hop pers were cleaned anddis in fected be tween each flock. Also, no houses tested posi tive where cages, walls, and ceil ings werewashed be tween each flock, whether or not they were fu mi gated. Houses that only fu mi gated be tweeneach flock had a lower preva lence of SE than houses that nei ther fu mi gated nor washed. A re duced riskwas not iden ti fied in this study for dry clean ing cages and walls or for clean ing egg belts and ele va tors.
d. Percent of flocks positive for SE (based on environmental cultures) by the following cleaning anddisinfecting practices:
Clean ing and Dis in fect ing (Between Each Flock) (V73a-t) Per cent Positive Stan dard Er ror Odds Ratio p- value
Feeders *
Yes 0.0 <1
No 11.2 (5.3) 1
Hoppers *
Yes 0.0 <1
No 10.1 (4.9) 1
Cages, walls, ceiling *
Wash and fumigate 0.0 <1
Wash only 0.0 <1
Fumigate only 5.3 (3.2) 1
Neither 12.2 (6.5) 3.2
* p-value was not generated where no positive flocks were identified for one level of the variable.
USDA:APHIS:VS 19 Layers ‘99
Sec tion I: Popu la tion Es ti mates

C. Mouse Culture Results
Be cause farms par tici pat ing in ro dent trap ping were part of a con ven ience sam ple sub set of the larger,Phase I sam ple, analy sis was not weighted. To op ti mize re gional rep re sen ta tion, the number of housestargeted to par tici pate in each re gion was roughly pro por tional to the size of the in dus try in that re gion.
1. De scrip tive results
Over all, 3.7 per cent of house mice cul tured were posi tive for SE. None of the mice col lected from theSouth east re gion were posi tive. The Great Lakes re gion had the high est SE preva lence in mice (7.3per cent). This re gional distribution in mice was roughly con sis tent with the en vi ron mental re sults (seeTa ble I.B.1.a).
a. Percent of house mice culture positive for SE by region:
Per cent Mice by Region
Great Lakes Southeast Central West All Regions
Percent Percent Per ce nt Per ce nt Per ce nt
7.3 0.0 2.3 3.7 3.7
Layers ‘99 20 USDA:APHIS:VS
C. Mouse Culture Results Sec tion I: Popu la tion Es ti mates
3.7 2.37.3
03.74.4
9
17.2
0
7.1
West Central Great Lakes Southeast All Farm Sites
Region
0
10
20
30
40
50
Percent
Houses Mice
West
Central
Southeast
Great Lakes
Percent Layer Houses with at Least One Environmental Culture Positive and Percent Mice Culture Positive for SE
by Region
#4325

Be cause the ro dent data analy sis was un weighted, a stan dard er ror was not cal cu lated. In or der to putsome bounds on the es ti mates, like li hood analy sis was per formed. This analy sis gives a prob abil itydis tri bu tion for the es ti mates, i.e. the graph below shows the prob abil ity of ob tain ing the re sults in ourdata if the true preva lence were at vari ous lev els. It shows the pos si ble true preva lence in mice in theWest re gion was a fairly nar row range around the es ti mate (3.7 per cent), whereas the es ti mate for theGreat Lakes re gion (7.3 percent) had a much wider pos si ble range. The prob abil ity of ob tain ing ourre sults (no posi tive mice) in the South east re gion peaked at a true preva lence of 0 percent, and theprob abil ity of ob tain ing this re sult de creased with a true preva lence greater than 0 percent.
b. Probability distribution of SE prevalence in house mice by region:
USDA:APHIS:VS 21 Layers ‘99
Sec tion I: Popu la tion Es ti mates C. Mouse Culture Results
0
0.01
0.02
0.03
0.04
0.05
0.06
0.07
0.08
0.0% 5.0% 10.0% 15.0% 20.0%
Prevalence
Great Lakes Southeast Central Western Total
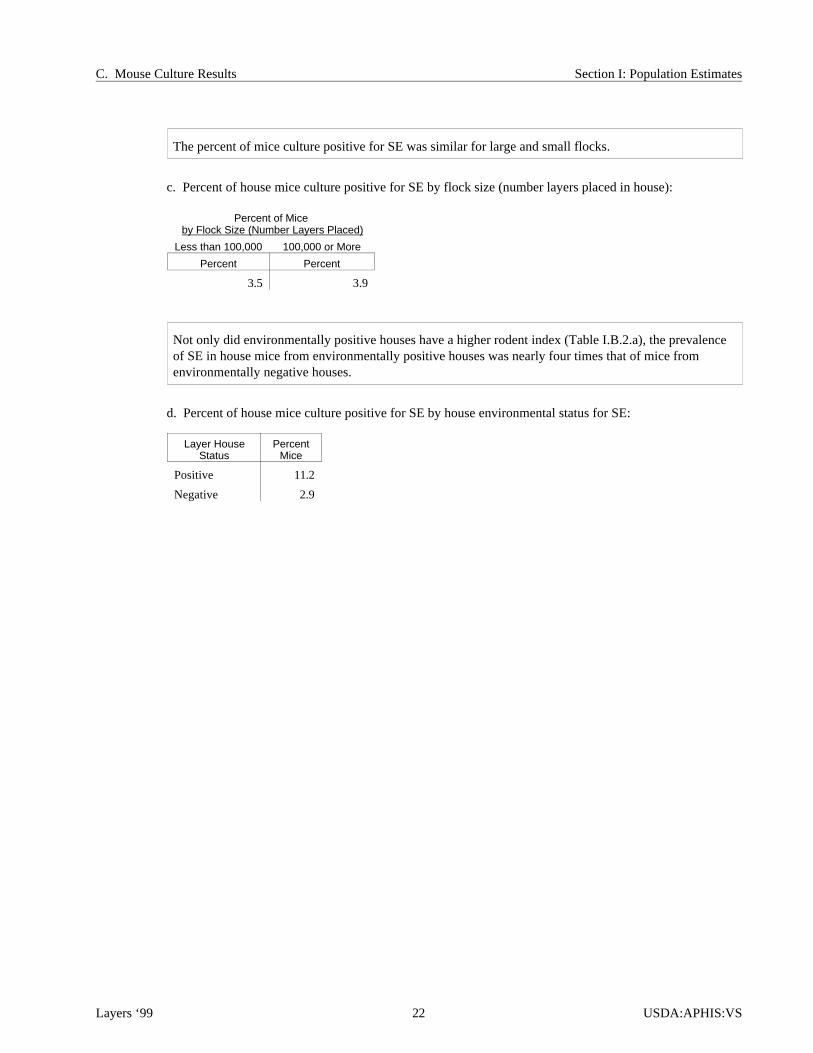
The per cent of mice cul ture posi tive for SE was simi lar for large and small flocks.
c. Percent of house mice culture positive for SE by flock size (number layers placed in house):
Per cent of Mice by Flock Size (Num ber Lay ers Placed)
Less than 100,000 100,000 or More
Percent Percent
3.5 3.9
Not only did en vi ron men tally posi tive houses have a higher ro dent in dex (Table I.B.2.a), the preva lenceof SE in house mice from en vi ron men tally posi tive houses was nearly four times that of mice fromen vi ron men tally nega tive houses.
d. Percent of house mice culture positive for SE by house environmental status for SE:
Layer HouseStatus
Per centMice
Positive 11.2
Negative 2.9
Layers ‘99 22 USDA:APHIS:VS
C. Mouse Culture Results Sec tion I: Popu la tion Es ti mates
D. Egg Yolk Antibody Test
One objective of the Layers ‘99 study was to evaluate the testing of egg yolks for the presence of SEantibodies as a possible tool for monitoring for SE in layer flocks. For the most part, monitoring SEin layer flocks has relied, to date, on bacterial culturing, which is expensive and requires at least 3days to yield results. An inexpensive, more timely alternative was sought. The plan was to determine if egg yolk antibody testing might present a solution as it is economical, fast, and non-invasive tochickens (it relies on collection of eggs).
Previously developed ELISA tests that used flagella antigens were prone to cross-react withantibodies against other Salmonellae found in poultry. Because of that, we chose to go with anexperimental fimbrial antigen ELISA test for the yolk survey with the hope that it would be morespecific for SE antibodies.
For unexplained reasons, the results of the yolk tests using the fimbrial antigen do not appear to becompatible with the SE culture results using proven methods. We believe that until the immunologyof SE is better understood and we have a test available that is proven to be specific for SE antibodies,this egg yolk test with fimbrial antigen will not be an effective monitoring tool for the presence of SEin layer flocks.
USDA:APHIS:VS 23 Layers ‘99
Sec tion I: Popu la tion Es ti mates D. Egg Yolk Antibody Test
Sec tion II: Meth od ol ogyA. Needs assessment
NAHMS was approached by United Egg Producers with a request for a national table egg layer studyaddressing the issue of SE. U.S. Poultry and Egg supported such a project. To further identifyinformation needs, four focus groups were assembled to represent a broad spectrum of informationusers. These focus groups represented researchers/academia, industry, state and federal government,and West coast interests. Conference calls were held to brainstorm potential study topics. Focusgroup members then voted on topics to set the study objectives. Key participants from each focusgroup continued to provide advice on the study objectives and to provide guidance throughout thestudy design, implementation, and analysis. These individuals met twice in person andcommunicated regularly via telephone and e-mail discussions.
B. Sampling and estimation
1. State se lec tion
The goal for NAHMS national studies is to include states that account for at least 70 percent of theanimal and farm population in the U.S. The National Agricultural Statistics Service (NASS) Layersand Egg Production, 1997 Summary (released January 1998) was used to determine state ranking fortable egg layers. All states with 4.0 percent or more of the U.S. table egg layers were included in thestudy. In addition, five states were added to provide better geographic coverage (Missouri,Washington, North Carolina, Arkansas, Alabama), resulting in a total of 15 states participating,representing 82 percent of 1997 U.S. table egg layers. NASS does not publish the total number oflayer farms (some data were received from the 1992 Census of Agriculture), and therefore, number of layer farms per state did not contribute to state selection for this study.
2. Op era tion se lec tion
NASS maintains a list of all egg-laying operations with 30,000 or more laying hens which is the basis for estimating monthly egg production. An operation may have one farm or multiple farms. Farmsfrom multiple-farm operations may be company owned or contract farms. The individual farms mayhave fewer than 30,000 layers, but the total layers for all farms associated with a company must equal or exceed 30,000. All operations (companies) that had 30,000 or more laying hens (20 weeks of ageor older) in the 15 selected states were eligible to participate.
3. Farm se lec tion
NASS enumerators made the first personal contact to the operations. Enumerators visited companyheadquarters except for single-farm operations, where the farm was visited. If a company had farmsin more than one state, each state was treated as a separate operation (assigned a unique operationidentification code), and the NASS enumerator contacted the person who reported for the company in that state. The NASS enumerator selected a random sample of farms to participate. All farms wereselected for operations with 10 or fewer farms. If the operation had 11 to 29 farms, 10 farms wereselected. If there were 30 or more farms, 15 farms were selected.
Layers ‘99 24 USDA:APHIS:VS
A. Needs assessment Sec tion II: Meth od ol ogy
4. Popu la tion in fer ences
All operations (companies) that had 30,000 or more laying hens (20 weeks of age or older) in the 15selected states were eligible to participate in the NAHMS Layers ’99 study. Therefore, theprobability of selection (selection weight) was one for all operations. This selection weight wasadjusted for non-response within state and size group strata. For each participating farm, a farm-level weight was created, equal to the operation weight multiplied by an expansion factor (number of farms in the operation divided by number of the operation’s farms participating). This weight was adjustedagain for non-response at the VS phase.
For the environmental sampling results, the farm level weight was expanded to account for thenumber of houses the farm had versus the number of houses sampled. Be cause farms par tici pat ing inro dent trap ping were part of a con ven ience sam ple sub set of the larger NASS sam ple and to op ti mizere gional rep re sen ta tion, analy sis was not weighted. The number of houses al lowed to par tici pate ineach re gion was roughly pro por tional to the size of the in dus try in that re gion.
C. Data collection
1. Mar ket ing
NASS mailed a pre-survey letter, letters of support from the U.S. Poultry & Egg Association andUnited Egg Producers, and information on the NAHMS Layers ’99 study to each eligible operation(company). Additional information about NAHMS and the Layers ’99 study were delivered at thetime of the first personal contact. Some focus group participants made additional contacts toencourage participation.
2. Phase I: Lay ers Man age ment Re port, Febru ary 1 - 26, 1999
The NASS enumerator administered a Layers Management Report. This questionnaire was limited to items that could more readily be answered by company headquarters than by personnel on farm (e.g.,pullet sources, feed sources). Practices that were expected to be the same on every farm were askedonce of the operation, whereas a separate questionnaire for each farm was completed for thosepractices that may differ among farms. If an operation was willing to continue to the next stage of the study, a consent form was signed. The Layers ’99 Part I report is from this phase of the Layers ’99study.
3. Phase II: Ini tial VS Visit, March 22 - April 30, 1999
Farms for which the operation had signed a consent form were contacted by Veterinary Services (VS)for the second phase (on-farm) of the study. Veterinary Medical Officers (VMO’s) contacted eachfarm for participating operations, explained the program, and administered a questionnaire that couldmost readily be answered by farm personnel (e.g., housing, biosecurity). Although thesequestionnaires were scheduled to be completed by April 30, some states were given an extension inorder to increase the number of participants. The last questionnaire was completed July 14, 1999.Layers ’99 Part II reports results of this phase of the Layers ’99 study.
4. En vi ron men tal sam pling, May 3 - Septem ber 30, 1999
Environmental culturing was offered to all farms. One house per farm was randomly selected forculturing. On a few large farms, more than one house was selected. Samples were collected fromsurfaces throughout the house including manure (five samples per house), egg belts (five samples per
USDA:APHIS:VS 25 Layers ‘99
Sec tion II: Meth od ol ogy C. Data collection
house), elevators (five samples per house), and walkways (two samples per house). If the house didnot have egg belts or elevators, then 10 samples were collected from cage floors. Each sampleconsisted of two swabs. Samples were placed in whirl-pak bags containing skim milk, and shippedovernight on ice to the Agriculture Research Service in Athens, GA, for culture and serogrouping.Group D isolates were then sent to National Veterinary Services Laboratories (NVSL) in Ames, IA,for serotyping. Information about the flocks and houses being sampled was recorded on a ClinicalEvaluation Record.
5. Ro dent col lec tion
Rodent collection was offered to 150 farms that also participated in environmental sampling. Twelvetraps were placed per house. VMO’s returned 4 to 7 days later to count the number of rodents caught. Rodents were euthanized using dry ice. House mice (mus musculus) were placed in large whirl-pakbags and shipped overnight on ice to NVSL for culture of internal organs. Other species (e.g., deermice) were not tested because of human safety concerns due to the association with hantavirus. Up to five mice were cultured together as a pool. The number of rodents trapped, number submitted, traplocation, and whether the trap had functioned properly were recorded on a rodent submission form.
6. Egg yolk anti body
Egg yolk antibody testing was offered to 100 farms that also participated in environmental samplingand rodent collection. There were 150 eggs collected per farm. The egg yolks were aspirated fromthe eggs and shipped overnight on ice to the University of Minnesota for testing for presence ofantibody to SE. An ELISA test using the SF14 fimbrial antigen was performed. (See Section I.D foradditional information.)
D. Data analysis
1. Ed it ing and es ti ma tion
Initial data entry and editing for the Layers ’99 Part I report were performed in each individual NASS state office. Data were entered into a SAS data set. NAHMS personnel performed additional dataedits on the entire data set after data from all states were combined.
Data entry and editing for Part II were done by the NAHMS national staff in Fort Collins, CO. VSfield staff followed up with producers where necessary. Summarization and estimation forquestionnaire data and environmental sampling results were performed by NAHMS national staffusing SUDAAN software. Odds ratios and p-values were obtained by modeling each variable usinglogistic regression. Region and flock size were included as covariates to adjust for the confoundinginfluence of these variables.
Standardized rodent index was calculated as# rodents trapped * 7/# days * 12/# functional traps
so that all houses were standardized to the equivalent of having 12 traps function for 7 days. SEprevalence in mice was estimated using previously described methods for prevalence estimation from pooled samples.1 Rodent culture results were summarized using SAS software. Likelihood analysismodeling of rodent culture results by region was performed using @Risk software.
Layers ‘99 26 USDA:APHIS:VS
D. Data analysis Sec tion II: Meth od ol ogy
1 Sacks JM, Bolin SR, Crowder SV. Prevalence estimation from pooled samples. Am J Vet Res 1989; 50:205-206.
2. Re sponse rates
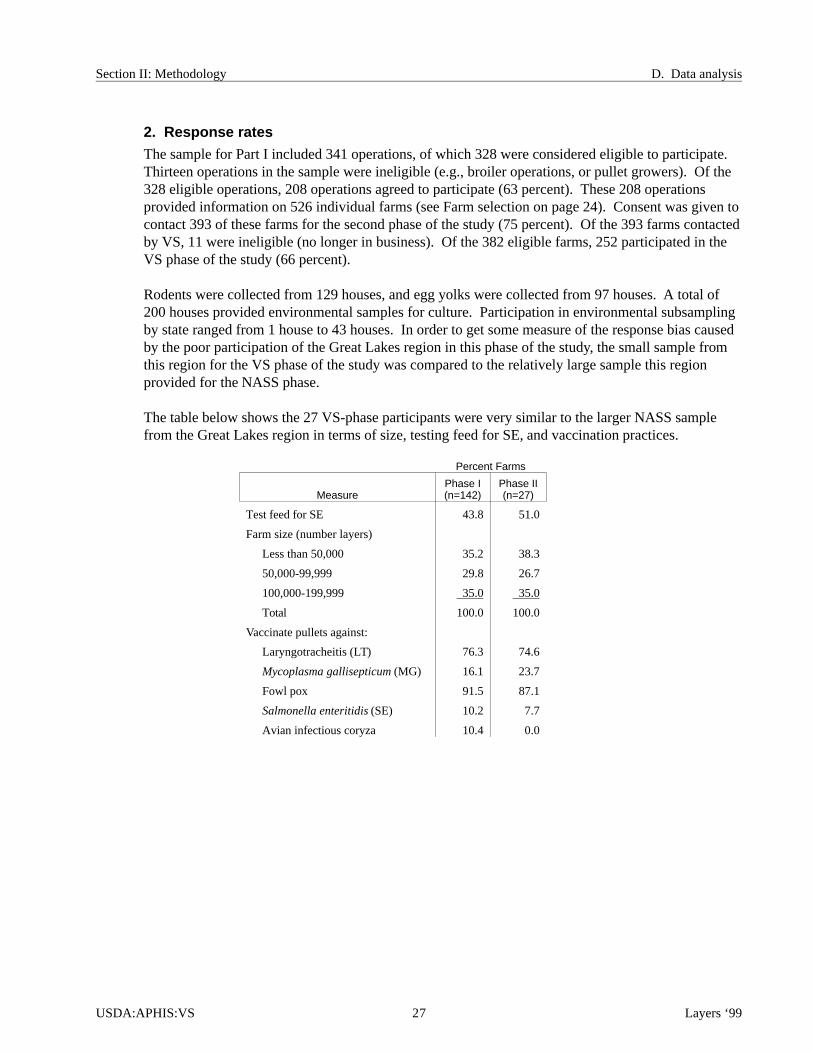
The sample for Part I included 341 operations, of which 328 were considered eligible to participate.Thirteen operations in the sample were ineligible (e.g., broiler operations, or pullet growers). Of the328 eligible operations, 208 operations agreed to participate (63 percent). These 208 operationsprovided information on 526 individual farms (see Farm selection on page 24). Consent was given to contact 393 of these farms for the second phase of the study (75 percent). Of the 393 farms contacted by VS, 11 were ineligible (no longer in business). Of the 382 eligible farms, 252 participated in theVS phase of the study (66 percent).
Rodents were collected from 129 houses, and egg yolks were collected from 97 houses. A total of200 houses provided environmental samples for culture. Participation in environmental subsamplingby state ranged from 1 house to 43 houses. In order to get some measure of the response bias causedby the poor participation of the Great Lakes region in this phase of the study, the small sample fromthis region for the VS phase of the study was compared to the relatively large sample this regionprovided for the NASS phase.
The table below shows the 27 VS-phase par tici pants were very simi lar to the larger NASS sam plefrom the Great Lakes re gion in terms of size, test ing feed for SE, and vac ci na tion prac tices.
Per cent Farms
MeasurePhase I(n=142)
Phase II(n=27)
Test feed for SE 43.8 51.0
Farm size (number layers)
Less than 50,000 35.2 38.3
50,000-99,999 29.8 26.7
100,000-199,999 35.0 35.0
Total 100.0 100.0
Vaccinate pullets against:
Laryngotracheitis (LT) 76.3 74.6
Mycoplasma gallisepticum (MG) 16.1 23.7
Fowl pox 91.5 87.1
Salmonella enteritidis (SE) 10.2 7.7
Avian infectious coryza 10.4 0.0
USDA:APHIS:VS 27 Layers ‘99
Sec tion II: Meth od ol ogy D. Data analysis
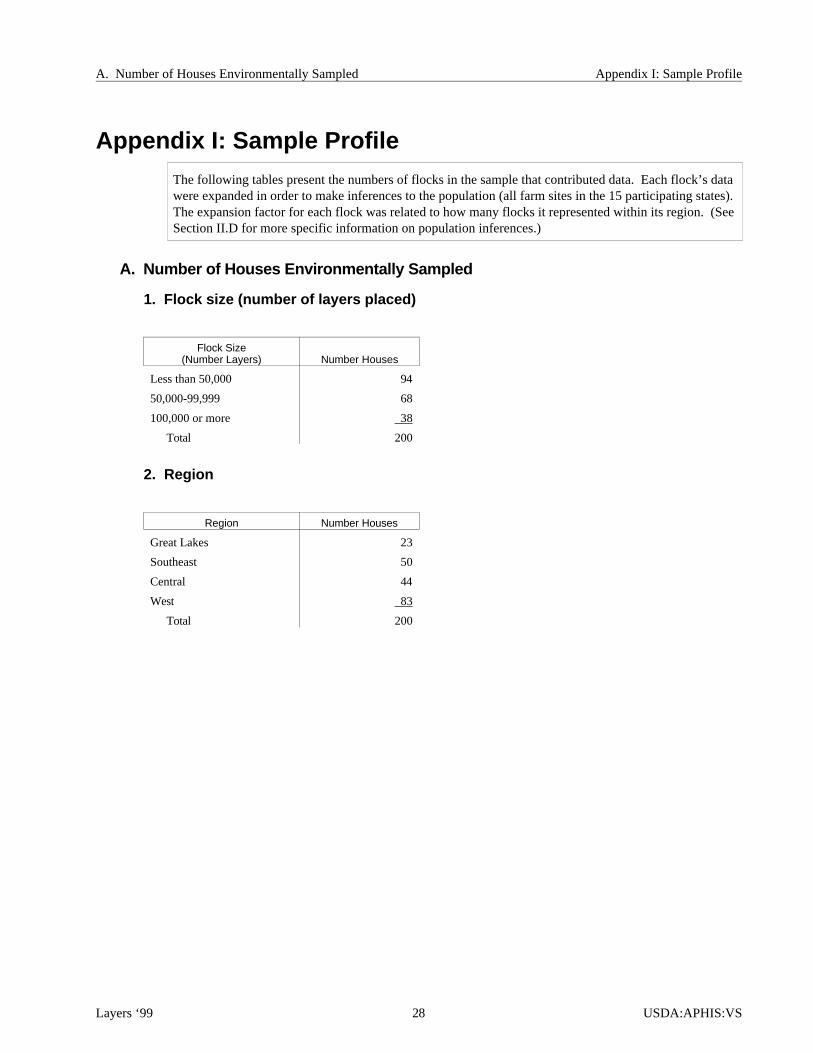
Ap pen dix I: Sam ple Pro fileThe fol low ing ta bles pres ent the num bers of flocks in the sam ple that con trib uted data. Each flock’s datawere ex panded in order to make in fer ences to the popu la tion (all farm sites in the 15 par tici pat ing states). The ex pan sion fac tor for each flock was re lated to how many flocks it rep re sented within its re gion. (See Sec tion II.D for more spe cific in for ma tion on popu la tion inferences.)
A. Number of Houses Environmentally Sampled
1. Flock size (number of layers placed)
Flock Size(Num ber Lay ers) Num ber Houses
Less than 50,000 94
50,000-99,999 68
100,000 or more 38
Total 200
2. Re gion
Region Num ber Houses
Great Lakes 23
Southeast 50
Central 44
West 83
Total 200
Layers ‘99 28 USDA:APHIS:VS
A. Number of Houses Environmentally Sampled Ap pen dix I: Sam ple Pro file

Ap pen dix IIState de part ments of ag ri cul ture are in volved in third- party moni tor ing of qual ity as sur ance plans inAla bama, Cali for nia, Mis souri, Ohio, and Penn syl va nia.
Sev eral states have adapted the United Egg Pro duc ers 5- Star Plan as their state pro gram, while oth ers,such as Cali for nia, have their own plan. Some states have laws that ad dress re frig era tion and car toniden ti fi ca tion. For those states that have laws re gard ing re frig era tion, maximum tem pera tures vary from45- 55° F.
Lay ers ‘99 states by state department of agriculture in volvement in veri fi ca tion (e.g., third party) of a SEqual ity as sur ance plan:
State Yes/No Clarifications
Alabama Yes
Arkansas No
California Yes
Florida No
Georgia No A plan was being developed as of September 2000.
Indiana No
Iowa No
Minnesota No
Missouri YesThe State Veterinarian was prepared, however no producers wereenrolled in third-party verification, as of September 2000.
Nebraska No
North Carolina No
Ohio Yes
Pennsylvania Yes
Texas No
Washington No
USDA:APHIS:VS 29 Layers ‘99
Ap pen dix II A. Number of Houses Environmentally Sampled

Ap pen dix III: U.S. Ta ble Egg Lay ers
Dur ing the Month of De cem ber in Flocks with 30,000 and Above*, 1998 and 1999
Ta ble Egg Layers (Thou sand)
Re gion State De cem ber 1998 De cem ber 1999
Central Arkansas 4,565 5,151
Iowa 24,261 26,399
Minnesota 11,403 12,138
Missouri 5,179 4,724
Nebraska 10,522 11,700
Total 55,930 60,112
Great Lakes Indiana 21,265 22,107
Ohio 29,639 30,778
Pennsylvania 21,389 21,306
Total 72,293 74,191
Southeast Alabama 3,793 3,462
Florida 10,244 10,036
Georgia 11,892 11,800
North Carolina 3,847 3,587
Total 29,776 28,885
West California 25,657 24,282
Texas 13,719 13,830
Washington 4,893 4,616
Total 44,269 42,728
Total (15 states)202,268
(78.6% of US)205,916
(77.9% of US)
Total U.S. (50 states) 257,455 264,441
* There were 263,524,000 table egg layers during December 1998 and 270,367,000 table egg layers during December1999 in flocks of all sizes.
Source: National Agricultural Statistics Service (NASS), Chickens and Eggs, February 22, 2000.
Layers ‘99 30 USDA:APHIS:VS
Ap pen dix III: U.S. Ta ble Egg Lay ers
Out puts and Re lated Study Ob jec tives
1. De scribe base line health and man age ment prac tices used by the U.S. layer in dus try, such asdis posal meth ods for ma nure/waste/dead birds/spent hens, pest con trol (ro dents, birds, flies), molt ingprac tices, vac ci na tion/pre ven tive prac tices, and hous ing/ven ti la tion.
á Part I: Ref er ence of 1999 Ta ble Egg Layer Man age ment in the U.S., October 1999
á Part II: Ref er ence of 1999 Table Egg Layer Man age ment in the U.S., January 2000
2. Es timate the na tional preva lence of Sal mo nella en teritidis in layer flocks by test ing theen vi ron ment and other sources of con tami na tion on layer op era tions.
á Sal mo nella en terica se ro type En ter itidis in Ta ble Egg Layers in the U.S., October 2000
3. Iden tify po ten tial risk fac tors as so ci ated with the pres ence of S. enteri ti dis to sup port anden hance qual ity as sur ance pro grams.
á Sal mo nella en terica se ro type En ter itidis in Ta ble Egg Layers in the U.S., October 2000
4. De scribe bio se cu rity prac tices used in the layer in dus try and how they bene fit flock health.
á Part II: Ref er ence of 1999 Table Egg Layer Man age ment in the U.S., January 2000

Cen ters for Epi de mi ol ogy and Ani mal Health
USDA:APHIS:VS, attn. NAHMS
2150 Centre Ave., Bldg. B, MS 2E7
Fort Col lins, CO 80526-8117
(970) 494-7000
NAHM [email protected]
www.aphis.usda.gov/vs/ceah/cahm
#N333.1000