salary review singapore
DESCRIPTION
This Industry Insight outlines 2012 salary benchmark data for Singapore,across each specialist finance function that Selby Jennings operates within.TRANSCRIPT

A N N U A L S A L A R Y R E V I E W 2 0 1 3

I N T RO D U C T I O N
Selby Jennings Ltd, is a multi award winning global
recruitment organisation focused on servicing the financial
industry. By breaking down financial markets into individual
niches and micro-specialisms, Selby Jennings powers a
knowledge-led model, delivering global solutions into local
markets.
As part of our effort to pride ourselves as being finance
specialists, our consultants proactively generate market
reports for our niche areas in order for our clients to build
understanding of how the market is moving and where
the trends are heading. We hope this will provide valuable
market intelligence to clients who are looking to recruit
more professionals in these areas for this year.
This is 2012 data of the market salaries paid out in each
finance function that Selby Jennings operates in.
Each senior specialist consultant for each area joined in
a panel study to conduct this research. The sample size
for each function was a list of 50 companies who have
declared their full year 2012 payouts (in whichever year
end they follow).
The front office roles are an average of Tier 1 institutions
of business size more than USD 10 BN. The middle to
back office roles are an average of Tier 1 (business size
more than AUM USD 10 BN) and upper Tier 2 institutions
(AUM USD 4 – 9.9 BN).
This is an effort to re-enforce our specialism in our verticals.
If you have any feedback or questions on this report, please
do not hesitate to contact us.
MARKET SALARY REVIEW

R E S E A R C H / S T R AT E G YResearch/Strategy Years of
experienceAnnual Base Salary Range (USD)
Median Annual Base Salary (USD)
Bonus Range
Managing Director above 15 400,000 - 500,000 450,000 100 - 150%
*Executive Director 12 to 15 350,000 - 400,000 375,000 50 - 100%
*Director 10 to 12 300,000 - 350,000 325,000 50 - 100%
Associate Director 5 to 10 200,000 - 300,000 250,000 50 - 100%
Associate 3 to 5 150,000 - 200,000 175,000 0 - 100%
Analyst 1 to 3 100,000 - 150,000 125,000 0 - 50%
*Sometimes this level no longer exists - it is either Director or Executive Director
R I S K M A N AG E M E N TRisk Management Years of experience Annual Base Salary
Range (USD)Median Annual Base Salary (USD)
Bonus Range
Executive Director above 15 years above 230,000 250,000 0 - 100%
Director 10 to 15 years 150,000 - 230,000 190,000 0 - 70%
VP 8 to 10 years 100,000 - 150,000 125,000 0 - 50%
AVP 5 to 8 years 60,000 - 100,000 80,000 0 - 30%
Associate 3 to 4 years 45,000 - 60,000 52,500 0 - 30%
Analyst 1 to 2 years 30,000 - 45,000 37,500 0 - 30%

I N V E S TO R R E L AT I O N SInvestor Relations Years of experience Annual Base Salary
Range (USD)Median Annual Base Salary (USD)
Bonus Range*
Head (Managing Director)
above 15 years 150,000 - 200,000 175,000 100 - 300%
Director (Senior Manager)
8 to 15 years 120,000 - 150,000 135,000 100 - 200%
Manager 5 to 8 years 100,000 - 120,000 110,000 50 - 150%
Associate 3 to 5 years 80,000 - 100,000 90,000 50 - 100%
Analyst 1 to 3 years 50,000 - 80,000 65,000 0 - 50%
*Bonuses are year to date performance and they usually get a cut of the client that they bring in, as a result it can be highly variable
O P E R AT I O N SOperations Years of experience Annual Base Salary
Range (USD)Median Annual Base Salary (USD)
Bonus Range
Managing Director above 15 years above 250,000 250,000 50 - 100%
Executive Director 10 to 15 years 150,000 - 250,000 200,000 50 - 100%
Director 8 to 10 years 120,000 - 150,000 135,000 50 - 80%
Associate Director 5 to 8 years 80,000 - 120,000 100,000 30 - 70%
Associate 3 to 4 years 60,000 - 80,000 70,000 0 - 50%

L E G A L / C O M P L I A N C ELegal/Compliance Years of experience Annual Base Salary
Range (USD)Median Annual Base Salary (USD)
Bonus range
Executive Director above 15 years above 210,000 210,000 0 - 100%
Director 10 to 15 years 140,000 - 210,000 175,000 0 - 70%
VP 8 to 10 years 100,000 - 140,000 120,000 0 - 50%
AVP 5 to 8 years 55,000 - 100,000 77,500 0 - 30%
Associate 3 to 4 years 45,000 - 55,000 50,000 0 - 30%
F I N A N C E / AC C O U N T SFinance / Accounts Years of experience Annual Base Salary
Range (USD)Median Annual Base Salary (USD)
Bonus Range
Managing Director above 15 years above 250,000 250,000 50 - 100%
Executive Director 10 to 15 years 150,000 - 250,000 200,000 50 - 100%
Director 8 to 10 years 120,000 - 150,000 135,000 50 - 80%
Associate Director 5 to 8 years 80,000 - 120,000 100,000 30 - 70%
Associate 3 to 4 years 60,000 - 80,000 70,000 0 - 50%
Analyst 1 to 2 years 50,000 - 60,000 550,000 0 - 50%

P R I VAT E E QU I T Y F RO N T O F F I C EPrivate Equity Front Office
Years of experience Annual Base Salary Range (USD)
Median Annual Base Salary (USD)
Bonus Range
Managing Director above 15 350,000 - 400,000 375,000 100 - 150%
Executive Director 12 to 15 300,000 - 350,000 325,000 100 - 120%
Director 10 to 12 250,000 - 300,000 275,000 80 - 100%
Associate Director 6 to 10 180,000 - 250,000 215,000 50 - 100%
Associate 3 to 6 120,000 - 180,000 150,000 30 - 100%
Analyst 1 to 3 90,000 - 120,000 105,000 30 - 50%
M AC RO H F P O RT F O L I O M A N AG E RMacro HF Portfolio Manager
Years of experience Annual Base Salary Range (USD)
Median Annual Base Salary (USD)
Bonus Range
Managing Director above 15 400,000 - 500,000 450,000 100 - 300%
Executive Director 12 to 15 350,000 - 400,000 375,000 100 - 200%
Director 10 to 12 300,000 - 350,000 325,000 100 - 150%
Associate Director 6 to 10 200,000 - 300,000 250,000 80 - 150%
Associate 3 to 6 150,000 - 200,000 175,000 50 - 100%
Analyst 1 to 3 100,000 - 150,000 125,000 30 - 100%
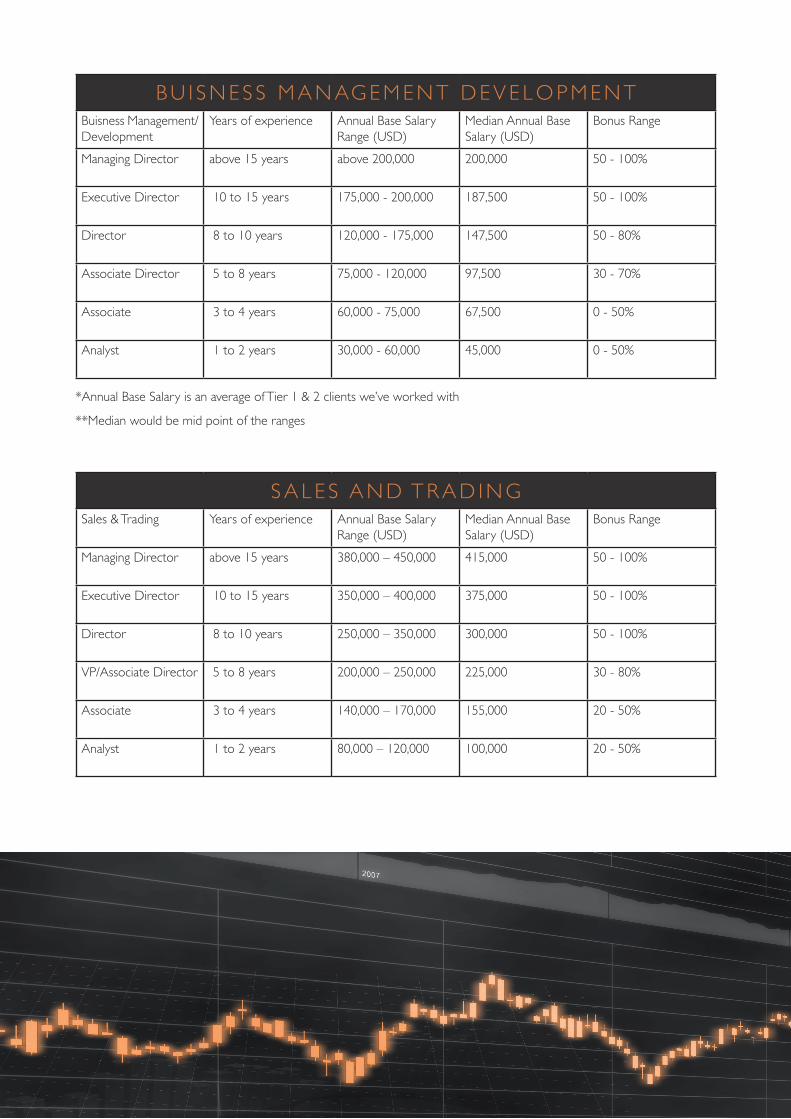
B U I S N E S S M A N AG E M E N T D E V E L O P M E N TBuisness Management/Development
Years of experience Annual Base Salary Range (USD)
Median Annual Base Salary (USD)
Bonus Range
Managing Director above 15 years above 200,000 200,000 50 - 100%
Executive Director 10 to 15 years 175,000 - 200,000 187,500 50 - 100%
Director 8 to 10 years 120,000 - 175,000 147,500 50 - 80%
Associate Director 5 to 8 years 75,000 - 120,000 97,500 30 - 70%
Associate 3 to 4 years 60,000 - 75,000 67,500 0 - 50%
Analyst 1 to 2 years 30,000 - 60,000 45,000 0 - 50%
*Annual Base Salary is an average of Tier 1 & 2 clients we’ve worked with
**Median would be mid point of the ranges
S A L E S A N D T R A D I N GSales & Trading Years of experience Annual Base Salary
Range (USD)Median Annual Base Salary (USD)
Bonus Range
Managing Director above 15 years 380,000 – 450,000 415,000 50 - 100%
Executive Director 10 to 15 years 350,000 – 400,000 375,000 50 - 100%
Director 8 to 10 years 250,000 – 350,000 300,000 50 - 100%
VP/Associate Director 5 to 8 years 200,000 – 250,000 225,000 30 - 80%
Associate 3 to 4 years 140,000 – 170,000 155,000 20 - 50%
Analyst 1 to 2 years 80,000 – 120,000 100,000 20 - 50%

SINGAPORE
3 Church Street
#09-02
Singapore, 049483
T +65 6589 4458
LONDON
33 King William Street
8th Floor
London, EC4R 9AS
T +44 (0)207 019 4100
NEW YORK
245 Park Avenue
39th Floor
New York, NY 10167
T +1 212 209 7310
ZURICH
(Schweiz) GmbH,
Stockerhof
Dreikoenigstrasse 31A
8002 Zurich
T 41 44 2083 680
www.selbyjennings.com
In Switzerland Selby Jennings operates as a trading style of Phaidon Capital (Schweiz) GmbH