sales(final rpt)
TRANSCRIPT

8/8/2019 Sales(Final Rpt)
http://slidepdf.com/reader/full/salesfinal-rpt 1/84
TABLE OF CONTENTS
SECTIONS
• Introduction.
o Objectives of the Project.
• System Analysis
o Identification Of The Need
o Preliminary Investigation
o Feasibility Study
Technical Feasibility
Economical Feasibility
Operational Feasibility
• Software Requirement Specification
• Design
o Data Flow Diagram (DFD)
o Menu Flow Diagram
o Database Design
• Screens & Validation Checks
• Reports
• Coding
• Limitations
• Bibliography

8/8/2019 Sales(Final Rpt)
http://slidepdf.com/reader/full/salesfinal-rpt 2/84

8/8/2019 Sales(Final Rpt)
http://slidepdf.com/reader/full/salesfinal-rpt 3/84
OBJECTIVES OF THE PROJECT
SALES MONITORING
Introduction:
There is a company manufacturing electronic items for selling. Very frequently they haveto do sales analysis, product analysis and salesman analysis.
Objective:
This project does the complete automation of sales monitoringsystem .It Maintain Item Detail ie. Which Items are available and inhow much Quantity . The Salesman Records are maintained and theirperformance is measured . Reports generated shows clewr picture of ongoing business , the reports shows analysis of Sales and analysis of Salesman Performance .
Key feature of the System : -
Software keeps track of :-
0 First block keeps a track of all the Sales Man and Items
1 Second block keeps a track of all the Sales Order and Item Details
2 Third block keeps a track of Report generation

8/8/2019 Sales(Final Rpt)
http://slidepdf.com/reader/full/salesfinal-rpt 4/84
SECTION 2
SYSTEM ANALYSIS
2.1 Identification Of The Need
2.2 Preliminary Investigation
2.3 Feasibility Study
2.3.1 Technical Feasibility
2.3.2 Economical Feasibility
2.3.3 Operational Feasibility
SYSTEM ANALYSIS

8/8/2019 Sales(Final Rpt)
http://slidepdf.com/reader/full/salesfinal-rpt 5/84
Identification of Need:
This step is initiation of System Analysis. An overview of the client’s requirement has
been done. The basic need of the client to opt for such kind of project is analyzed.
As per current marketing scenario, an entire system was required to track day-to-day
transactions, alarming for stock and defaulters, and timely generation of reports is the
basic features of this project.
Preliminary Investigation:
The have to keep records of their employee details, their payment details, advance
payment details.
Different Modules In Computerized System:
Module 1: Item Module
In this module, Member enters a password and the software checks its
validity. If the password is valid then he is allowed to enter, otherwise “Invalid
User/Password” message is displayed. Different data access rights areassigned to different users. A new member can also be registered in this
module. Proper database of all the Items Available is maintained including
their Name, Rate and quantity in hand.
Module 2 Sales Man Module
In this module database of all the Salesman of companies, their joining dateis maintained
Module 3 Sales Module

8/8/2019 Sales(Final Rpt)
http://slidepdf.com/reader/full/salesfinal-rpt 6/84
This module takes care of Sales Order generation of each sale, thesalesman which has done the sale and the Item sold is recorded.
Module 4 Report Generation
In this section administrator can view all the reports related to sales
analysis and Salesman analysis.
Feasibility Study:
Depending on the results of the initial investigation, the survey is expanded to a
more detailed feasibility study. Feasibility study is a test of system proposal
according to its workability, impact on the organization, ability to meet user
needs, and effective use of resources.
The objective of the feasibility study is not to solve the problem but to acquire
a sense of its scope . During the study, the problem definition is crystallized and
aspects of the problem to be included in the system are determined.
Consequently, costs and benefits are described with greater accuracy at this
stage.
It consists of the following:
1. Statement of the problem: A carefully worded statement of the
problem that led to analysis.
2. Summary of finding and recommendations: A list of the major
findings and recommendations of the study. It is ideal for the user who requires
quick access to the results of the analysis of the system under study.

8/8/2019 Sales(Final Rpt)
http://slidepdf.com/reader/full/salesfinal-rpt 7/84
Conclusion are stated , followed by a list of the recommendation and a
justification for them .
3. Details of findings : An outline of the methods and procedures under-
taken by the existing system, followed by coverage of the objectives and
procedures of the candidate system. Included are also discussions of output
reports, file structures, and costs and benefits of the candidate system.
4. Recommendations and conclusions: Specific recommendations
regarding the candidate system, including personnel assignments, costs, project
schedules, and target dates.
1) Technical Feasibility:
This involves financial considerations to accomodate technical enhancements. If
the budget is a serious constraint, then the project is judged not feasible. In the
proposed system only the cost of developing and maintaining the application will
be taken into consideration by the company. There is no need for any special
hardware.
2) Economical Feasibility:
With the help of this application it will lead to decrease in cost of opening and
maintaining offices which will be more than the cost of developing and
maintaining the Application . Lesser manpower is needed to maintain a
application than a branch office which will again lead to decrease in cost.
3) Operational Feseability:
This Application is very easy to operate as it is made user friendly . Main consideration
is user’s easy access to all the functionality of the Application.

8/8/2019 Sales(Final Rpt)
http://slidepdf.com/reader/full/salesfinal-rpt 8/84
SECTION 3
SOFTWARE REQUIREMENT SPECIFICATION

8/8/2019 Sales(Final Rpt)
http://slidepdf.com/reader/full/salesfinal-rpt 9/84
PROJECT PLANNING
I was assigned the duty for developing a computerized system known as “Sales Order
System”. Working in team reinstates the team for some common guidelines and
standard to be followed by all the team members across all team. For the optimum use
of practical time it is necessary that every session is planned. Planning of this project will
include the following things:
0 Topic Understanding.
1 Modular Break –Up Of The System.
2 Processor Logic For Each Module.
3 Database Requirements.
Topic Understanding:
It is vital that the field of application as introduced in the project may be totally a new
field. So as soon as the project was allocated to me, I carefully went through the project
to identify the requirements of the project.
Modular Break –Up Of The System:Identify The Various Modules In The System.
List Them In The Right Hierarchy.
Identify Their Priority Of Development.
Description Of The Modules:
Modules – This project consists of different interfaces which will be accessed through
a MDI (Multiple Document Interface) window. Different modules that
makeup this system are briefly described below:
Module 1: Item Module
In this module, Member enters a password and the software checks its
validity. If the password is valid then he is allowed to enter, otherwise “Invalid

8/8/2019 Sales(Final Rpt)
http://slidepdf.com/reader/full/salesfinal-rpt 10/84
User/Password” message is displayed. Different data access rights are
assigned to different users. A new member can also be registered in this
module. proper database of all the Items Available is maintained including
their Name, Rate and quantity in hand .
Module 2 Sales Man Module
In this module database of all the Salesman of companies, their joining date
is maintained
Module 3 Sales Module
This module take care of Sales Order generation of each sale, thesalesman which has done the sale and the Item sold is recorded .
Module 4 Report Generation
In this section administrator can view all the reports related to sales
analysis and Salesman analysis.
Database Requirements:
Identify The Various Tables Required.
Fields For These Tables.
The Various Key Fields (for example Primary key and Foreign key).

8/8/2019 Sales(Final Rpt)
http://slidepdf.com/reader/full/salesfinal-rpt 11/84
Identify The Various Constraints like Not Null, Unique etc.
Software/Compilers Required Developing This
System:
Software means a collection of program where the objective is to enhance the
capabilities of the hardware machine.
The following paragraph defines the software of the proposed system
development.
Operating System : Win 98
Front end Tool : MS VB 6.0 (Enterprise
Edition)
Data Access Technology : ADO 2.1 (ActiveX Data
Object)
Reports : Data Report
Back end : MS-Access
Hardware Environment
Hardware is the term given to machinery itself and to various individual pieces of
equipment. It refers to the physical devices of a computer system. Thus the input,
storage, processing control and output devices are hardware.
Processor : Pentium-IV

8/8/2019 Sales(Final Rpt)
http://slidepdf.com/reader/full/salesfinal-rpt 12/84
RAM : 128 MB
HDD : 40 GB
FDD : 1.44 MB
CD-ROM : 52 X
Monitor : 14 inches Color Monitor
Keyboard : 104 Keys Keyboards
Printer : HP DeskJet 670 C

8/8/2019 Sales(Final Rpt)
http://slidepdf.com/reader/full/salesfinal-rpt 13/84
SECTION 4
DESIGN
4.1 Data Flow Diagram (DFD)
4.2 E-R Diagram
4.3 Menu Flow Diagram
4.4 Database Design

8/8/2019 Sales(Final Rpt)
http://slidepdf.com/reader/full/salesfinal-rpt 14/84
Analysis and Design:
Menu Flow Diagram
The Entity-Relationship Approach
Main
Master ExitReport
Salesm Item
Sales
SalesAnalysis
SalesMan
Clos

8/8/2019 Sales(Final Rpt)
http://slidepdf.com/reader/full/salesfinal-rpt 15/84
The entity-relationship approach consists of an analytical method and a modeling
technique. The entity-relationship (ER) approach was first described by Dr. Peter Chen
in a paper which appeared in the first issue of the ACM publication, Transactions on
Database Systems in 1976. It is now recognized as one of the most important tools in
the data administration tool kit. It is incorporated in various forms, into all major CASE
tools, and is supported by all dictionaries, repositories and encyclopedias. Properly
understood and used, the ER approach can greatly reduce the time needed during the
analysis phase of the development cycle and at the same time greatly increase both the
accuracy and completeness of that analysis. With only a few exceptions all popular
development methodologies use the ER approach to model data.
Most popular analytical approaches, or methodologies, focus either on the processes
being performed or on data elements presumed to be needed by the user. Some
concentrate on trying to fit lists of data elements into one of the data structure models
which can be implemented by a DBMS, others on designing reports, screens, and files,
and still others on following trails of transactions through the various processing stages.
From these processes, flows, data elements, and/or outputs, they attempt to re-create
the real world. Many attempt to recreate the processes from the desired results.
Each method approaches the data problem differently, and their results, many times,
resemble the results of the blind men who examined the elephant: the one examining
the tail thought it felt like a rope, the one examining the sides thought it felt like a wall,
the one examining its legs thought it felt like a tree, and the one examining its trunk
thought it felt like a snake. In a sense they were all right, but, at the same time, none
was right.

8/8/2019 Sales(Final Rpt)
http://slidepdf.com/reader/full/salesfinal-rpt 16/84

8/8/2019 Sales(Final Rpt)
http://slidepdf.com/reader/full/salesfinal-rpt 17/84
Just as entities are real so are the relationships that exist between them. And as with
entities, the relationships may be well defined in that the firm may know a great deal
about them, or vaguely defined in that the firm may know very little about them, as little
as first knowing or suspecting that they exist.
The power of the ER approach lies in its ability to focus on describing entities of the real
world of the business and the relationships between them. By describing real world
entities through the identification and assignment of attributes to them and their
relationships, the analyst is describing how and why the business operates.
Although the business itself may change, sometimes dramatically, these types of
changes occur much less frequently than changes in the routine processes and
activities. Regardless of how the business changes, the entities of the business rarely
change. What may change, however, is the firm's perception of which attributes of those
entities are currently of interest. Some relationships between these business entities
may also change, but even these relationship changes occur infrequently. Thus by
understanding and properly describing these entities and the relationships between
them, the analyst can form a very stable foundation for understanding and analyzing the
business itself, and for properly recording the results of, or changes caused by, the
processes of the business.
As with any analytical method, the effectiveness of the ER approach is limited, or
constrained, by three factors, all of which have to do with the analyst's understanding of
the business environment. These closely related factors are (1) entity identification, (2)
entity definition, and (3) business context.

8/8/2019 Sales(Final Rpt)
http://slidepdf.com/reader/full/salesfinal-rpt 18/84
Entity identification consists of recognizing the various entities, determining why they are
of interest to the firm, and naming them. The identification process must specify the
entity at the precise level of specificity which ensures that it is not so general as to be
meaningless, and yet not so specific that it fragments into too many subsets. For
example, people as an entity would be too general since it includes both customers and
employees, among others. On the other hand, full-time employees and part-time
employees would be too specific since both are employees and "full-time" and "part-
time" are attributes of employee.
Entity definition consists of identifying which attributes of the identified entities are
needed by the firm and why those attributes are of interest. For example, is the firm
interested in the attribute "hobbies" or "clothing sizes" for the employees? If the firm
deals in sporting goods, the answer to the former might be yes. If the firm provides
uniforms for its employees, the answer to the latter might also be yes.
Business context involves identifying and defining the relationships which exist between
the identified and defined entities, and their relative importance to the firm as a whole
and to each of its specific parts. Business context also involves identifying and defining
the use or role of each entity within the firm. An entity's appearance, role, or use in one
firm may be entirely different in another firm; yet the entity itself is the same.
Just as an entity may have different roles or uses between firms, so also, each part of
the firm may have a different perspective on the business, and, consequently a different
perspective on the entities of the firm. This perspective does not change the fact of the
entity's existence, only the attributes and relationships of those entities which are of
interest to individual portions of the firm and their role or use in that firm.

8/8/2019 Sales(Final Rpt)
http://slidepdf.com/reader/full/salesfinal-rpt 19/84
The specific definitions of these entities and their relationships with other entities within
the firm are relevant only within the context of that firm and are totally dependent upon
the attributes of the entities which are of interest to the firm. An entity within one firm
may be only an attribute of an entity within another firm, and vice versa.
The importance of identification, definition, and context can be seen when one looks at
the formal definitions of the three key elements which form the heart of the ER
approach. These definitions form the basis for both the data analysis method and the
data modeling technique of the entity-relationship approach.
A definition
An entity is defined as a person, place, or thing which (a) is of interest to the corporation,
(b) is capable of being described in real terms, and (c) is relevant within the context of
the specific environment of the firm.
A definition
An attribute is any aspect, quality, characteristic, or descriptor of either an entity or a
relationship. An attribute must also be (a) of interest to the corporation, (b) describable
in real terms, and (c) relevant within the context of the specific environment of the firm.
An attribute must be definable in terms of words or numbers. That is, the attribute must
have one or more data elements associated with it, one of which may be the name of the
entity or relationship. An attribute may describe what the entity looks like, where it is
located, how old it is, how much it weighs, etc. It may describe why a relationship exists,
how long it has existed, how long it will exist, or under what conditions it exists.
A definition

8/8/2019 Sales(Final Rpt)
http://slidepdf.com/reader/full/salesfinal-rpt 20/84
A relationship is any association, linkage, or connection between the entities of interest
to the corporation. These relationships must also be (a) of interest to the corporation, (b)
describable in real terms, and (c) relevant within the context of the specific environment
of the firm.
It is important to note at this point that relationships exist only between entities, not
between attributes of entities. To illustrate,
The entity "person" could be anyone.
When the attributes name, age, and sex are added, we can distinguish men from
women, adults from children, and one person from another.
When the relationships are added, we know whether we are talking about a group of
unrelated people, a family, or a corporation.
Entities and their attributes
To describe an entity, we must describe it in terms of its attributes and its relationships
with other entities. An entity description consists of a series of statements which
complete a phrase such as "the entity is...," "the entity has...," "the entity contains...," or
"the entity does ...."
Each attribute relates to the entity in hierarchic terms, that is, all attributes of the entity
are fully dependent upon the entity itself because individually and together they are the
entity. The question can still be asked, however, "How can we begin to identify these
entities?" Is, for example, the entity identified as customer (representing all customers),
or is it the specific type of customer (such as mail order or retail), or is it a single
customer? The answer is that it can be all of these, none of these, or more than these.

8/8/2019 Sales(Final Rpt)
http://slidepdf.com/reader/full/salesfinal-rpt 21/84
The specific identification of the entity has meaning only within the context of that firm.
However, most businesses can be described using a fairly restricted set of generic entity
types such as customer, product, machine, employee, location, organizational unit, etc.
An entity is whatever the business defines it to be, and that definition must make sense
within the context of the firm. Thus, an entity in one firm may be a subset of entities
included in the entity definition of another firm, or may be the global definition of the
entity used within another firm. These differences in identification can be illustrated by
the following example.
An illustration:
A town planning board, with responsibility for community planning and zoning, would
describe that community in terms of its buildings, and further define those buildings into
residences, offices, stores, warehouses, and factories.
It might be interested in which people or firms occupy or own those buildings, but for
their purposes that information would be an attribute of the building, just as the size of
the building, the number of floors, the number of windows and doors, and the cost of the
building are attributes.
On the other hand, the local tax assessor doing a census or community directory would
be interested in the people who live and work in the community and firms located there.
The assessor would be interested in the names of the people, their incomes, length of
residence, amount of taxes paid, and where they live or are located (the buildings) within
the community. In this case the buildings become attributes of the people.

8/8/2019 Sales(Final Rpt)
http://slidepdf.com/reader/full/salesfinal-rpt 22/84
Neither the buildings nor the people have changed. They both still exist. The
perspective, however, has changed; the things of interest about those buildings and
people have changed.
The town council, would need to know all the information about both the people and the
buildings, along with information about roads, utilities, etc. In this case, both the
buildings and the people become entities in their own right, along with the relationships
between them (who lives or works where, who owns what, and so on).
This need for both attributes and relationships is consistent with the accepted dictionary
definition of an entity : "the fact of existence; being. The existence of something
considered apart from its properties." Thus although the entity exists, its true form and
role are only apparent after its attributes are added.
Without attributes all that is known about the entity is that it exists. The distinction
between an entity and its attributes, and the relationship between an entity and its
attributes, is so important that the ER diagram distinguishes between an entity and its
attributes by using different symbols for each.
The entity-relationship model
The entity-relationship model represents a conceptual view of the world; as such it is
independent of any DBMS or data processing considerations. It is a creature not of data
processing but of the business environment.
Although we speak of an entity as if it were singular, in reality it is that set of persons,
places, or things which have a common name, a common definition, and a common set
of descriptors (properties or attributes).

8/8/2019 Sales(Final Rpt)
http://slidepdf.com/reader/full/salesfinal-rpt 23/84

8/8/2019 Sales(Final Rpt)
http://slidepdf.com/reader/full/salesfinal-rpt 24/84
as there are many different types of vehicles, not all of which are cars (some may be
boats, planes, or trains), so too there are many different types of entities.
A final type of attribute needs to be discussed: attributes which do not describe the thing
itself, but what it does, how it is used, or why it is used. Those things that an entity does
are called activities; collectively they are called processes. The attributes which
describe these entity activities are called processing-related attributes.
The processes, or activities, of the business are in reality the actions that people take
with respect to things, places, or other people. These actions usually result in some
change in the physical appearance, state, or condition of one or more entities, or
sometimes in the creation of a new entity.
E-R Diagram for Sales MonitoringSystem
Sales Monitoring
Has
salesman_code

8/8/2019 Sales(Final Rpt)
http://slidepdf.com/reader/full/salesfinal-rpt 25/84
value_of_sale
DATA FLOW DIAGRAM
Data Flow Diagrams - Introduction
Data flow diagrams can be used to provide a clear representation of any business
function. The technique starts with an overall picture of the business and continues by
analyzing each of the functional areas of interest. This analysis can be carried out to
SalesMan
item_code
item_name
Sells
Item
salesman_name
d_o_j
Sales_Master Item_Detail
Has Has
year_sales
item_rate
QOH
sales_receipt_no
qty_sold
Item_codesalesman_code
sales_receipt_no
sale_date
value_of_sale

8/8/2019 Sales(Final Rpt)
http://slidepdf.com/reader/full/salesfinal-rpt 26/84
precisely the level of detail required. The technique exploits a method called top-down
expansion to conduct the analysis in a targeted way.
The result is a series of diagrams that represent the business activities in a way that is
clear and easy to communicate. A business model comprises one or more data flow
diagrams (also known as business process diagrams). Initially a context diagram is
drawn, which is a simple representation of the entire system under investigation. This is
followed by a level 1 diagram; which provides an overview of the major functional areas
of the business. Don't worry about the symbols at this stage, these are explained shortly.
Using the context diagram together with additional information from the area of interest,
the level 1 diagram can then be drawn.
The level 1 diagram identifies the major business processes at a high level and any of
these processes can then be analyzed further - giving rise to a corresponding level 2
business process diagram. This process of more detailed analysis can then continue –
through level 3, 4 and so on. However, most investigations will stop at level 2 and it is
very unusual to go beyond a level 3 diagram.
Identifying the existing business processes, using a technique like data flow diagrams, is
an essential precursor to business process re-engineering, migration to new technology,
or refinement of an existing business process. However, the level of detail required will
depend on the type of change being considered.
8/8/2019 Sales(Final Rpt)
http://slidepdf.com/reader/full/salesfinal-rpt 27/84
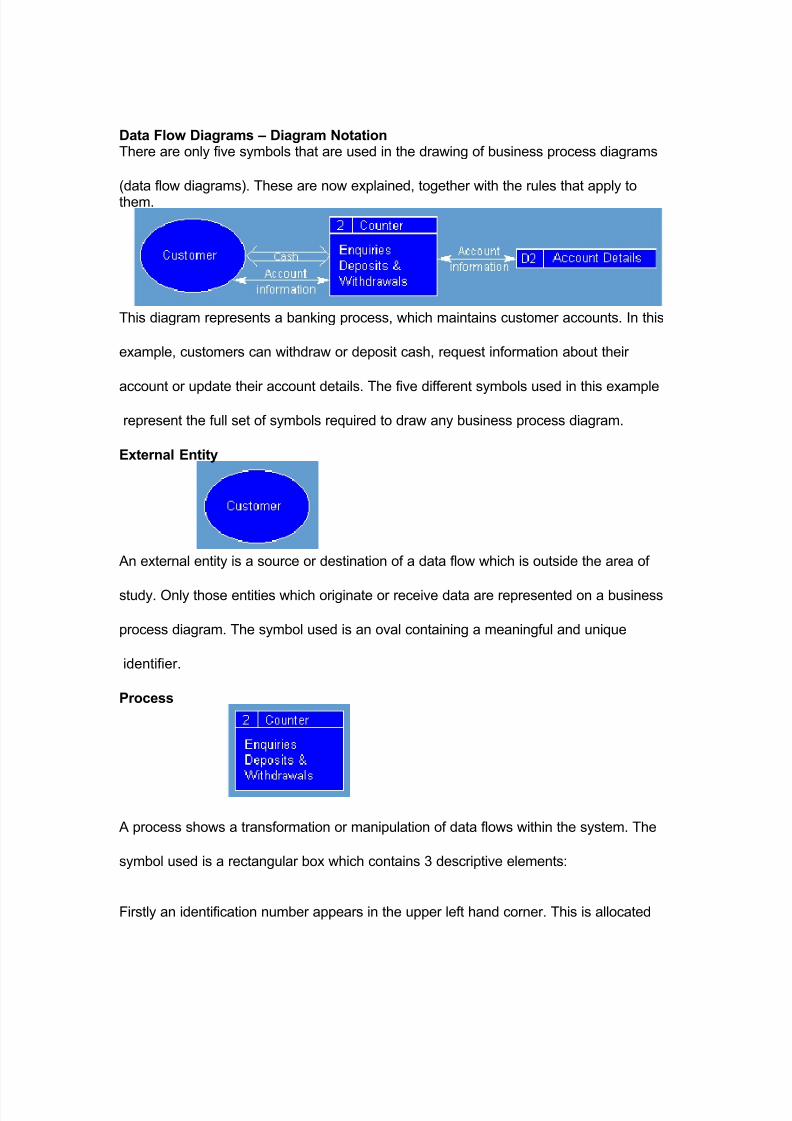
Data Flow Diagrams – Diagram NotationThere are only five symbols that are used in the drawing of business process diagrams
(data flow diagrams). These are now explained, together with the rules that apply tothem.
This diagram represents a banking process, which maintains customer accounts. In this
example, customers can withdraw or deposit cash, request information about their
account or update their account details. The five different symbols used in this example
represent the full set of symbols required to draw any business process diagram.
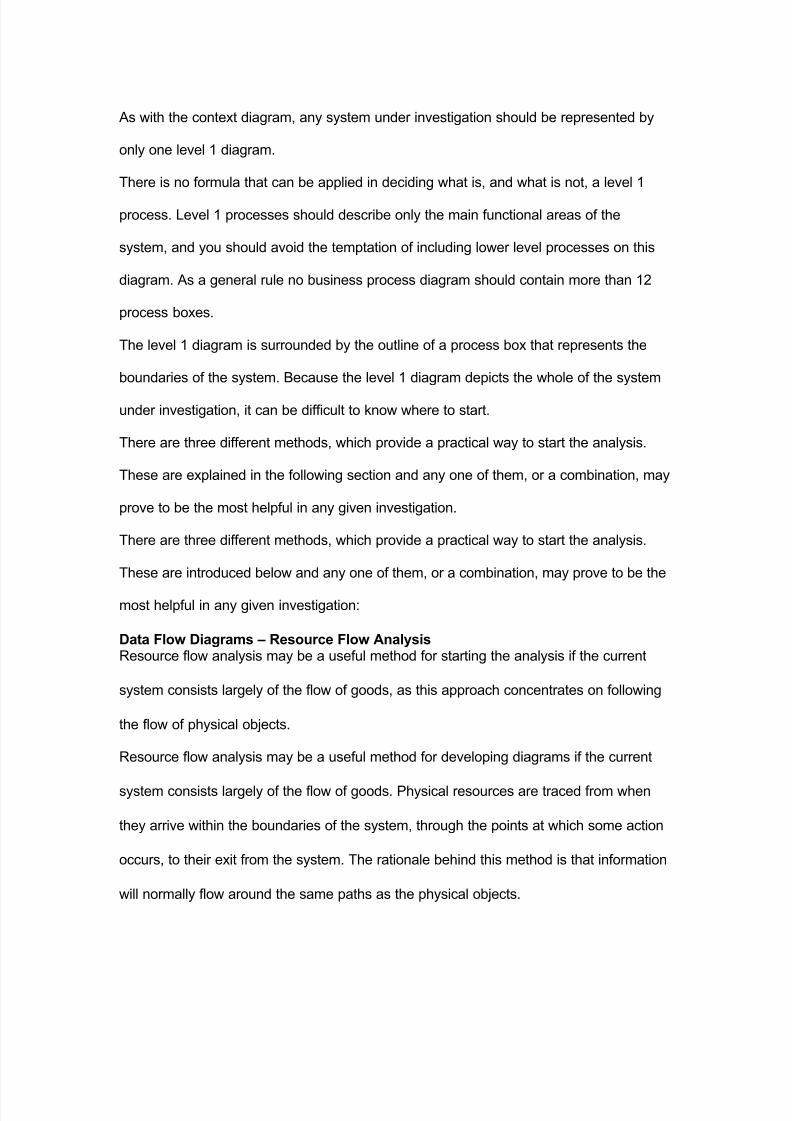
External Entity
An external entity is a source or destination of a data flow which is outside the area of
study. Only those entities which originate or receive data are represented on a business
process diagram. The symbol used is an oval containing a meaningful and unique
identifier.
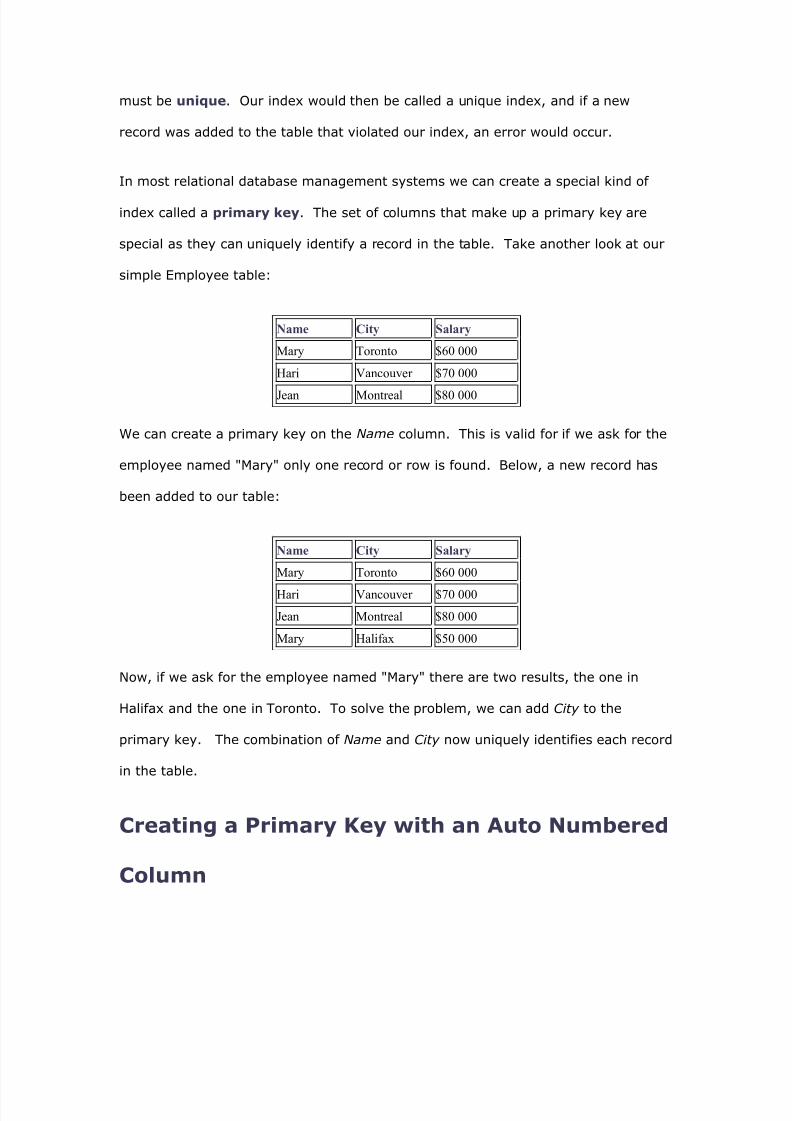
Process
A process shows a transformation or manipulation of data flows within the system. The
symbol used is a rectangular box which contains 3 descriptive elements:
Firstly an identification number appears in the upper left hand corner. This is allocated

8/8/2019 Sales(Final Rpt)
http://slidepdf.com/reader/full/salesfinal-rpt 28/84
arbitrarily at the top level and serves as a unique reference.
Secondly, a location appears to the right of the identifier and describes where in the
system the process takes place. This may, for example, be a department or a piece of hardware. Finally, a descriptive title is placed in the centre of the box. This should be a
simple imperative sentence with a specific verb, for example 'maintain customer
records' or 'find driver'.
Data Flow
A data flow shows the flow of information from its source to its destination. A data flow is
represented by a line, with arrowheads showing the direction of flow. Information always
flows to or from a process and may be written, verbal or electronic. Each data flow may
be referenced by the processes or data stores at its head and tail, or by a description of
its contents.
Data Store
A data store is a holding place for information within the system:
It is represented by an open ended narrow rectangle.
Data stores may be long-term files such as sales ledgers, or may be short-term
accumulations: for example batches of documents that are waiting to be processed.
Each data store should be given a reference followed by an arbitrary number.
Resource Flow
A resource flow shows the flow of any physical material from its source to its destination.

8/8/2019 Sales(Final Rpt)
http://slidepdf.com/reader/full/salesfinal-rpt 29/84
For this reason they are sometimes referred to as physical flows.
The physical material in question should be given a meaningful name. Resource flows
are usually restricted to early, high-level diagrams and are used when a description of
the physical flow of materials is considered to be important to help the analysis.
Data Flow Diagrams – The Rules
External EntitiesIt is normal for all the information represented within a system to have been obtained
from, and/or to be passed onto, an external source or recipient. These external entities
may be duplicated on a diagram, to avoid crossing data flow lines. Where they are
duplicated a stripe is drawn across the left hand corner, like this.
The addition of a lowercase letter to each entity on the diagram is a good way to
uniquely identify them.
ProcessesWhen naming processes, avoid glossing over them, without really understanding their
role. Indications that this has been done are the use of vague terms in the descriptive
title area - like 'process' or 'update'.
The most important thing to remember is that the description must be meaningful to
whoever will be using the diagram.
Data Flows
Double headed arrows can be used (to show two-way flows) on all but bottom level
diagrams. Furthermore, in common with most of the other symbols used, a data flow at a
particular level of a diagram may be decomposed to multiple data flows at lower levels.
Data StoresEach store should be given a reference letter, followed by an arbitrary number. These

8/8/2019 Sales(Final Rpt)
http://slidepdf.com/reader/full/salesfinal-rpt 30/84

8/8/2019 Sales(Final Rpt)
http://slidepdf.com/reader/full/salesfinal-rpt 31/84

8/8/2019 Sales(Final Rpt)
http://slidepdf.com/reader/full/salesfinal-rpt 32/84
Books may be reserved and borrowed by members of the public, who are required to
give a borrower number. The library will notify borrowers when a reserved book
becomes available or when a borrowed book becomes overdue.
In addition to supplying books, a book supplier will furnish details of specific books in
response to library enquiries.
Note, that communications involving external entities are only included where they
involve the 'system' process. Whilst a book supplier would communicate with various
agencies, for example, publishers and other suppliers - these data flow are remote from
the 'system' process and so this is not included on the context diagram.
Data Flow Diagrams – Context Diagram GuidelinesFirstly, draw and name a single process box that represents the entire system.
Next, identify and add the external entities that communicate directly with the process
box. Do this by considering origin and destination of the resource flows and data flows.
Finally, add the resource flows and data flows to the diagram.
In drawing the context diagram you should only be concerned with the most important
information flows. These will be concerned with issues such as: how orders are received
and checked, with providing good customer service and with the paying of invoices.
Remember that no business process diagram is the definitive solution - there is no
absolute right or wrong.
Data Flow Diagrams – Level 1 Diagrams
The level 1 diagram shows the main functional areas of the system under investigation.
8/8/2019 Sales(Final Rpt)
http://slidepdf.com/reader/full/salesfinal-rpt 33/84
As with the context diagram, any system under investigation should be represented by
only one level 1 diagram.
There is no formula that can be applied in deciding what is, and what is not, a level 1
process. Level 1 processes should describe only the main functional areas of the
system, and you should avoid the temptation of including lower level processes on this
diagram. As a general rule no business process diagram should contain more than 12
process boxes.
The level 1 diagram is surrounded by the outline of a process box that represents the
boundaries of the system. Because the level 1 diagram depicts the whole of the system
under investigation, it can be difficult to know where to start.
There are three different methods, which provide a practical way to start the analysis.
These are explained in the following section and any one of them, or a combination, may
prove to be the most helpful in any given investigation.
There are three different methods, which provide a practical way to start the analysis.
These are introduced below and any one of them, or a combination, may prove to be the
most helpful in any given investigation:
Data Flow Diagrams – Resource Flow AnalysisResource flow analysis may be a useful method for starting the analysis if the current
system consists largely of the flow of goods, as this approach concentrates on following
the flow of physical objects.
Resource flow analysis may be a useful method for developing diagrams if the current
system consists largely of the flow of goods. Physical resources are traced from when
they arrive within the boundaries of the system, through the points at which some action
occurs, to their exit from the system. The rationale behind this method is that information
will normally flow around the same paths as the physical objects.

8/8/2019 Sales(Final Rpt)
http://slidepdf.com/reader/full/salesfinal-rpt 34/84
Data Flow Diagrams – Organizational Structure AnalysisThe organizational structure approach starts from an analysis of the main roles that exist
within the organization, rather than the goods or information that is flowing around the
system.
Identification of the key processes results from looking at the organizational structure
and deciding which functional areas are relevant to the current investigation. By looking
at these areas in more detail, and analyzing what staff actually do, discrete processes
can be identified.
Starting with these processes, the information flows between them and between these
processes and external entities are then identified and added to the diagram.
Data Flow Diagrams – Document Flow AnalysisThe document flow analysis approach is appropriate if the part of the business under
investigation consists principally of flows of information in the form of documents or
computer input and output.
Document flow analysis is particularly useful where information flows are of special
interest. The first step is to list the major documents and their sources and recipients.
This is followed by the identification of other major information flows such as telephone
and computer transactions. Once the document flow diagram has been drawn the
system boundary should be added.

8/8/2019 Sales(Final Rpt)
http://slidepdf.com/reader/full/salesfinal-rpt 35/84
Data Flow Diagrams – Top Down Expansion
The section explains the process of top down expansion, or leveling. Furthermore, it
illustrates that whilst there can only be one context and one level 1 diagram for a given
system, these normally give rise to numerous lower level diagrams.
Each process within a given business process diagram may be the subject of further
analysis. This involves identifying the lower level processes that together constitute the
process as it was originally identified. This procedure is known as top-down expansion
or leveling.
As a business process diagram is decomposed, each process box becomes a boundary
for the next, lower level, diagram.
Data Flow Diagrams – Top Down Expansion Illustrated
In order to illustrate the process of top-down expansion, consider the three processes
shown within this business process diagram. No detail is shown, only the outline of the

8/8/2019 Sales(Final Rpt)
http://slidepdf.com/reader/full/salesfinal-rpt 36/84

8/8/2019 Sales(Final Rpt)
http://slidepdf.com/reader/full/salesfinal-rpt 37/84
begin.
Therefore the processes on a level 1 diagram could be re-numbered without affecting
the meaning of the diagram. This is true within any business process diagram - as these
diagrams do not imply time, sequence or repetition.
However, as the analysis continues beyond level 1 it is important that a strict numbering
convention is followed. The processes on level 2 diagrams must indicate their parent
process within the level 1 diagram. This convention should continue through level 3
diagrams, and beyond, should that level of analysis ever be required.
The diagram on this screen clearly illustrates how processes on lower level diagrams
identify their ancestral path.
Data Flow Diagrams - When to StopIt is important to know when to stop the process of top-down expansion. Usually this will
be at level 2 or level 3.
There are 3 useful guidelines to help you to decide when to stop the analysis:
Firstly, if a process has a single input data flow or a single output data flow then it should
be apparent that there is little point in analyzing it any further.
Secondly, when a process can be accurately described by a single active verb with a
singular object, this also indicates that the analysis has been carried out to a sufficiently
low level. For example, the process named validate enquiry contains a single discrete
task.
Finally, ask yourself if anything useful will be gained by further analysis of a process.
Would any more detail influence your decisions?
If the answer is no, then there is little point in taking the analysis further.
Data Flow Diagrams – Keeping the Diagrams Clear

8/8/2019 Sales(Final Rpt)
http://slidepdf.com/reader/full/salesfinal-rpt 38/84
DFD (Context Level Diagram)
SALESMONOTORIN
GSalesMa
Sell Goods
Process the goodssold
Stores
GenerateSale Receipt
Receive the

8/8/2019 Sales(Final Rpt)
http://slidepdf.com/reader/full/salesfinal-rpt 39/84
DATA BASE DESIGN
Tables
The core element in any database design is the table. Essentially a table is a
repository for sets of related information. Below is an example of a simple table
called Employee and some data that it stores.
Name City Salary
Mary Toronto $60 000
Hari Vancouver $70 000
Jean Montreal $80 000
Our Employee contains three records. Notice that the three fields or columns
Name, City and Salary are all important to an employee. One would not create a
table with unrelated information in each row or record. For example, columns such
as Slope, Latitude, or Government would not be added to this table, but columns
such as Email , Address and Last_Name might be useful. The idea when designing
tables is to keep the information relevant to what is being stored.
In the above example notice that each column stores a different kind of information.
The kind or type of information stored is called the datatype of the column. The
columns Name and City store text information, while Salary stores currency or
money information.
Above is the Employee table defined in Visual Case for Microsoft Access XP. When
you change the database type, the data types (Text, Currency, etc.) will change as

8/8/2019 Sales(Final Rpt)
http://slidepdf.com/reader/full/salesfinal-rpt 40/84
8/8/2019 Sales(Final Rpt)
http://slidepdf.com/reader/full/salesfinal-rpt 41/84
must be unique. Our index would then be called a unique index, and if a new
record was added to the table that violated our index, an error would occur.
In most relational database management systems we can create a special kind of
index called a primary key. The set of columns that make up a primary key are
special as they can uniquely identify a record in the table. Take another look at our
simple Employee table:
Name City Salary
Mary Toronto $60 000
Hari Vancouver $70 000
Jean Montreal $80 000
We can create a primary key on the Name column. This is valid for if we ask for the
employee named "Mary" only one record or row is found. Below, a new record has
been added to our table:
Name City Salary
Mary Toronto $60 000
Hari Vancouver $70 000
Jean Montreal $80 000
Mary Halifax $50 000
Now, if we ask for the employee named "Mary" there are two results, the one in
Halifax and the one in Toronto. To solve the problem, we can add City to the
primary key. The combination of Name and City now uniquely identifies each record
in the table.
Creating a Primary Key with an Auto Numbered
Column

8/8/2019 Sales(Final Rpt)
http://slidepdf.com/reader/full/salesfinal-rpt 42/84
You may have noticed that we still have a problem. We would like to have a primary
key as we need a way to uniquely id the employees, but it is likely that there is more
than one employee with the same name and city.
Sometimes (as in our Employee table) there is no combination of columns that is
convenient to uniquely identify a record. You can create a column (Employee_ID in
the example above) and set it to be automatically numbered. That is, each time a
new record is added to the table, the value is automatically set to a unique value. In
the example above, a primary key has been created on the Employee_ID column.
Columns that are in a table's primary key are underlined on the diagram.
Foreign Keys
After tables, foreign keys are arguably the most important thing in a relational
database. Once you have some tables in your database, a way is needed to connect
all of the data together. Foreign keys, are the easiest way to do it.
Above, the Employee table has been changed. You will recall that previously, the
City field was stored as text. This could create problems and waste time if each time

8/8/2019 Sales(Final Rpt)
http://slidepdf.com/reader/full/salesfinal-rpt 43/84
the city has to be typed in. In the table, you could end up with errors and
inconsistencies with employees working in 'Winipeg' and 'Winnipeg' for example.
Instead, we can create another table called city:
City_ID Name
1 Toronto
2 Vancouver
3 Montreal
4 Winnipeg
5 Halifax
Now in the Employee table, only the unique identifier of the City is referenced. This
has the following advantages:
• The city name is only stored once in the database. Multiple tables and
records may reference the same city, but in each case only a number is
stored, not the entire name. This can save a significant amount of space on
disk.
• The incidence of errors is reduced in the database. Further, if a city changed
its name, only one change need be made in the database.
• Other information could be stored about a city in the City table. For example,
in Canada you may wish to store the English and French versions of a name
to display to different users. With the design above, the underlying data need
not be changed and our multi-lingual display becomes transparent.
Foreign key relations can be used between any tables. A client may have many
purchases, a library may have many books, a school many classes and a class many
students, and so on.
Below are some rules to remember when creating foreign keys:

8/8/2019 Sales(Final Rpt)
http://slidepdf.com/reader/full/salesfinal-rpt 44/84
• The foreign key goes from child table to parent table. In our example, the
Employee table is the child and it references the parent table City . Visual
Case shows an arrow pointing to the parent table.
• The child table is said to be the owner of the foreign key. Above, the foreign
key is considered a constraint on the Employee table.
• The child table must include the columns defined in the primary key of the
parent table. That is, each record in the child table, must be able to
uniquely identify a record in the parent table by its foreign key.
Multiplicity
In the example of Employee and City , the multiplicity is said to be many to one.
For each employee there is one city, but for each city there are many employees. In
Visual Case you can specify the multiplicity on a foreign key (unless not supported by
the selected database type).
Recall the constraint on a foreign key that the child table must uniquely identify a
single record in the parent table. This means that the multiplicity of the parent table
is always one. The child table can have the following multiplicities:
• Many
• One
• Zero or Many
• Zero or One
On the rare occasion in your designs you will run into a situation in which you need a
many to many multiplicity on a foreign key. A course has many students and a
student has many courses.

8/8/2019 Sales(Final Rpt)
http://slidepdf.com/reader/full/salesfinal-rpt 45/84
In the case of a many to many relationship, you need to create an intermediary
table. The way it works is that each record in the Student_Course_Connection table
connects a single student with a single course. Each instance of a student taking a
course is represented as a row in the intermediary table.
Putting it all Together
You now have all the basics required to design a relational database. Beginning with
tables you can build storage compartments for the various data that need to be
maintained in your system. Indices on the table allow for easier access as well as
control and validation over the data. Finally, foreign keys allow you to relate the
data in one table to that in another.
When designing your database try to keep each table focused and straightforward.
Each table should only have the information relating to the data being stored.
Also, look for situations where a related table would better serve the purpose as we
did above with the City field. In general, you want to avoid duplicating data entry
and storage.
Don't be afraid to have a greater number of smaller tables. In our student and
course example, the school may specify that a student can take no more than 6
courses. It may be tempting to put Course_ID1, Course_ID2... Course_ID6 columns
in the Student table and avoid the need for the intermediary table to support the
many to many relationship. You need to think ahead though. What will be required

8/8/2019 Sales(Final Rpt)
http://slidepdf.com/reader/full/salesfinal-rpt 46/84

8/8/2019 Sales(Final Rpt)
http://slidepdf.com/reader/full/salesfinal-rpt 47/84
D_o_j Date Date of Joining of theSalesman.
Year_sales
Number 10 Annual Sale done by thesalesman
1 Item File:
Fields Datatype
Width Description
Item_code
Number LongInteger
Specific code to identifyany item.
Supp_code
Number LongInteger
Reference supp_code inSupplier file
Item_name
Text 50 Name of that item.
Item_rate
Currency Rate of the item.
QOH Number LongInteger
No. of units of itemavailable in the stock
2 Sales Master File:
Fields Datatype
Width Description
Sale_receipt_no
Number LongInteger
Specific code to identify aSale Receipt.
Sale_receipt_date
Date Date on which Sale Receiptis made.
Salesman_code
Number LongInteger
Reference salesman_code inSalesman file.
Value_of _sale
Number LongInteger
The value of sale to thatreceipt no.
34567 Item Detail File:
Fields Datatyp Width Description

8/8/2019 Sales(Final Rpt)
http://slidepdf.com/reader/full/salesfinal-rpt 48/84
eSale_receipt_No
Number LongInteger
References thesale_receipt_no inSales_Master file.
Item_cod
e
Number Long
Integer
References the item_code in
item file.Qty_sold Number Long
IntegerThe quantity of goods sold.
8 Monthly Sale File:
Fields Datatype
Width Description
Salesman_code
Number
6 References thesalesman_code in Salesmanfile.
Month Number
2 The month number in whichthe sale made.
Sale Number
LongInteger
The value of sale done by aparticular salesman in aparticular month.

8/8/2019 Sales(Final Rpt)
http://slidepdf.com/reader/full/salesfinal-rpt 49/84
SECTION 5
SCREENS & VALIDATION CHECKS

8/8/2019 Sales(Final Rpt)
http://slidepdf.com/reader/full/salesfinal-rpt 50/84
Input Screens:
0 Salesman Master:

8/8/2019 Sales(Final Rpt)
http://slidepdf.com/reader/full/salesfinal-rpt 51/84
1 Item Master:

8/8/2019 Sales(Final Rpt)
http://slidepdf.com/reader/full/salesfinal-rpt 52/84
3. Sales Master – I:

8/8/2019 Sales(Final Rpt)
http://slidepdf.com/reader/full/salesfinal-rpt 53/84

8/8/2019 Sales(Final Rpt)
http://slidepdf.com/reader/full/salesfinal-rpt 54/84

8/8/2019 Sales(Final Rpt)
http://slidepdf.com/reader/full/salesfinal-rpt 55/84
Outputs:
0 Sales Analysis Report:

8/8/2019 Sales(Final Rpt)
http://slidepdf.com/reader/full/salesfinal-rpt 56/84
1 SalesMan Analysis Report:

8/8/2019 Sales(Final Rpt)
http://slidepdf.com/reader/full/salesfinal-rpt 57/84
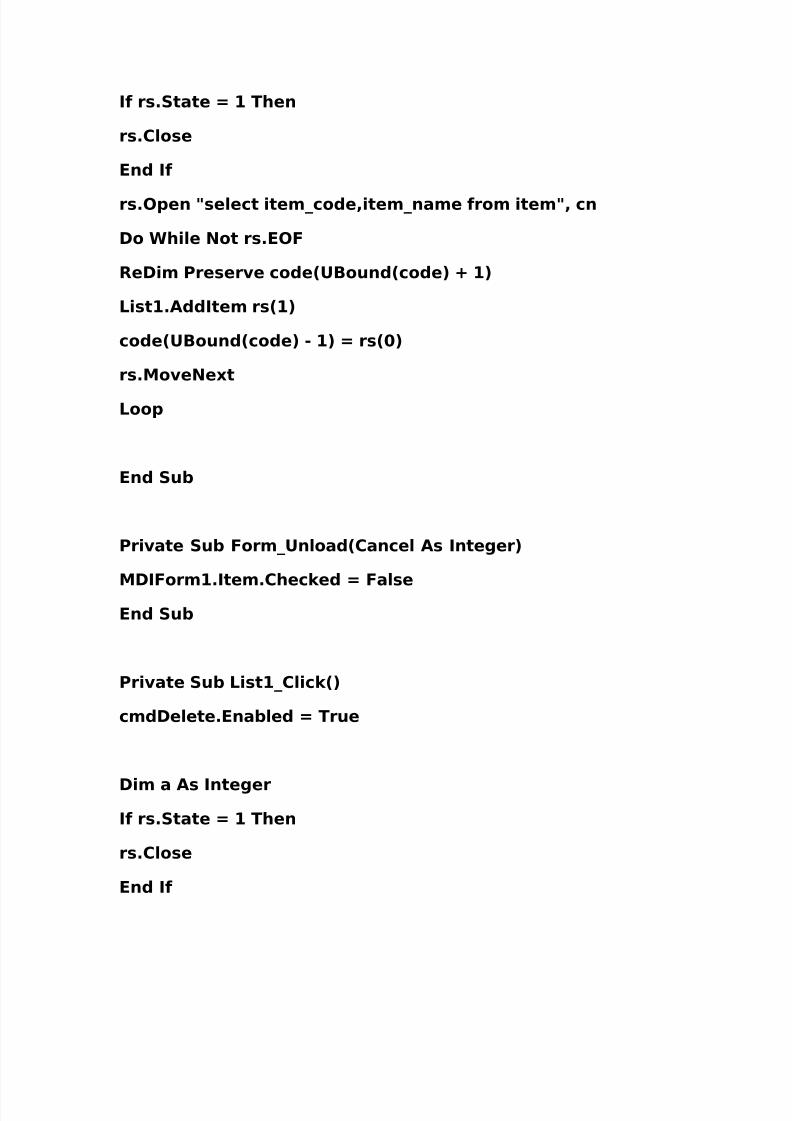
SECTION 7
CODING

8/8/2019 Sales(Final Rpt)
http://slidepdf.com/reader/full/salesfinal-rpt 58/84
Option Explicit
Dim code() As String
Private Sub cmdClose_Click()
Unload Me
End Sub
Private Sub cmdDelete_Click()
If MsgBox("Are you sure to delete this record", vbYesNo,"Purchase Order System") = vbYes Then
If rs.State = 1 Then
rs.Close
End If
rs.Open "delete from item where item_code='" & Label2 &"'", cn, adOpenForwardOnly, adLockOptimistic
List1.RemoveItem (List1.ListIndex)
MsgBox ("The record deleted successfully")
End If
Form_Load
End Sub
Private Sub cmdSave_Click()
If cmdSave.Caption = "Save" Then

8/8/2019 Sales(Final Rpt)
http://slidepdf.com/reader/full/salesfinal-rpt 59/84
If rs.State = 1 Then
rs.Close
End If
If Text1.Text = "" Then
MsgBox ("Please enter the Item name")
Text1.SetFocus
Exit Sub
ElseIf Text2.Text = "" Then
MsgBox ("Please enter the Item rate")
Text2.SetFocus
Exit Sub
ElseIf Text3.Text = "" Then
MsgBox ("Please enter the Quantity on Hand")
Text3.SetFocus
Exit Sub
End If
rs.Open "select * from item", cn, adOpenForwardOnly,adLockOptimistic
rs.AddNew
rs(0) = Label2.Caption
rs(1) = Text1 & ""
rs(2) = Text2 & ""
rs(3) = Text3 & ""
rs.Update

8/8/2019 Sales(Final Rpt)
http://slidepdf.com/reader/full/salesfinal-rpt 60/84
MsgBox "Inserted"
List1.AddItem Text1
ReDim Preserve code(UBound(code) + 1)
code(UBound(code) - 1) = rs(0)
Form_Load
ElseIf cmdSave.Caption = "Modify" Then
If rs.State = 1 Then
rs.Close
End If
If Text1.Text = "" Then
MsgBox ("Please enter the Item name")
Text1.SetFocus
Exit Sub
ElseIf Text2.Text = "" Then
MsgBox ("Please enter the Item rate")
Text2.SetFocus
Exit Sub
ElseIf Text3.Text = "" Then
MsgBox ("Please enter the Quantity on Hand")
Text3.SetFocus
Exit Sub
End If

8/8/2019 Sales(Final Rpt)
http://slidepdf.com/reader/full/salesfinal-rpt 61/84
rs.Open "update item set item_name='" & Text1 &"',item_rate=" & Text2 & ",qoh=" & Text3 & " whereitem_code='" & Label2.Caption & "'", cn,
adOpenForwardOnly, adLockOptimistic
MsgBox "Updated"
List1.List(List1.ListIndex) = Text1
Form_Load
End If
Text1.SetFocus
End Sub
Private Sub Form_Load()
cmdDelete.Enabled = False
ReDim code(0)
List1.Clear
cmdSave.Caption = "Save"
Text1 = ""
Text2 = ""
Text3 = ""
Set rs = New ADODB.Recordset
Call auto("item_code", "item", Label2, "I")
If rs.State = 1 Then
rs.Close
End If
8/8/2019 Sales(Final Rpt)
http://slidepdf.com/reader/full/salesfinal-rpt 62/84
If rs.State = 1 Then
rs.Close
End If
rs.Open "select item_code,item_name from item", cn
Do While Not rs.EOF
ReDim Preserve code(UBound(code) + 1)
List1.AddItem rs(1)
code(UBound(code) - 1) = rs(0)
rs.MoveNext
Loop
End Sub
Private Sub Form_Unload(Cancel As Integer)
MDIForm1.Item.Checked = False
End Sub
Private Sub List1_Click()
cmdDelete.Enabled = True
Dim a As Integer
If rs.State = 1 Then
rs.Close
End If

8/8/2019 Sales(Final Rpt)
http://slidepdf.com/reader/full/salesfinal-rpt 63/84
rs.Open "select * from item where item_name='" & List1 &"'", cn, adOpenForwardOnly, adLockOptimistic
cmdSave.Caption = "Modify"
Label2.Caption = rs(0)Text1 = rs(1)
Text2 = rs(2)
Text3 = rs(3)
End Sub

8/8/2019 Sales(Final Rpt)
http://slidepdf.com/reader/full/salesfinal-rpt 64/84
Option Explicit
Dim code() As String
Private Sub cmdClose_Click()
Unload Me
End Sub
Private Sub cmdok_Click()
Dim i As Integer
Dim qty As Integer
Dim qtyleft As Integer
If rs.State = 1 Then
rs.Close
End If
If Combo2.Text = "" Then
MsgBox ("Please enter the Item Name")
Combo2.SetFocus
Exit Sub
ElseIf txtqty.Text = "" Then
MsgBox ("Please enter the Quantity Purchased")
txtqty.SetFocus
Exit Sub
End If

8/8/2019 Sales(Final Rpt)
http://slidepdf.com/reader/full/salesfinal-rpt 65/84
rs.Open "select * from item where item_name='" & Combo2& "'", cn, adOpenForwardOnly, adLockOptimistic
qty = rs(3)qtyleft = qty - txtqty
If qtyleft < 0 Then
MsgBox "The quantity on hand is " & qty & " only."
txtqty.SetFocus
Exit Sub
Else
cn.Execute ("update item set QOH= " & qtyleft & " whereitem_code='" & txtcode & "'")
End If
i = frmSales.MSFlexGrid1.Rows
frmSales.MSFlexGrid1.Rows = frmSales.MSFlexGrid1.Rows +1
frmSales.MSFlexGrid1.TextMatrix(i, 0) = i
frmSales.MSFlexGrid1.TextMatrix(i, 1) = txtcode
frmSales.MSFlexGrid1.TextMatrix(i, 2) = Combo2
frmSales.MSFlexGrid1.TextMatrix(i, 3) = Text1
frmSales.MSFlexGrid1.TextMatrix(i, 4) = txtqty
Unload Me
End Sub
Private Sub Combo2_Click()

8/8/2019 Sales(Final Rpt)
http://slidepdf.com/reader/full/salesfinal-rpt 66/84
txtcode = code(Combo2.ListIndex)
If rs.State = 1 Then
rs.Close
End If
rs.Open "select * from item where item_name='" & Combo2& "'", cn, adOpenForwardOnly, adLockOptimistic
Text1 = rs(2)
End Sub
Private Sub Form_Load()
ReDim code(0)
If rs.State = 1 Then
rs.Close
End If
rs.Open "select * from item where QOH<>0", cn,adOpenForwardOnly, adLockOptimistic
Do While Not rs.EOF
Combo2.AddItem rs(1)
ReDim Preserve code(UBound(code) + 1)
code(UBound(code) - 1) = rs(0)
rs.MoveNext
Loop
End Sub

8/8/2019 Sales(Final Rpt)
http://slidepdf.com/reader/full/salesfinal-rpt 67/84

8/8/2019 Sales(Final Rpt)
http://slidepdf.com/reader/full/salesfinal-rpt 68/84
Option Explicit
Dim code() As String
Dim value As Integer
Private Sub cmdClose_Click()
Unload Me
End Sub
Private Sub cmdSave_Click()
value = 0
If rs.State = 1 Then
rs.Close
End If
If Combo2.Text = "" Then
MsgBox ("Please Select the Salesman Name")
Combo2.SetFocus
Exit Sub
End If
rs.Open "select * from sales_master", cn,adOpenForwardOnly, adLockOptimistic
rs.AddNew
rs(0) = Label2.Caption

8/8/2019 Sales(Final Rpt)
http://slidepdf.com/reader/full/salesfinal-rpt 69/84
rs(1) = MaskEdBox1.Text
rs(2) = code(Combo2.ListIndex)
rs.Update
If rs.State = 1 Then
rs.Close
End If
rs.Open "select * from item_detail", cn, adOpenForwardOnly,adLockOptimistic
Dim i As Integer
For i = 1 To MSFlexGrid1.Rows - 1
rs.AddNew
rs(0) = Label2.Caption
rs(1) = MSFlexGrid1.TextMatrix(i, 1)
rs(2) = MSFlexGrid1.TextMatrix(i, 4)
rs.Update
Next
If rs1.State = 1 Then
rs1.Close
End If
rs1.Open "select * from salesman where salesman_code='" &code(Combo2.ListIndex) & "'", cn, adOpenForwardOnly,adLockOptimistic
If IsNull(rs1(3)) Then
rs1(3) = value
Else
rs1(3) = rs1(3) + value

8/8/2019 Sales(Final Rpt)
http://slidepdf.com/reader/full/salesfinal-rpt 70/84
End If
rs1.Update
If rs.State = 1 Then
rs.Close
End If
rs.Open "select * from month_sales", cn,adOpenForwardOnly, adLockOptimistic
rs.AddNew
rs(0) = code(Combo2.ListIndex)
rs(1) = Month(MaskEdBox1.Text)
rs(2) = value
rs.Update
MsgBox "Inserted"
Form_Load
End Sub
Private Sub Form_Load()
ReDim code(0)
Combo2.Clear
MSFlexGrid1.Rows = 1
cmdSave.Caption = "Save"
Call dateconv(Date, MaskEdBox1)
Call auto("sales_receipt_no", "sales_master", Label2, "SR")
If rs.State = 1 Then
rs.Close

8/8/2019 Sales(Final Rpt)
http://slidepdf.com/reader/full/salesfinal-rpt 71/84
End If
rs.Open "select * from salesman", cn
Do While Not rs.EOF
Combo2.AddItem rs(1)
ReDim Preserve code(UBound(code) + 1)
code(UBound(code) - 1) = rs(0)
rs.MoveNext
Loop
Combo2.ListIndex = "0"
MSFlexGrid1.FormatString = "S. No.|<Item Code|Item Name|Rate|<Quantity Sold"
MSFlexGrid1.Width = 6975
MSFlexGrid1.ColWidth(0) = 500
MSFlexGrid1.ColWidth(1) = 1000
MSFlexGrid1.ColWidth(2) = 2000
MSFlexGrid1.ColWidth(3) = 900
MSFlexGrid1.ColWidth(4) = 1500
End Sub
Private Sub MSFlexGrid1_MouseDown(Button As Integer,Shift As Integer, X As Single, y As Single)
If Button = 2 Then

8/8/2019 Sales(Final Rpt)
http://slidepdf.com/reader/full/salesfinal-rpt 72/84
PopupMenu MDIForm1.salespopup
End If
End Sub

8/8/2019 Sales(Final Rpt)
http://slidepdf.com/reader/full/salesfinal-rpt 73/84
Option Explicit
Private Sub cmdClose_Click()
Unload Me
End Sub
Private Sub cmdDelete_Click()
If MsgBox("Are you sure to delete this record", vbYesNo,"Purchase Order System") = vbYes Then
If rs.State = 1 Then
rs.Close
End If
rs.Open "delete from salesman where salesman_code='" &Label2 & "'", cn, adOpenForwardOnly, adLockOptimistic
List2.RemoveItem (List2.ListIndex)
MsgBox ("The record has been deleted successfully")
End If
Form_Load
Text1.SetFocus
End Sub
Private Sub cmdSave_Click()
On Error Resume Next
If cmdSave.Caption = "Save" Then

8/8/2019 Sales(Final Rpt)
http://slidepdf.com/reader/full/salesfinal-rpt 74/84

8/8/2019 Sales(Final Rpt)
http://slidepdf.com/reader/full/salesfinal-rpt 75/84
ElseIf cmdSave.Caption = "Modify" Then
If rs.State = 1 Then
rs.Close
End If
If Text1.Text = "" Then
MsgBox ("Please enter the Salesman Name")
Text1.SetFocus
Exit Sub
ElseIf MaskEdBox1.ClipText = "" Then
MsgBox ("Please enter the Date of joining")
MaskEdBox1.SetFocus
Exit Sub
End If
rs.Open "update salesman set salesman_name='" & Text1 &"',d_o_j='" & MaskEdBox1 & "' where salesman_code='" &Label2.Caption & "'", cn, adOpenForwardOnly,adLockOptimistic
MsgBox "Updated"
List2.List(List2.ListIndex) = Text1
Form_Load
End If
Text1.SetFocus
End Sub

8/8/2019 Sales(Final Rpt)
http://slidepdf.com/reader/full/salesfinal-rpt 76/84
Private Sub Form_Load()
List2.Clear
cmdDelete.Enabled = False
cmdSave.Caption = "Save"
Text1 = ""
'Text2 = ""
'Text3 = ""
Call dateconv(Date, MaskEdBox1)
Set rs = New ADODB.Recordset
Call auto("salesman_code", "Salesman", Label2, "S")
If rs.State = 1 Then
rs.Close
End If
rs.Open "select salesman_code,salesman_name fromsalesman", cn
Do While Not rs.EOF
List2.AddItem rs(1)
rs.MoveNext
Loop
End Sub
Private Sub List2_Click()
cmdDelete.Enabled = True

8/8/2019 Sales(Final Rpt)
http://slidepdf.com/reader/full/salesfinal-rpt 77/84
MaskEdBox1.Mask = ""
If rs.State = 1 Then
rs.Close
End If
rs.Open "select * from salesman where salesman_name='" &List2 & "'", cn, adOpenForwardOnly, adLockOptimistic
cmdSave.Caption = "Modify"
Label2.Caption = rs(0)
Text1 = rs(1)
MaskEdBox1 = rs(2)
'Text2 = rs(3)
'Text3 = rs(4)
End Sub

8/8/2019 Sales(Final Rpt)
http://slidepdf.com/reader/full/salesfinal-rpt 78/84
Private Sub add_Click()
frmItem_det.Width = 6000
frmItem_det.Height = 4500
frmItem_det.Top = 1500
frmItem_det.Left = 2000
frmItem_det.Show
End Sub
Private Sub exwin_Click()
'ExitWindowsEx(0, 0) = 1
End Sub
Private Sub exit_Click()
End
End Sub
Private Sub item_Click()
Me.Item.Checked = True
frmItem.Show
End Sub
Private Sub MDIForm_Load()
cn.Open "provider=microsoft.jet.oledb.4.0;data source=" &App.Path & "\SalesMonitoring.mdb"
'Set cn = New ADODB.Connection
'cn.Open "lib1", "scott", "tiger"
End Sub
Private Sub sales_Click()

8/8/2019 Sales(Final Rpt)
http://slidepdf.com/reader/full/salesfinal-rpt 79/84
frmSales.Show
End Sub
Private Sub salesman_Click()
frmSalesman.Show
End Sub
Private Sub SAR_Click()
'Screen.MousePointer = vbHourglass
'CrystalReport1.ReportFileName = App.Path &"\SalesAnalysis.rpt"
'CrystalReport1.Destination = crptToWindow
'Me.CrystalReport1.WindowTitle = "Sales Analyzing Report"
'Me.CrystalReport1.WindowState = crptMaximized
'CrystalReport1.PrintReport
'
'Screen.MousePointer = vbArrow
DataReport4.Show
End Sub
Private Sub SMAR_Click()
DataReport2.Show
''Screen.MousePointer = vbHourglass
''

8/8/2019 Sales(Final Rpt)
http://slidepdf.com/reader/full/salesfinal-rpt 80/84
''CrystalReport1.ReportFileName = App.Path &"\Report1.rpt"
'''Me.CrystalReport1.SelectionFormula ="{month_sales.salesman_code}={Sales_master.salesman
_code}"
''CrystalReport1.Destination = crptToWindow
''Me.CrystalReport1.WindowTitle = "SalesMan AnalyzingReport"
''Me.CrystalReport1.WindowState = crptMaximized
''
''CrystalReport1.PrintReport
''Screen.MousePointer = vbArrow
End Sub

8/8/2019 Sales(Final Rpt)
http://slidepdf.com/reader/full/salesfinal-rpt 81/84
Public cn As New ADODB.Connection
Public rs As New ADODB.Recordset
Public rs1 As New ADODB.Recordset
Public Sub auto(f As String, t As String, lbl As Label, c AsString)
If rs.State = 1 Then
rs.Close
End If
rs.Open "select max(" & f & ") from " & t & "", cn
If IsNull(rs(0)) = True Then
lbl = c & "00" & 1
ElseIf Val(Right(rs(0), 3)) > 0 And Val(Right(rs(0), 3)) < 9Then
lbl = c & "00" & Val(Right(rs(0), 3)) + 1
ElseIf Val(Right(rs(0), 3)) >= 9 And Val(Right(rs(0), 3)) < 99Then
lbl = c & "0" & Val(Right(rs(0), 3)) + 1
ElseIf Val(Right(rs(0), 3)) >= 99 And Val(Right(rs(0), 3)) <999 Then
lbl = c & Val(Right(rs(0), 3)) + 1
End If
End Sub
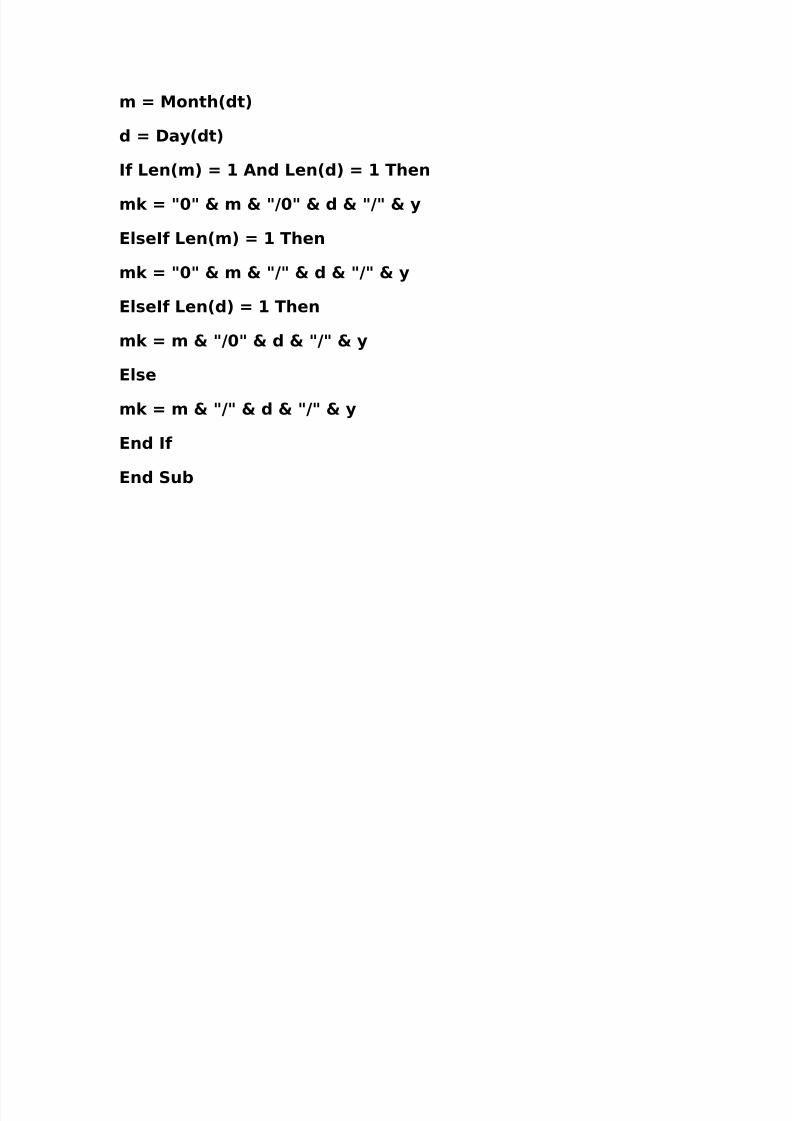
Public Sub dateconv(dt As Date, mk As MaskEdBox)
Dim y, d, m As String
y = Year(dt)
8/8/2019 Sales(Final Rpt)
http://slidepdf.com/reader/full/salesfinal-rpt 82/84
m = Month(dt)
d = Day(dt)
If Len(m) = 1 And Len(d) = 1 Then
mk = "0" & m & "/0" & d & "/" & y
ElseIf Len(m) = 1 Then
mk = "0" & m & "/" & d & "/" & y
ElseIf Len(d) = 1 Then
mk = m & "/0" & d & "/" & y
Else
mk = m & "/" & d & "/" & y
End If
End Sub

8/8/2019 Sales(Final Rpt)
http://slidepdf.com/reader/full/salesfinal-rpt 83/84
Limitations and Areas of Enhancement
• This project can be customized to connect many Branches of asingle Company in India and make a centralized sales monitoring
system with a centralized database.• Better security mechanisms can be applied like admin
passwords, encryption techniques etc.
• Can be made more customizable.
• Report generation can be enhanced more to facilitate the user of this system. Like reports, which depict weak areas in marketingstrategies, used.

8/8/2019 Sales(Final Rpt)
http://slidepdf.com/reader/full/salesfinal-rpt 84/84