salesforce announces record third quarter fiscal 2019 results · salesforce, the global leader in...
TRANSCRIPT

John Cummings Salesforce
Investor Relations 415-778-4188
Gina Sheibley Salesforce
Public Relations 917-297-8988
Salesforce Announces Record Third Quarter Fiscal 2019 Results Initiates FY20 Revenue Guidance of $15.9 Billion to $16.0 Billion
• Third Quarter Revenue of $3.39 Billion, up 26% Year-Over-Year, 26% in Constant Currency• Unearned Revenue of $5.38 Billion, up 25% Year-Over-Year, 26% in Constant Currency• Remaining Performance Obligation of Approximately $21.2 Billion, up 34% Year-Over-Year• Third Quarter Operating Cash Flow of $143 Million, up 14% Year-Over-Year• Initiates Fourth Quarter Revenue Guidance of $3.551 Billion to $3.561 Billion• Raises FY19 Revenue Guidance to $13.23 Billion to $13.24 Billion
SAN FRANCISCO, Calif. - Nov. 27, 2018 - Salesforce (NYSE: CRM), the global leader in CRM, today announced results for its fiscal third quarter ended October 31, 2018.
“Given the strength of this quarter's results and the incredible customer demand we are seeing, we are again raising our FY19 revenue guidance and initiating our full year fiscal 2020 revenue guidance at $16 billion at the high end of the range," said Keith Block, co-CEO, Salesforce. “Companies across every industry, in every geography have a mandate to digitally transform their businesses and are turning to Salesforce as a strategic partner.”
"I'm thrilled that Salesforce will be the fastest enterprise software company in history to reach $16 billion in revenue," said Marc Benioff, chairman and co-CEO, Salesforce. "I would like to thank all of our Ohana who make everything we do possible."
Salesforce delivered the following results for its fiscal third quarter:
Revenue: Total third quarter revenue was $3.39 billion, an increase of 26% year-over-year, and 26% in constant currency. Subscription and support revenues were $3.17 billion, an increase of 26% year-over-year. Professional services and other revenues were $224 million, an increase of 15% year-over-year.
Earnings per Share: Third quarter GAAP diluted earnings per share was $0.13, and non-GAAP diluted earnings per share was $0.61. Mark-to-market accounting of the company’s strategic investments, required by ASU 2016-01, benefited GAAP diluted earnings per share by $0.07 and non-GAAP diluted earnings per share by $0.06.
Cash: Cash generated from operations for the third quarter was $143 million, an increase of 14% year-over-year. Total cash, cash equivalents and marketable securities ended the third quarter at $3.45 billion.
Unearned Revenue: Unearned revenue on the balance sheet as of October 31, 2018 was $5.38 billion, an increase of 25% year-over-year, and 26% in constant currency. Remaining Performance Obligation: Remaining performance obligation, representing future revenues that are under contract but have not yet been recognized, ended the third quarter at approximately $21.2 billion, an increase of 34% year-over-year. This includes approximately $300 million related to the remaining performance obligation from MuleSoft. Current remaining performance obligation, which represents the future revenues under contract expected to be recognized over the next 12 months, ended the third quarter at approximately $10.0 billion, an increase of 27% year-over-year.
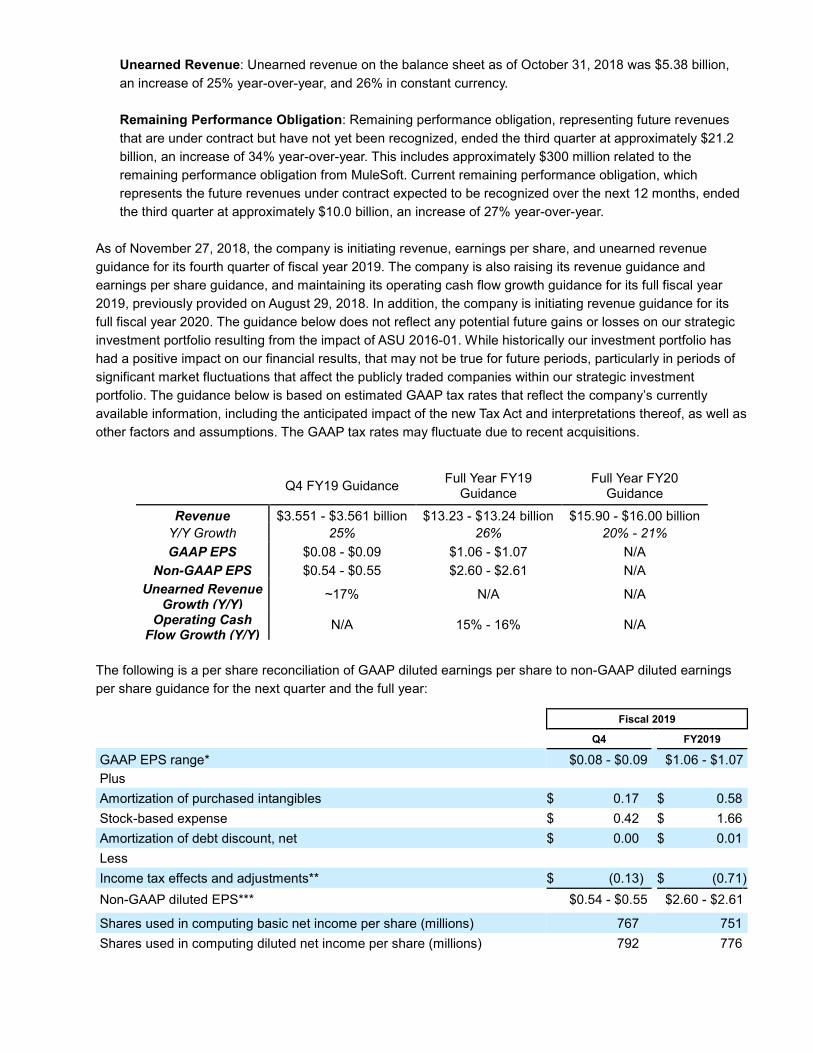
As of November 27, 2018, the company is initiating revenue, earnings per share, and unearned revenue guidance for its fourth quarter of fiscal year 2019. The company is also raising its revenue guidance and earnings per share guidance, and maintaining its operating cash flow growth guidance for its full fiscal year 2019, previously provided on August 29, 2018. In addition, the company is initiating revenue guidance for its full fiscal year 2020. The guidance below does not reflect any potential future gains or losses on our strategic investment portfolio resulting from the impact of ASU 2016-01. While historically our investment portfolio has had a positive impact on our financial results, that may not be true for future periods, particularly in periods of significant market fluctuations that affect the publicly traded companies within our strategic investment portfolio. The guidance below is based on estimated GAAP tax rates that reflect the company’s currently available information, including the anticipated impact of the new Tax Act and interpretations thereof, as well as other factors and assumptions. The GAAP tax rates may fluctuate due to recent acquisitions.
Q4 FY19 Guidance Full Year FY19 Guidance
Full Year FY20 Guidance
Revenue $3.551 - $3.561 billion $13.23 - $13.24 billion $15.90 - $16.00 billion Y/Y Growth 25% 26% 20% - 21% GAAP EPS $0.08 - $0.09 $1.06 - $1.07 N/A
Non-GAAP EPS $0.54 - $0.55 $2.60 - $2.61 N/A Unearned Revenue
Growth (Y/Y) ~17% N/A N/A
Operating Cash Flow Growth (Y/Y)
N/A 15% - 16% N/A
The following is a per share reconciliation of GAAP diluted earnings per share to non-GAAP diluted earnings per share guidance for the next quarter and the full year:
Fiscal 2019
Q4 FY2019
GAAP EPS range* $0.08 - $0.09 $1.06 - $1.07 Plus Amortization of purchased intangibles $ 0.17 $ 0.58
Stock-based expense $ 0.42 $ 1.66
Amortization of debt discount, net $ 0.00 $ 0.01
Less Income tax effects and adjustments** $ (0.13 ) $ (0.71 ) Non-GAAP diluted EPS*** $0.54 - $0.55 $2.60 - $2.61 Shares used in computing basic net income per share (millions) 767 751
Shares used in computing diluted net income per share (millions) 792 776

* The company's GAAP tax provision is expected to be approximately 13.0 percent for the three months ended January 31, 2019 and 1.2 percent for the year ended January 31, 2019. The GAAP tax rates may fluctuate due to recent acquisitions or other transactions. The company's projected GAAP basic and diluted EPS excludes potential future impacts of ASU 2016-01. ** The company's non-GAAP tax provision uses a long-term projected tax rate of 21.5 percent, which reflects currently available information and could be subject to change. *** The company's projected non-GAAP basic and diluted EPS excludes potential future impacts of ASU 2016-01. For additional information regarding non-GAAP financial measures see the reconciliation of results and related explanations below. Quarterly Conference Call Salesforce will host a conference call at 2:00 p.m. (PT) / 5:00 p.m. (ET) today to discuss its financial results with the investment community. A live web broadcast of the event will be available on the Salesforce Investor Relations website at www.salesforce.com/investor. A live dial-in is available domestically at 866-901-SFDC or 866-901-7332 and internationally at 706-902-1764, passcode 7068467. A replay will be available at (800) 585-8367 or (855) 859-2056 until midnight (ET) December 26, 2018. About Salesforce Salesforce, the global leader in CRM, empowers companies to connect with their customers in a whole new way. Salesforce has headquarters in San Francisco, with offices in Europe and Asia, and trades on the New York Stock Exchange under the ticker symbol "CRM." For more information about Salesforce, visit: www.salesforce.com.
###
"Safe harbor" statement under the Private Securities Litigation Reform Act of 1995: This press release contains forward-looking statements about our financial results, which may include expected GAAP and non-GAAP financial and other operating and non-operating results, including revenue, net income, diluted earnings per share, operating cash flow growth, operating margin improvement, unearned revenue growth, expected revenue growth, expected tax rates, stock-based compensation expenses, amortization of purchased intangibles, amortization of debt discount and shares outstanding. The achievement or success of the matters covered by such forward-looking statements involves risks, uncertainties and assumptions. If any such risks or uncertainties materialize or if any of the assumptions prove incorrect, the company’s results could differ materially from the results expressed or implied by the forward-looking statements we make. The risks and uncertainties referred to above include -- but are not limited to -- risks associated with the effect of general economic and market conditions; the impact of foreign currency exchange rate and interest rate fluctuations on our results; our business strategy and our plan to build our business, including our strategy to be the leading provider of enterprise cloud computing applications and platforms; the pace of change and innovation in enterprise cloud computing services; the competitive nature of the market in which we participate; our international expansion strategy; our service performance and security, including the resources and costs required to prevent, detect and remediate potential security breaches; the expenses associated with new data centers and third-party infrastructure providers; additional data center capacity; real estate and office facilities space; our operating results and cash flows; new services and product features; our strategy of acquiring or making investments in complementary businesses, joint ventures, services, technologies and intellectual property rights; the performance and fair value of our investments in complementary businesses through our strategic investment portfolio; our ability to realize the benefits from strategic partnerships and investments; our ability to successfully integrate acquired businesses and technologies, including the operations of MuleSoft, Inc.; our ability to continue to grow and maintain unearned revenue and remaining performance obligation; our
ability to protect our intellectual property rights; our ability to develop our brands; our reliance on third-party hardware, software and platform providers; our dependency on the development and maintenance of the infrastructure of the Internet; the effect of evolving domestic and foreign government regulations, including those related to the provision of services on the Internet, those related to accessing the Internet, and those addressing data privacy and import and export controls; the valuation of our deferred tax assets; the potential availability of additional tax assets in the future; the impact of new accounting pronouncements and tax laws, including the U.S. Tax Cuts and Jobs Act, and interpretations thereof; uncertainties affecting our ability to estimate our non-GAAP tax rate; the impact of future gains or losses from our strategic investment portfolio, including gains or losses from overall market conditions which may affect the publicly traded companies within our strategic investment portfolio; the impact of expensing stock options and other equity awards; the sufficiency of our capital resources; factors related to our outstanding debt, revolving credit facility, term loans and loan associated with 50 Fremont; compliance with our debt covenants and capital lease obligations; current and potential litigation involving us; and the impact of climate change. Further information on these and other factors that could affect the company’s financial results is included in the reports on Forms 10-K, 10-Q and 8-K and in other filings we make with the Securities and Exchange Commission from time to time. These documents are available on the SEC Filings section of the Investor Information section of the company’s website at www.salesforce.com/investor. Salesforce.com, inc. assumes no obligation and does not intend to update these forward-looking statements, except as required by law. © 2018 salesforce.com, inc. All rights reserved. Salesforce and other marks are trademarks of salesforce.com, inc. Other brands featured herein may be trademarks of their respective owners.
###
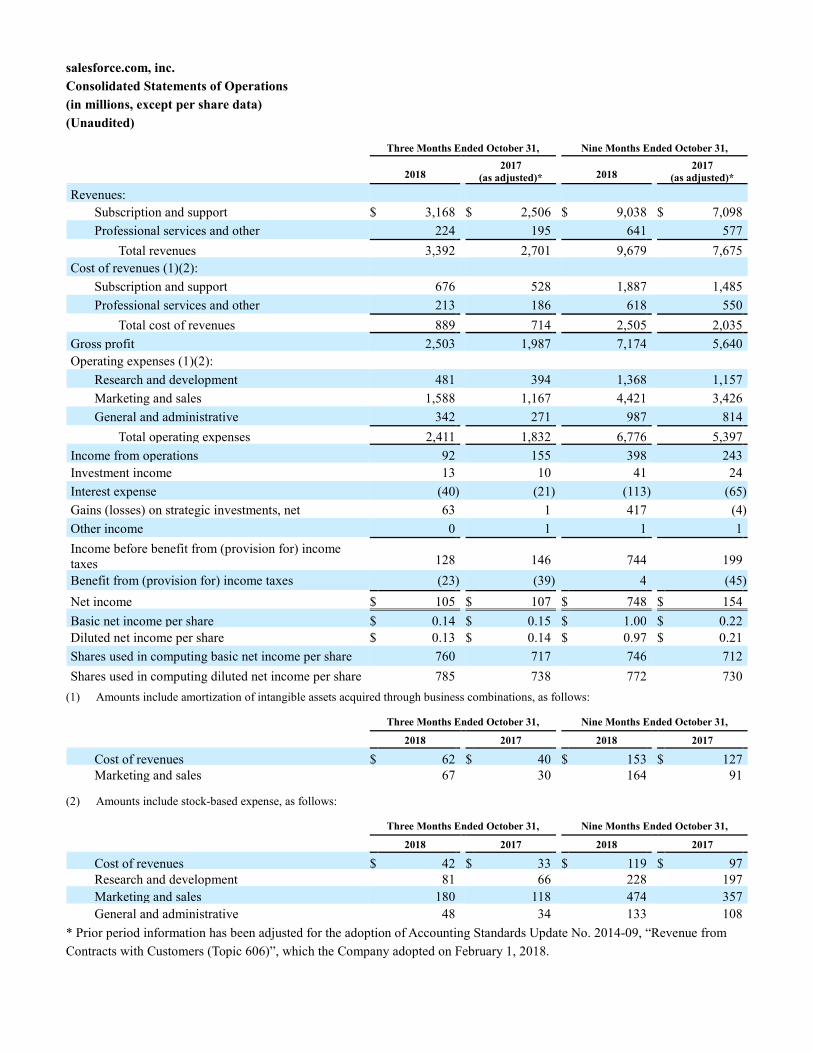
salesforce.com, inc. Consolidated Statements of Operations (in millions, except per share data) (Unaudited)
3 Three Months Ended October 31, Nine Months Ended October 31,
2018 2017 (as adjusted)* 2018 2017
(as adjusted)*
Revenues: Subscription and support $ 3,168 $ 2,506 $ 9,038 $ 7,098 Professional services and other 224 195 641 577
Total revenues 3,392 2,701 9,679 7,675 Cost of revenues (1)(2):
Subscription and support 676 528 1,887 1,485 Professional services and other 213 186 618 550
Total cost of revenues 889 714 2,505 2,035 Gross profit 2,503 1,987 7,174 5,640 Operating expenses (1)(2):
Research and development 481 394 1,368 1,157 Marketing and sales 1,588 1,167 4,421 3,426 General and administrative 342 271 987 814
Total operating expenses 2,411 1,832 6,776 5,397 Income from operations 92 155 398 243 Investment income 13 10 41 24 Interest expense (40 ) (21 ) (113 ) (65 ) Gains (losses) on strategic investments, net 63 1 417 (4 ) Other income 0 1 1 1
Income before benefit from (provision for) income taxes 128
146
744
199
Benefit from (provision for) income taxes (23 ) (39 ) 4 (45 ) Net income $ 105 $ 107 $ 748 $ 154 Basic net income per share $ 0.14 $ 0.15 $ 1.00 $ 0.22 Diluted net income per share $ 0.13 $ 0.14 $ 0.97 $ 0.21 Shares used in computing basic net income per share 760 717 746 712
Shares used in computing diluted net income per share 785 738 772 730
(1) Amounts include amortization of intangible assets acquired through business combinations, as follows:
Three Months Ended October 31, Nine Months Ended October 31,
2018 2017 2018 2017
Cost of revenues $ 62 $ 40 $ 153 $ 127 Marketing and sales 67 30 164 91
(2) Amounts include stock-based expense, as follows:
Three Months Ended October 31, Nine Months Ended October 31,
2018 2017 2018 2017
Cost of revenues $ 42 $ 33 $ 119 $ 97 Research and development 81 66 228 197 Marketing and sales 180 118 474 357 General and administrative 48 34 133 108
* Prior period information has been adjusted for the adoption of Accounting Standards Update No. 2014-09, “Revenue from Contracts with Customers (Topic 606)”, which the Company adopted on February 1, 2018.
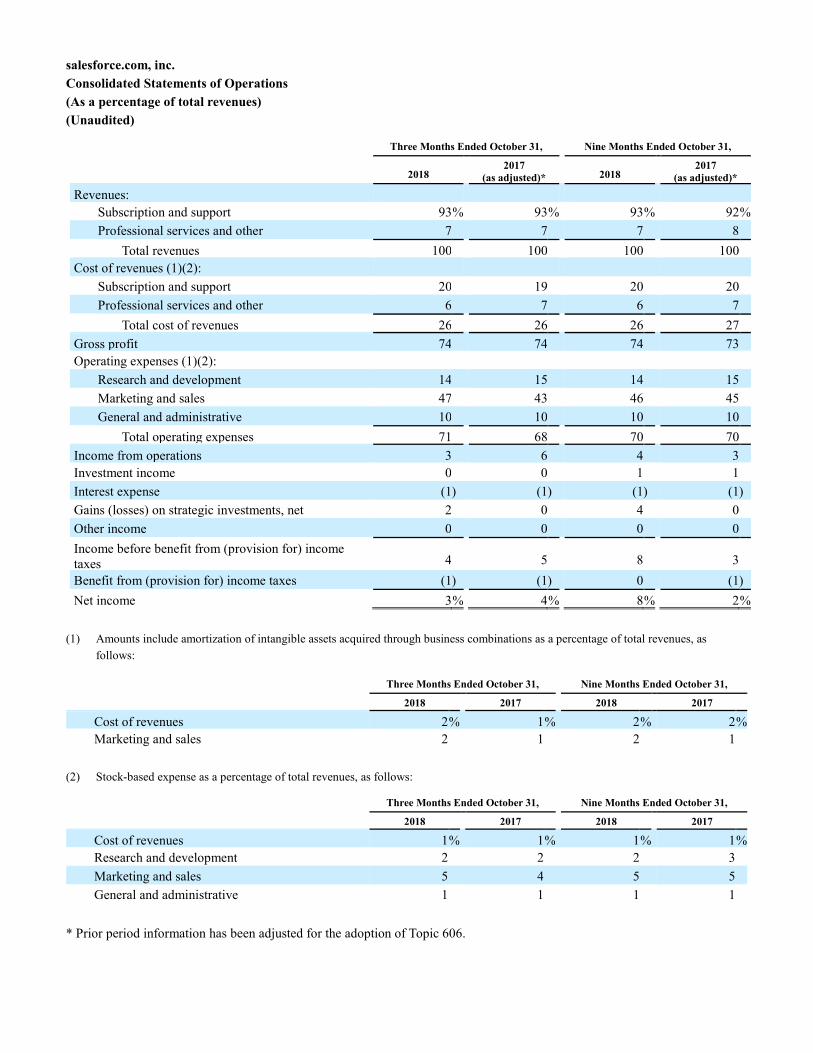
salesforce.com, inc. Consolidated Statements of Operations (As a percentage of total revenues) (Unaudited)
Three Months Ended October 31, Nine Months Ended October 31,
2018 2017 (as adjusted)* 2018 2017
(as adjusted)*
Revenues: Subscription and support 93 % 93 % 93 % 92 % Professional services and other 7 7 7 8
Total revenues 100 100 100 100 Cost of revenues (1)(2):
Subscription and support 20 19 20 20 Professional services and other 6 7 6 7
Total cost of revenues 26 26 26 27 Gross profit 74 74 74 73 Operating expenses (1)(2):
Research and development 14 15 14 15 Marketing and sales 47 43 46 45 General and administrative 10 10 10 10
Total operating expenses 71 68 70 70 Income from operations 3 6 4 3 Investment income 0 0 1 1 Interest expense (1 ) (1 ) (1 ) (1 ) Gains (losses) on strategic investments, net 2 0 4 0 Other income 0 0 0 0
Income before benefit from (provision for) income taxes 4
5
8
3
Benefit from (provision for) income taxes (1 ) (1 ) 0 (1 ) Net income 3 % 4 % 8 % 2 %
(1) Amounts include amortization of intangible assets acquired through business combinations as a percentage of total revenues, as
follows:
Three Months Ended October 31, Nine Months Ended October 31,
2018 2017 2018 2017
Cost of revenues 2 % 1 % 2 % 2 % Marketing and sales 2 1 2 1
(2) Stock-based expense as a percentage of total revenues, as follows:
Three Months Ended October 31, Nine Months Ended October 31,
2018 2017 2018 2017
Cost of revenues 1 % 1 % 1 % 1 % Research and development 2 2 2 3 Marketing and sales 5 4 5 5 General and administrative 1 1 1 1
* Prior period information has been adjusted for the adoption of Topic 606.
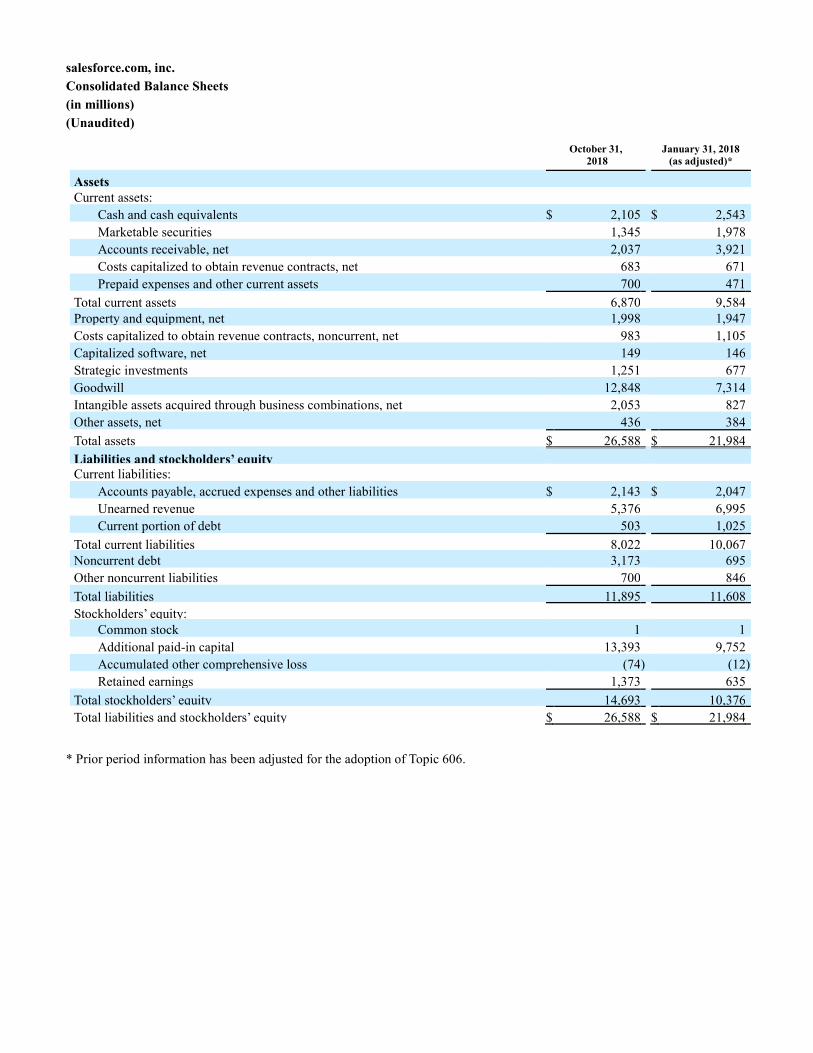
salesforce.com, inc. Consolidated Balance Sheets (in millions) (Unaudited)
October 31,
2018 January 31, 2018
(as adjusted)*
Assets Current assets:
Cash and cash equivalents $ 2,105 $ 2,543 Marketable securities 1,345 1,978 Accounts receivable, net 2,037 3,921 Costs capitalized to obtain revenue contracts, net 683 671 Prepaid expenses and other current assets 700 471
Total current assets 6,870 9,584 Property and equipment, net 1,998 1,947 Costs capitalized to obtain revenue contracts, noncurrent, net 983 1,105 Capitalized software, net 149 146 Strategic investments 1,251 677 Goodwill 12,848 7,314 Intangible assets acquired through business combinations, net 2,053 827 Other assets, net 436 384 Total assets $ 26,588 $ 21,984 Liabilities and stockholders’ equity Current liabilities:
Accounts payable, accrued expenses and other liabilities $ 2,143 $ 2,047 Unearned revenue 5,376 6,995 Current portion of debt 503 1,025
Total current liabilities 8,022 10,067 Noncurrent debt 3,173 695 Other noncurrent liabilities 700 846 Total liabilities 11,895 11,608 Stockholders’ equity:
Common stock 1 1 Additional paid-in capital 13,393 9,752 Accumulated other comprehensive loss (74 ) (12 ) Retained earnings 1,373 635
Total stockholders’ equity 14,693 10,376 Total liabilities and stockholders’ equity $ 26,588 $ 21,984
* Prior period information has been adjusted for the adoption of Topic 606.
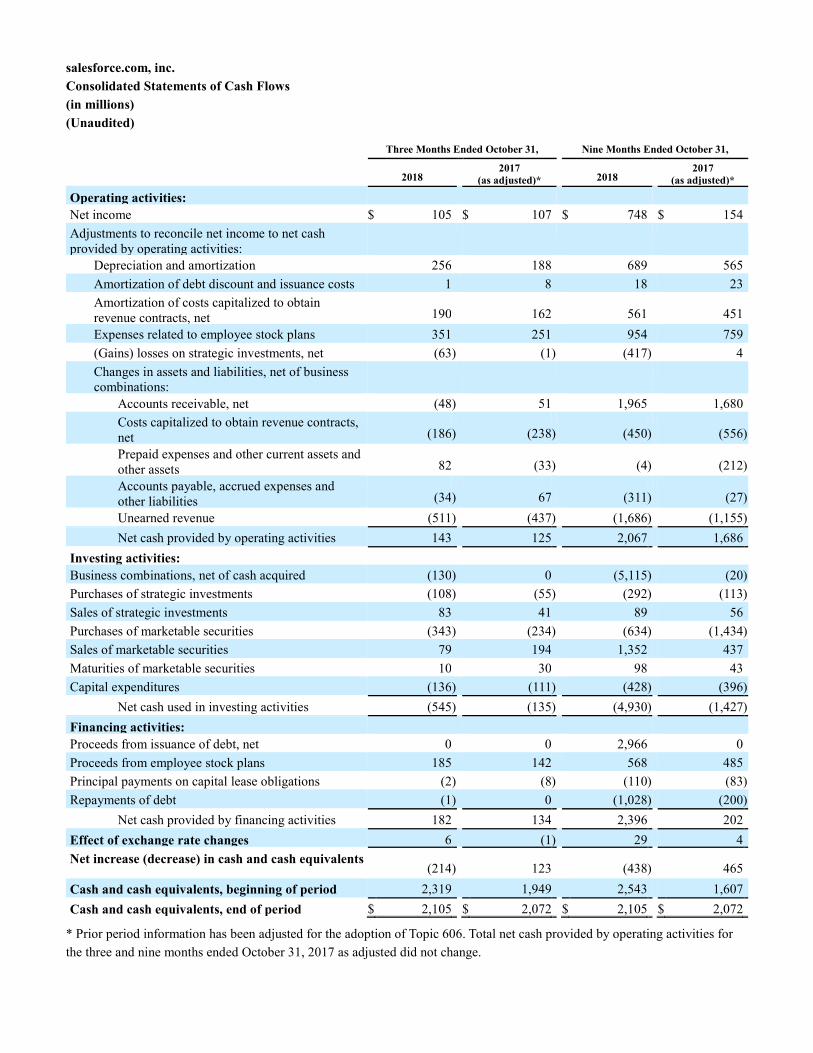
salesforce.com, inc. Consolidated Statements of Cash Flows (in millions) (Unaudited)
3 Three Months Ended October 31, Nine Months Ended October 31,
2018 2017 (as adjusted)* 2018 2017
(as adjusted)*
Operating activities: Net income $ 105 $ 107 $ 748 $ 154 Adjustments to reconcile net income to net cash provided by operating activities:
Depreciation and amortization 256 188 689 565 Amortization of debt discount and issuance costs 1 8 18 23 Amortization of costs capitalized to obtain revenue contracts, net 190
162
561
451
Expenses related to employee stock plans 351 251 954 759 (Gains) losses on strategic investments, net (63 ) (1 ) (417 ) 4 Changes in assets and liabilities, net of business combinations:
Accounts receivable, net (48 ) 51 1,965 1,680 Costs capitalized to obtain revenue contracts, net (186 ) (238 ) (450 ) (556 ) Prepaid expenses and other current assets and other assets 82
(33 ) (4 ) (212 )
Accounts payable, accrued expenses and other liabilities (34 ) 67
(311 ) (27 )
Unearned revenue (511 ) (437 ) (1,686 ) (1,155 ) Net cash provided by operating activities 143 125 2,067 1,686
Investing activities: Business combinations, net of cash acquired (130 ) 0 (5,115 ) (20 ) Purchases of strategic investments (108 ) (55 ) (292 ) (113 ) Sales of strategic investments 83 41 89 56 Purchases of marketable securities (343 ) (234 ) (634 ) (1,434 ) Sales of marketable securities 79 194 1,352 437 Maturities of marketable securities 10 30 98 43 Capital expenditures (136 ) (111 ) (428 ) (396 )
Net cash used in investing activities (545 ) (135 ) (4,930 ) (1,427 ) Financing activities: Proceeds from issuance of debt, net 0 0 2,966 0 Proceeds from employee stock plans 185 142 568 485 Principal payments on capital lease obligations (2 ) (8 ) (110 ) (83 ) Repayments of debt (1 ) 0 (1,028 ) (200 )
Net cash provided by financing activities 182 134 2,396 202
Effect of exchange rate changes 6 (1 ) 29 4 Net increase (decrease) in cash and cash equivalents
(214 ) 123 (438 ) 465
Cash and cash equivalents, beginning of period 2,319 1,949 2,543 1,607
Cash and cash equivalents, end of period $ 2,105 $ 2,072 $ 2,105 $ 2,072
* Prior period information has been adjusted for the adoption of Topic 606. Total net cash provided by operating activities for the three and nine months ended October 31, 2017 as adjusted did not change.
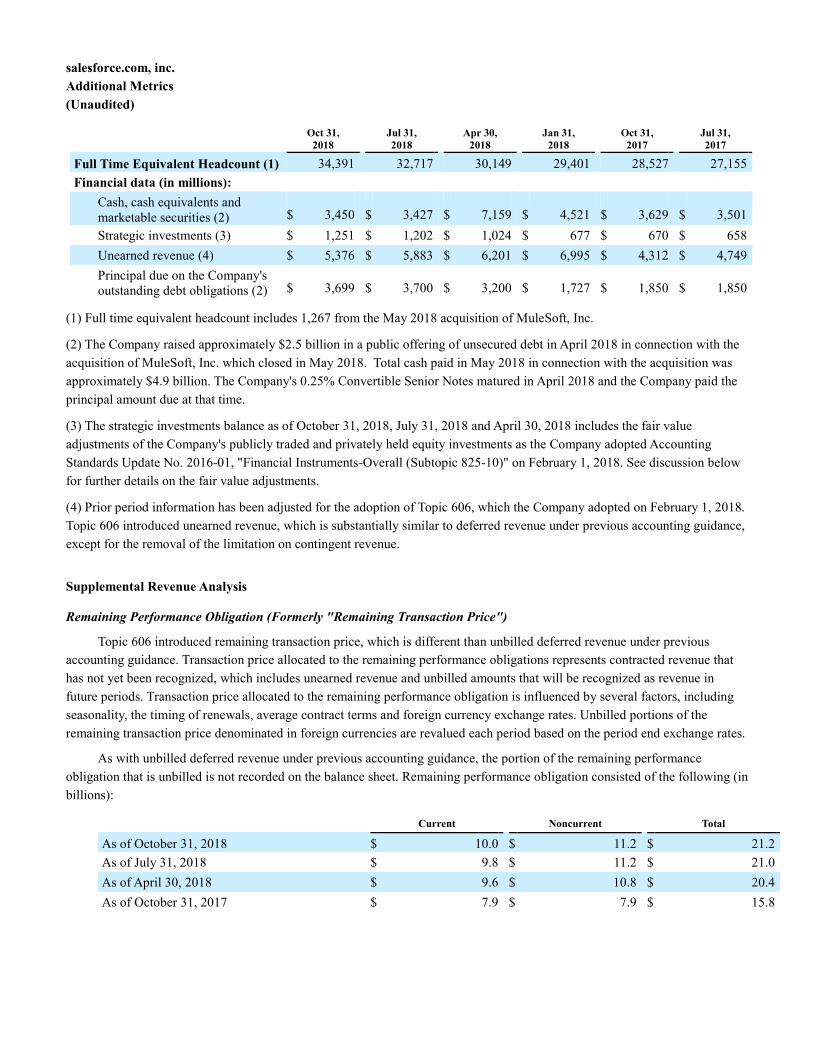
salesforce.com, inc. Additional Metrics (Unaudited)
Oct 31,
2018 Jul 31, 2018 Apr 30,
2018 Jan 31, 2018 Oct 31,
2017 Jul 31, 2017
Full Time Equivalent Headcount (1) 34,391 32,717 30,149 29,401 28,527 27,155 Financial data (in millions):
Cash, cash equivalents and marketable securities (2) $ 3,450
$ 3,427
$ 7,159
$ 4,521
$ 3,629
$ 3,501
Strategic investments (3) $ 1,251 $ 1,202 $ 1,024 $ 677 $ 670 $ 658
Unearned revenue (4) $ 5,376 $ 5,883 $ 6,201 $ 6,995 $ 4,312 $ 4,749
Principal due on the Company's outstanding debt obligations (2) $ 3,699
$ 3,700
$ 3,200
$ 1,727
$ 1,850
$ 1,850
(1) Full time equivalent headcount includes 1,267 from the May 2018 acquisition of MuleSoft, Inc.
(2) The Company raised approximately $2.5 billion in a public offering of unsecured debt in April 2018 in connection with the acquisition of MuleSoft, Inc. which closed in May 2018. Total cash paid in May 2018 in connection with the acquisition was approximately $4.9 billion. The Company's 0.25% Convertible Senior Notes matured in April 2018 and the Company paid the principal amount due at that time.
(3) The strategic investments balance as of October 31, 2018, July 31, 2018 and April 30, 2018 includes the fair value adjustments of the Company's publicly traded and privately held equity investments as the Company adopted Accounting Standards Update No. 2016-01, "Financial Instruments-Overall (Subtopic 825-10)" on February 1, 2018. See discussion below for further details on the fair value adjustments.
(4) Prior period information has been adjusted for the adoption of Topic 606, which the Company adopted on February 1, 2018. Topic 606 introduced unearned revenue, which is substantially similar to deferred revenue under previous accounting guidance, except for the removal of the limitation on contingent revenue.
Supplemental Revenue Analysis
Remaining Performance Obligation (Formerly "Remaining Transaction Price")
Topic 606 introduced remaining transaction price, which is different than unbilled deferred revenue under previous accounting guidance. Transaction price allocated to the remaining performance obligations represents contracted revenue that has not yet been recognized, which includes unearned revenue and unbilled amounts that will be recognized as revenue in future periods. Transaction price allocated to the remaining performance obligation is influenced by several factors, including seasonality, the timing of renewals, average contract terms and foreign currency exchange rates. Unbilled portions of the remaining transaction price denominated in foreign currencies are revalued each period based on the period end exchange rates.
As with unbilled deferred revenue under previous accounting guidance, the portion of the remaining performance obligation that is unbilled is not recorded on the balance sheet. Remaining performance obligation consisted of the following (in billions):
Current Noncurrent Total
As of October 31, 2018 $ 10.0 $ 11.2 $ 21.2 As of July 31, 2018 $ 9.8 $ 11.2 $ 21.0
As of April 30, 2018 $ 9.6 $ 10.8 $ 20.4
As of October 31, 2017 $ 7.9 $ 7.9 $ 15.8

Disaggregation of Revenue
Subscription and support revenue by cloud service offering (in millions): Three Months Ended October 31, Nine Months Ended October 31,
2018 2017 (as adjusted)* 2018 2017
(as adjusted)*
Sales Cloud $ 1,020 $ 921 $ 2,989 $ 2,642 Service Cloud 917 738 2,657 2,094
Salesforce Platform and Other 742 491 2,029 1,378
Marketing and Commerce Cloud 489 356 1,363 984
$ 3,168 $ 2,506 $ 9,038 $ 7,098 Total revenues by geography (in millions): Three Months Ended October 31, Nine Months Ended October 31,
2018 2017 (as adjusted)* 2018 2017
(as adjusted)*
Americas $ 2,425 $ 1,942 $ 6,864 $ 5,575 Europe 641 499 1,876 1,374
Asia Pacific 326 260 939 726
$ 3,392 $ 2,701 $ 9,679 $ 7,675 Total revenues by geography as a percentage of total revenues: Three Months Ended October 31, Nine Months Ended October 31,
2018 2017 (as adjusted)* 2018 2017
(as adjusted)*
Americas 71 % 72 % 71 % 73 % Europe 19 18 19 18
Asia Pacific 10 10 10 9
100 % 100 % 100 % 100 %
* Prior period information has been adjusted for the adoption of Topic 606.
Constant Currency Growth Rates
The Company presents constant currency information to provide a framework for assessing how the Company's underlying business performed excluding the effect of foreign currency rate fluctuations. To present this information, current and comparative prior period results for entities reporting in currencies other than United States dollars are converted into United States dollars at the weighted average exchange rate for the quarter being compared to for growth rate calculations presented, rather than the actual exchange rates in effect during that period.
Revenue constant currency growth rates (as compared to the comparable prior periods as adjusted for Topic 606) were as follows:
Three Months Ended October 31, 2018 compared
to Three Months Ended October 31, 2017
Three Months Ended July 31, 2018 compared to Three Months Ended
July 31, 2017
Three Months Ended October 31, 2017 compared
to Three Months Ended October 31, 2016
Americas 25% 25% 20% Europe 31% 32% 34% Asia Pacific 26% 28% 28% Total growth 26% 27% 23%
The Company presents constant currency information for unearned revenue to provide a framework for assessing how the Company's underlying business performed excluding the effects of foreign currency rate fluctuations. To present the information, the Company converted the unearned revenue balances in local currencies in previous comparable periods using the United States dollar currency exchange rate as of the most recent balance sheet date.
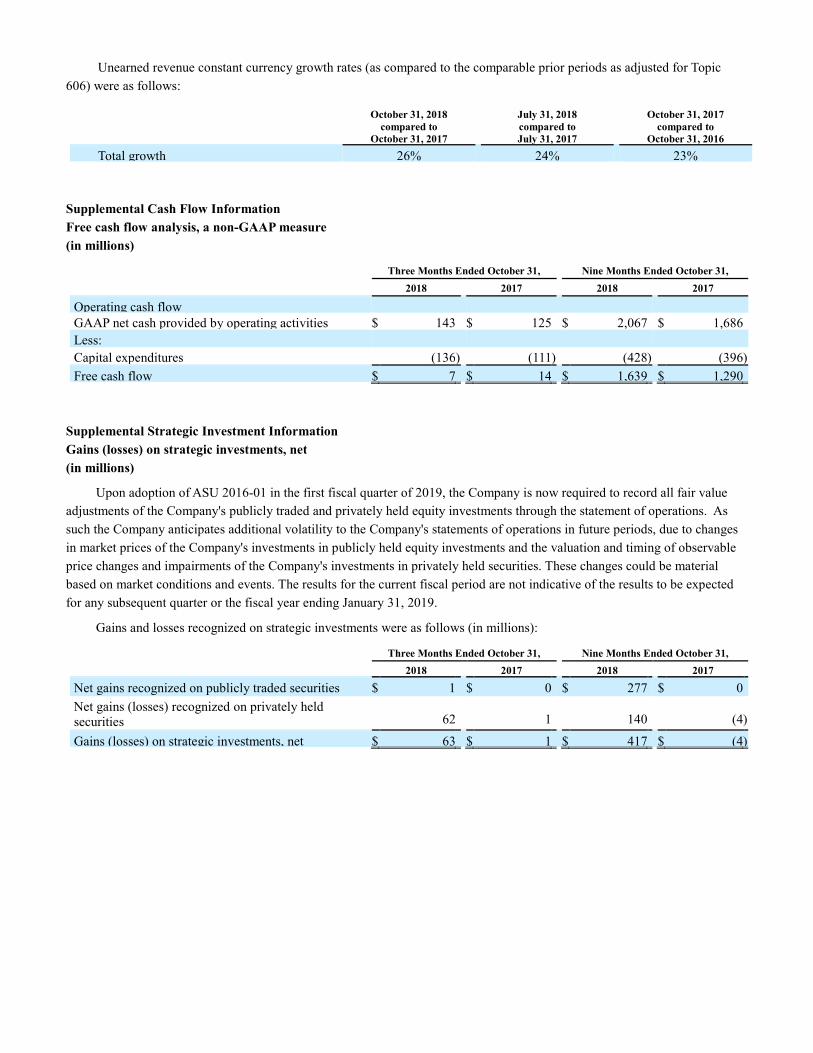
Unearned revenue constant currency growth rates (as compared to the comparable prior periods as adjusted for Topic 606) were as follows:
October 31, 2018
compared to October 31, 2017
July 31, 2018 compared to July 31, 2017
October 31, 2017 compared to
October 31, 2016
Total growth 26% 24% 23%
Supplemental Cash Flow Information Free cash flow analysis, a non-GAAP measure (in millions)
Three Months Ended October 31, Nine Months Ended October 31,
2018 2017 2018 2017
Operating cash flow GAAP net cash provided by operating activities $ 143 $ 125 $ 2,067 $ 1,686 Less: Capital expenditures (136 ) (111 ) (428 ) (396 ) Free cash flow $ 7 $ 14 $ 1,639 $ 1,290
Supplemental Strategic Investment Information Gains (losses) on strategic investments, net (in millions)
Upon adoption of ASU 2016-01 in the first fiscal quarter of 2019, the Company is now required to record all fair value adjustments of the Company's publicly traded and privately held equity investments through the statement of operations. As such the Company anticipates additional volatility to the Company's statements of operations in future periods, due to changes in market prices of the Company's investments in publicly held equity investments and the valuation and timing of observable price changes and impairments of the Company's investments in privately held securities. These changes could be material based on market conditions and events. The results for the current fiscal period are not indicative of the results to be expected for any subsequent quarter or the fiscal year ending January 31, 2019.
Gains and losses recognized on strategic investments were as follows (in millions):
Three Months Ended October 31, Nine Months Ended October 31,
2018 2017 2018 2017
Net gains recognized on publicly traded securities $ 1 $ 0 $ 277 $ 0 Net gains (losses) recognized on privately held securities 62
1
140
(4 )
Gains (losses) on strategic investments, net $ 63 $ 1 $ 417 $ (4 )

Supplemental Debt Information (in millions)
The carrying values of the Company's borrowings were as follows:
Instrument Date of issuance Maturity date October 31, 2018 January 31, 2018
2021 Term Loan May 2018 May 2021 $ 499 $ 0 2023 Senior Notes April 2018 April 2023 992 0
2028 Senior Notes April 2018 April 2028 1,488 0
2019 Term Loan July 2016 July 2019 499 498
Loan assumed on 50 Fremont February 2015 June 2023 198 199
0.25% Convertible Senior Notes March 2013 April 2018 0 1,023
Total carrying value of debt 3,676 1,720 Less current portion of debt (503 ) (1,025 ) Total noncurrent debt $ 3,173 $ 695

Selected Balance Sheet Accounts (in millions):
October 31,
2018 July 31,
2018 January 31, 2018
(as adjusted)*
Prepaid Expenses and Other Current Assets Prepaid income taxes $ 12 $ 15 $ 33
Other taxes receivable 33 39 33
Prepaid expenses and other current assets 655 672 405
$ 700 $ 726 $ 471
Property and Equipment, net Land $ 184 $ 184 $ 184
Buildings and building improvements 630 629 626
Computers, equipment and software 1,723 1,700 1,629
Furniture and fixtures 171 156 139
Leasehold improvements 1,016 952 825
Property and equipment, gross 3,724 3,621 3,403 Less accumulated depreciation and amortization (1,726 ) (1,635 ) (1,456 )
$ 1,998 $ 1,986 $ 1,947
Intangible Assets Acquired Through Business Combinations, net Acquired developed technology $ 601 $ 500 $ 350
Customer relationships 1,442 1,465 472
Other 10 11 5
$ 2,053 $ 1,976 $ 827
Other Assets, net Deferred income taxes, noncurrent, net $ 46 $ 43 $ 36
Long-term deposits 25 25 24
Domain names and patents, net 28 33 23
Customer contract assets resulting from business combinations 144 170 159
Other 193 188 142
$ 436 $ 459 $ 384
Accounts Payable, Accrued Expenses and Other Liabilities Accounts payable $ 160 $ 201 $ 76
Accrued compensation 787 674 1,001
Accrued income and other taxes payable 263 303 306
Capital lease obligation, current 203 205 103
Other current liabilities 730 700 561
$ 2,143 $ 2,083 $ 2,047
Other Noncurrent Liabilities Deferred income taxes and income taxes payable $ 188 $ 136 $ 121
Financing obligation - leased facility 196 197 198
Long-term lease liabilities and other 316 320 527
$ 700 $ 653 $ 846
* Prior period information has been adjusted for the adoption of Topic 606.

Comprehensive Income (in millions) (Unaudited)
3 Three Months Ended October 31, Nine Months Ended October 31,
2018 2017 (as adjusted) 2018 2017 (as adjusted)
Net income $ 105 $ 107 * $ 748 $ 154 * Other comprehensive income (loss), net of reclassification adjustments:
Foreign currency translation and other gains (losses) (10 ) 7 * (37 ) 37 * Unrealized gains (losses) on marketable securities and strategic investments (14 ) (12 ) (18 ) 51
Other comprehensive income (loss), net (24 ) (5 ) (55 ) 88
Comprehensive income $ 81 $ 102 $ 693 $ 242
* Prior period information has been adjusted for the adoption of Topic 606.
Supplemental Diluted Share Count Information (share data in millions)
Three Months Ended October 31, Nine Months Ended October 31,
2018 2017 2018 2017
Weighted-average shares outstanding for basic earnings per share 760
717
746
712
Effect of dilutive securities: Convertible senior notes 0 5 1 5
Employee stock awards 25 15 22 13
Warrants 0 1 3 0
Adjusted weighted-average shares outstanding and assumed conversions for diluted earnings per share 785
738
772
730
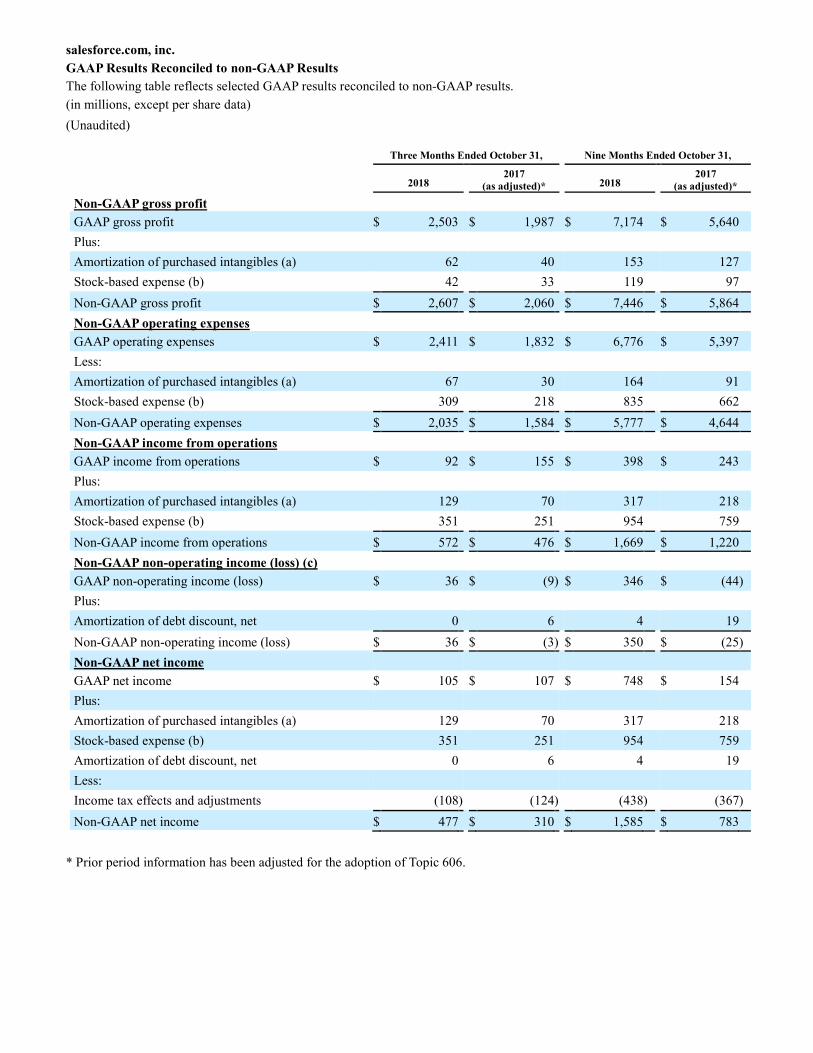
salesforce.com, inc. GAAP Results Reconciled to non-GAAP Results The following table reflects selected GAAP results reconciled to non-GAAP results. (in millions, except per share data) (Unaudited)
Three Months Ended October 31, Nine Months Ended October 31,
2018 2017 (as adjusted)* 2018 2017
(as adjusted)*
Non-GAAP gross profit GAAP gross profit $ 2,503 $ 1,987 $ 7,174 $ 5,640
Plus: Amortization of purchased intangibles (a) 62 40 153 127
Stock-based expense (b) 42 33 119 97
Non-GAAP gross profit $ 2,607 $ 2,060 $ 7,446 $ 5,864
Non-GAAP operating expenses GAAP operating expenses $ 2,411 $ 1,832 $ 6,776 $ 5,397
Less: Amortization of purchased intangibles (a) 67 30 164 91
Stock-based expense (b) 309 218 835 662
Non-GAAP operating expenses $ 2,035 $ 1,584 $ 5,777 $ 4,644
Non-GAAP income from operations GAAP income from operations $ 92 $ 155 $ 398 $ 243
Plus: Amortization of purchased intangibles (a) 129 70 317 218
Stock-based expense (b) 351 251 954 759
Non-GAAP income from operations $ 572 $ 476 $ 1,669 $ 1,220
Non-GAAP non-operating income (loss) (c) GAAP non-operating income (loss) $ 36 $ (9 ) $ 346 $ (44 ) Plus: Amortization of debt discount, net 0 6 4 19
Non-GAAP non-operating income (loss) $ 36 $ (3 ) $ 350 $ (25 ) Non-GAAP net income GAAP net income $ 105 $ 107 $ 748 $ 154
Plus: Amortization of purchased intangibles (a) 129 70 317 218
Stock-based expense (b) 351 251 954 759
Amortization of debt discount, net 0 6 4 19
Less: Income tax effects and adjustments (108 ) (124 ) (438 ) (367 ) Non-GAAP net income $ 477 $ 310 $ 1,585 $ 783
* Prior period information has been adjusted for the adoption of Topic 606.

Three Months Ended October 31, Nine Months Ended October 31,
2018 2017 (as adjusted)* 2018 2017
(as adjusted)*
Non-GAAP diluted earnings per share GAAP diluted net income per share $ 0.13 $ 0.14 $ 0.97 $ 0.21
Plus: Amortization of purchased intangibles 0.17 0.10 0.41 0.30
Stock-based expense 0.45 0.34 1.23 1.04
Amortization of debt discount, net 0.00 0.01 0.01 0.02
Less: Income tax effects and adjustments (0.14 ) (0.17 ) (0.57 ) (0.50 ) Non-GAAP diluted earnings per share $ 0.61 $ 0.42 $ 2.05 $ 1.07
Shares used in computing Non-GAAP diluted net income per share 785
738
772
730
* Prior period information has been adjusted for the adoption of Topic 606. a) Amortization of purchased intangibles were as follows:
Three Months Ended October 31, Nine Months Ended October 31,
2018 2017 2018 2017
Cost of revenues $ 62 $ 40 $ 153 $ 127 Marketing and sales 67 30 164 91
$ 129 $ 70 $ 317 $ 218
b) Stock-based expense was as follows:
Three Months Ended October 31, Nine Months Ended October 31,
2018 2017 2018 2017
Cost of revenues $ 42 $ 33 $ 119 $ 97 Research and development 81 66 228 197 Marketing and sales 180 118 474 357 General and administrative 48 34 133 108
$ 351 $ 251 $ 954 $ 759
c) GAAP non-operating income (loss) consists of investment income, interest expense, gains on strategic investments, net
and other income.
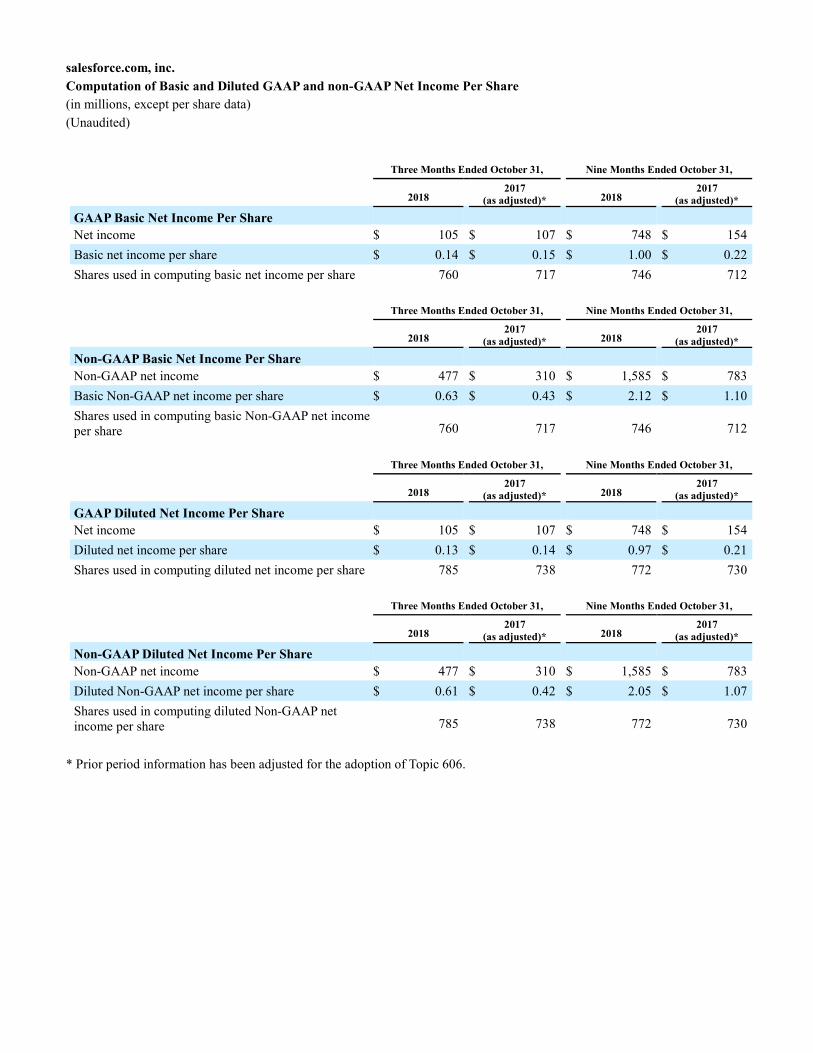
salesforce.com, inc. Computation of Basic and Diluted GAAP and non-GAAP Net Income Per Share (in millions, except per share data) (Unaudited)
Three Months Ended October 31, Nine Months Ended October 31,
2018 2017 (as adjusted)* 2018 2017
(as adjusted)*
GAAP Basic Net Income Per Share Net income $ 105 $ 107 $ 748 $ 154
Basic net income per share $ 0.14 $ 0.15 $ 1.00 $ 0.22
Shares used in computing basic net income per share 760 717 746 712
Three Months Ended October 31, Nine Months Ended October 31,
2018 2017 (as adjusted)* 2018 2017
(as adjusted)*
Non-GAAP Basic Net Income Per Share Non-GAAP net income $ 477 $ 310 $ 1,585 $ 783
Basic Non-GAAP net income per share $ 0.63 $ 0.43 $ 2.12 $ 1.10
Shares used in computing basic Non-GAAP net income per share 760
717
746
712
Three Months Ended October 31, Nine Months Ended October 31,
2018 2017 (as adjusted)* 2018 2017
(as adjusted)*
GAAP Diluted Net Income Per Share Net income $ 105 $ 107 $ 748 $ 154
Diluted net income per share $ 0.13 $ 0.14 $ 0.97 $ 0.21
Shares used in computing diluted net income per share 785 738 772 730
Three Months Ended October 31, Nine Months Ended October 31,
2018 2017 (as adjusted)* 2018 2017
(as adjusted)*
Non-GAAP Diluted Net Income Per Share Non-GAAP net income $ 477 $ 310 $ 1,585 $ 783
Diluted Non-GAAP net income per share $ 0.61 $ 0.42 $ 2.05 $ 1.07
Shares used in computing diluted Non-GAAP net income per share 785
738
772
730
* Prior period information has been adjusted for the adoption of Topic 606.
Non-GAAP Financial Measures: This press release includes information about non-GAAP diluted earnings per share, non-GAAP tax rates, non-GAAP free cash flow, and constant currency revenue and constant currency unearned revenue growth rates (collectively the “non-GAAP financial measures”). These non-GAAP financial measures are measurements of financial performance that are not prepared in accordance with U.S. generally accepted accounting principles and computational methods may differ from those used by other companies. Non-GAAP financial measures are not meant to be considered in isolation or as a substitute for comparable GAAP measures and should be read only in conjunction with the company’s consolidated financial statements prepared in accordance with GAAP. Management uses both GAAP and non-GAAP measures when planning, monitoring, and evaluating the company’s performance. The primary purpose of using non-GAAP measures is to provide supplemental information that may prove useful to investors and to enable investors to evaluate the company’s results in the same way management does. Management believes that supplementing GAAP disclosure with non-GAAP disclosure provides investors with a more complete view of the company’s operational performance and allows for meaningful period-to-period comparisons and analysis of trends in the company’s business. Further, to the extent that other companies use similar methods in calculating non-GAAP measures, the provision of supplemental non-GAAP information can allow for a comparison of the company’s relative performance against other companies that also report non-GAAP operating results. Non-GAAP diluted earnings per share excludes, to the extent applicable, the impact of the following items: stock-based compensation, amortization of acquisition-related intangibles, and previously the net amortization of debt discount on the company’s convertible senior notes, as well as income tax adjustments. These items are excluded because the decisions that give rise to them are not made to increase revenue in a particular period, but instead for the company’s long-term benefit over multiple periods. Specifically, management is excluding the following items from its non-GAAP earnings per share, as applicable, for the periods presented in the Q3 FY19 financial statements and for its non-GAAP estimates for Q4 and FY19:
• Stock-Based Expenses: The company’s compensation strategy includes the use of stock-based compensation to attract and retain employees and executives. It is principally aimed at aligning their interests with those of our stockholders and at long-term employee retention, rather than to motivate or reward operational performance for any particular period. Thus, stock-based compensation expense varies for reasons that are generally unrelated to operational decisions and performance in any particular period.
• Amortization of Purchased Intangibles: The company views amortization of acquisition-related intangible assets, such as the amortization of the cost associated with an acquired company’s research and development efforts, trade names, customer lists and customer relationships, and in some cases, acquired lease intangibles, as items arising from pre-acquisition activities determined at the time of an acquisition. While these intangible assets are continually evaluated for impairment, amortization of the cost of purchased intangibles is a static expense, one that is not typically affected by operations during any particular period.
• Gains on Strategic Investments, net: Upon the adoption of Accounting Standards Update 2016-01 on February 1, 2018, the company is required to record all fair value adjustments to its equity securities held within the strategic investment portfolio through the statement of operations. As a result of potential and unknown market volatility, the company excludes any potential future
gains or losses on its strategic investment portfolio from both its GAAP and non-GAAP estimates for future periods.
• Income Tax Effects and Adjustments: The company utilizes a fixed long-term projected non-GAAP tax rate in order to provide better consistency across the interim reporting periods by eliminating the effects of items such as changes in the tax valuation allowance and tax effects of acquisitions-related costs, since each of these can vary in size and frequency. When projecting this long-term rate, the company evaluated a three-year financial projection that excludes the direct impact of the following non-cash items: stock-based expenses, amortization of purchased intangibles, and previously the amortization of debt discount. The projected rate also assumes no new acquisitions in the three-year period, and considers other factors including the company’s expected tax structure, its tax positions in various jurisdictions and key legislation in major jurisdictions where the company operates. For fiscal 2019, the company uses a projected non-GAAP tax rate of 21.5 percent, which reflects currently available information, including the anticipated impact of the Tax Act and interpretations thereof, as well as other factors and assumptions. The non-GAAP tax rate could be subject to change for a variety of reasons, including the company’s ongoing analysis of the Tax Act over the measurement period, the rapidly evolving global tax environment, significant changes in the company’s geographic earnings mix including due to acquisition activity, or other changes to the company’s strategy or business operations. The company will re-evaluate its long-term rate as appropriate.
The company defines the non-GAAP measure free cash flow as GAAP net cash provided by operating activities, less capital expenditures. For this purpose, capital expenditures does not include our strategic investments.