sallie mae · 2019-05-10 · 2019 barclays americas select franchise conference may 14, 2019. 2...
TRANSCRIPT

SALLIE MAESTEVE MCGARRY EVP AND CFO
2019 Barclays Americas Select Franchise Conference
May 14, 2019

2
Forward-Looking Statements and Disclaimer
Cautionary Note Regarding Forward-Looking Statements
The following information is current as of April 17, 2019 (unless otherwise noted) and should be read in connection with the press release of SLM Corporation (the “Company”) announcing its financial results for the quarter ended March 31, 2019, the Form 10-Q for the quarter ended March 31, 2019 (filed with the Securities and Exchange Commission (“SEC”) on April 17, 2019), and subsequent reports filed with the SEC.
This Presentation contains “forward-looking” statements and information based on management’s current expectations as of the date of this Presentation. Statements that are not historical facts, including statements about the Company’s beliefs, opinions or expectations and statements that assume or are dependent upon future events, are forward-looking statements. This includes, but is not limited to, the Company’s expectation and ability to pay a quarterly cash dividend on its common stock in the future, subject to the determination by the Company’s Board of Directors, and based on an evaluation of the Company’s earnings, financial condition and requirements, business conditions, capital allocation determinations, and other factors, risks and uncertainties. Forward-looking statements are subject to risks, uncertainties, assumptions and other factors that may cause actual results to be materially different from those reflected in such forward-looking statements. These factors include, among others, the risks and uncertainties set forth in Item 1A. “Risk Factors” and elsewhere in the Company’s Annual Report on Form 10-K for the year ended Dec. 31, 2018 (filed with the SEC on Feb. 28, 2019) and subsequent filings with the SEC; increases in financing costs; limits on liquidity; increases in costs associated with compliance with laws and regulations; failure to comply with consumer protection, banking and other laws; changes in accounting standards and the impact of related changes in significant accounting estimates; any adverse outcomes in any significant litigation to which the Company or any subsidiary is a party; credit risk associated with the Company’s (or any subsidiary's) exposure to third parties, including counterparties to the Company’s (or any subsidiary's) derivative transactions; and changes in the terms of education loans and the educational credit marketplace (including changes resulting from new laws and the implementation of existing laws). The Company could also be affected by, among other things: changes in its funding costs and availability; reductions to its credit ratings; cybersecurity incidents and cyberattacks and other failures or breaches of its operating systems or infrastructure, including those of third-party vendors; damage to its reputation; risks associated with restructuring initiatives, including failures to successfully implement cost-cutting programs and the adverse effects of such initiatives on the Company’s business; changes in the demand for educational financing or in financing preferences of lenders, educational institutions, students and their families; changes in law and regulations with respect to the student lending business and financial institutions generally; changes in banking rules and regulations, including increased capital requirements; increased competition from banks and other consumer lenders; the creditworthiness of customers; changes in the general interest rate environment, including the rate relationships among relevant money-market instruments and those of earning assets versus funding arrangements; rates of prepayments on the loans made or acquired by the Company and its subsidiaries; changes in general economic conditions and the Company’s ability to successfully effectuate any acquisitions; and other strategic initiatives. The preparation of the Company’s consolidated financial statements also requires management to make certain estimates and assumptions, including estimates and assumptions about future events. These estimates or assumptions may prove to be incorrect. All forward-looking statements contained in this Presentation are qualified by these cautionary statements and are made only as of the date of this Presentation. The Company does not undertake any obligation to update or revise these forward-looking statements to conform such statements to actual results or changes in its expectations.
The Company reports financial results on a GAAP basis and also provides certain non-GAAP “Core Earnings” performance measures. The difference between the Company’s “Core Earnings” and GAAP results for the periods presented were the unrealized, mark-to-market gains/losses on derivative contracts (excluding current period accruals on the derivative instruments), net of tax. These are recognized in GAAP, but not in “Core Earnings” results. The Company provides “Core Earnings” measures because this is what management uses when making management decisions regarding the Company’s performance and the allocation of corporate resources. The Company’s “Core Earnings” are not defined terms within GAAP and may not be comparable to similarly titled measures reported by other companies.
For additional information, see “Management’s Discussion and Analysis of Financial Condition and Results of Operations –’Core Earnings’” in the Company’s Quarterly Report on Form 10-Q for the quarter ended March 31, 2019 for a further discussion and the “’Core Earnings’ to GAAP Reconciliation” table in this Presentation for a complete reconciliation between GAAP net income and “Core Earnings”.

3
Sallie Mae Opportunity:
Creating shareholder value by growing a unique and
sustainable financial franchise

4
Putting the pieces together
Market Leading Brand
Competitive Product Offering
Quality Growth Through Rigorous
Underwriting
Strong Financial Returns

5
Market leading brand, products and best-in-class service
drive our success
• 40 years of leadership in the education lending market
• Top ranked brand
• Industry leading 55% market share1
• Over 2,400 actively managed university relationships across the U.S.
• Appear on 98% of preferred lender lists
• Largest salesforce in the industry
Market Leading Brand
Conservative Funding and Underwriting
Consistent Credit
Performance
Strong Financial Returns

6
Private Student Loan Industry
• Private education loans represent 2% of the overall spend in higher education annually
• Total spend on higher education grows 2-3% annually primarily due to increases in cost of attendance
• Attainment of a four-year college degree or more is up 11% between 2012 and 20172
Federal Loans$94
Private Education Loans
$11
Family Contribution
$189
Grants$129
Other$18
$441 BillionAnnually

7
Unemployment rates and earnings by educational attainment, 2017
1.5%
1.5%
2.2%
2.5%
3.4%
4.0%
4.6%
6.5%
Doctoral Degree
Professional Degree
Master's Degree
Bachelor's Degree
Associate's degree
Some college, no degree
High School diploma
Less than a high school diploma
Unemployment rate
Total: 3.6%
$520
$712
$774
$836
$1,173
$1,401
$1,836
$1,743
Median usual weekly earnings
All workers: $907
Higher Education Value Proposition
• The unemployment rate for individuals age 25-34 with four-year college degrees was 2.3%, compared to 5.8% for high school graduates4
• 60% of students graduated with student loans in AY 2015-20165
• Of the 60% of bachelor’s degree recipients who graduated with student loans, the average debt amount was $39,4005
2

8
Product suite tailored to meet the needs of undergraduate
and graduate students
• Smart Option Student Loan
• Introduced in 2009
• Flexible repayment options while in school
• Fixed and Variable rates
• Differentiated products for undergraduates and graduate students
Market Leading Brand
Conservative Funding and Underwriting
Consistent Credit
Performance
Strong Financial Returns

9
Product Overview
Undergraduate
Parent
Medical
Dental
MBA
Law
Health Professions
General Studies
Undergraduate Graduate Parent
Rate Type Variable & Fixed Variable & Fixed Variable & Fixed
Variable: LIBOR + 2.00% - LIBOR + 9.88% Variable: LIBOR + 2.25% - LIBOR + 7.88% Variable: LIBOR + 3.50% - LIBOR + 9.88%
Fixed: 5.75% - 12.88% Fixed: 6.25% - 10.50% Fixed: 5.75% - 12.88%
Repayment OptionDeferred, Interest Only & Fixed
Repayment
Deferred, Interest Only & Fixed
RepaymentInterest Only, Full P&I
Repayment Term 5-15 years20 years for Medical and Dental
15 years for Remaining Disciplines10 years
Grace Period 6 months 6-36 months None
Internship/Residency
DefermentUp to 60 months Up to 48 months None
Features
ACH discount | FICO® Score | Cosigner
Release | GRP | Study StarterSM | Student
Death & Disability Release
ACH discount | FICO® Score | Cosigner
Release | GRP | Student Death &
Disability Release
ACH discount | FICO® Score | Study
StarterSM | Student Death & Disability
Release
Interest Rate Ranges

10
Consistent underwriting has contributed to better than
model credit performance
• Proprietary Scorecard built with Experian Decision Analytics
• Initial credit screen removes applicants with low FICO scores or prior derogatory trades on file
• Manually review ~8% of applications
• Through-the-cycle data was used to develop our conservative underwriting models.
Market Leading Brand
Conservative Funding and Underwriting
Consistent Credit
Performance
Strong Financial Returns

11
Consistent high quality originations growth6
$4,330
$4,666 $4,800
$5,315
$2,131
$0
$500
$1,000
$1,500
$2,000
$2,500
$3,000
$3,500
$4,000
$4,500
$5,000
$5,500
$6,000
2015 2016 2017 2018 2019
Ori
gin
atio
ns
($M
M)
Private Education Loan Originations
3%
7%
11%
8%
$5,700
$1,9728%

12
0%
1%
2%
3%
4%
5%
6%
7%
8%
9%
10%
0 1 2 3 4 5 6 7 8 9
Cu
mu
lati
ve
Defa
ult
s a
s a
% o
fD
isb
urs
ed
Pri
nc
ipa
l E
nte
rin
g P
& I R
ep
aym
en
t
Years Since First P&I Repayment Period
2010 2011 2012 2013 2014 2015 2016 2017 2018
High Quality, Predictable Credit Program8,9,10
Smart Option Cumulative Gross Defaults by P&I Repayment Vintage and Years Since First P&I Repayment Period
4.9%
3.4%
2.0%
0.3%

13
High Quality Portfolio Growth
As of 3/31/19:
• 78% of Private Education Loans have FICO score at approval > 7007
• 52% of Private Education Loan Borrowers make payments while in school
• 63% of Private Education Loans are variable-rate, 37% fixed-rate
$0
$5
$10
$15
$20
$25
$30
$35
2018 2021
Projected Balance Sheet Growth 2018-2021
Private FFELP Other (Personal and Credit Card)

14
Conservative funding optimizes net interest margin
Brokered $10.6b Retail $9.1bSecured Debt $4.3b
Retail MMDA & CD
23%
Retail H.S.A. & 529
15%
Brokered Fixed17%
Brokered Variable
27%
Secured Debt18%
As of 3/31/19
15
Strong financial results translate to predictable returns
to shareholders
• Consistent earnings per share growth
• High return on equity
• Stable net interest margin
• Introducing capital return programs
Market Leading Brand
Conservative Funding and Underwriting
Consistent Credit
Performance
Strong Financial Returns

16
Clear Capital Priorities
Invest in High ROE Growth
Continue to focus on high-quality Private Education Loan originations, including deeper
penetration of the graduate school market
Testing Personal Loan market
Offer credit cards to our high-quality customer base
Quarterly Dividend
Established a quarterly dividend on common stock in 2019
$0.03 per share dividend paid on 3/15/19
Share Repurchase
Stock buyback authorization of $200 million
$60 million of share authorization was repurchased in Q1 2019
Increased Shareholder
Return
Invest in High ROE Growth
Quarterly Dividend
Share Repurchases

17
CECL Update• The Financial Accounting Standards Board’s (FASB) Current Expected Credit Loss impairment
standard will require “life of loan” estimates of losses to be recorded at origination and is set to
take effect in January 2020.
• There will be an initial build of the loan loss allowance that will be booked through retained
earnings on a tax adjusted basis.
• After the initial build, additional reserves will be built as loans are originated.
• Regulators have indicated there will be no capital relief or changes to what capital levels are
classified “Well Capitalized”
Initial estimates of fully phased-in CECL (includes impact of expected common dividends and share
repurchases):
• Regulators have proposed that CECL reserves will be phased in over a three-year period.
• Sallie Mae capital ratios will exceed “Well Capitalized” after implementation of CECL.
December 31, 2020 Current Estimate
Without CECL With CECL
Total Reserve 1.9% 7.2%
Tier 1 Risk Based Capital 12.4% 11.4%
(GAAP Equity + Total Reserve)/Risk Weighted Assets 14.1% 15.3%

18
Guidance
2019 Targets
Diluted “Core Earnings” Per Share: $1.23 - $1.26
Private Education Loan Originations: $5.7 billion
Non-GAAP Efficiency Ratio: 35-36%11
Long-Term Targets
Prudently grow balance sheet without sacrificing quality
Continue to leverage operating platform and limit operating expense growth
Create long-term value to shareholders with predictable shareholder returns

19
Sallie Mae Opportunity: Creating Value while Growing
Market Leading Brand
Conservative Funding and Underwriting
Consistent Credit
Performance
Strong Financial Returns
20
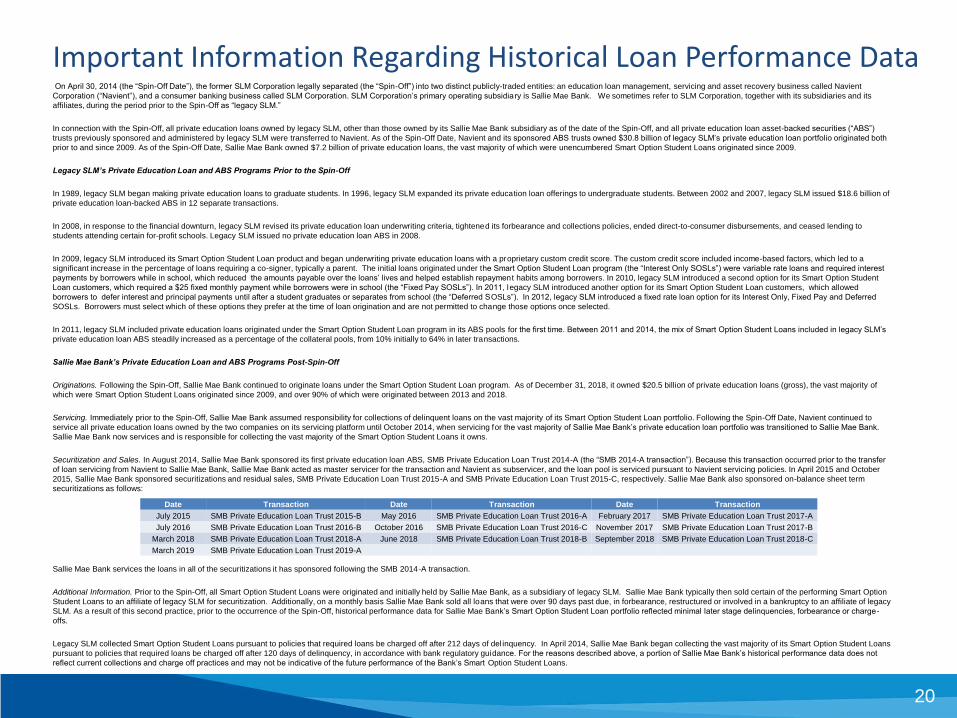
Important Information Regarding Historical Loan Performance DataOn April 30, 2014 (the “Spin-Off Date”), the former SLM Corporation legally separated (the “Spin-Off”) into two distinct publicly-traded entities: an education loan management, servicing and asset recovery business called Navient
Corporation (“Navient”), and a consumer banking business called SLM Corporation. SLM Corporation’s primary operating subsidiary is Sallie Mae Bank. We sometimes refer to SLM Corporation, together with its subsidiaries and its
affiliates, during the period prior to the Spin-Off as “legacy SLM.”
In connection with the Spin-Off, all private education loans owned by legacy SLM, other than those owned by its Sallie Mae Bank subsidiary as of the date of the Spin-Off, and all private education loan asset-backed securities (“ABS”)
trusts previously sponsored and administered by legacy SLM were transferred to Navient. As of the Spin-Off Date, Navient and its sponsored ABS trusts owned $30.8 billion of legacy SLM’s private education loan portfolio originated both
prior to and since 2009. As of the Spin-Off Date, Sallie Mae Bank owned $7.2 billion of private education loans, the vast majority of which were unencumbered Smart Option Student Loans originated since 2009.
Legacy SLM’s Private Education Loan and ABS Programs Prior to the Spin-Off
In 1989, legacy SLM began making private education loans to graduate students. In 1996, legacy SLM expanded its private education loan offerings to undergraduate students. Between 2002 and 2007, legacy SLM issued $18.6 billion of
private education loan-backed ABS in 12 separate transactions.
In 2008, in response to the financial downturn, legacy SLM revised its private education loan underwriting criteria, tightened its forbearance and collections policies, ended direct-to-consumer disbursements, and ceased lending to
students attending certain for-profit schools. Legacy SLM issued no private education loan ABS in 2008.
In 2009, legacy SLM introduced its Smart Option Student Loan product and began underwriting private education loans with a proprietary custom credit score. The custom credit score included income-based factors, which led to a
significant increase in the percentage of loans requiring a co-signer, typically a parent. The initial loans originated under the Smart Option Student Loan program (the “Interest Only SOSLs”) were variable rate loans and required interest
payments by borrowers while in school, which reduced the amounts payable over the loans’ lives and helped establish repaymen t habits among borrowers. In 2010, legacy SLM introduced a second option for its Smart Option Student
Loan customers, which required a $25 fixed monthly payment while borrowers were in school (the “Fixed Pay SOSLs”). In 2011, legacy SLM introduced another option for its Smart Option Student Loan customers, which allowed
borrowers to defer interest and principal payments until after a student graduates or separates from school (the “Deferred SOSLs”). In 2012, legacy SLM introduced a fixed rate loan option for its Interest Only, Fixed Pay and Deferred
SOSLs. Borrowers must select which of these options they prefer at the time of loan origination and are not permitted to change those options once selected.
In 2011, legacy SLM included private education loans originated under the Smart Option Student Loan program in its ABS pools for the first time. Between 2011 and 2014, the mix of Smart Option Student Loans included in legacy SLM’s
private education loan ABS steadily increased as a percentage of the collateral pools, from 10% initially to 64% in later transactions.
Sallie Mae Bank’s Private Education Loan and ABS Programs Post-Spin-Off
Originations. Following the Spin-Off, Sallie Mae Bank continued to originate loans under the Smart Option Student Loan program. As of December 31, 2018, it owned $20.5 billion of private education loans (gross), the vast majority of
which were Smart Option Student Loans originated since 2009, and over 90% of which were originated between 2013 and 2018.
Servicing. Immediately prior to the Spin-Off, Sallie Mae Bank assumed responsibility for collections of delinquent loans on the vast majority of its Smart Option Student Loan portfolio. Following the Spin-Off Date, Navient continued to
service all private education loans owned by the two companies on its servicing platform until October 2014, when servicing for the vast majority of Sallie Mae Bank’s private education loan portfolio was transitioned to Sallie Mae Bank.
Sallie Mae Bank now services and is responsible for collecting the vast majority of the Smart Option Student Loans it owns.
Securitization and Sales. In August 2014, Sallie Mae Bank sponsored its first private education loan ABS, SMB Private Education Loan Trust 2014-A (the “SMB 2014-A transaction”). Because this transaction occurred prior to the transfer
of loan servicing from Navient to Sallie Mae Bank, Sallie Mae Bank acted as master servicer for the transaction and Navient as subservicer, and the loan pool is serviced pursuant to Navient servicing policies. In April 2015 and October
2015, Sallie Mae Bank sponsored securitizations and residual sales, SMB Private Education Loan Trust 2015-A and SMB Private Education Loan Trust 2015-C, respectively. Sallie Mae Bank also sponsored on-balance sheet term
securitizations as follows:
Sallie Mae Bank services the loans in all of the securitizations it has sponsored following the SMB 2014-A transaction.
Additional Information. Prior to the Spin-Off, all Smart Option Student Loans were originated and initially held by Sallie Mae Bank, as a subsidiary of legacy SLM. Sallie Mae Bank typically then sold certain of the performing Smart Option
Student Loans to an affiliate of legacy SLM for securitization. Additionally, on a monthly basis Sallie Mae Bank sold all loans that were over 90 days past due, in forbearance, restructured or involved in a bankruptcy to an affiliate of legacy
SLM. As a result of this second practice, prior to the occurrence of the Spin-Off, historical performance data for Sallie Mae Bank’s Smart Option Student Loan portfolio reflected minimal later stage delinquencies, forbearance or charge-
offs.
Legacy SLM collected Smart Option Student Loans pursuant to policies that required loans be charged off after 212 days of del inquency. In April 2014, Sallie Mae Bank began collecting the vast majority of its Smart Option Student Loans
pursuant to policies that required loans be charged off after 120 days of delinquency, in accordance with bank regulatory guidance. For the reasons described above, a portion of Sallie Mae Bank’s historical performance data does not
reflect current collections and charge off practices and may not be indicative of the future performance of the Bank’s Smart Option Student Loans.
Date Transaction Date Transaction Date Transaction
July 2015 SMB Private Education Loan Trust 2015-B May 2016 SMB Private Education Loan Trust 2016-A February 2017 SMB Private Education Loan Trust 2017-A
July 2016 SMB Private Education Loan Trust 2016-B October 2016 SMB Private Education Loan Trust 2016-C November 2017 SMB Private Education Loan Trust 2017-B
March 2018 SMB Private Education Loan Trust 2018-A June 2018 SMB Private Education Loan Trust 2018-B September 2018 SMB Private Education Loan Trust 2018-C
March 2019 SMB Private Education Loan Trust 2019-A

21
Important Information Regarding Historical Loan Performance Data (cont.)
Types of Smart Option Student Loan Portfolio Data
The portfolio data we used in this report comes from two separate sources of information:
(1) Combined Smart Option Student Loan Portfolio Data for Legacy SLM, Navient and Sallie Mae Bank. Information in this category is presented on a combined basis for loans originated under the Smart Option Student Loan program,
whether originated by Sallie Mae Bank when it was part of legacy SLM or by Sallie Mae Bank post Spin-Off, and regardless of whether the loan is currently held by an ABS trust, or held or serviced by Navient or Sallie Mae Bank. Data in this
category is used in the tables below under the following headings:
• “Cumulative Defaults by P&I Repayment Vintage and Years Since First P&I Repayment Period” – Only for 2010-2014 P&I Repayment Vintages
This combined Smart Option Student Loan portfolio data provides insight into gross defaults of the covered vintages of Smart Option Student Loans since 2010, regardless of ownership or servicing standard. Data available for earlier
periods includes a limited number of Smart Option Student Loan product types.
Loans contained in the combined Smart Option Student Loan portfolio category were serviced by legacy SLM prior to the Spin-Off, and by either Navient or Sallie Mae Bank after the Spin-Off. As noted above, loans serviced by legacy SLM
and Navient were serviced pursuant to different policies than those loans serviced by Sallie Mae Bank after the Spin-Off. Specifically, legacy SLM charged off loans after 212 days of delinquency, and Navient has continued this policy.
Sallie Mae Bank currently charges off loans after 120 days of delinquency. All loans included in the combined Smart Option Student Loan portfolio that were serviced by legacy SLM prior to the Spin-Off were serviced pursuant to a 212-day
charge off policy. Following the Spin-Off, a portion of the loans included in the combined Smart Option Student Loan portfolio data have been serviced by Navient pursuant to a 212-day charge off policy, and a portion have been serviced by
Sallie Mae Bank pursuant to a 120-day charge off policy. As a result, future performance of loans serviced by Sallie Mae Bank may differ from the historical performance of loans reflected in this combined Smart Option Student Loan
portfolio data.
(2) Smart Option Student Loan Portfolio Data for Sallie Mae Bank Serviced Loans. Information in this category is presented for loans originated under the Smart Option Student Loan program, whether originated by Sallie Mae Bank when it
was part of legacy SLM or by Sallie Mae Bank post Spin-Off, and regardless of whether the loan is currently held by an ABS trust. All loans in this category are serviced by Sallie Mae Bank. Data in this category is used in the tables below
under the following headings:
• “Cumulative Defaults by P&I Repayment Vintage and Years Since First P&I Repayment Period” – Only for 2015-2018 P&I Repayment Vintages
In relation to cumulative defaults, the Sallie Mae Bank Serviced portfolio data provides insight into gross defaults of the Smart Option Student Loans covered and serviced by Sallie Mae Bank since 2015, regardless of ownership. We believe
historical loan performance data since 2015 is more representative of the expected performance of Smart Option Student Loans to be included in new Sallie Mae Bank trusts than data available for earlier periods.
Loans contained in the Smart Option Student Loan Portfolio Data for Sallie Mae Bank Serviced Loans category were serviced by legacy SLM prior to the Spin-Off, and by Sallie Mae Bank after the Spin-Off. Sallie Mae Bank currently
charges off loans after 120 days of delinquency.
Any data or other information presented in the following charts is for comparative purposes only, and is not to be deemed a part of any offering of securities.
A significant portion of the Smart Option Student Loan performance data described above is provided to Sallie Mae Bank by Navient under a data sharing agreement executed in connection with the Spin-Off. This data
sharing agreement expires on April 29, 2019 and, as a result, cumulative gross default data for pre-2015 P&I Repayment Vintages is held static as of December 31, 2018. Under the data sharing agreement, Navient makes no
representations or warranties to Sallie Mae Bank concerning the accuracy and completeness of information that it provided. Sallie Mae Bank has not independently verified, and is not able to verify, the accuracy or
completeness of the data provided under the agreement.

22
Smart Option Loan Program Cohort Default CurvesTerms and calculations used in the cohort default curves are defined below:
First P&I Repayment Period – The month during which a borrower is first required to make a full principal and interest payment on a loan.
P&I Repayment Vintage – The calendar year of a loan’s First P&I Repayment Period.
Disbursed Principal Entering P&I Repayment – The total amount of disbursed loan principal in a P&I Repayment Vintage, excluding any interest
capitalization.
Reported Default Data –
o For loans that default after their First P&I Repayment Period: Loans enter a particular annual P&I Repayment Vintage at different times during the
P&I Repayment Vintage year. Default data is not reported for loans in a particular annual P&I Repayment Vintage until the First P&I Repayment Period
has occurred for all loans in that annual P&I Repayment Vintage. Once reporting starts, data reflects defaults that occurred in a particular period
through the number of months since December 31 of that annual P&I Repayment Vintage year. For example, in the relevant charts and tables included
in this presentation as of March 31, 2019: (i) default data reported for loans in the 2018 P&I Repayment Vintage represents defaults occurring during
the first 3 months after a loan’s First P&I Repayment Period regardless of the month in 2018 during which the first full principal and interest payment for
that loan became due; and (ii) default data for loans in the 2017 P&I Repayment Vintage represents defaults occurring during the first 15 months after a
loan’s First P&I Repayment Period regardless of the month in 2017 during which the first full principal and interest payment for that loan became due.
o For loans that default prior to their First P&I Repayment Period: Loans defaulting prior to their First P&I Repayment Period are included in the P&I
Repayment Vintage corresponding to the calendar year in which the default occurs, and are aggregated and reported in Year 0 of that P&I Repayment
Vintage in the relevant charts and tables. For example: (a) if a loan’s First P&I Repayment Period was scheduled for 2018, but the loan defaulted in
2017, the default amount is reflected in Year 0 of the 2017 P&I Repayment Vintage; and (b) if a loan’s First P&I Repayment Period occurred in 2018,
but the loan defaulted in 2018 before that First P&I Repayment Period, the default amount is reflected in Year 0 of the 2018 P&I Repayment Vintage.
o For loans that pay off prior to their First P&I Repayment Period: Loans paid off prior to their First P&I Repayment Period are included in the
Disbursed Principal Entering P&I Repayment of the P&I Repayment Vintage corresponding to the calendar year in which the payoff occurs.
Periodic Defaults – For any loan in a particular P&I Repayment Vintage, the defaulted principal and interest is reflected in the year corresponding to the
number of years since the First P&I Repayment Period for that loan.
Cumulative Defaults – At any time for a particular P&I Repayment Vintage, the cumulative sum of Periodic Defaults for that vintage.
o Defaulted principal includes any interest capitalization that occurred prior to default
o Defaulted principal is not reduced by any amounts recovered after the loan defaulted
o Because the numerator includes capitalized interest while the denominator (i.e., Disbursed Principal Entering P&I Repayment) does not, default rates
are higher than they would be if the numerator and denominator both included capitalized interest
Note: Cumulative gross default data for pre-2015 P&I Repayment Vintages is held static as of December 31, 2018. Historical trends suggested by the cohort default triangles may not be indicative of future
performance. Legacy SLM and Navient serviced loans were serviced pursuant to a 212 day charge-off policy. Sallie Mae Bank serviced loans were serviced pursuant to a 120 day charge-off policy.

23
1. Source: MeasureOne CBA Report as of December 2017
2. U.S. Bureau of Labor Statistics, Current Population Survey
3. Source: Trends in Student Aid,© 2017 The College Board, www.collegeboard.org, U.S. Department of Education 2017
4. Source: U.S. Bureau of Labor Statistics- “More education: Lower unemployment, higher earnings” as of March 2019
5. Source: Trends in Student Aid,© 2017 The College Board, www.collegeboard.org, U.S. Department of Education 2017
6. Originations represent loans that were funded or acquired during the period presented.
7. Represents the higher credit score of the cosigner or the borrower.
8. For important information regarding historical performance data and an explanation of the data and calculations underlying this chart, see pages 20-22
9. For 2010-2014 P&I Repayment Vintages Only- Data static as of December 31, 2018 for Legacy SLM, Navient and Sallie Mae Bank serviced portfolios
combined. Certain data used in the charts above was provided by Navient under a data sharing agreement which expires on April 29, 2019 (see page 33 for
more details). Sallie Mae Bank has not independently verified, and is not able to verify, the accuracy or completeness of the data provided under the
agreement.
10. For 2015-2018 P&I Repayment Vintages Only- Data as of March 31, 2019 for Sallie Mae Bank serviced loans only – All loans covered are serviced by
Sallie Mae Bank, regardless of whether the loans were originated by Sallie Mae Bank when it was part of legacy SLM, or by Sallie Mae Bank post Spin-Off,
and regardless of whether the loans were included in an ABS trust. Note: Legacy SLM and Navient portfolio serviced pursuant to a 212 day charge-off policy.
Sallie Mae Bank portfolio serviced pursuant to a 120 day charge-off policy. Historical trends may not be indicative of future performance.
11. We calculate and report our non-GAAP operating efficiency ratio as the ratio of (a) the total non-interest expense numerator to (b) the net revenue
denominator (which consists of the sum of net interest income, before provision for credit losses, and non-interest income, excluding any gains and losses on
sales of loans and securities, net and the net impact of derivative accounting as defined in the "‘Core Earnings’ to GAAP Reconciliation" table on page 25).
We believe doing so provides useful information to investors because it is a measure used by our management team to monitor our effectiveness in
managing operating expenses. Other companies may use similarly titled non-GAAP financial measures that are calculated differently from the way we
calculate our ratio. Accordingly, our non-GAAP operating efficiency ratio may not be comparable to similar measures used by other companies.
12. Smart Option loans considered in ‘P&I Repayment’ only if borrowers are subject to full principal and interest payments on the loan.
13. Represents the higher credit score of the cosigner or the borrower. Note: Pool characteristics as of the Statistical Cutoff Date for the respective transaction
14. Overcollateralization for Class A & B bonds
15. Estimated based on a variety of assumptions concerning loan repayment behavior. Actual prepayment rate may vary significantly from estimates.
16. Private education loans are typically non-dischargeable in bankruptcy, unless a borrower can prove that repayment of the loan imposes an "undue hardship“.
17. Source: U.S. Department of Education, Office of Federal Student Aid, https://studentaid.ed.gov/sa/types/loans
18. The difference between “Core Earnings” and GAAP net income is driven by mark-to-market unrealized gains and losses on derivative contracts recognized in
GAAP, but not in “Core Earnings” results. See page 25 for a reconciliation of GAAP and “Core Earnings”. Derivative Accounting: “Core Earnings” exclude
periodic unrealized gains and losses caused by the mark-to-market valuations on derivatives that do not qualify for hedge accounting treatment under GAAP,
but include current period accruals on the derivative instruments. For periods prior to July 1, 2018, “Core Earnings” also exclude the periodic unrealized gains
and losses that are a result of ineffectiveness recognized related to effective hedges under GAAP, net of tax. Under GAAP, for our derivatives held to
maturity, the cumulative net unrealized gain or loss over the life of the contract will equal $0.
19. “Core Earnings” tax rate is based on the effective tax rate at the Bank where the derivative instruments are held.
20. We calculate and report our non-GAAP “Core Earnings” Return on Assets (“ROA”) as the ratio of (a) “Core Earnings” net income numerator (annualized) to
(b) the GAAP total average assets denominator.
21. We calculate and report our non-GAAP “Core Earnings” Return on Common Equity (“ROCE”) as the ratio of (a) “Core Earnings” net income attributable to
common stock numerator (annualized) to (b) the net denominator, which consists of GAAP total average equity less total average preferred stock.
Footnotes: