salmon assessment and monitoring in british columbia … 2012/1431(canada).pdf · salmon assessment...
TRANSCRIPT

Salmon Assessment and Monitoring in British Columbia and Yukon
ick, and M. Thiess
Canada Science Branch, Pacific Region
Pacific Biological Station 3190 Hammond Bay Road
Nanaim
bmitted to the
NORTH PACIFIC ANADROMOUS FISH COMMISSION
By
Canada
September 2012
NPAFC Doc. 1431
By
A. Tompkins, N. Kom
Fisheries and Oceans
o BC, V9T 6N7 CANADA
Su
Rev.
THIS PAPER MAY BE CITED IN THE FOLLOWING MANNER: Tompkins, A., N. Komick and M. Thiess. 2012. Salmon Assessment in British Columbia and Yukon. NPAFC Doc. 1431. 13 pp. Fisheries and Oceans Canada. (Available at http://www.npafc.org).

Abstract
trends and
ding the status of
tion requires long-term
es related to
climate change. Stock
and Oceans Pacific Region
includes freshwater sampling activities to determine abundance of returning adults and juvenile
ling activities to determine stock composition of catch.
nada is a complex and expensive endeavour because of
the diversity and magnitude of the resource and the interactions between salmon, their ecosystems and a
on
nsible for
f six administrative
lumbia and the Yukon Territory.
cations. The
overnment
Canada’s Policy for the Conservation of Wild Pacific Salmon (WSP, DFO 2005) guides Pacific salmon
management and assessment in Canada. The goal of the WSP is to restore and maintain healthy and diverse
salmon populations and their habitat for the benefit and enjoyment of the people of Canada in perpetuity.
This goal is to be achieved by fulfilling three objectives: safeguard genetic diversity, maintain habitat and
ecosystem integrity, and manage fisheries for sustainable benefits. Under the WSP, salmon are managed
and assessed as biologically-based Conservation Units (CUs), aggregate populations based on similar
The purpose of salmon stock assessment is to provide the information on stock status,
productivity needed to inform and guide management of salmon fisheries. Understan
salmon stocks and the factors (e.g. climate) influencing Pacific salmon produc
monitoring of biological data. Stock assessment data are required to address issu
conservation, fisheries management, biodiversity, fish habitat, and the effects of
assessment research conducted by Canadian Department of Fisheries
production and marine samp
Assessment Framework Assessing and monitoring Pacific salmon in Ca
wide variety of resource users. Slaney et al. (1996) identified more than 8,000 natural spawning salm
streams by species in British Columbia and the Yukon.
The Department of Fisheries and Oceans (CDFO) is the lead Canadian agency respo
conservation and management of salmon resources. The Pacific region is one o
regions within the Department and includes the province of British Co
Within the Pacific region, the Salmon and Freshwater Ecosystem Division (SAFE) has an active
freshwater and marine research program, with science activities conducted in various lo
Department also collaborates with a variety of partners on science, including other g
departments, universities and non-government organizations.
1

characteristics of freshwater and marine ecology, life history, and molecular genet
recognizes 450+ Conservation Units of Pacific Salmon. A key requirement of the W
monitoring and assessment of the status of wild salmon populations at the CU level. T
status of a CU will normally be based on the abundance of spawners in the unit, or som
This policy also considers habitat
ics. The WSP
SP is ongoing
he biological
e proxy thereof.
and ecosystem indicators, and provides guidance on the standardized
tions or CUs can
species-specific
mework
ensible, timely
resources to all
dance and status
e frequency
pdated annually taking into
consideration CU status, major risk factors, resource management objectives, assessment strategies, and
spawning escapement
tus of stocks,
in productivity. The regional Stock Assessment operational program is
organized into four delivery areas: South Coast (Nanaimo), Fraser River (Kamloops), North Coast
t), and Yukon / Transboundary (Whitehorse) (Fig. 1). Core Science staff located at the
vide coordination,
Escapement Escapement data derived directly from enumeration of adult spawners are essential to compute the
annual abundance estimates needed to track stock status and trends. Escapement estimation activities
are delivered at three levels of intensity: indicator, intensive, and extensive programs, in order of
monitoring of salmon.
Monitoring the status of 450+ salmon CUs is not feasible. Since not all salmon popula
be practically monitored, annual monitoring programs are determined based on
Assessment Frameworks that incorporate a risk-based approach. The primary objective of a fra
approach is to foster a process that efficiently and transparently provides objective, def
and useful advice to resource managers and credible information about their public
Canadians. Groups of CUs exposed to common threats, are monitored based on abun
indicators within units that can be monitored. Generally, CU status and risk will determine th
and intensity of the assessment effort. Stock assessment work plans are u
enhancement activities. CDFO maintains databases for information on catch and
and regularly reports to NPAFC on catches and hatchery releases (e.g. Irvine et al. 2012).
The Salmon Stock Assessment section of SAFE is responsible for monitoring the sta
impacts of fisheries, and trends
(Prince Ruper
Pacific Biological Station in Nanaimo play a policy & developmental role, and pro
advice, & support to area staff.
2

monitoring effort, and accuracy and precision of estimates. Both indicator and in
delivered at a high level of intensity and provide quantitative estimates of abunda
programs have additional monitoring requirements used for developing estimates of pro
survival and exploitation rates. Additional biological information such as age and
size, fecundity, egg size, genetic diversity, and disease may be monitored at some system
determine the biological status of key populations. Generally, indicator programs are co
delivered by the agency. Information generated from extensive programs is of low
tensive programs are
nce but indicator
ductivity,
sex composition, body
s to help
re programs
er accuracy and
precision, but useful for generating indices of abundance and for discerning trends. Some intensive and
zations, etc).
es between the two.
ation and run
ground level
capture studies, and
vidual population estimates often go back as far as the early 1950s, but
ation quality generally
nd data
wning observations for 7000+ individual
populations but escapement estimates (all levels of survey intensity) are available for 1200+ populations.
ot a spatial database but each population is referenced to the location of the stream mouth.
tions where 2010 escapement estimates are recorded for all five
Production Salmon in Regional Ecosystems Program
Canada also monitors key salmon populations as indicators of regional salmon production. The
Salmon in Regional Ecosystems Program monitors primary productivity and conducts annual juvenile
extensive programs may be delivered by partners (First Nations, stewardship organi
The Salmon Escapement Database (NuSEDS) is CDFO Pacific Region’s central database that stores
individual spawner survey data records, spawner abundance estimates and the linkag
Annual abundance estimates are maintained by population, as defined by freshwater loc
timing. Data were collected through surveys using various methodologies including
observations (walk, snorkel, boat), aerial counts (helicopter, fixed wing), mark re
fixed weir and fence counts. Indi
there can be huge variation in the methodology used and their reliability. Estim
improved over time as regionally consistent escapement survey/analysis methodologies a
standards were applied.
The NuSEDS database currently reports salmon spa
NuSEDS is n
Figure 2 identifies individual popula
species of salmon (Chinook, chum, coho, pink and sockeye).
3
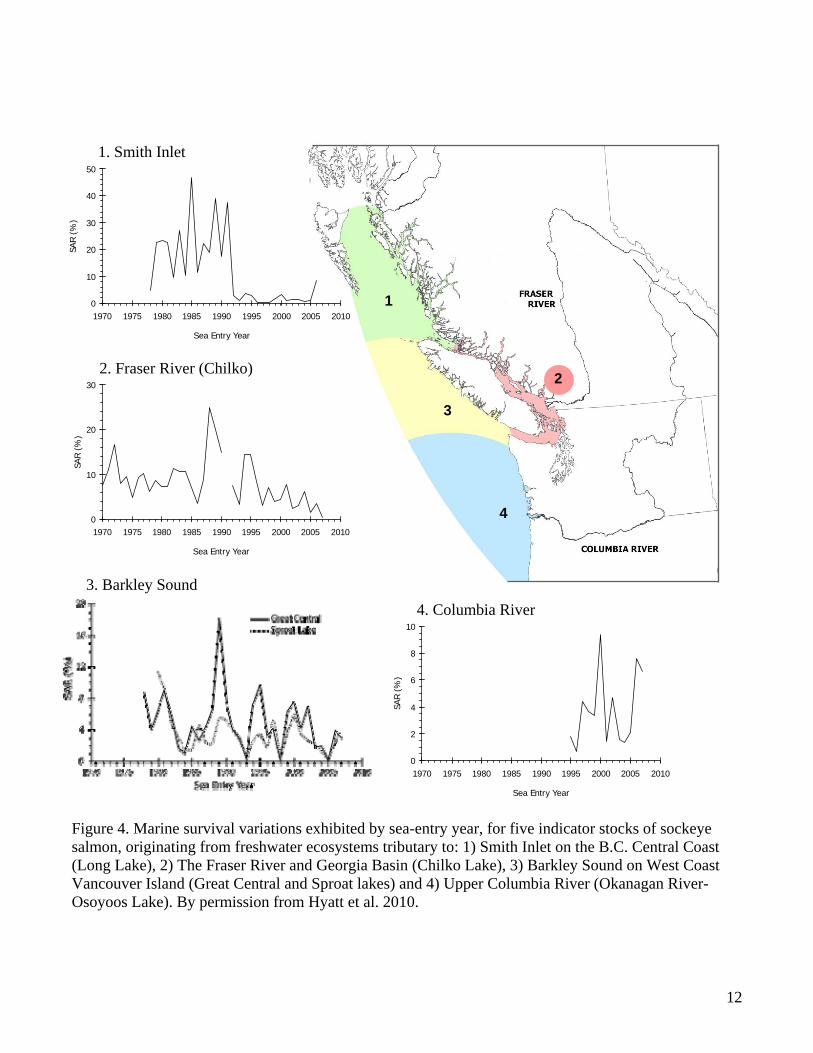
and adult surveys of sockeye salmon at selected lakes throughout the region (Fig. 3
allow partitioning of freshwater and marine effects in order to better understand facto
regional production variations of sockeye salmon. These results are reported annuall
Ocean publications (e.g. Hyatt et al. 2011). This data set has permitted the compariso
trends in marine survival for juvenile sockeye salmon originating from the Fraser, Smith In
Columbia Rivers relative to ocean temperatures at the time juvenile s
). These data sets
rs controlling
y in the State of
n of coast wide
let and the
ockeye entered the ocean. Results
indicate that varying ENSO-like conditions, anticipated by sea surface temperature changes, appear to
s from higher to lower marine survival for all stocks.
rom the Coded
ms were
ples used to
ieces of
hatchery indicator
ugh to maturity. A
n caught in all
stocks represent
iming and distribution.
ges in productivity,
evaluate hatchery production, determine migratory paths, estimate and forecast abundance, and regulate
ent regime of
de stock
apement, and CWT data.
with the Salmonid Enhancement Program
(SEP) which produces Chinook, coho, chum, pink, and sockeye salmon, as well as small numbers of
steelhead and cutthroat trout (Sandher et al. 2012). Currently 28 hatcheries and facilities release CWT
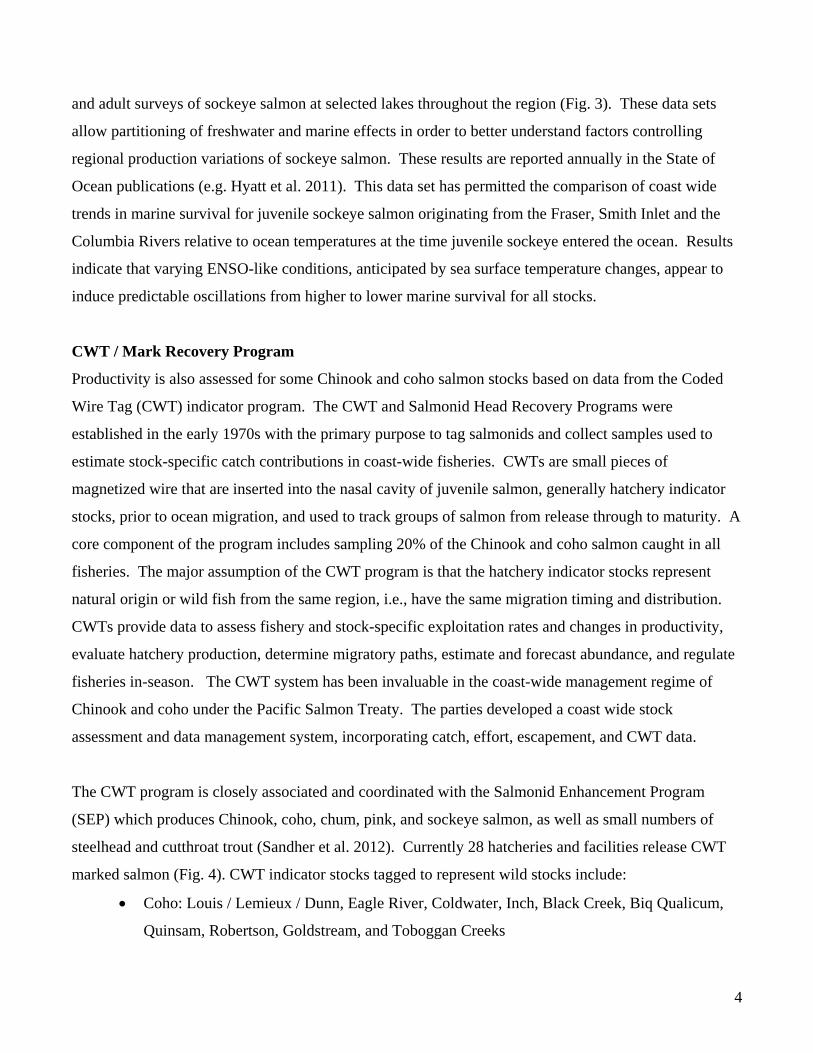
marked salmon (Fig. 4). CWT indicator stocks tagged to represent wild stocks include:
Coho: Louis / Lemieux / Dunn, Eagle River, Coldwater, Inch, Black Creek, Biq Qualicum,
Quinsam, Robertson, Goldstream, and Toboggan Creeks
induce predictable oscillation
CWT / Mark Recovery Program
Productivity is also assessed for some Chinook and coho salmon stocks based on data f
Wire Tag (CWT) indicator program. The CWT and Salmonid Head Recovery Progra
established in the early 1970s with the primary purpose to tag salmonids and collect sam
estimate stock-specific catch contributions in coast-wide fisheries. CWTs are small p
magnetized wire that are inserted into the nasal cavity of juvenile salmon, generally
stocks, prior to ocean migration, and used to track groups of salmon from release thro
core component of the program includes sampling 20% of the Chinook and coho salmo
fisheries. The major assumption of the CWT program is that the hatchery indicator
natural origin or wild fish from the same region, i.e., have the same migration t
CWTs provide data to assess fishery and stock-specific exploitation rates and chan
fisheries in-season. The CWT system has been invaluable in the coast-wide managem
Chinook and coho under the Pacific Salmon Treaty. The parties developed a coast wi
assessment and data management system, incorporating catch, effort, esc
The CWT program is closely associated and coordinated
4

Chinook: Lower Shuswap, Middle Shuswap, Nicola, Chilliwack, Harrison, Cowichan, Big
Qualicum, Quinsam, Puntledge, Robertson, Kitsumkalum, and Atnarko Rivers.
rch on the
pulations or
ion employed, although
r histocompatibility complex (MHC) variation, and gene
vide
Stock Composition Molecular Genetics Program
The Molecular Genetics Laboratory at the Pacific Biological Station conducts resea
development and application of DNA-based genetic variation to discriminate among po
stocks of Pacific salmon. Microsatellites are the main class of genetic variat
single nucleotide polymorphisms (SNPs), majo
expression are used in some management applications. The lab has the capacity to pro
retrospective, post-season and in-season genetics advice.
Research is focused on applications to aid the conservation and management of Pacific salmon species.
Applications include determination of population structure and appropriate assessment and management
units, identification of stock compositions in mixed-stock fisheries, forensics, evaluation of hatchery and
aquaculture broodstock, identification of prey items in marine mammal diets, determination of
evolutionary relationships in fish, and application of biomarkers to identify upregulation and
downregulation of specific gene complexes.
Thermal Marking
CDFO also uses thermal ototlith marks primarily for estimating stock composition in term
estimating hatchery contribution to enhanced stocks, and providing information
between systems. Otolith release data are reported annually to NPAFC (e.g., DiN
2012). For Canadian salmon, the relatively small number of unique otolith marks av
limited
inal fisheries,
on straying rates
ovo and O’Brien
ailable and the
ocean fishery sampling for otoliths, compared to CWTs or DNA, has precluded their application
to ocean mixed-stock fisheries. Otolith marks are a more cost effective tool than CWTs or DNA for use
in terminal area fisheries targeting enhanced fish when enhanced (marked) fish comprise a large
component of the catch or spawning escapement. Otolith marks have helped to shape fisheries by
identifying the areas and times when enhanced fish are present and to evaluate stock-specific fishery
impacts.
5

Climate Change
mportant to the
rch programs have
vestigating the relationships among ocean conditions, climate, and the productivity of Pacific
osystem surveys
e effects of ocean
on, and
; Trudel et al. 2012). These
midwater trawl surveys have generally been conducted in late spring-early summer and in the fall since
been conducted to assess the effects of winter conditions on
ting intensive
e early 1990s. The
and migration of
variables
ith beam trawls, but since 1998 the
surveys have been conducted using mid-water trawls. Two surveys have generally been conducted in
hed transect. Additional research surveys have also
the west coast of British
ashington
Department of Fish and Wildlife and the University of Washington.
Aquatic Climate Change Adaptation Services Program
The Aquatic Climate Change Adaptation Services Program was initiated in 2012. This program
supports research designed to understand and predict climate change impacts on Canada’s oceans and
CDFO recognizes that understanding and predicting climate change and its impacts is i
conservation, protection, and sustainability of Pacific salmon. Ongoing marine resea
been in
salmon.
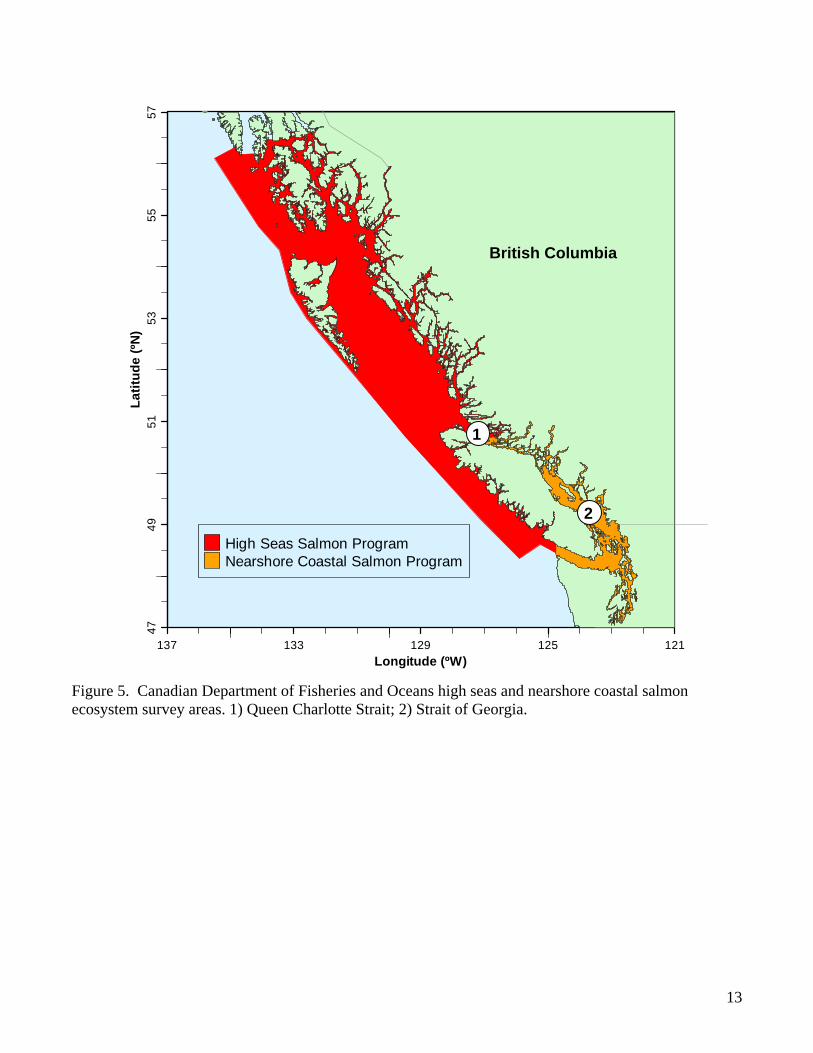
High Seas Salmon Program
The Canadian High Seas Salmon Program has been conducting integrated epipelagic ec
from the west coast of British Columbia to Southeast Alaska (Fig. 5) to assess th
conditions and climate change on the distribution, migration, growth and survival of Pacific salm
to forecast salmon returns to British Columbia (Beamish et al. 2007
1998. Since 2001, winter surveys have also
the ecology, bioenergetics, and survival of juvenile salmon (Trudel et al. 2007).
Neashore Coastal Salmon Investigations Program
The Canadian Neashore Coastal Salmon Investigations Program has been conduc
epipelagic ecosystem surveys in the Strait of Georgia and surrounding inlets, since th
purpose of these surveys has been to determine the size, distribution, diets, mortality
juvenile salmonids in this unique rearing area and the impact of climate change on these
(Trudel et al. 2012). These surveys were initially conducted w
early summer and early fall following an establis
been conducted in Queen Charlotte Strait, Puget Sound, Juan de Fuca Strait and
Columbia. Work in Puget Sound has been in cooperation with colleagues from the W
6

inland waters, and to develop strategies and tools to respond to these changes. This pro
components: 1, an assessment of the short and long term risks of climate change on
2, identification and assessment of impacts and vulnerabilities of climate change on eco
implications to CDFO infrastructure and activities, and 3, the direct application of sci
in the development of ‘tools’ to incorporate climate change considerations in CDFO m
decision making. CDFO scientists are developing ecosystem models to project future
abundance of salmon in relation to climate change and various management scenario
research will focus on do
gram has three
aquatic ecosystems,
systems and
entific knowledge
anagement and
trends in
s Some of the
wnscaling climate data from Global Circulation Models to generate data that
can be used to generate regionally specific forecasts relevant to Pacific salmon in freshwater, coastal
e Gulf of Alaska.
Beamhnical Report 7: 1-4.
d Pacific salmon. fo-mpo.gc.ca/publications/wsp/default_e.htm
DFO 2.
DiN a, Brood Year 12. NPAFC Doc. 1374. 3 pp
ot Stockwell. Sockeye Stocks
Unpublished Report to file: JSIDS - SRe 0??-10. Salmon in Regional Ecosystems Program, Fisheries and Oceans Canada, Nanaimo, B.C., V9T
Hyatt, K., M. Stockwell, and .P. Rankin. 2011. Sockeyne (eds.), State of
ian marine ecosystems in 2010. DFO Can. Sci. Advis. Sec.Res. Doc. 2011/054.
Irvine, J.R., A. Tompkins, T. Saito, K. B. Seong, J. K. Kim, N. Klovach, H. Bartlett, and E. Volk. 2012. Pacific Salmon Status and Abundance Trends - 2012 Update. NPAFC Doc. 1422. 89 pp.
Sandher, J., C. Lynch, D. Willis, R. Cook and J. R. Irvine. 2012. Canadian enhanced salmonid production during 1977-2011 (1976-2010 brood years). NPAFC Doc. 1420. 10 pp.
areas, and th
References
ish, R.J., M. Trudel, and R. Sweeting. 2007. Canadian coastal and high seas juvenile Pacific salmon studies. North Pacific Anadromous Fish Commission Tec
DFO (Fisheries and Oceans Canada), 2005. Canada's policy for conservation of wilhttp://www-comm.pac.d
2011. State of the Pacific Ocean 2010. DFO Sci. Ocean Status Report. 2011/03
ovo, S., and D. O’Brien. 2012. Proposed Thermal Marks for Salmon from Canad20
Hyatt Kim D., D. Paul Rankin, Sue Grant, Diana Dobson, Steve Cox-Rogers, and Marg2010. Comparisons of Marine Survival Variations for Fraser and Non-FraserOriginating from Southern British Columbia.
6N7
e salmon indicator stocks – regional overview of trends and 2010 returns. Pages 157-163 in Crawford, W.R. and J.R. Irviphysical, biological, and selected fishery resources of Pacific Canad
7

Slan .J., 1996. Status of anadromous salmon and trout
Trud nd D.W. Welch. 2007. Overwinter mortality and energy depletion in juvenile Pacific salmon off the west coast of
Trudel, M., C. Neville, and R. Sweeting. 2012. Canadian Juvenile Salmon Surveys in 2012-2013. NPAFC Doc. 1373. 19 pp.
ey, T.L., Hyatt, K.D., Northcote, T.G., Fielden, Rin British Columbia and Yukon. Fisheries 21(10), 20-35.
el, M., M.E. Thiess, J.F.T. Morris, J.R. Candy, T.D. Beacham, D.A. Higgs, D.A., a
British Columbia and Alaska. NPAFC Tech. Rep. 7: 61-63.
8

Figure 1. Canada Department of Fisheries and Oceans administrative management areas.
9

Figure 2. British Columbia and Yukon salmon escapement monitoring sites and hatchery facilities with an
assessment function.
10

Figure 3. Hatcheries and rearing facilities in British Columbia and the Yukon that release
salmonids with coded wire tags.
Yukon
British Columbia
11
12
1
3
4
2
01970 1975 1980 1985 19
10
20
40
50
90 1995 2000 2005 2010
Sea Entry Year
SAR
(
1. Smith Inlet
30%)
0
6
8
10
1970 1975 1980 1985 1990 1995 2000 2005 2010
Sea Entry Year
%)
4. Columbia River
2
4SAR
(
3. Barkley Sound
0
10
20
30
1970 1975 1980 1985 1990 1995 2000 2005 2010
Sea Entry Year
SAR
(%)
2. Fraser River (Chilko)
exhibited by sea-entry year, for five indicator stocks of sockeye oast
st Coast
Figure 4. Marine survival variationssalmon, originating from freshwater ecosystem(Long Lake), 2) The Fraser River Vancouver Island (Great Central and Sproat lakes)Osoyoos Lake). By permission from Hyatt et al. 2010.
s tributary to: 1) Smith Inlet on the B.C. Central Cand Georgia Basin (Chilko Lake), 3) Barkley Sound on We
and 4) Upper Columbia River (Okanagan River-
13
Figure 5. Canadian Department of Fisheries and Oceans high seas and nearshore coastal salmon ecosystem survey areas. 1) Queen Charlotte Strait; 2) Strait of Georgia.
137 133 129 125 121
47
49
51
53
55
57
Longitude (ºW)
La
titu
de
(ºN
)
High Seas Salmon ProgramNearshore Coastal Salmon Program
2
1
British Columbia