salt lake city, utah - huduser.govthe salt lake city, ut metropolitan statistical area (msa),...
TRANSCRIPT

C O M P R E H E N S I V E H O U S I N G M A R K E T A N A L Y S I S
Salt Lake City, UtahU.S. Department of Housing and Urban Development Office of Policy Development and Research As of October 1, 2016
Tooele
Salt Lake
Uta
h
Nev
ada
Idaho
Elko
Box Elder
Juab
Utah
White Pine
Cassia
Cache
OneidaTwin Falls
Davis
Weber
Franklin
Morgan
Sum
mit
Wasatch
Housing Market Area
The Salt Lake City Housing Market Area (HMA) is coterminous with the Salt Lake City, UT Metropolitan Statistical Area (MSA), comprising Salt Lake and Tooele Counties in north-central Utah. Located at the base of the Wasatch Range, four ski areas make the HMA a tourist destination: Alta, Brighton, Snowbird, and Solitude. In addition, the city of Salt Lake City is the headquarters for the Church of Jesus Christ of Latter-day Saints (LDS).
Summary
Economy The economic expansion that began in 2011 in the Salt Lake City HMA led to nonfarm payrolls that surpassed the previous peak in 2008 by 11.7 per cent. During the 12 months ending September 2016, nonfarm payrolls averaged 690,600 jobs, an increase of 19,800 jobs, or 3.0 percent, from a year ago. The education and health services and the professional and business services sectors led the recovery, and the financial activities sector is a rapidly growing payroll sector. During the next 3 years, non-farm payrolls are expected to increase an average of 2.8 percent annually.
Sales MarketThe current sales housing market in the HMA is slightly tight, with a 1.3-percent vacancy rate. The number of new and existing homes sold in creased 6 percent, to 27,900 homes, during the 12 months ending August 2016 from a year earlier (Core Logic, Inc., with adjustments by the analyst). The average sales price increased nearly 6 percent, to $300,500. During the next 3 years, demand is estimated for 12,900 new homes (Table 1). The 3,000 homes currently under construc-tion and a portion of the estimated 8,000 other vacant units in the HMA that may reenter the market will satisfy some of the forecast demand.
Rental MarketThe current rental housing market in the HMA is balanced. The rental vacancy rate (which includes single-family homes, apartments, and mobile homes) is 4.9 percent, down from 6.9 percent in April 2010. Apartment market conditions are tight, with a vacancy rate of 2.9 percent during the third quarter of 2016 (MPF Research). During the 3-year forecast period, demand is estimated for 7,775 new market-rate rental units (Table 1). The 4,000 units under construction and an additional 700 units expected to be completed will satisfy all the demand in the first year and most of the demand in the second year of the forecast period.
Table 1. Housing Demand in the Salt Lake City HMA During the Forecast Period
Salt Lake City HMA
SalesUnits
RentalUnits
Total demand 12,900 7,775
Under construction 3,000 4,000
Notes: Total demand represents estimated production necessary to achieve a balanced market at the end of the forecast period. Units under construction as of October 1, 2016. A portion of the estimated 8,000 other vacant units in the HMA will likely satisfy some of the forecast demand. The forecast period is October 1, 2016, to October 1, 2019.Source: Estimates by analyst
Market DetailsEconomic Conditions ............... 2
Population and Households ..... 6
Housing Market Trends ............ 8
Data Profile ............................. 12
Sa
lt L
ak
e C
ity
, U
T •
CO
MP
RE
HE
NS
IVE
HO
US
ING
MA
RK
ET
AN
ALY
SIS
2Economic Conditions
The Salt Lake City HMA in-cludes the state capital in the
city of Salt Lake City, The University of Utah (the largest university in the state by full-time enrollment), and an international airport and is a regional center providing services along the Wasatch Front and all of central Utah. The government sector is the second largest payroll sector, comprising more than 15 percent of payrolls. In addition, the HMA is a regional center for pro-fessional and business services and financial activities, and several banking, credit card, and insurance companies have regional or global headquarters in the HMA. Discover Products Inc., The Goldman Sachs Group, Inc. (hereafter, Goldman Sachs), Wells Fargo & Company, and Zions Ban-corporation each employ at least 2,000 people locally. In addition, the American Express Company, Fidelity Investments, and SelectHealth insur-ance each employ more than 1,000 people in the HMA.
The HMA had strong economic growth after the most recent economic downturn resulting from the national
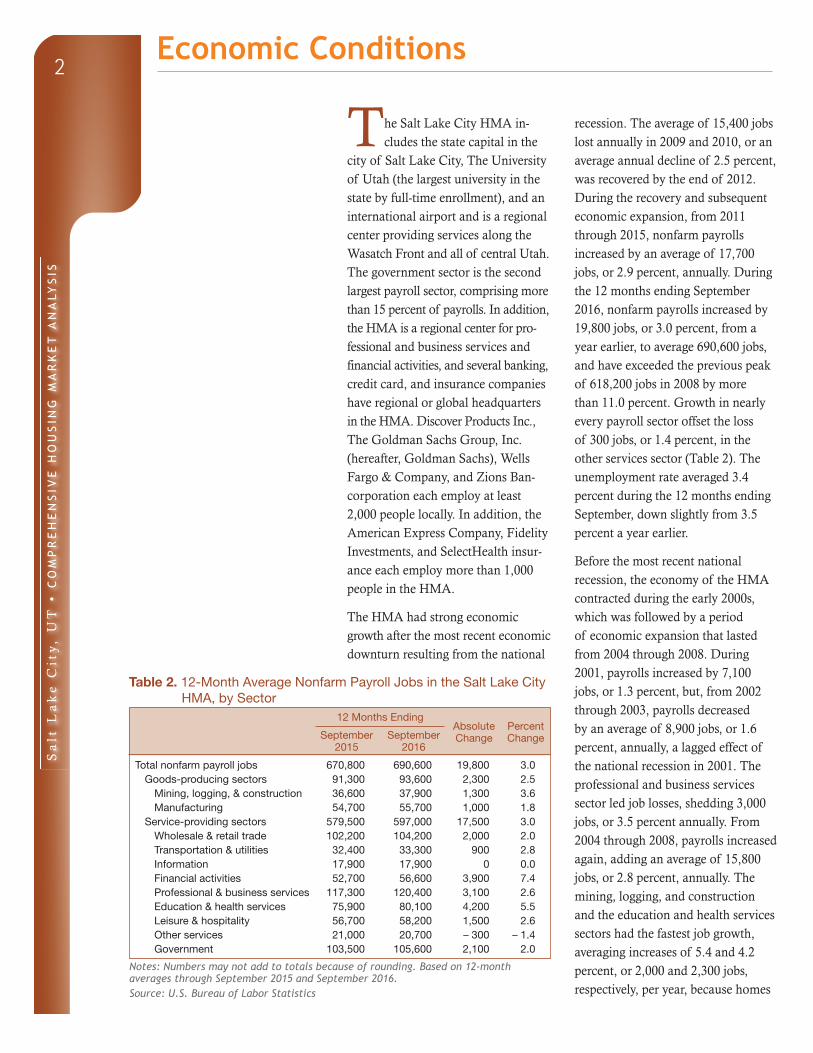
recession. The average of 15,400 jobs lost annually in 2009 and 2010, or an average annual decline of 2.5 percent, was recovered by the end of 2012. During the recovery and subsequent economic expansion, from 2011 through 2015, nonfarm payrolls increased by an average of 17,700 jobs, or 2.9 percent, annually. During the 12 months ending September 2016, nonfarm payrolls increased by 19,800 jobs, or 3.0 percent, from a year earlier, to average 690,600 jobs, and have exceeded the previous peak of 618,200 jobs in 2008 by more than 11.0 percent. Growth in nearly every payroll sector offset the loss of 300 jobs, or 1.4 percent, in the other services sector (Table 2). The unemployment rate averaged 3.4 percent during the 12 months ending September, down slightly from 3.5 percent a year earlier.
Before the most recent national recession, the economy of the HMA contracted during the early 2000s, which was followed by a period of economic expansion that lasted from 2004 through 2008. During 2001, payrolls increased by 7,100 jobs, or 1.3 percent, but, from 2002 through 2003, payrolls decreased by an average of 8,900 jobs, or 1.6 percent, annually, a lagged effect of the national recession in 2001. The professional and business services sector led job losses, shedding 3,000 jobs, or 3.5 percent annually. From 2004 through 2008, payrolls increased again, adding an average of 15,800 jobs, or 2.8 percent, annually. The mining, logging, and construction and the education and health services sectors had the fastest job growth, averaging increases of 5.4 and 4.2 percent, or 2,000 and 2,300 jobs, respectively, per year, because homes
Table 2. 12-Month Average Nonfarm Payroll Jobs in the Salt Lake City HMA, by Sector
12 Months EndingAbsolute Change
Percent ChangeSeptember
2015September
2016
Total nonfarm payroll jobs 670,800 690,600 19,800 3.0Goods-producing sectors 91,300 93,600 2,300 2.5
Mining, logging, & construction 36,600 37,900 1,300 3.6Manufacturing 54,700 55,700 1,000 1.8
Service-providing sectors 579,500 597,000 17,500 3.0Wholesale & retail trade 102,200 104,200 2,000 2.0Transportation & utilities 32,400 33,300 900 2.8Information 17,900 17,900 0 0.0Financial activities 52,700 56,600 3,900 7.4Professional & business services 117,300 120,400 3,100 2.6Education & health services 75,900 80,100 4,200 5.5Leisure & hospitality 56,700 58,200 1,500 2.6Other services 21,000 20,700 – 300 – 1.4Government 103,500 105,600 2,100 2.0
Notes: Numbers may not add to totals because of rounding. Based on 12-month averages through September 2015 and September 2016.Source: U.S. Bureau of Labor Statistics

Sa
lt L
ak
e C
ity
, U
T •
CO
MP
RE
HE
NS
IVE
HO
US
ING
MA
RK
ET
AN
ALY
SIS
3
and roads were built and services were expanding to accommodate a growing population during this time. Construction of the FrontRunner commuter line, connecting the city of Salt Lake City to the Ogden-Clearfield, UT MSA to the north and Provo-Orem, UT MSA to the south, began in 2006. The first lines opened in 2008, but construction continued and route coverage doubled in 2012. The initial TRAX light rail lines opened in 1999, with significant expansions completed in 2011 and 2013, and expansions to the transit options are ongoing, connecting the city of Salt Lake City to the airport and many of the suburbs in the
HMA. Figure 1 shows trends in the labor force, resident employment, and the unemployment rate in the HMA from 2000 through 2015.
During the 12 months ending Sep tem-ber 2016, the education and health services sector led gains, adding 4,200 jobs, an increase of 5.5 percent, to average 80,100 jobs. Intermountain Healthcare, the second largest employer in the HMA, with more than 15,000 employees, opened the new Loveland Clinic for Blood Cancer Therapy at LDS Hospital in Draper in November 2015 and, in February 2016, expanded outpatient services at Riverton Hospital. The education and health services sector has been the fastest growing employment sector since 2000 (Fig-ure 2). This payroll sector has helped mitigate the impact of job losses dur ing economic downturns and has been one of the leading sectors during economic growth. During 2002 and 2003, the education and health ser-vices sector partially offset the overall decline, increasing by an average of 1,800 jobs, or 3.8 percent, annually.
Figure 1. Trends in Labor Force, Resident Employment, and Unemploy-ment Rate in the Salt Lake City HMA, 2000 Through 2015
Source: U.S. Bureau of Labor Statistics
Figure 2. Sector Growth in the Salt Lake City HMA, Percentage Change, 2000 to Current
Notes: Current is based on 12-month averages through September 2016. During this period, payrolls in the mining, logging, and con-struction sector showed no net change.Source: U.S. Bureau of Labor Statistics
Economic Conditions Continued
Une
mpl
oym
ent r
ate
Labo
r fo
rce
and
resi
dent
em
ploy
men
t
630,000
580,000
530,000
480,000
430,000
2000
2002
2004
Labor force Resident employment Unemployment rate
8.0
6.0
4.0
2.0
0.0
2006
2001
2003
2005
2007
2009
2010
2008
2012
2013
2015
2014
2011
Total nonfarm payroll jobs
Goods-producing sectors
Mining, logging, & construction
Manufacturing
Service-providing sectors
Information
Financial activities
Professional & business services
Education & health services
Government
Other services
Leisure & hospitality
Transportation & utilities
Wholesale & retail trade
– 20 – 10 200 10 30 40 50 60 70 80 90

Sa
lt L
ak
e C
ity
, U
T •
CO
MP
RE
HE
NS
IVE
HO
US
ING
MA
RK
ET
AN
ALY
SIS
4
During the most recent recession in 2009 and 2010, the sector added an average of 2,100 jobs, an increase of 3.4 percent, annually, to dampen the impact of losses in other sectors.
The government and the education and health services sectors are the only sectors that have added jobs every year since 2000. With the state capital being in the city of Salt Lake City, govern-ment is the second largest payroll sector in the HMA, accounting for 105,600 jobs, or more 15 percent of all payrolls. Also contributing to government sector payrolls is The University of Utah, the largest employer in the HMA, with more than 20,000 employees (Table 3). With 32,061 students enrolled as of the fall 2016 semester, enrollment has increased about 1 percent annually for the past 2 years (The University of Utah). Enrollment growth was strongest during economic recessions, because people not in the workforce took the opportunity to learn new skills. Enrollment increased nearly 4 percent annually from 2009 to 2011, to 31,660 students, and peaked in 2012, with 32,388 students. As job opportunities returned and LDS announced a change that lowered the age for people going on missions,
enrollment declined almost 2 percent annually in 2013 and 2014, to 31,515 students. Enrollment is expected to increase an average of approximately 1 percent annually during the 3-year forecast period. During the 12 months ending September 2016, government payrolls increased by 2,100 jobs, or 2.0 percent, from a year earlier. The state government subsector led growth, adding 1,500 jobs, an increase of 3.3 percent from a year earlier.
The professional and business services sector led job gains during the economic recovery from 2011 through 2015, increasing by an average of 4,800 jobs, or 4.6 percent, annually. Following job losses surrounding the national recession at the start of the 2000 decade, the sector added an average of 3,600 jobs, an increase of 4.1 percent, annu-ally, from 2004 through 2008 before a single year of job losses in 2009. The losses were significant, however, with a decline of 7,000 jobs, or 7.1 percent. The number of jobs lost was not recovered until 2012. Growth in the sector slowed during the 12 months ending September 2016, to 3,100 jobs, or 2.6 percent, from a year earlier. By the end of 2015, Thumbtack, Inc., hired 200 people at its customer service office in the city of Sandy. As the
Table 3. Major Employers in the Salt Lake City HMA
Name of Employer Nonfarm Payroll Sector Number of Employees
University of Utah Government 20,000+Intermountain Healthcare Education & health services 15,000–19,999State of Utah Government 10,000–14,999Salt Lake County Government 5,000–6,999Wal-Mart Stores, Inc. Wholesale & retail trade 4,000–4,999Delta Air Lines, Inc. Transportation & utilities 3,000–3,999Discover Products Inc. Financial activities 3,000–3,999L-3 Communications Holdings, Inc. Manufacturing 3,000–3,999The Kroger Company Wholesale & retail trade 3,000–3,999Zions Bancorporation Financial activities 3,000–3,999
Note: Excludes local school districts.Source: EDCUtah, 2016
Economic Conditions Continued
Sa
lt L
ak
e C
ity
, U
T •
CO
MP
RE
HE
NS
IVE
HO
US
ING
MA
RK
ET
AN
ALY
SIS
5
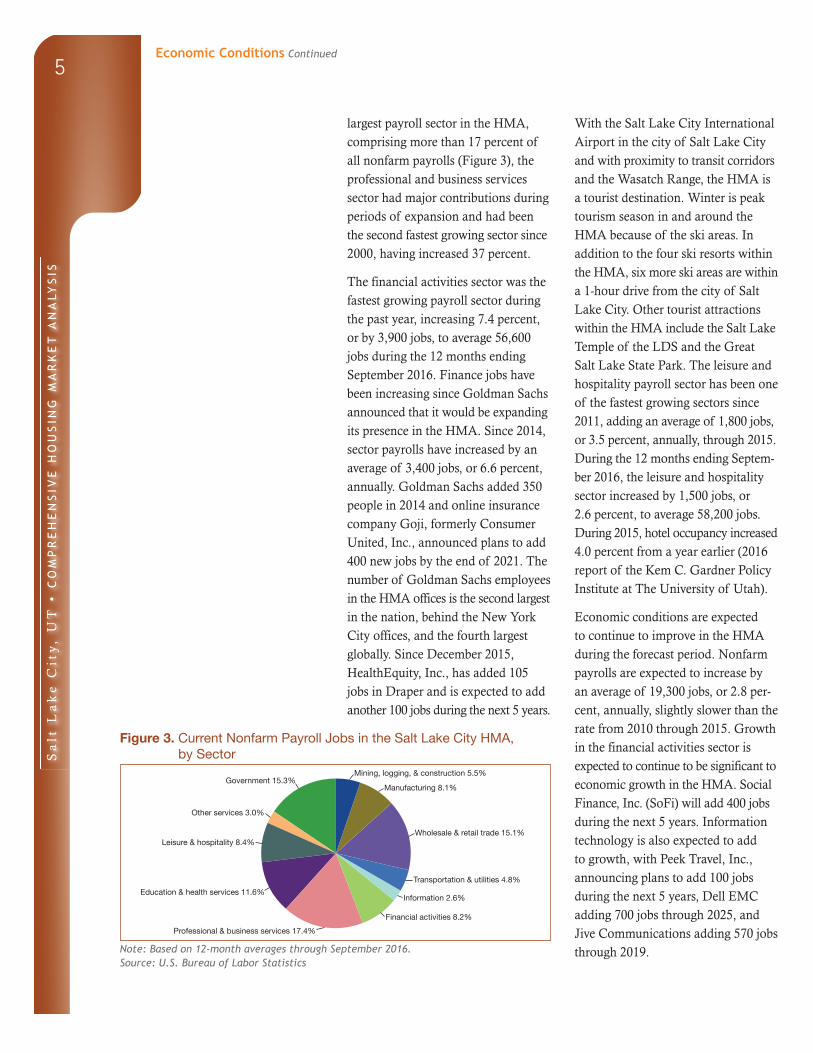
largest payroll sector in the HMA, comprising more than 17 percent of all nonfarm payrolls (Figure 3), the professional and business services sector had major contributions during periods of expansion and had been the second fastest growing sector since 2000, having increased 37 percent.
The financial activities sector was the fastest growing payroll sector during the past year, increasing 7.4 percent, or by 3,900 jobs, to average 56,600 jobs during the 12 months ending September 2016. Finance jobs have been increasing since Goldman Sachs announced that it would be expanding its presence in the HMA. Since 2014, sector payrolls have increased by an average of 3,400 jobs, or 6.6 percent, annually. Goldman Sachs added 350 people in 2014 and online insurance company Goji, formerly Consumer United, Inc., announced plans to add 400 new jobs by the end of 2021. The number of Goldman Sachs employees in the HMA offices is the second largest in the nation, behind the New York City offices, and the fourth largest globally. Since December 2015, Health Equity, Inc., has added 105 jobs in Draper and is expected to add another 100 jobs during the next 5 years.
With the Salt Lake City International Airport in the city of Salt Lake City and with proximity to transit corridors and the Wasatch Range, the HMA is a tourist destination. Winter is peak tourism season in and around the HMA because of the ski areas. In addition to the four ski resorts within the HMA, six more ski areas are within a 1-hour drive from the city of Salt Lake City. Other tourist attractions within the HMA include the Salt Lake Temple of the LDS and the Great Salt Lake State Park. The leisure and hospitality payroll sector has been one of the fastest growing sectors since 2011, adding an average of 1,800 jobs, or 3.5 percent, annually, through 2015. During the 12 months ending Septem-ber 2016, the leisure and hospitality sector increased by 1,500 jobs, or 2.6 percent, to average 58,200 jobs. During 2015, hotel occupancy increased 4.0 percent from a year earlier (2016 report of the Kem C. Gardner Policy Institute at The University of Utah).
Economic conditions are expected to continue to improve in the HMA during the forecast period. Nonfarm payrolls are expected to increase by an average of 19,300 jobs, or 2.8 per-cent, annually, slightly slower than the rate from 2010 through 2015. Growth in the financial activities sector is expected to continue to be significant to economic growth in the HMA. Social Finance, Inc. (SoFi) will add 400 jobs during the next 5 years. Information technology is also expected to add to growth, with Peek Travel, Inc., announcing plans to add 100 jobs during the next 5 years, Dell EMC adding 700 jobs through 2025, and Jive Communications adding 570 jobs through 2019.
Figure 3. Current Nonfarm Payroll Jobs in the Salt Lake City HMA, by Sector
Note: Based on 12-month averages through September 2016.Source: U.S. Bureau of Labor Statistics
Economic Conditions Continued
Government 15.3%
Leisure & hospitality 8.4%
Other services 3.0%
Education & health services 11.6%
Professional & business services 17.4%
Wholesale & retail trade 15.1%
Manufacturing 8.1%
Mining, logging, & construction 5.5%
Information 2.6%
Transportation & utilities 4.8%
Financial activities 8.2%
Sa
lt L
ak
e C
ity
, U
T •
CO
MP
RE
HE
NS
IVE
HO
US
ING
MA
RK
ET
AN
ALY
SIS
6Population and Households
As home to the city of Salt Lake City, the state capital,
and as a location of regional health and financial services, the Salt Lake City HMA accounts for 39 percent of Utah’s population. As of October 1, the population of the HMA was esti mated to be 1.19 million. Salt Lake City is the largest city in the state, with 192,672 people in 2015 (Census Bureau population estimates as of July 1).
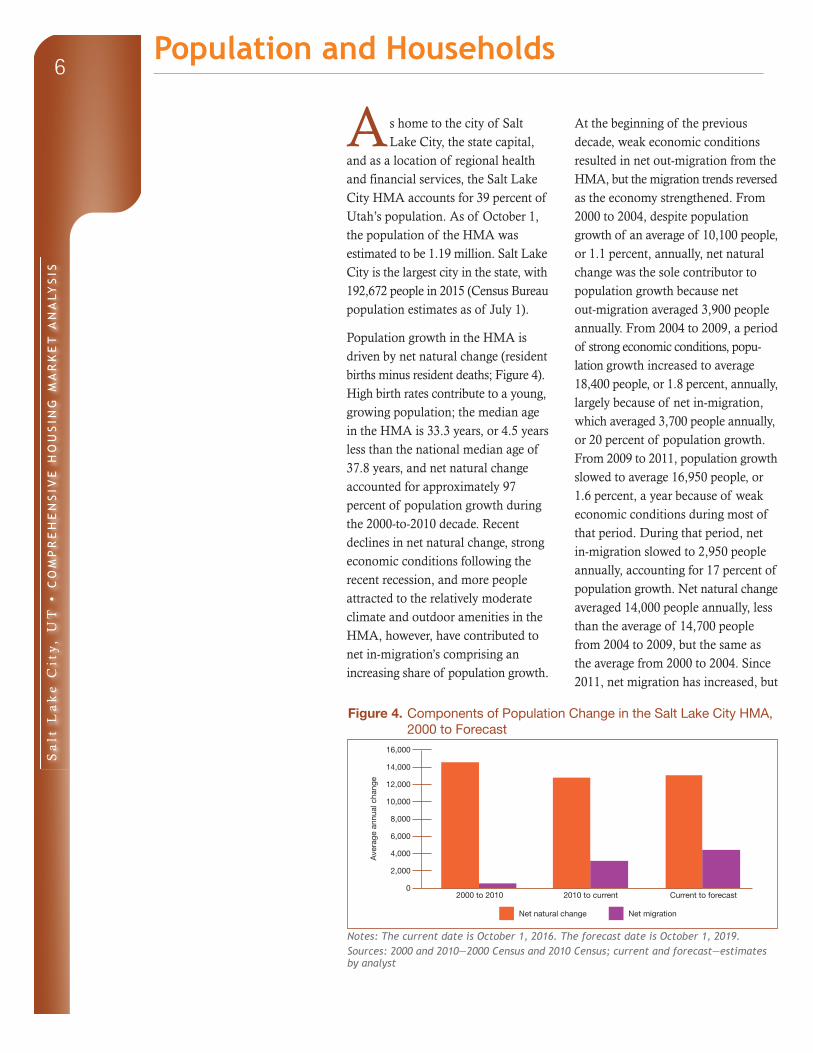
Population growth in the HMA is driven by net natural change (resident births minus resident deaths; Figure 4). High birth rates contribute to a young, growing population; the median age in the HMA is 33.3 years, or 4.5 years less than the national median age of 37.8 years, and net natural change accounted for approximately 97 percent of population growth during the 2000-to-2010 decade. Recent declines in net natural change, strong economic conditions following the recent recession, and more people attracted to the relatively moderate climate and outdoor amenities in the HMA, however, have contributed to net in-migration’s comprising an increasing share of population growth.
At the beginning of the previous decade, weak economic conditions resulted in net out-migration from the HMA, but the migration trends reversed as the economy strengthened. From 2000 to 2004, despite population growth of an average of 10,100 people, or 1.1 percent, annually, net natural change was the sole contributor to population growth because net out-migration averaged 3,900 people annu ally. From 2004 to 2009, a period of strong economic conditions, popu-lation growth increased to average 18,400 people, or 1.8 percent, annually, largely because of net in-migration, which averaged 3,700 people annually, or 20 percent of population growth. From 2009 to 2011, population growth slowed to average 16,950 people, or 1.6 percent, a year because of weak economic conditions during most of that period. During that period, net in-migration slowed to 2,950 people annually, accounting for 17 percent of population growth. Net natural change averaged 14,000 people annually, less than the average of 14,700 people from 2004 to 2009, but the same as the average from 2000 to 2004. Since 2011, net migration has increased, but
Figure 4. Components of Population Change in the Salt Lake City HMA, 2000 to Forecast
Notes: The current date is October 1, 2016. The forecast date is October 1, 2019.Sources: 2000 and 2010—2000 Census and 2010 Census; current and forecast—estimates by analyst
16,000
14,000
12,000
10,000
8,000
6,000
4,000
2,000
02000 to 2010 2010 to current Current to forecast
Ave
rage
ann
ual c
hang
e
Net natural change Net migration
Sa
lt L
ak
e C
ity
, U
T •
CO
MP
RE
HE
NS
IVE
HO
US
ING
MA
RK
ET
AN
ALY
SIS
7
net natural change continues to decline, despite improving economic conditions. During this time, the population increased by an average of 15,800, or 1.4 percent, annually, lower than the growth from 2009 to 2011. Since 2011, a decrease in net natural change to an average of 12,600 people has more than offset the slight increase in net in-migration, to average 3,200 people annually, returning to 20 percent of population growth. Table DP-1 at the end of this report shows additional demographic information about the HMA.
Approximately 396,700 households are in the Salt Lake City HMA, an
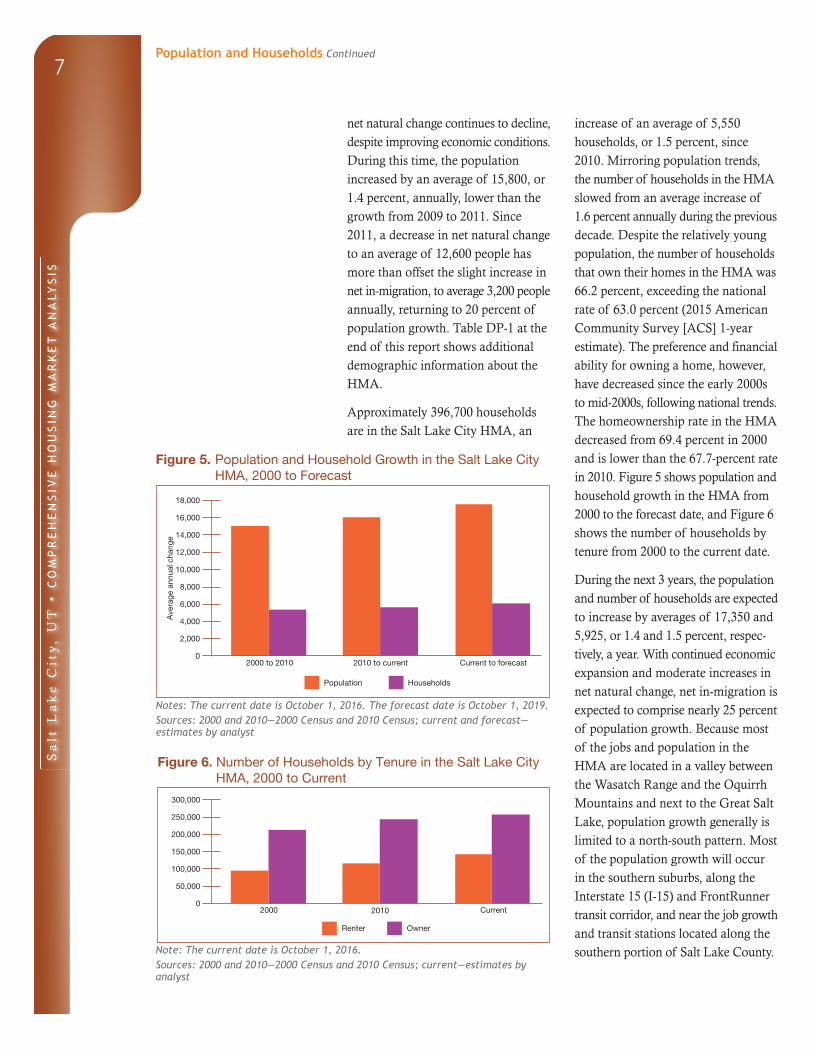
increase of an average of 5,550 households, or 1.5 percent, since 2010. Mirroring population trends, the number of households in the HMA slowed from an average increase of 1.6 percent annually during the previous decade. Despite the relatively young population, the number of households that own their homes in the HMA was 66.2 percent, exceeding the national rate of 63.0 percent (2015 American Community Survey [ACS] 1-year estimate). The preference and financial ability for owning a home, however, have decreased since the early 2000s to mid-2000s, following national trends. The homeownership rate in the HMA decreased from 69.4 percent in 2000 and is lower than the 67.7-percent rate in 2010. Figure 5 shows population and household growth in the HMA from 2000 to the forecast date, and Figure 6 shows the number of households by tenure from 2000 to the current date.
During the next 3 years, the population and number of households are expected to increase by averages of 17,350 and 5,925, or 1.4 and 1.5 percent, respec-tively, a year. With continued economic expansion and moderate increases in net natural change, net in-migration is expected to comprise nearly 25 percent of population growth. Because most of the jobs and population in the HMA are located in a valley between the Wasatch Range and the Oquirrh Mountains and next to the Great Salt Lake, population growth generally is limited to a north-south pattern. Most of the population growth will occur in the southern suburbs, along the Interstate 15 (I-15) and FrontRunner transit corridor, and near the job growth and transit stations located along the southern portion of Salt Lake County.
Figure 5. Population and Household Growth in the Salt Lake City HMA, 2000 to Forecast
Notes: The current date is October 1, 2016. The forecast date is October 1, 2019.Sources: 2000 and 2010—2000 Census and 2010 Census; current and forecast—estimates by analyst
Figure 6. Number of Households by Tenure in the Salt Lake City HMA, 2000 to Current
Note: The current date is October 1, 2016.Sources: 2000 and 2010—2000 Census and 2010 Census; current—estimates by analyst
2000 2010 Current
Renter Owner
300,000
250,000
200,000
150,000
100,000
50,000
0
Population Households
18,000
16,000
14,000
12,000
10,000
8,000
6,000
4,000
2,000
02000 to 2010 2010 to current Current to forecast
Ave
rage
ann
ual c
hang
e
Population and Households Continued

Sa
lt L
ak
e C
ity
, U
T •
CO
MP
RE
HE
NS
IVE
HO
US
ING
MA
RK
ET
AN
ALY
SIS
8Housing Market Trends
Sales Market
Current sales housing market con-di tions in the Salt Lake City HMA are slightly tight, with a 1.3-percent vacancy rate, down from 2.0 percent in April 2010. The HMA had a 2.4- month supply of for-sale inventory in August 2016, down from a 3.3-month supply a year earlier (Utah Association of Realtors®). The average home price for all homes sold, including new and existing, increased 6 percent during the 12 months ending August 2016, to nearly $300,500, and the number of homes sold increased 6 percent, to approximately 27,900 (CoreLogic, Inc., with adjustments by the analyst). The average price and total home sales remain at less than the highs reached before the housing crisis and the Great Recession, however. The average price is about 8 percent less than the previous peak of $328,000 in 2007; likewise, total home sales remain about 35 percent less than the peak of 42,900 home sold in 2006.
Existing home sales, including single- family homes, townhomes, and condominiums, increased 4 percent, to 24,600 homes sold, during the 12 months ending August 2016 compared with the number sold a year earlier. Existing home sales remain at 33 percent less than the previous peak of 36,900 homes sold in 2006. From 2001 through 2006, sales of existing homes were strong, even during the recession and out-migration, and continued to be strong through the economic expansion. Sales increased by an average of 2,800 homes sold, or nearly 11 percent, annually. When lending requirements tightened and jobs were lost, sales declined quickly, decreasing by 4,950 homes sold, or nearly 18 percent, annually from 2007 through 2010. The recovery
was strong, with sales growth similar to that of the first part of the past decade; however, sales remain sub dued. From 2011 through 2013, sales increased by 1,900 homes sold, or 10 percent, annually, to average 22,700 homes sold before decreasing 6 percent in 2014.
Mortgage delinquency in the HMA returned to the low levels from 2000 and remains well below the national average. As of August 2016, 1.3 percent of home loans in the HMA were seriously delinquent (90 or more days delinquent or in foreclosure) or had transitioned into real estate owned (REO) status, down from 1.9 percent a year earlier and from a peak of 6.4 percent in May 2010. By comparison, the national rate was 2.7 percent during August 2016, down from 3.5 percent a year earlier, and the peak of 8.6 percent in February 2010. The August 2016 national rate was still more than double the rate during 2000.
Despite showing strong gains during the past year, new home sales in the HMA remain approximately 50 percent less than the most recent peak of 6,700 homes sold in 2005. In part, changing preferences toward rental housing contributed to increased rental demand, reducing demand for new homes. During the 12 months ending August 2016, 3,350 new homes sold, up nearly 24 percent from a year earlier. From 2001 through 2005, despite a 2-year economic downturn and period of out-migration, new home sales increased nearly 10 percent annually, by 490 homes, during the buildup before the housing crisis. Beginning in 2006, demand for new homes diminished as the housing market began to show signs of
Sa
lt L
ak
e C
ity
, U
T •
CO
MP
RE
HE
NS
IVE
HO
US
ING
MA
RK
ET
AN
ALY
SIS
9
weak ness. From 2006 through 2011, new home sales decreased by 830 homes sold, or 20 percent, annually, to 1,725 homes sold. As strong net in-migration continued through 2014, consumer confidence grew after the recession ended, and, as access to credit improved, demand increased. In 2012 and 2013, new home sales increased by 510 homes sold, an increase of 26 percent, annu ally, to nearly 2,750 homes, before dipping less than 2 per-cent to 2,700 homes sold in 2014. The average price of a new home built during the 12 months ending August 2016 was $349,650. Although being nearly 6 percent higher than home prices a year earlier, this price remains at 11 percent less than the average of $394,700 for new homes sold in 2007. The price of a new home fell an average of 19 percent annually in 2008 and 2009 and increased by an average of about 6 percent annually through 2014. One reason new home prices have not recovered to their pre recession peak is a decline in home sizes. The average size of a new home built during the 12 months ending August 2016 was about 1,950 square feet, 3 percent smaller than the average size in 2007 (Metrostudy, A Hanley Wood Company). By comparison, the size of new homes averaged about 2,075 square feet from 2008 through 2014.
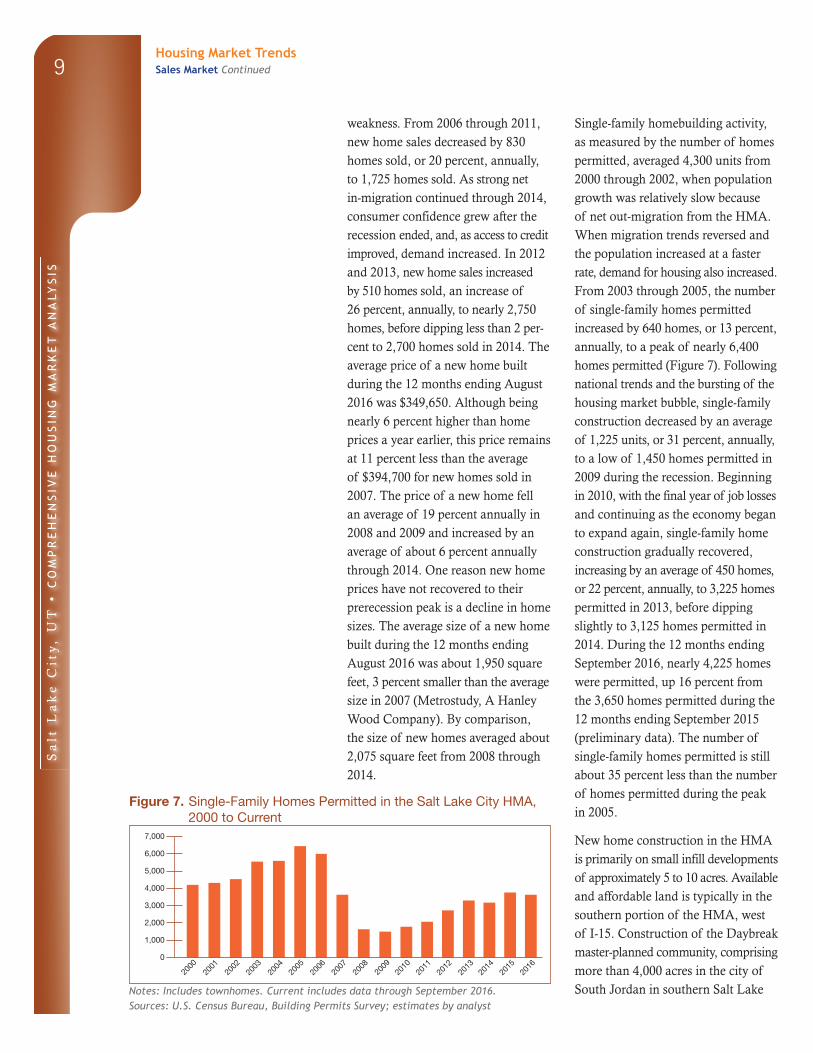
Single-family homebuilding activity, as measured by the number of homes permitted, averaged 4,300 units from 2000 through 2002, when population growth was relatively slow because of net out-migration from the HMA. When migration trends reversed and the population increased at a faster rate, demand for housing also increased. From 2003 through 2005, the number of single-family homes permitted increased by 640 homes, or 13 percent, annually, to a peak of nearly 6,400 homes permitted (Figure 7). Following national trends and the bursting of the housing market bubble, single-family construction decreased by an average of 1,225 units, or 31 percent, annually, to a low of 1,450 homes permitted in 2009 during the recession. Beginning in 2010, with the final year of job losses and continuing as the economy began to expand again, single-family home construction gradually recovered, increasing by an average of 450 homes, or 22 percent, annually, to 3,225 homes permitted in 2013, before dipping slightly to 3,125 homes permitted in 2014. During the 12 months ending September 2016, nearly 4,225 homes were permitted, up 16 percent from the 3,650 homes permitted during the 12 months ending September 2015 (preliminary data). The number of single-family homes permitted is still about 35 percent less than the number of homes permitted during the peak in 2005.
New home construction in the HMA is primarily on small infill developments of approximately 5 to 10 acres. Avail able and affordable land is typically in the southern portion of the HMA, west of I-15. Construction of the Daybreak master-planned community, comprising more than 4,000 acres in the city of South Jordan in southern Salt Lake
Figure 7. Single-Family Homes Permitted in the Salt Lake City HMA, 2000 to Current
Notes: Includes townhomes. Current includes data through September 2016.Sources: U.S. Census Bureau, Building Permits Survey; estimates by analyst
Housing Market TrendsSales Market Continued
2000
2001
2002
2003
2004
2005
2006
7,000
6,000
5,000
4,000
3,000
2,000
1,000
0
2008
2009
2010
2011
2013
2016
2015
2014
2012
2007

Sa
lt L
ak
e C
ity
, U
T •
CO
MP
RE
HE
NS
IVE
HO
US
ING
MA
RK
ET
AN
ALY
SIS
10
County, is currently under way. Con-struction began in 2004, and approxi-mately 4,500 homes of the 20,000 total planned homes are completed. Construction is expected to continue beyond 2030. Heights Park Village,
the newest subdivision at Daybreak, began construction in July 2016, with plans for approximately 440 single-family homes and prices starting in the high $200,000s.
During the 3-year forecast period, demand is expected for 12,900 new homes (Table 1). Demand is expected to increase during each year of the forecast period because of increased population growth. The 3,000 homes already under construction and a portion of the estimated 8,000 other vacant homes that may reenter the sales market will satisfy some of the forecast demand. Approximately 40 percent of the demand is for homes priced at less than $300,000 (Table 4).
Table 4. Estimated Demand for New Market-Rate Sales Housing in the Salt Lake City HMA During the Forecast Period
Price Range ($) Units of PercentFrom To Demand of Total
200,000 249,999 2,450 19.0250,000 299,999 2,700 21.0300,000 349,999 2,325 18.0350,000 399,999 1,550 12.0400,000 449,999 1,300 10.0450,000 499,999 1,025 8.0500,000 599,999 1,025 8.0600,000 and higher 520 4.0
Notes: The 3,000 homes currently under construction and a portion of the estimated 8,000 other vacant units in the submarket will likely satisfy some of the forecast demand. The forecast period is October 1, 2016, to October 1, 2019.Source: Estimates by analyst
Rental MarketThe rental housing market in the Salt Lake City HMA is balanced. The overall rental vacancy rate (which includes apartments, single-family homes, mobile homes, and other rental units) is currently estimated at 4.9 percent, down from 6.9 percent in April 2010 (Figure 8). Approximately 30 percent of renters lived in single-family homes in 2015, a decrease from nearly 35 percent in 2010 (2010 and 2015 ACS 1-year estimates). Nearly 69 percent of renters lived in multifamily structures with two or
more units, primarily apartments, in 2015, up from approximately 64 percent in 2010. Increased apartment construction from 2011 through 2015 contributed to rental alternatives and the decrease in the share of single-family homes as rental units.
Apartment market conditions are slightly tight because absorption has remained strong despite a large number of apartments having been constructed since 2014. During the third quarter of 2016, the apartment vacancy rate in the HMA averaged 2.9 percent, down from 4.0 percent a year earlier (MPF Research). The average rent increased 8 percent, to $1,001. By number of bedrooms, rents averaged $750, $873, $1,054, and $1,236 for a studio, one-bedroom, two-bedroom, or three-bedroom unit, respectively. Concessions increased from less than 1 percent to slightly more than 5 percent of units offering specials; however, this rate is far less
Figure 8. Rental Vacancy Rates in the Salt Lake City HMA, 2000 to Current
Note: The current date is October 1, 2016.
Sources: 2000 and 2010—2000 Census and 2010 Census; current—estimates by analyst
Housing Market TrendsSales Market Continued
2000 Current2010
6.6
4.9
6.97.0
6.0
5.0
4.0
3.0
2.0
1.0
0.0
Sa
lt L
ak
e C
ity
, U
T •
CO
MP
RE
HE
NS
IVE
HO
US
ING
MA
RK
ET
AN
ALY
SIS
11
than the 36 percent of units offering concessions in 2011. Concessions in units built since 2010 more than doubled during the past year, to 7 percent, when management at new developments offered deals to hasten the lease-up process and more projects competed with each other for tenants.
The MPF Research-defined Downtown Salt Lake City/University market area is the tightest market in the HMA. The average vacancy rate was 1.8 percent during the third quarter of 2016, down from 2.9 percent a year earlier. The market area has the second highest rents in the HMA but had the fastest rent growth during the past year, in-creasing 12 percent to average $1,038. Students at The University of Utah account for about 6 percent of the HMA renter households and contribute to strong rental demand in the market area. Enrollment growth during the next 3 years will increase demand in the market area surrounding the university.
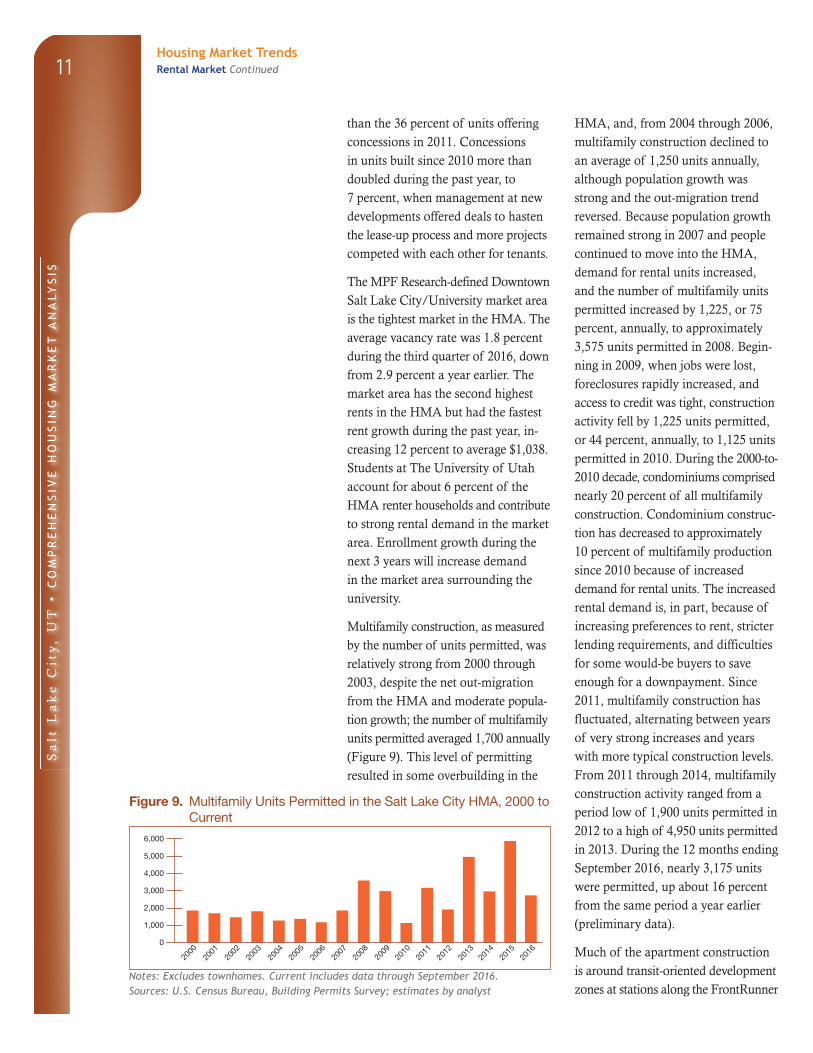
Multifamily construction, as measured by the number of units permitted, was relatively strong from 2000 through 2003, despite the net out-migration from the HMA and moderate popula -tion growth; the number of multi family units permitted averaged 1,700 annually (Figure 9). This level of permitting resulted in some overbuilding in the
HMA, and, from 2004 through 2006, multifamily construction declined to an average of 1,250 units annually, although population growth was strong and the out-migration trend reversed. Because population growth remained strong in 2007 and people continued to move into the HMA, demand for rental units increased, and the number of multifamily units permitted increased by 1,225, or 75 percent, annually, to approximately 3,575 units permitted in 2008. Begin-ning in 2009, when jobs were lost, foreclosures rapidly increased, and access to credit was tight, construction activity fell by 1,225 units permitted, or 44 percent, annually, to 1,125 units permitted in 2010. During the 2000-to- 2010 decade, condominiums comprised nearly 20 percent of all multifamily construction. Condominium construc-tion has decreased to approximately 10 percent of multifamily production since 2010 because of increased demand for rental units. The increased rental demand is, in part, because of increasing preferences to rent, stricter lending requirements, and difficulties for some would-be buyers to save enough for a downpayment. Since 2011, multifamily construction has fluctuated, alternating between years of very strong increases and years with more typical construction levels. From 2011 through 2014, multifamily construction activity ranged from a period low of 1,900 units permitted in 2012 to a high of 4,950 units permitted in 2013. During the 12 months ending September 2016, nearly 3,175 units were permitted, up about 16 percent from the same period a year earlier (preliminary data).
Much of the apartment construction is around transit-oriented development zones at stations along the FrontRunner
Figure 9. Multifamily Units Permitted in the Salt Lake City HMA, 2000 to Current
Notes: Excludes townhomes. Current includes data through September 2016.Sources: U.S. Census Bureau, Building Permits Survey; estimates by analyst
Housing Market TrendsRental Market Continued
2000
2001
2002
2003
2004
2005
2006
6,000
5,000
4,000
3,000
2,000
1,000
0
2008
2009
2010
2011
2013
2016
2015
2014
2012
2007
Sa
lt L
ak
e C
ity
, U
T •
CO
MP
RE
HE
NS
IVE
HO
US
ING
MA
RK
ET
AN
ALY
SIS
12
commuter and TRAX light rail lines. In August 2016, the 127-unit Novi at Jordan Valley Station opened in West Jordan, with monthly rents for the studio, one-bedroom, two-bedroom, and three-bedroom units starting at $955, $975, $1,405, and $1,625, respectively. The 266-unit Liberty Boulevard is under construction in the city of Salt Lake City, with 54 of the units restricted to households earning 50 percent of the Area Median Income. Completion of Liberty Boulevard is expected by late 2017.
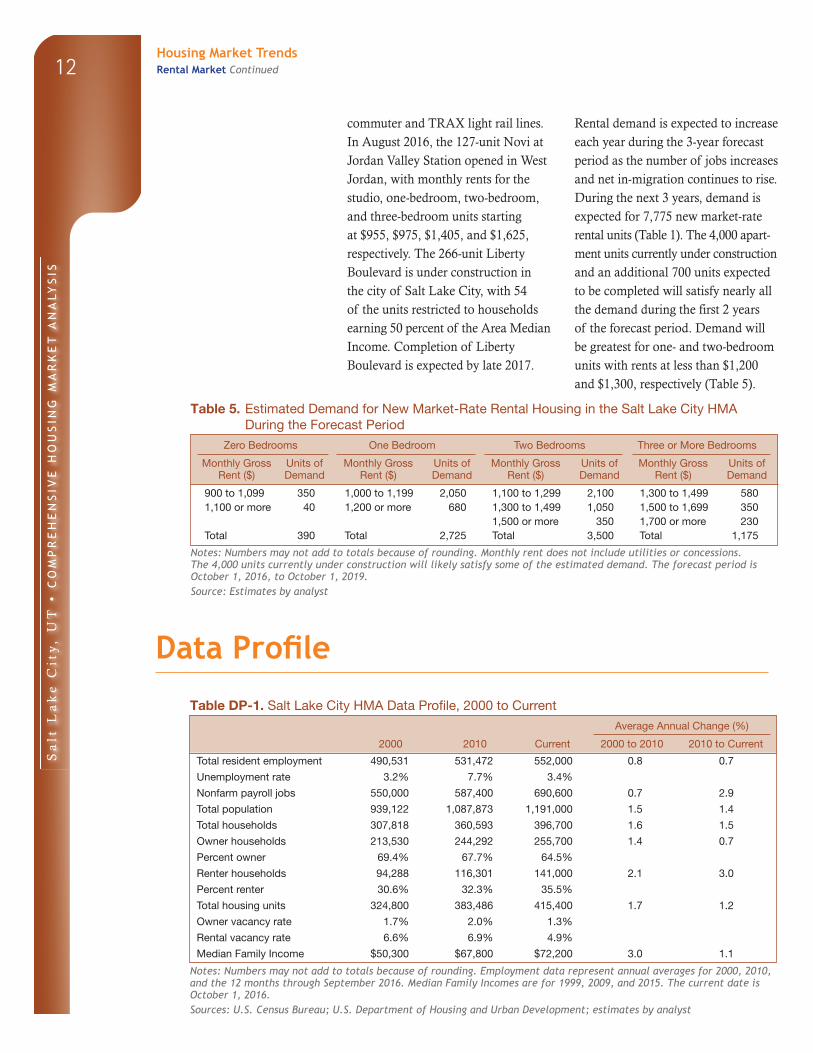
Rental demand is expected to increase each year during the 3-year forecast period as the number of jobs increases and net in-migration continues to rise. During the next 3 years, demand is expected for 7,775 new market-rate rental units (Table 1). The 4,000 apart-ment units currently under construc tion and an additional 700 units expected to be completed will satisfy nearly all the demand during the first 2 years of the forecast period. Demand will be greatest for one- and two-bedroom units with rents at less than $1,200 and $1,300, respectively (Table 5).
Table 5. Estimated Demand for New Market-Rate Rental Housing in the Salt Lake City HMA During the Forecast Period
Zero Bedrooms One Bedroom Two Bedrooms Three or More Bedrooms
Monthly Gross Rent ($)
Units of Demand
Monthly Gross Rent ($)
Units of Demand
Monthly Gross Rent ($)
Units of Demand
Monthly Gross Rent ($)
Units of Demand
900 to 1,099 350 1,000 to 1,199 2,050 1,100 to 1,299 2,100 1,300 to 1,499 5801,100 or more 40 1,200 or more 680 1,300 to 1,499 1,050 1,500 to 1,699 350
1,500 or more 350 1,700 or more 230Total 390 Total 2,725 Total 3,500 Total 1,175
Notes: Numbers may not add to totals because of rounding. Monthly rent does not include utilities or concessions. The 4,000 units currently under construction will likely satisfy some of the estimated demand. The forecast period is October 1, 2016, to October 1, 2019.Source: Estimates by analyst
Data Profile
Table DP-1. Salt Lake City HMA Data Profile, 2000 to Current
Average Annual Change (%)
2000 2010 Current 2000 to 2010 2010 to Current
Total resident employment 490,531 531,472 552,000 0.8 0.7
Unemployment rate 3.2% 7.7% 3.4%
Nonfarm payroll jobs 550,000 587,400 690,600 0.7 2.9
Total population 939,122 1,087,873 1,191,000 1.5 1.4
Total households 307,818 360,593 396,700 1.6 1.5
Owner households 213,530 244,292 255,700 1.4 0.7
Percent owner 69.4% 67.7% 64.5%
Renter households 94,288 116,301 141,000 2.1 3.0
Percent renter 30.6% 32.3% 35.5%
Total housing units 324,800 383,486 415,400 1.7 1.2
Owner vacancy rate 1.7% 2.0% 1.3%
Rental vacancy rate 6.6% 6.9% 4.9%
Median Family Income $50,300 $67,800 $72,200 3.0 1.1
Notes: Numbers may not add to totals because of rounding. Employment data represent annual averages for 2000, 2010, and the 12 months through September 2016. Median Family Incomes are for 1999, 2009, and 2015. The current date is October 1, 2016.Sources: U.S. Census Bureau; U.S. Department of Housing and Urban Development; estimates by analyst
Housing Market TrendsRental Market Continued
Sa
lt L
ak
e C
ity
, U
T •
CO
MP
RE
HE
NS
IVE
HO
US
ING
MA
RK
ET
AN
ALY
SIS
13
Data Definitions and Sources
2000: 4/1/2000—U.S. Decennial Census
2010: 4/1/2010—U.S. Decennial Census
Current date: 10/1/2016—Analyst’s estimates
Forecast period: 10/1/2016–10/1/2019—
Analyst’s estimates
The metropolitan statistical area definitions
in this report are based on the delineations
established by the Office of Management and
Budget (OMB) in the OMB Bulletin dated
February 28, 2013.
Demand: The demand estimates in the analysis
are not a forecast of building activity. They are
the estimates of the total housing production
needed to achieve a balanced market at the end
of the 3-year forecast period given conditions on
the as-of date of the analysis, growth, losses, and
excess vacancies. The estimates do not account
for units currently under construction or units in
the development pipeline.
Other Vacant Units: In the U.S. Department of
Housing and Urban Development’s (HUD’s)
analysis, other vacant units include all vacant
units that are not available for sale or for rent.
The term therefore includes units rented or sold
but not occupied; held for seasonal, recreational,
or occasional use; used by migrant workers; and
the category specified as “other” vacant by the
Census Bureau.
Building Permits: Building permits do not neces-
sarily reflect all residential building activity that
occurs in an HMA. Some units are constructed
or created without a building permit or are issued
a different type of building permit. For example,
some units classified as commercial structures are
not reflected in the residential building permits.
As a result, the analyst, through diligent fieldwork, makes
an estimate of this additional construction activity. Some
of these estimates are included in the discussions of
single-family and multifamily building permits.
For additional data pertaining to the housing market
for this HMA, go to huduser.gov/publications/pdf/
CMARtables_SaltLakeCityUT_17.pdf.
Contact Information
Katharine Auchter, Economist
Denver HUD Regional Office
303–672–5060
This analysis has been prepared for the assistance
and guidance of HUD in its operations. The factual
information, findings, and conclusions may also be useful
to builders, mortgagees, and others concerned with local
housing market conditions and trends. The analysis
does not purport to make determinations regarding the
acceptability of any mortgage insurance proposals that
may be under consideration by the Department.
The factual framework for this analysis follows the
guidelines and methods developed by HUD’s Economic
and Market Analysis Division. The analysis and findings
are as thorough and current as possible based on
infor ma tion available on the as-of date from local and
national sources. As such, findings or conclusions may be
modi fied by subsequent developments. HUD expresses its
appreciation to those industry sources and state and local
government officials who provided data and information
on local economic and housing market conditions.
For additional reports on other market areas, please go to huduser.gov/portal/ushmc/chma_archive.html.