salt-templated method supporting information dimensional ... · salt powders added to forbid...
TRANSCRIPT

1
Supporting Information
Synthesis of single crystalline two-dimensional transition-metal phosphides via
salt-templated method
Tianqi Li,a Hongrun Jin,a Zhun Liang,b Liang Huang,a Yucheng Lu,a Huimin Yu,a
Zhimi Hu,a Jiabin Wu,a Bao Yu Xia,c Guang Feng,b Jun Zhoua*
aWuhan National Laboratory for Optoelectronics and School of Optical and
Electronic Information, Huazhong University of Science and Technology, Wuhan
430074, China
bState Key Laboratory of Coal Combustion, School of Energy and Power
Engineering, Huazhong University of Science and Technology, Wuhan 430074,
Hubei, P. R. China.
c Key laboratory of Material Chemistry for Energy Conversion and Storage (Ministry
of Education), Hubei Key Laboratory of Material Chemistry and Service Failure,
School of Chemistry and Chemical Engineering, Huazhong University of Science and
Technology, Wuhan 430074, Hubei, P. R. China.
* Correspondence author: [email protected]
Electronic Supplementary Material (ESI) for Nanoscale.This journal is © The Royal Society of Chemistry 2018

2
1. Experiment Details
Synthesis of 2D Co2P. Firstly, Co(NO3)2·6H2O (0.002 mol) was dissolved into
ethanol (40 ml). The above precursor solutions were added to 500 g of KCl powder
followed by drying at 60 ℃ with stirring. Secondly, (NH4)2HPO4 (0.39 g) was
dispersed in mixed solvent of deionized water (10 ml) and ethanol (10 ml) with some
salt powders added to forbid dissolution of salt templates. The Co@KCl powders
were covered with (NH4)2HPO4 solution in the same way. The resulting mixture was
transferred into alumina crucible which was placed at the center of tube furnace.
Under the protection of Ar/H2 atmosphere, the temperature was increased to 700 ℃
with the rate of 1 ℃ per minute and kept for 3 hours. After being cooled, the annealed
product was repeatedly washed with deionized water to remove the salt templates. In
order to prevent oxidation of the products in the washing process, N2 was bubbled
into deionized water constantly to exclude oxygen. The 2D Co2P nanosheets were
obtained by vacuum filtration. The resulting products were transferred into vacuum
drying oven to dry overnight at 50 ℃ for further characterization.
Synthesis of 2D MoP2. 2D MoP2 was synthesized through an identical procedure
but (NH4)6Mo7O24·4H2O and NaCl were used as metal precursor and salt templates,
respectively. Meanwhile, citric acid (0.004 mol) was dissolved into ethanol (50 ml)
and the as-obtained solution was added to salt powders. The resulting mixture was
preannealed at 500 ℃ in air before further annealed at 700 ℃ in the Ar/H2
atmosphere.
Synthesis of 2D Ni12P5. The procedure was identical with the synthesis of 2D
Co2P, but Ni(NO3)2·6H2O was used as metal precursor.
Synthesis of 2D WP2. The procedure was identical with the synthesis of 2D
MoP2, but (NH4)6H2W12O4·nH2O was used as metal precursor.
Synthesis of Co2P nanoparticles. The Co2P NPs are synthesized by the same
method of 2D Co2P without salt templates. In detail, we mixed Co(NO3)2·6H2O
solution and (NH4)2HPO4 solution in the Co/P atom ratio of 2:1. After vacuum
filtration, the precursors are annealed at 700 ℃ for 3 hours under the protection of
Ar/H2 atmosphere. The resulting products were transferred into vacuum drying oven
3
to dry overnight at 50 ℃ for further characterization.
Electrochemical measurements. Electrochemical measurements were evaluated
by CHI 660E electrochemical workstation. The counter and reference electrodes
selected were graphite rod and saturated calomel electrode (SCE), respectively. A
glassy carbon electrode (GCE, 5 mm in diameter) covered by catalyst materials was
used as the working electrode. The electrolyte was 0.5 M H2SO4 solutions. Typically,
5 mg 2D TMPs were suspended in mixed solvent of deionized water (200 μl) and
isopropyl alcohol (800 μl), then 20 μl Nafion solution (5.0 wt.%. Nafion in isopropyl
alcohol) was added to the as-obtained solution to form a homogeneous ink assisted by
sonication. 10 μl of the ink was loaded onto GCE by a micropipette and dried in
ambient temperature. Before measurements, the samples were repeatedly swept from
0.05 to 0.35 V (vs. RHE) in the electrolyte until a steady voltammogram curve was
obtained. The LSV curves were scanned from 0 to -0.7 V (vs. RHE) at a scan rate of 5
mV s−1. Electrochemical Impedance Spectroscopy (EIS) was measured at -30 mV (vs.
RHE) with the AC voltage amplitude of 5 mV and the frequency range of 0.1-106 Hz.
Characterization. The morphology, microstructure and valence state of the
samples were characterized by field-emission scanning electron microscope (FEI
Nova 450 Nano), high-resolution transmission electron microscopy (FEI Titan G2 60-
300), Atomic force microscope (Shimadzu), X-ray photoelectron spectrum
(ESCALab250). The powder X-ray diffraction (X’Pert Pro, PANanalytical)
measurements were taken at 40 kV accelerating voltage and a 40 mA current with Cu
Kα radiation. For the AFM measurements, the samples were dropped on SiO2/Si and
dried at room temperature.
2. Supplementary Notes
Supplementary Note 1: Growth mechanism of MoP2
According to the growth mechanism, the lattice mismatch between (010) plane of
MoP2 (c-axis is 0.4984 nm) and (001) plane of NaCl (a-axis is 0.5620 nm) is 12%
(Fig. 3d), which is against to the surface growth. However, the orthorhombic structure
4
of MoP2 and large b axis take conducive to formation of 2D MoP2 morphology,
because thin layered morphology (Figure S3) usually has larger b axis than the bulk.
Owing to atomic thin film of MoP2 and the large lattice mismatch between MoP2 and
NaCl, there will be some lattice distortion in MoP2 leading to no
(020)/(040)/(060)/(080) peak exist in the mixture of MoP2@NaCl XRD pattern even
at slow scan (Figure S4). After removing the NaCl template, the MoP2 exposes out
(010) crystal plane caused by the nanosheets stack together.
Supplementary Note 2: Active sites calculation
The active sites calculation of Pt/C is based on CO stripping experiment.1,2 The
oxidation peak at 0.78 V can be attributed to the CO stripping peak. The number of
active sites in Pt/C was further calculated to 0.4 mmol/g.
In order to calculate the active sites of 2D Co2P, we design a catalyst poisoning
method. Firstly, we added KSCN to poison Pt/C catalyst. According to polarization
curves, the onset potential of Pt/C shifted to -30 mV. Moreover, the under potential
deposition of hydrogen on Pt is not clear. While it is difficult to assign the observed
peaks to a given redox couple, the total number of active sites could be calculated
from reported method. The total charge with removing electrochemical double layer
capacitance has been integrated from CV curves. The number of active sites in Pt/C
was calculated to 0.428 mmol/g which is close to the CO stripping method.
The active sites calculation of 2D Co2P is based on integral of CV curves.3 The
onset potential of 2D Co2P for HER shifted to -80 mV. Similarly, the number of
active sites could be calculated from integral of CV curves, which is 0.308 mmol/g for
2D Co2P. The number of active sites of Co2P nanoparticle is 0.165 mmol/g.
Supplementary Note 3: The calculation of TOF
The calculation of TOF is based on the following equation:
TOF=I/(2Fn)
where I is the current (A) during linear sweep measurement, F is the Faraday constant
(C/mol), n is the number of active sites (mol). The factor 1/2 is based on the
consideration that two electrons are required to form one hydrogen molecule.

5
3. Supplementary Figures:
Figure S1. (a) and (b) The SEM images of KCl coating with 2D Co2P.
Figure S2. The AFM image of 2D Co2P. The thickness of 2D Co2P is 4 nm.
Figure S3. XPS spectra of Co2P. Survey spectra (a) and P 2p (b). The peaks of P 2p
are divided into four peaks, corresponding to P-Co 2p3/2 (129.8 eV), P-Co 2p1/2
(130.7 eV), P-O 2p1/2 (132.0 eV) and P-O 2p3/2 (134.2 eV).
6
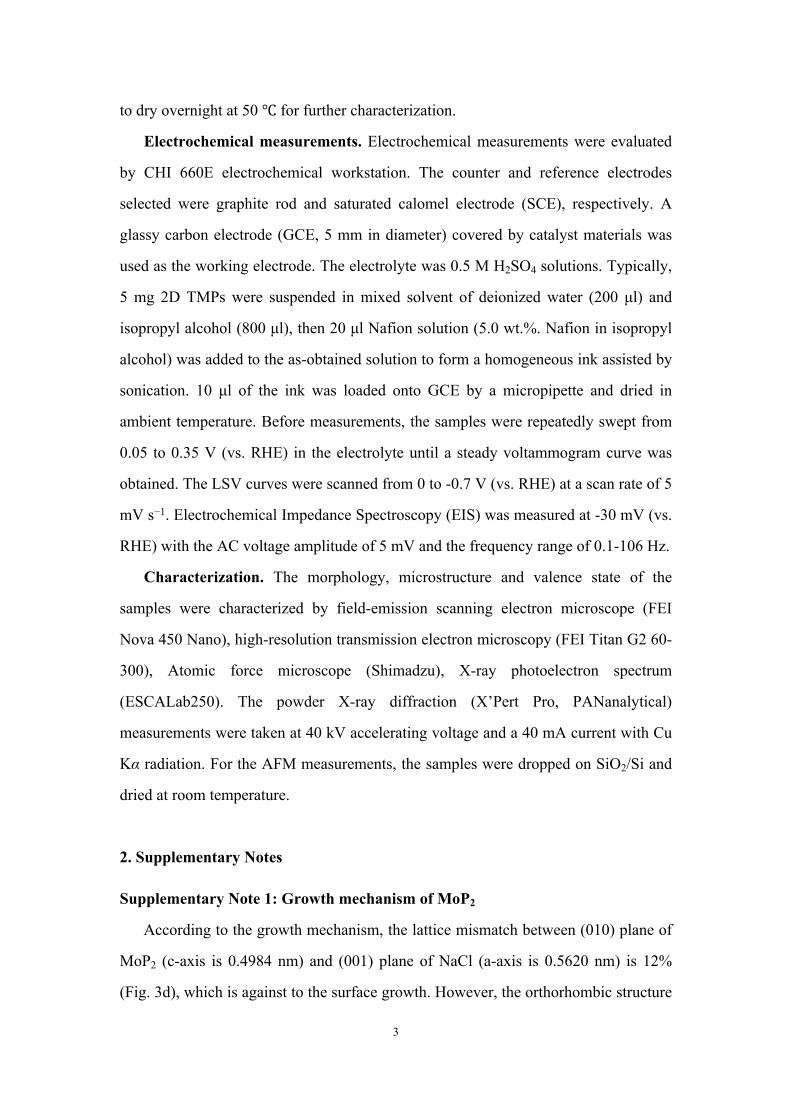
Figure S4. SEM image of 2D MoP2.
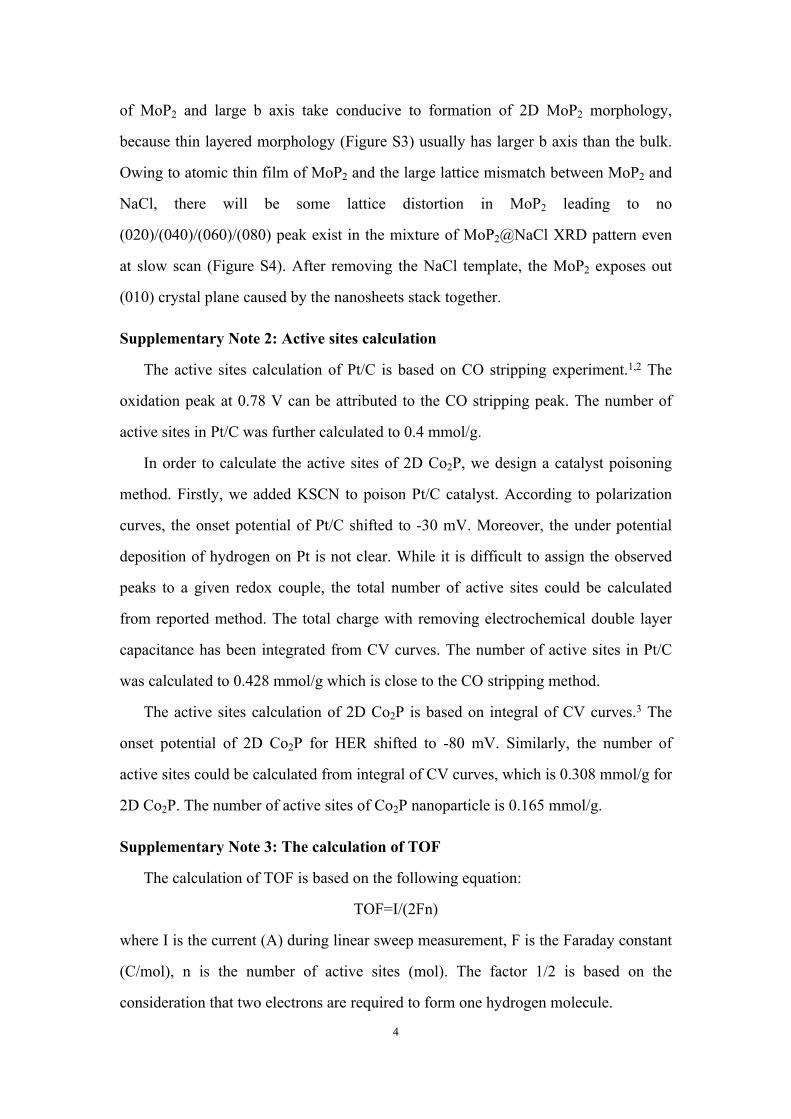
Figure S5. XRD pattern of 2D MoP2 on NaCl. All of the diffraction peaks belong to
NaCl.
Figure S6. (a) The SEM images of 2D Ni12P5. (b) The XRD pattern of 2D N12P5 on
KCl.

7
Figure S7. SEM image of 2D WP2.
Figure S8. AFM images of 2D TMPs. According to the AMF images, the thickness
of 2D MoP2 (a), Ni12P5 (b) and WP2 (c) is ~2.5 nm, ~ 1.8 nm and ~ 2.3 nm,
respectively. Scale bar, 0.5 μm.

8
Figure S9. XPS of 2D TMPs (MoP2, Ni12P5 and WP2). For these 2D TMPs, all their
surface had metal-oxygen and metal-phosphorus bonds. In detail, the peaks of Mo-P
bond (a), Ni-P bond (b) and W-P bond (c) could be analyzed by Mo 3d (228.0 eV for
Mo 3d5/2, 231.2 eV for Mo 3d3/2), Ni 2p (853.6 eV Ni 2p3/2, 871.2 eV for Ni 2p1/2) and
W 4f (31.78 eV for W 4f7/2, 34.08 eV for W 4f5/2), respectively. Analogous to Co2P,
MoP2, Ni12P5 and WP2 also have partial oxidization on the surface. We believe the
oxidation layers of these 2D TMPs may help them stably disperse in water. The XPS
spectra of P 2p. (d) The peaks of 2D MoP2 are divided into four peaks, corresponding
to P-Mo 2p3/2 (~129.5 eV), P-Mo 2p1/2 (~130.3 eV), P-O 2p1/2 (~133.3 eV) and P-O
2p3/2 (~134.2 eV). (e) The peaks of 2D N12P5 are divided into four peaks,
corresponding to P-Mo 2p3/2 (~129.5 eV), P-Mo 2p1/2 (~129.8 eV), P-O 2p1/2 (~133.8
eV) and P-O 2p3/2 (~135.0 eV). (f) The peaks of 2D WP2 are divided into four peaks,
corresponding to P-Mo 2p3/2 (~129.8 eV), P-Mo 2p1/2 (~130.6 eV), P-O 2p1/2 (~133.8
eV) and P-O 2p3/2 (~134.6 eV).

9
Figure S10. Co2P synthesized on NaCl. According to SEM image (a) the morphology is particle instead of 2D nanosheet. (b) The XRD pattern of Co2P synthesized on NaCl.
Figure S11. The SEM images of Co2P nanoparticles.
Figure S12. TOF calculation of Pt/C. (a) The CO stripping voltammetry of Pt/C in 0.5 M aq. H2SO4. Stripping of a monolayer of CO in the first cycle. Following cycle after the stripping of CO. (b) The linear sweep voltammetry (LSV) curves of Pt/C before and after KSCN poisoning. (c) The cyclic voltammetry (CV) curves of poisoned Pt/C with hydrogen atom absorbed.
10
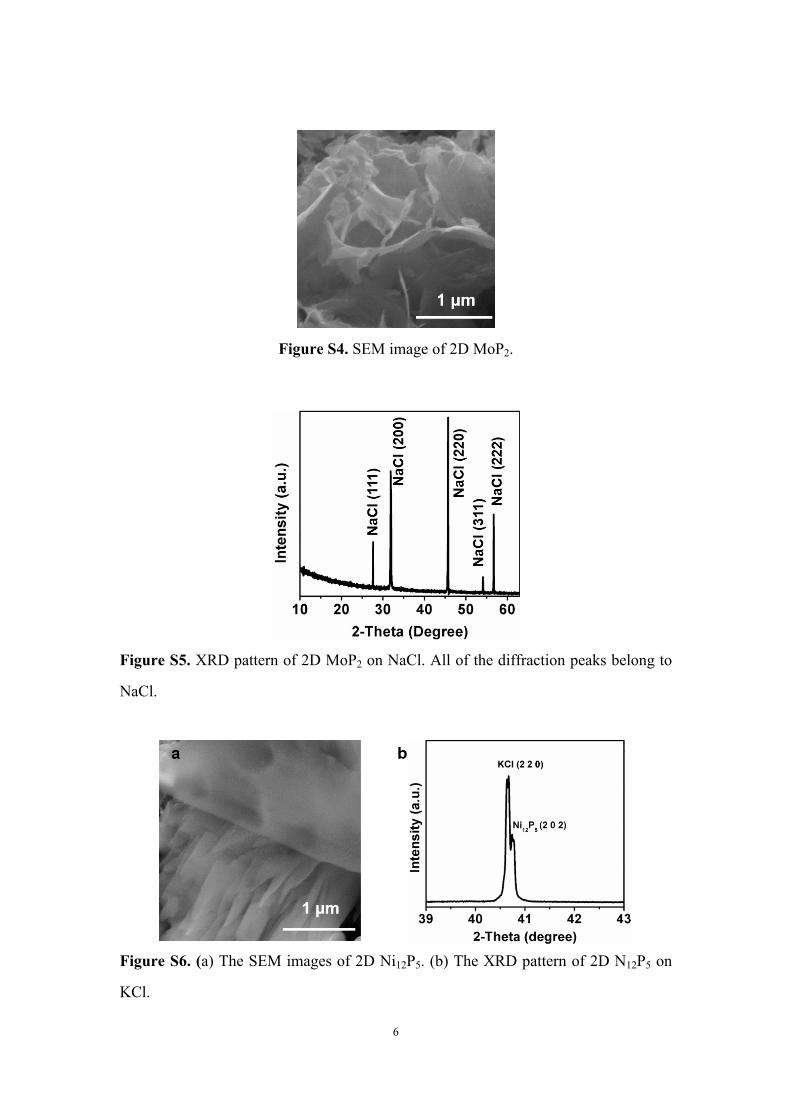
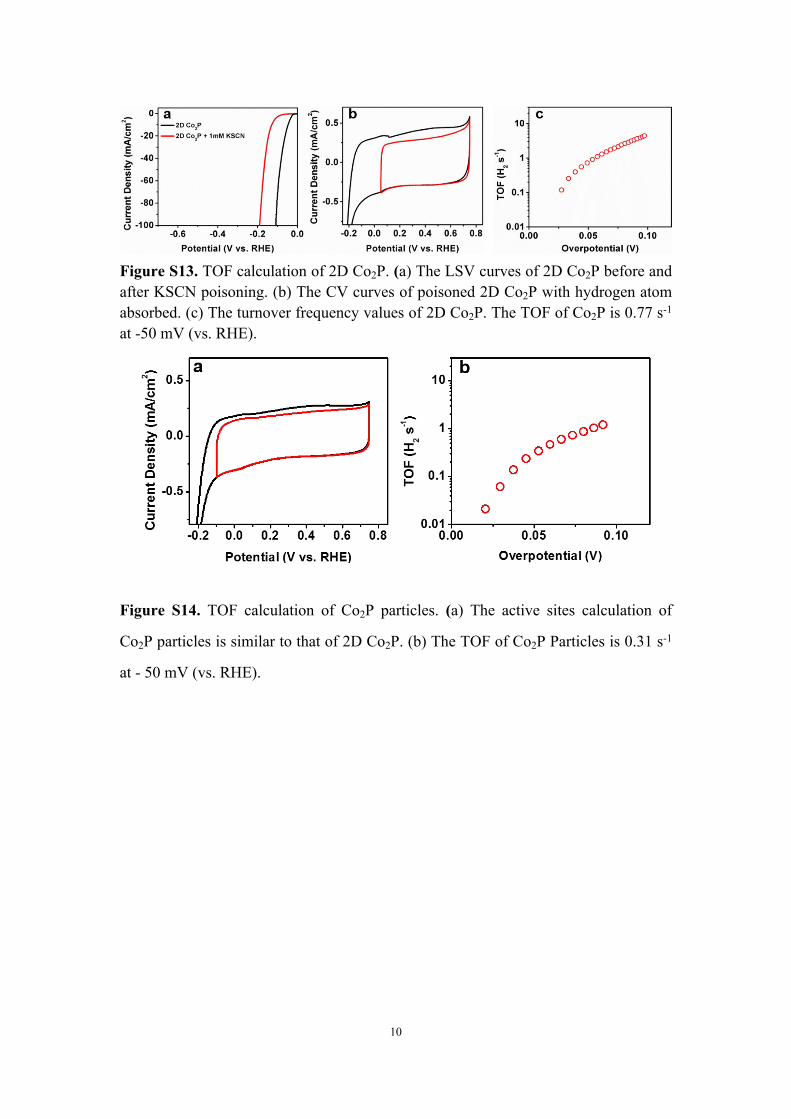
Figure S13. TOF calculation of 2D Co2P. (a) The LSV curves of 2D Co2P before and after KSCN poisoning. (b) The CV curves of poisoned 2D Co2P with hydrogen atom absorbed. (c) The turnover frequency values of 2D Co2P. The TOF of Co2P is 0.77 s-1 at -50 mV (vs. RHE).
Figure S14. TOF calculation of Co2P particles. (a) The active sites calculation of
Co2P particles is similar to that of 2D Co2P. (b) The TOF of Co2P Particles is 0.31 s-1
at - 50 mV (vs. RHE).

11
Figure S15. Durability test of 2D Co2P. Durability test of 2D Co2P is based on the
polarization curves before and after 5000 potential cycles (50 mV/s) in 0.5 M H2SO4
solution from 0 V to 0.6 V (vs. RHE).
12
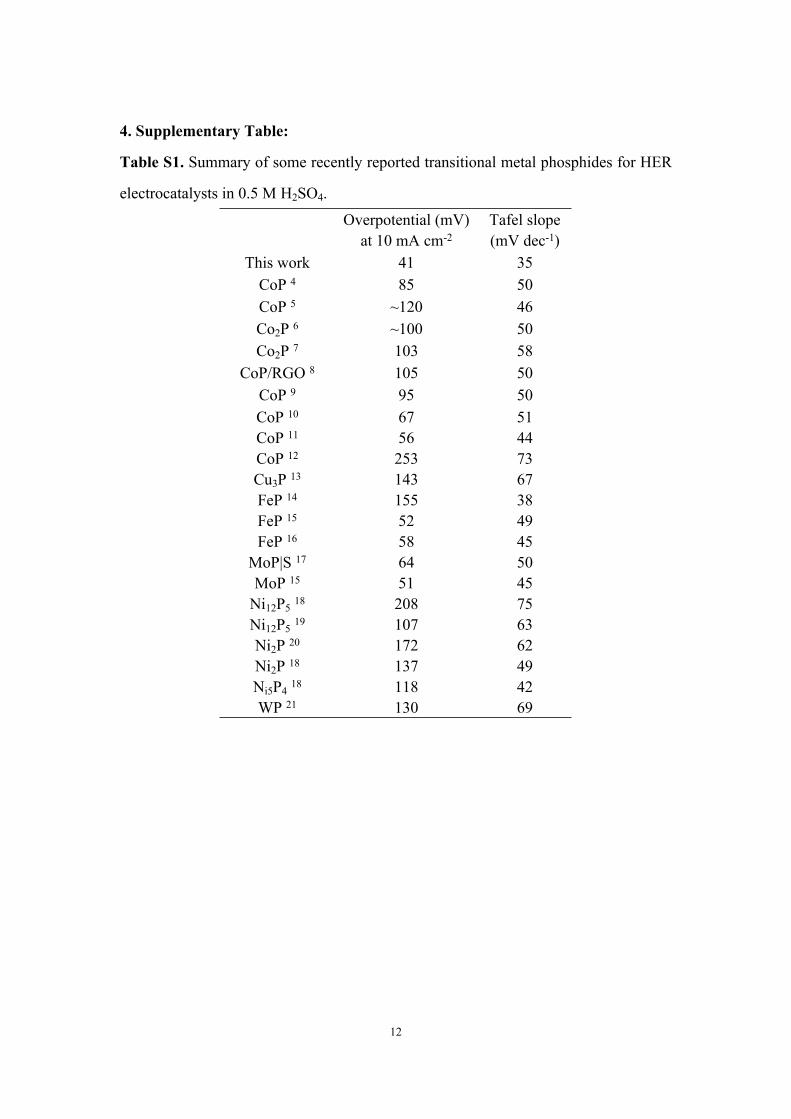
4. Supplementary Table:
Table S1. Summary of some recently reported transitional metal phosphides for HER
electrocatalysts in 0.5 M H2SO4.
Overpotential (mV) at 10 mA cm-2
Tafel slope (mV dec-1)
This work 41 35CoP 4 85 50CoP 5 ~120 46Co2P 6 ~100 50Co2P 7 103 58
CoP/RGO 8 105 50CoP 9 95 50CoP 10 67 51CoP 11 56 44CoP 12 253 73Cu3P 13 143 67FeP 14 155 38FeP 15 52 49FeP 16 58 45
MoP|S 17 64 50MoP 15 51 45
Ni12P5 18 208 75Ni12P5 19 107 63Ni2P 20 172 62Ni2P 18 137 49Ni5P4 18 118 42WP 21 130 69
13
REFERENCES
1. H. A. Gasteiger, N. Markovic, P. N. Ross and E. J. Cairns, J. Phys. Chem., 1994, 98, 617-625.
2. J. Mahmood, F. Li, S. M. Jung, M. S. Okyay, I. Ahmad, S. J. Kim, N. Park, H. Y. Jeong and J. B. Baek, Nat. Nanotechnol., 2017, 12, 441-446.
3. D. Merki, S. Fierro, H. Vrubel and X. Hu, Chem. Sci., 2011, 2, 1262-1267.4. F. H. Saadi, A. I. Carim, E. Verlage, J. C. Hemminger, N. S. Lewis and M. P.
Soriaga, J. Phys. Chem. C, 2014, 118, 29294-29300.5. H. Yang, Y. Zhang, F. Hu and Q. Wang, Nano Lett., 2015, 15, 7616-7620.6. J. F. Callejas, C. G. Read, E. J. Popczun, J. M. McEnaney and R. E. Schaak,
Chem. Mater., 2015, 27, 3769-3774.7. M. Zhuang, X. Ou, Y. Dou, L. Zhang, Q. Zhang, R. Wu, Y. Ding, M. Shao and
Z. Luo, Nano Lett., 2016, 16, 4691-4698.8. L. Jiao, Y.-X. Zhou and H.-L. Jiang, Chem. Sci., 2016, 7, 1690-1695.9. E. J. Popczun, C. G. Read, C. W. Roske, N. S. Lewis and R. E. Schaak, Angew.
Chem. Int. Ed, 2014, 53, 5427-5430.10. J. Tian, Q. Liu, A. M. Asiri and X. Sun, J. Am. Chem. Soc., 2014, 136, 7587-
7590.11. C. Zhang, Y. Huang, Y. Yu, J. Zhang, S. Zhuo and B. Zhang, Chem. Sci., 2017,
8, 2769-2775.12. Z. H. Xue, H. Su, Q. Y. Yu, B. Zhang, H. H. Wang, X. H. Li and J. S. Chen, Adv.
Energy Mater., 2017, 7, 1602355.13. J. Tian, Q. Liu, N. Cheng, A. M. Asiri and X. Sun, Angew. Chem. Int. Ed., 2014,
53, 9577-9581.14. P. Jiang, Q. Liu, Y. Liang, J. Tian, A. M. Asiri and X. Sun, Angew. Chem. Int.
Ed., 2014, 53, 12855-12859.15. S. Han, Y. Feng, F. Zhang, C. Yang, Z. Yao, W. Zhao, F. Qiu, L. Yang, Y. Yao,
X. Zhuang and X. Feng, Adv. Funct. Mater., 2015, 25, 3899-3906.16. Y. Liang, Q. Liu, A. M. Asiri, X. Sun and Y. Luo, ACS Cata., 2014, 4, 4065-
4069.17. J. Kibsgaard and T. F. Jaramillo, Angew. Chem. Int. Ed., 2014, 53, 14433-14437.18. Y. Pan, Y. Liu, J. Zhao, K. Yang, J. Liang, D. Liu, W. Hu, D. Liu, Y. Liu and C.
Liu, J. Mater. Chem. A, 2015, 3, 1656-1665.19. Z. Huang, Z. Chen, Z. Chen, C. Lv, H. Meng and C. Zhang, ACS Nano, 2014, 8,
8121-8129.20. T. Tian, L. Ai and J. Jiang, RSC Adv., 2015, 5, 10290-10295.21. Z. Pu, Q. Liu, A. M. Asiri and X. Sun, ACS Appl. Mater. Interfaces, 2014, 6,
21874-21879.