salts in the williston basin, north dakota · salts in the williston basin, north dakota ......
TRANSCRIPT
i
Report of Investigations No. 103
NORTH DAKOTA GEOLOGICAL SURVEYEdward C. Murphy, State GeologistLynn D. Helms, Director Dept of Mineral Resources
2005
SALTS IN THE WILLISTON BASIN, NORTH DAKOTA
Julie A. LeFever1 and Richard D. LeFever2
1North Dakota Geological SurveyUniversity Station
Grand Forks ND 58202
2Department of Geology and Geological EngineeringUniversity of North Dakota
Grand Forks ND 58202

ii
TABLE OF CONTENTS
Illustrations ............................................................................................................................................. iii
Abstract ................................................................................................................................................. 1
Introduction ............................................................................................................................................ 2
Methods ................................................................................................................................................. 2
Minor Salts ............................................................................................................................................. 3Silurian ............................................................................................................................................. 3
Interlake Formation .................................................................................................................... 3Devonian .......................................................................................................................................... 3
Ashern Formation ....................................................................................................................... 3Souris River Formation ............................................................................................................... 5Duperow Formation ................................................................................................................... 5
Mississippian .................................................................................................................................... 5Charles Formation ...................................................................................................................... 5Kibbey Formation ...................................................................................................................... 5
Major Salts .......................................................................................................................................... 13Devonian ........................................................................................................................................ 13
Prairie Formation ...................................................................................................................... 13Mississippian .................................................................................................................................. 13
Charles Formation .................................................................................................................... 13Permian .......................................................................................................................................... 13
Opeche Formation .................................................................................................................... 13Triassic (?) ...................................................................................................................................... 23
Spearfish Formation .................................................................................................................. 23Jurassic .......................................................................................................................................... 23
Piper Formation ........................................................................................................................ 23
Salt Dissolution ..................................................................................................................................... 23Recognition .................................................................................................................................... 23Mechanisms ................................................................................................................................... 29Dissolution ...................................................................................................................................... 29Prairie Formation ............................................................................................................................ 32Charles Formation .......................................................................................................................... 36Opeche Formation .......................................................................................................................... 37Spearfish Formation ........................................................................................................................ 37Piper Formation .............................................................................................................................. 37
Hydrocarbon Traps .............................................................................................................................. 37
Summary .............................................................................................................................................. 38
References Cited .................................................................................................................................. 38

iii
ILLUSTRATIONS
Figure 1. Stratigraphic column of North Dakota ..................................................................................... 2Figure 2. Index map showing the location of the study area .................................................................... 3Figure 3. A.) Typical log characteristics of Interlake salts ....................................................................... 4
B.) Isopach of the combined Interlake salts ............................................................................ 4Figure 4. A.) Typical log characteristics of Ashern salts .......................................................................... 6
B.) Isopach map of the N salts ............................................................................................... 6C.) Isopach map of M salts .................................................................................................... 6
Figure 5. A.)Typical log characteristics of the Davidson salt, Souris River Formation .............................. 7B.) Isopach map of the Davidson salt ...................................................................................... 7
Figure 6. A.)Typical log characteristics of the Flat Lake salt, Duperow Formation .................................. 8B.) Isopach map of the Flat Lake salt ..................................................................................... 8
Figure 7. A.) Typical log characteristics of the Sherwood, Bluell, and Rival salts of the lower CharlesFormation .............................................................................................................................. 9B.) Isopach map of the Sherwood salt ................................................................................... 9C.) Isopach map of the Bluell salt ........................................................................................ 10D.) Isopach map of the Rival salt .......................................................................................... 10E.) Typical log characteristics of the Midale salt ..................................................................... 11F.) Areal distribution of the Midale salt .................................................................................. 11
Figure 8. A.) Typical log characteristics of the salt in the Kibbey Formation .......................................... 12B.) Isopach map of the Kibbey salt ....................................................................................... 12
Figure 9. A.) Typical log characteristics of the Prairie Formation showing the salt and four members. .... 14B.) Isopach map of the Prairie salt ....................................................................................... 15C.) Isopach map of the Second Red Bed .............................................................................. 15
Figure 10. A.) Composite well log showing the typical log characteristics of the Charles salts ................. 16Figure 11. A.) Isopach map of the F1 salt ............................................................................................ 17
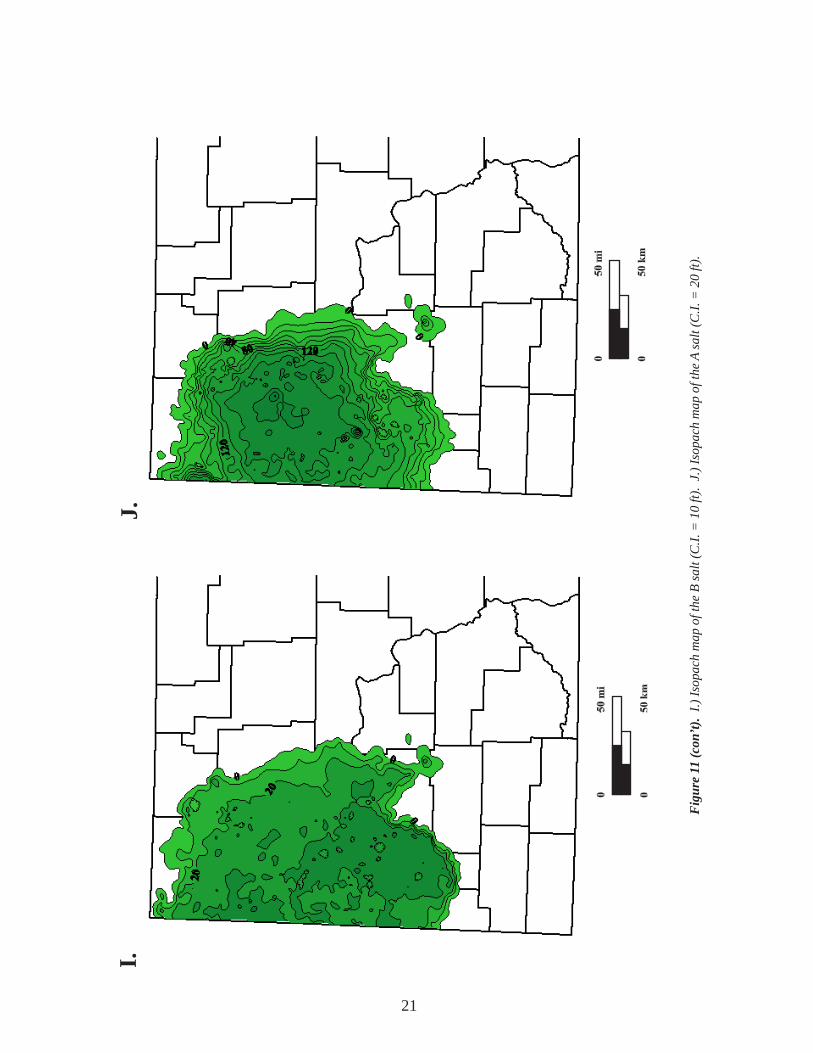
B.) Isopach map of the F salt ................................................................................................ 17C.) Isopach map of the E2 salt ............................................................................................ 18D.) Isopach map of the E1 salt ............................................................................................. 18E.) Isopach map of the E salt ............................................................................................... 19F.) Areal distribution of the D1 salt ....................................................................................... 19G.) Isopach map of the D salt .............................................................................................. 20H.) Isopach map of the C salt ............................................................................................... 20 I.) Isopach map of the B salt .............................................................................................. 21J.) Isopach map of the A salt ................................................................................................. 21K.) Isopach map of the A1 salt ............................................................................................ 22
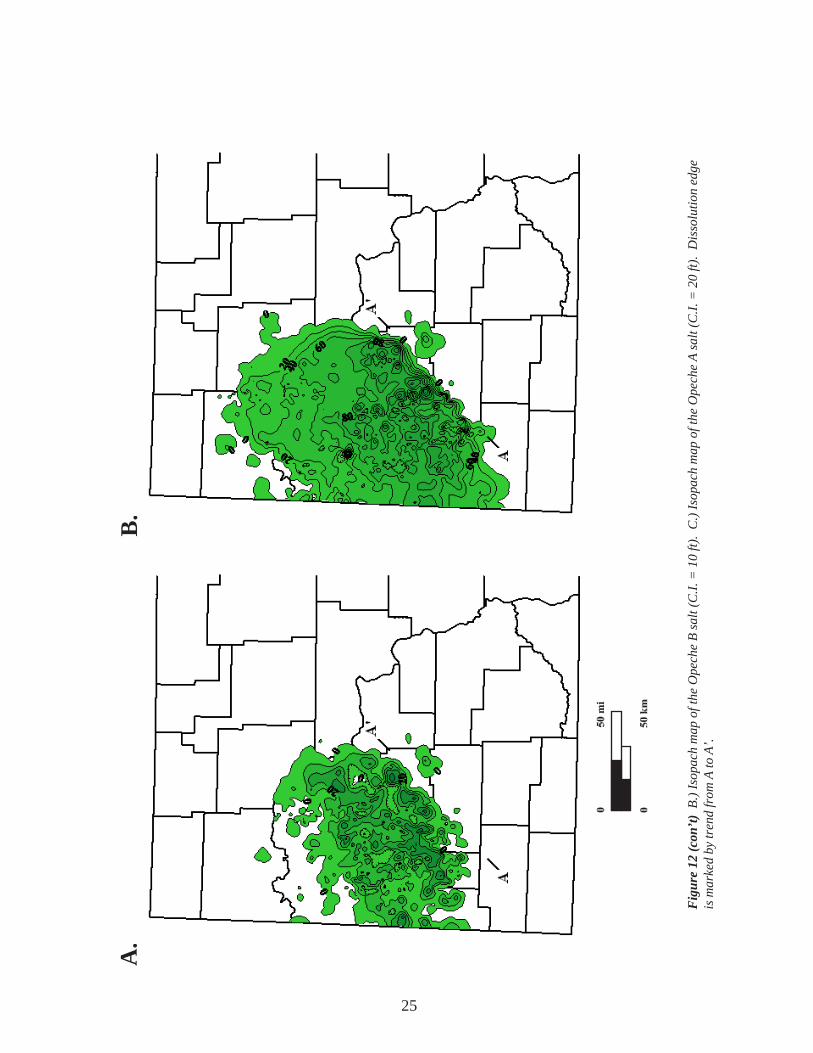
Figure 12. A.) Typical log characteristics of the two massive Opeche salts, B and A .............................. 24B.) Isopach map of the Opeche B salt ................................................................................. 25C.) Isopach map of the Opeche A salt .................................................................................. 25Dissolution edge is marked by trend from A to A’ .................................................................. 25
Figure 13. A.) Typical log characteristics of the salts of the Spearfish Formation ..................................... 26B.) Isopach of the Pine Salt Member .................................................................................... 26C.) Isopach of the G salt ..................................................................................................... 27D.) Areal distribution of the unnamed Spearfish salt ............................................................... 27
Figure 14. A.) Typical log characteristics of the Dunham salt of the Piper Formation ............................... 28B.) Isopach map of the Dunham salt ..................................................................................... 28

iv
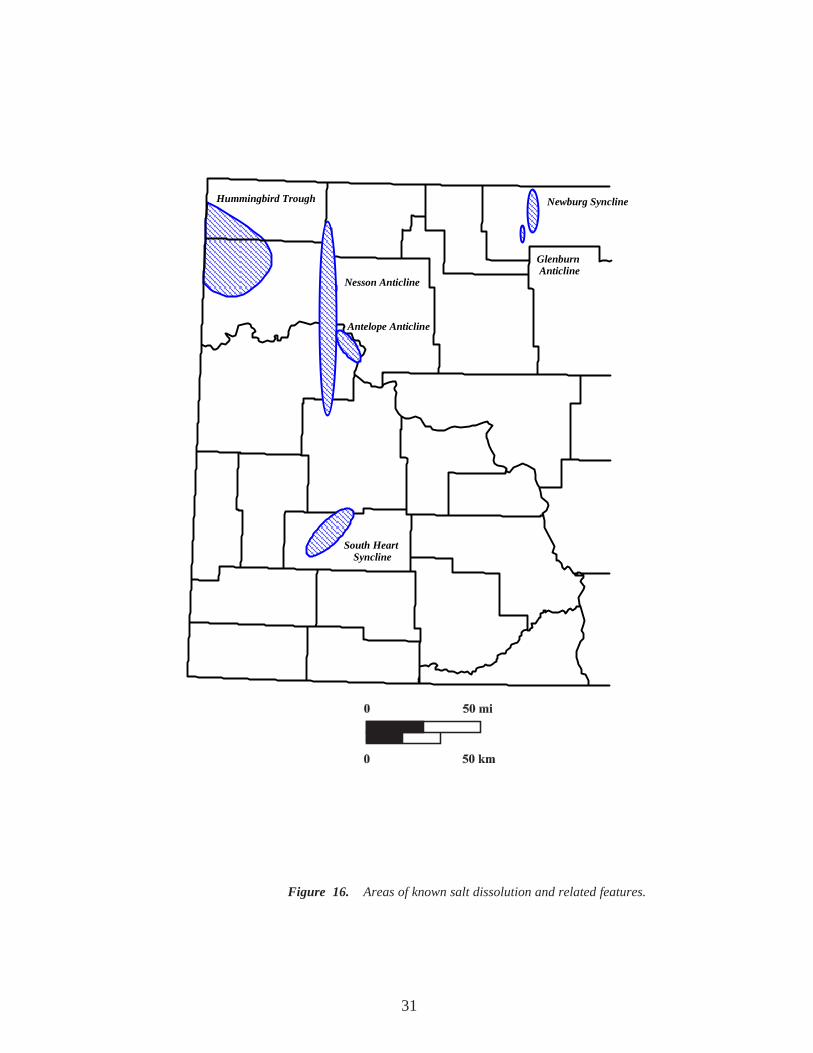
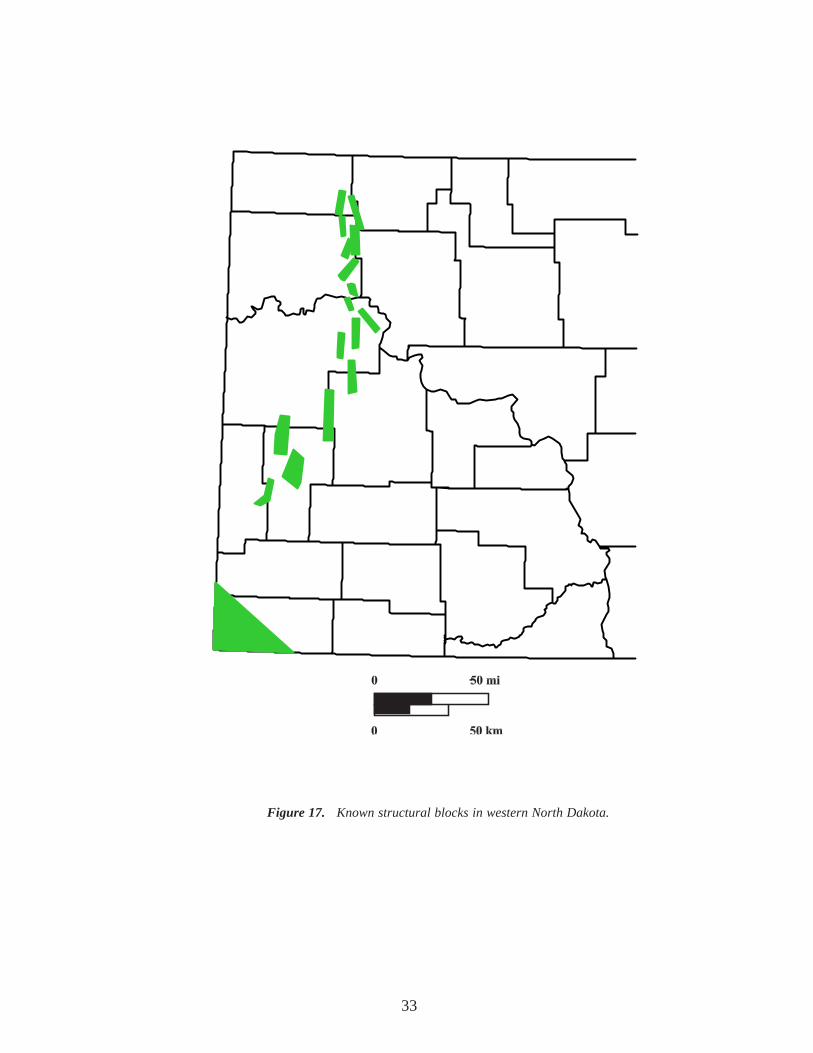
Figure 15. Proposed models for salt dissolution ..................................................................................... 30Figure 16. Areas of known salt dissolution and related features .............................................................. 31Figure 17. Known structural blocks in western North Dakota ................................................................ 33Figure 18. Isopach map of the the Dunham salt (Jurassic) in Blue Buttes Field, Nesson anticline .............. 34Figure 19. Known fault systems in western North Dakota ...................................................................... 35

1
ABSTRACT
Salts deposits are widespread throughout theWilliston Basin. Traceable salts range in age fromSilurian through Jurassic. For this study, thicknessesof 24 major and minor salts were obtained fromabout 5,600 wireline logs throughout North Dakota.From these data, isopach maps of all of the saltswere constructed. Areas of salt dissolution wereidentified by linking thinning on the salt isopach mapswith thicker compensating sections in the overlyingstrata.
The lowermost salts in the stratigraphic sectionare located within the Interlake (Silurian) and theAshern, Prairie, Duperow and Souris River(Devonian) Formations. The Interlake salts reacha maximum thickness of 7 ft (2 m) and are scatteredthrough southern Williams County. Five salts occurin the Ashern Formation to the east of the Nessonanticline in Mountrail County; each of the saltsreaches a maximum thickness of about 20 ft (6 m).In North Dakota, the Duperow and Souris Riversalts are restricted to northern Divide County,although they are extensive north of the internationalborder.
The most significant salt in the basin occurswithin the Prairie Formation. Trapping ofhydrocarbons and significant production related todissolution of the Prairie Salt has been documentedin several cases in Montana, Saskatchewan, andNorth Dakota. Dissolution was, in part, multistage.The limit of the Prairie Salt in central and westernNorth Dakota has long been considered to be thedepositional limit. Close examination of Devonianand Mississippian strata surrounding the Prairie edge
shows the limit is largely, if not entirely, the result ofdissolution, and that the edge of the salt graduallymigrated basinward from the Devonian until the earlystages of Charles salt deposition.
Distribution of the upper Charles salts (F-A)becomes more limited upsection, and reflects thewithdrawal or restriction of the Charles sea. Thissequence of 7 salts locally shows dissolution relatedto tectonic movement along structural elements,including the Nesson anticline and a probableextension of the Hummingbird trough fromSaskatchewan into Montana and North Dakota.
The uppermost salts, the Pine, “G” andDunham Salts, also reflect basement movement thatmay affect hydrocarbon trapping and production.Many of the salts appear to have been affected bya Late Jurassic-Early Cretaceous event. Somedissolution of the Pine Salt has also occurred locallyin Late Cenozoic time.
Salts have had a profound effect onhydrocarbon accumulation within the WillistonBasin. There are a number of successful fieldswhere hydrocarbons have been trapped due todissolution and related collapse of underlying salts.There are numerous examples where potential oilreservoirs have been destroyed by salt occlusion ofthe available porosity and permeability.
The best-known examples of hydrocarbontrapping and significant production related to saltdissolution involve the Prairie Salt. However,examination of other salts within the North Dakotapart of the basin suggests that such trapping can bedocumented for several other salts; in many cases,such dissolution appears to have occurred as amulti-stage process.
2
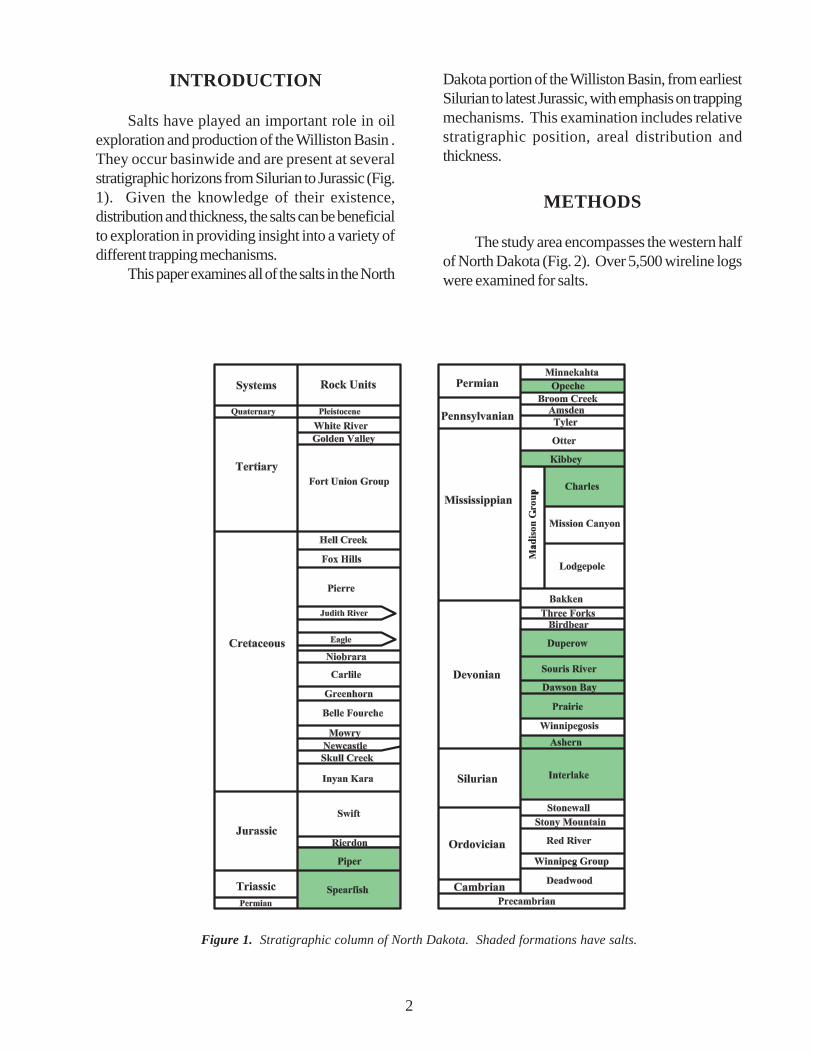
Figure 1. Stratigraphic column of North Dakota. Shaded formations have salts.
INTRODUCTION
Salts have played an important role in oilexploration and production of the Williston Basin .They occur basinwide and are present at severalstratigraphic horizons from Silurian to Jurassic (Fig.1). Given the knowledge of their existence,distribution and thickness, the salts can be beneficialto exploration in providing insight into a variety ofdifferent trapping mechanisms.
This paper examines all of the salts in the North
Dakota portion of the Williston Basin, from earliestSilurian to latest Jurassic, with emphasis on trappingmechanisms. This examination includes relativestratigraphic position, areal distribution andthickness.
METHODS
The study area encompasses the western halfof North Dakota (Fig. 2). Over 5,500 wireline logswere examined for salts.

3
Wherever possible, sonic or density logs wereused to identify salts. Data obtained were thenplotted and an isopach map was generated for eachsalt. Salts with limited distribution are plotted, butisopach maps were not prepared.
Several initial assumptions are made in thisstudy. Salts are assumed to have been depositedfairly uniformly over their areal extent unless therewas an underlying stratigraphic reason; for example,the thickness of the Prairie Salt is greatly affectedby Winnipegosis pinnacle reefs. Anomalousabsences or thins of individual salts are assumedto have resulted from complete or partial dissolutionof the salt.
MINOR SALTS
Silurian
Interlake FormationThese salts were first described in North
Dakota by Fischer and Anderson (1984) and arerecognizable on wireline logs above the prominent
gamma-ray marker of the middle Interlake (Fig.3a). They have limited distribution and occurrandomly through southern Williams County (Fig.3b). LoBue (1983) interpreted the gamma-raymarker to be an unconformity surface. Associatedwith this surface are several topographic highs thateventually developed into islands. Calcretes andferricretes were deposited on the islands; the saltsare interbedded with them. The maximum thicknessof the salts in this interval has been reported at 7 ft(2.1 m).
Devonian
Ashern FormationThe salts that occur in the Ashern Formation
are thin, discontinuous beds, similar to those in theInterlake Formation, and were first reported inNorth Dakota by Lobdell (1984). Fischer andAnderson (1984) informally subdivided the salts intotwo groups, N and M, in ascending stratigraphicorder, and further subdivided them into separatebeds, N1 through N3, and M1 and M2 (Fig. 4a).
Figure 2. Index map showing the location of the study area.

4
Fig
ure
3. A
.) T
ypic
al lo
g ch
arac
teri
stic
s of I
nter
lake
salts
. B.
) Is
opac
h of
the
com
bine
d In
terl
ake
salts
(C.I.
= 5
ft).
A.
B.

5
They are restricted to an area surrounding theNesson anticline in McKenzie, Mountrail, andWilliams Counties (Figs. 4b, c).
Lobdell (1984) placed the salts in the “uppergrey member” of the Ashern Formation. Themember is interpreted to have been deposited in anembayment with restricted circulation.
Maximum combined thicknesses reported forthe N salts are 14 ft (4.3 m) and for the M salts are33 ft (10.1 m).
Souris River FormationThe salt in the Souris River Formation,
originally named by Baillie (1953) and later revisedby Lane (1964), is referred to as the DavidsonEvaporite. It is extensive throughout southernSaskatchewan, where it reaches a thickness of over209 ft (63.9 m). The Souris River Formation isdivided into three members in Saskatchewan. TheDavidson Evaporite (salt) occurs at the top of theDavidson Member (Fig. 5a). In North Dakota, itoccurs only in the northwestern corner of the state(Fig. 5b) where it reaches a maximum thickness of10 ft (3.0 m).
Fischer and Anderson (1984) reported thatthe Davidson Evaporite (salt) appears clear toamber in cuttings, and is probably massive andcrystalline. The Davidson salt grades laterally intoan anhydrite. The change from salt to anhydritedistinguishes the basin from the shelf.
Duperow FormationThe Flat Lake Evaporite is the formal name
for the salt within the upper portion of the DuperowFormation. This name originated in Canada, havingbeen proposed by Dunn in 1975. Only two smalllobes of the Flat Lake salt extend into northernDivide County, and represent the southernmost limitof the salt. The salt has a maximum reportedthickness of 21 ft (6.4 m) in North Dakota (Figs.6a, b).
Mississippian
Charles FormationThe Charles Formation is predominantly
evaporitic in the North Dakota portion of theWilliston Basin, and consists of numerous repetitionsof salts, anhydrites, thin shales, and denselimestones. Six major and seven minor salt bedscomprise the evaporite section. The major saltswere designated A through F by Anderson andHansen (1957). Some of the minor salts have limitedoccurrence and are associated with major salt facies.These salts are indicated by the adjacent letterdesignation with a number subscript (e.g., F1). TheX salt reported by Anderson and Hansen (1957)has been split into two individual salt beds, referredto by the name of the producing horizon, Sherwoodor Bluell, in which they occur. Two other salts thatare similar to the Bluell and Sherwood but have amore limited occurrence are the Rival and Midalesalts (Fig 7).
The Sherwood, Bluell and Rival salts aredifferent from the major salts in that they occur onlyin a discontinuous band along the eastern side ofthe basin. The Rival salt has a more limiteddistribution and occurs basinward of the Bluell andSherwood. These salts were probably deposited ina sabkha or salt flat environment. They have amaximum thickness of 44 ft (13.4 m)
Kibbey FormationThin, localized beds of salt occur in the basal
portion of the Kibbey Formation in Billings andMcKenzie counties (Fig. 8). Sedimentation patternsestablished during Charles deposition continued intoKibbey time, and shallow water conditions wereresponsible for localized restriction leading to saltdeposition. The salt reaches a maximum thicknessof 21 ft.

6
Fig
ure
4.
A.)
Typi
cal l
og c
hara
cter
istic
s of A
sher
n sa
lts, N
and
M (m
odifi
ed fr
om F
isch
er a
nd A
nder
son,
198
4).
B.) I
sopa
ch m
ap o
f the
N sa
lts (C
.I. =
5ft.
). C
.) Is
opac
h m
ap o
f M sa
lts (C
.I. =
5 ft
.) .
A.
B. C.

7
Fig
ure
5. A
.) Ty
pica
l log
cha
ract
eris
tics o
f the
Dav
idso
n sa
lt, S
ouri
s Riv
er F
orm
atio
n. B
.) Is
opac
h m
ap o
f the
Dav
idso
n sa
lt (C
.I. =
5 ft
.).
A.
B.

8
Fig
ure
6. A
.) T
ypic
al lo
g ch
arac
teri
stic
s of t
he F
lat L
ake
salt,
Dup
erow
For
mat
ion.
B.)
Isop
ach
map
of t
he F
lat L
ake
salt
(C.I.
= 5
ft.).
B.
A.

9
Fig
ure
7. A
.) T
ypic
al lo
g ch
arac
teri
stic
s of t
he S
herw
ood,
Blu
ell,
and
Riva
l sal
ts o
f the
low
er C
harl
es F
orm
atio
n. B
.) Is
opac
h m
ap o
f the
Sher
woo
d sa
lt (C
.I. =
5 ft
.).
A.
B.

10
Fig
ure
7 (c
on’t)
. C
.) Is
opac
h m
ap o
f the
Blu
ell s
alt (
C.I.
= 5
ft.).
D.)
Isop
ach
map
of t
he R
ival
salt
(C.I.
= 5
ft.).
C.
D.

11
Fig
ure
7 (c
on’t)
. E.
) Typ
ical
log
char
acte
rist
ics o
f the
Mid
ale
salt.
F.)
Area
l dis
trib
utio
n of
the
Mid
ale
salt.
E.
F.

12
Fig
ure
8.
A.)
Typi
cal l
og c
hara
cter
istic
s of t
he sa
lt in
the
Kib
bey
Form
atio
n. B
.) Is
opac
h m
ap o
f the
Kib
bey
salt
(C.I.
= 5
ft).
A.
B.

13
MAJOR SALTS
Devonian
Prairie FormationThe thickest single salt present within the North
Dakota portion of the Williston Basin is within thePrairie Formation. This formation extends southfrom Canada into North Dakota and is present overapproximately half of the study area. The PrairieFormation has been subdivided into four members,the Ratner, Esterhazy, Belle Plaine, and Mountraileach of which is separated by halite beds (Andersonand Swinehart, 1979; Oglesby, 1988; Fig. 9a). Theentire sequence is capped by the “Second RedBed.” It attains a maximum thickness of 638 ft(194.5 m) in North Dakota (Figs. 9b, c).
The basal member, the Ratner, transitionallyoverlies the deep water argillaceous laminites of theWinnipegosis Formation in the central portion ofthe basin and abruptly overlies Winnipegosiscarbonates along the margin of the basin. It gradesupward from a laminated anhydrite into enterolithicand rosette-patterned anhydrite, and into a massiveanhydrite. The Ratner has been included in thePrairie because the initial saline conditions suggestedby these lithologies are more consistent with Prairiedeposition than with those of the underlyingWinnipegosis Formation (Holter, 1969; Oglesby,1988). The lower portion of the Prairie, betweenthe Ratner and Esterhazy members, consistspredominantly of milky halite. Also present are thin,laterally persistent interbeds of anhydrite thatprobably resulted from a brief influx of more normalmarine waters. This is capped by the potash bedsof the Esterhazy Member (Anderson and Swinehart,1979). The next two members, Belle Plaine andMountrail, represent repeated depositionalsequences of clear, inclusion-free halite and potash.These cycles of interbedded halite and potash areregionally correlative, asymmetric, with a mineralogyindicative of an overall increase in salinity. Thepotash represents the highest salinity and theshallowest brine depth and consists of halite, sylvite,and carnallite with other minor hypersaline minerals.Another partial cycle overlies the potash of theMountrail Member; however the potash is absent,
possibly due to dissolution or erosion.Red to green non-fossiliferous dolomites and
calcareous shales of the Second Red Bed cap theentire Prairie sequence. These lithologies mayrepresent an influx of clastics over the salt sequenceor may be a residual product of weathering andsolution (Holter, 1969; Williams, 1984; Oglesby,1988). The Second Red has been included in thePrairie or the overlying Dawson Bay Formation bydifferent workers. Regardless of placement, theSecond Red appears to have prevented thedissolution of the Prairie salt during the Dawson Baytransgression.
Beyond the limits of the salt, the PrairieFormation changes into an interbedded anhydriticdolostone, dolomitic shale, and siltstone withinclusions of halite (Sandberg and Hammond, 1958).
Mississippian
Charles FormationThe major and associated minor Charles salts,
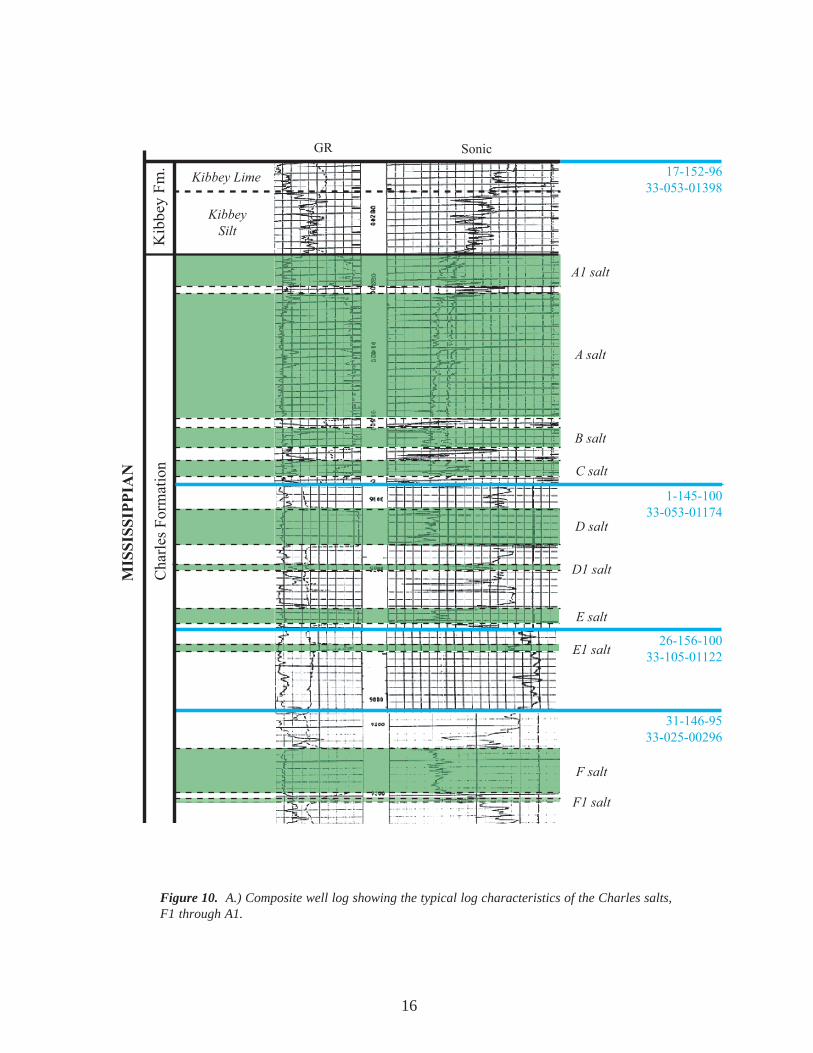
F through A, occur in the central portion of the basin(Figs.10). The F salt, also commonly referred toas the “Last Salt”, has the greatest areal extent, andhigher salts occur over less area than does the FSalt (Fig. 11).The F through C salts extend intosouthern Saskatchewan, and all of the major saltsand some of the minor ones extend into Montana.Unlike the lower Charles salts, the upper salts weredeposited in the central basin, probably as a resultof a combination of sea-level changes, some typeof restrictive shoals or uplift, and perhaps a changein subsidence rate (Andrichuk, 1955; Fish andKinard, 1958; Sandberg, 1973; Peterson, 1987).
Permian
Opeche FormationThe Opeche Formation consists of evaporites
and fine-grained detrital sediments. In the centralportion of the basin, these are predominantly haliteand red claystones. Towards the margin of the basinanhydrite, gypsum, and dolomite predominate(Maughan, 1966; Bluemle et al., 1986).
Two massive salts can be identified andmapped within the Opeche, and are referred to as

14
Figure 9. A.) Typical log characteristics of the Prairie Formation showing the salt and four members.Potash beds are shaded green.

15
Fig
ure
9 (c
on’t)
. B.
) Iso
pach
map
of t
he P
rair
ie sa
lt (C
.I. =
50
ft).
C.)
Isop
ach
map
of t
he S
econ
d Re
d Be
d (C
.I. =
10
ft).
C.
B.
16
Figure 10. A.) Composite well log showing the typical log characteristics of the Charles salts,F1 through A1.

17
A.
B.
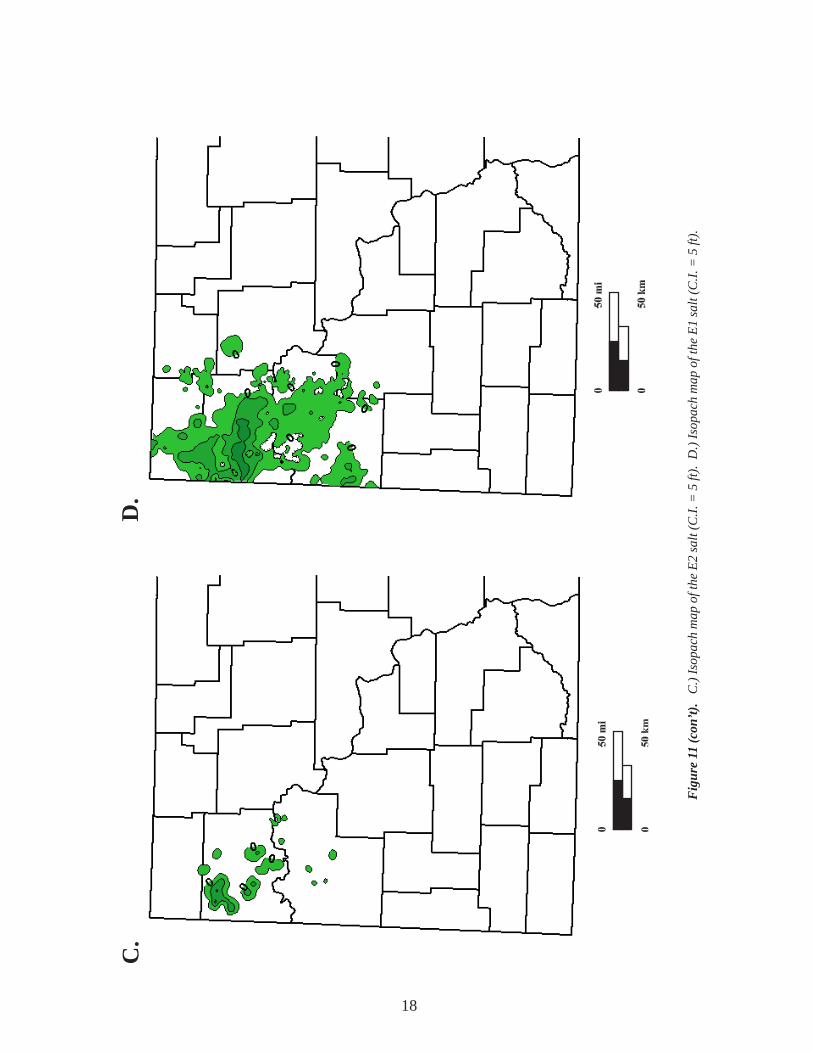
Fig
ure
11.
A.) I
sopa
ch m
ap o
f the
F1
salt
(C.I.
= 5
ft).
B.)
Isop
ach
map
of t
he F
salt(
C.I.
= 1
0 ft)
.
18
C.
D.
Fig
ure
11 (c
on’t)
. C
.) Is
opac
h m
ap o
f the
E2
salt
(C.I.
= 5
ft).
D.)
Isop
ach
map
of t
he E
1 sa
lt (C
.I. =
5 ft
).

19
Lim
it of
the
Prai
rie
Salt
E.
F.
Fig
ure
11 (c
on’t)
E.)
Isop
ach
map
of t
he E
salt
(C.I.
= 1
0 ft)
. F.
) Ar
eal d
istr
ibut
ion
of th
e D
1 sa
lt.

20
G.
H.
Fig
ure
11 (c
on’t)
G.
) Iso
pach
map
of t
he D
salt
(C.I.
= 1
0 ft)
. H
.) Is
opac
h m
ap o
f the
C sa
lt (C
.I. =
10
ft).
21
I.J.
Fig
ure
11 (c
on’t)
. I.)
Isop
ach
map
of t
he B
salt
(C.I.
= 1
0 ft)
. J.
) Iso
pach
map
of t
he A
salt
(C.I.
= 2
0 ft)
.

22
K.
Fig
ure
11 (c
on’t)
. K
.) Is
opac
h m
ap o
f the
A1
salt
(C.I.
= 2
0 ft)
.

23
c).Benison and Goldstein (2000) argued for a
nonmarine origin for the evaporites of the OpecheFormation throughout the Williston Basin, andattributed the salts to deposition in an inland playa-type saline-pan. The basin at the time of Opechedeposition was at the landward end of a longembayment of the Permian sea (Sandberg, 1973).It became more isolated with time, possibly as aresult of uplift along the Cedar Creek anticline. Thisuplift continued to restrict flow from the open seaand increase the salinity within the basin. Salts andclastics were laid down as the seas dried up andstreams brought muds in from surrounding areas.
Triassic (?)
Spearfish FormationThere are three members of the Spearfish
Formation, the lower Belfield, middle Pine Salt, andupper Saude (Dow, 1967; Fig. 13a). The lowertwo members are restricted to the central basin area,Montana, South Dakota, and Wyoming. Theuppermost member, the Saude, extends northwardinto Canada. In addition to the middle Pine SaltMember, the Spearfish has two other minor saltspresent within the Saude Member.
The Pine Salt is the thickest of the three saltsand has the greatest areal extent (Figs. 13b, c, d).The Pine reaches a maximum thickness of 249 ft(75.9 m). A persistent marker bed liesapproximately 20 ft (6 m) above the Pine salt inBowman, Slope, and portions of Golden Valley,Billings, Stark, and Hettinger Counties. It isgenerally an anhydrite and is referred to informallyas the G marker bed. Isolated lenses of the G saltoccur northeast of the main concentration. The Gsalt is thinner than the rest of the Spearfish salts,with a maximum thickness of 205 ft (62.5 m). Anunnamed salt overlies the G salt in a very limitedarea in Slope County, and reaches a maximumthickness of 130 ft (38.6 m; Fig. 13d).
The Spearfish was deposited in an arid to semi-arid climate, in a marginal marine-tidal flatenvironment. The salts represent a slight regressionor restriction in an overall transgressive system, notunlike the conditions present during Opechesedimentation.
Jurassic
Piper FormationThe Piper Formation consists of an
interbedded sequence of marine limestones andshales. Piper deposition started with a thin, 10 ft (3m) thick, bed of shale, informally referred to as thePoe marker. This shale horizon is overlain by theDunham salt. The Dunham extends over most ofwestern North Dakota with a few isolated lensesoutside of the main salt body (Fig. 14). It reaches amaximum thickness of 189 ft (57.6 m).
The Dunham salt consists predominantly ofhalite with some interbeds of reddish brownmudstone and anhydrite. The Dunham also followedpatterns similar to the Spearfish and was probablydeposited during a minor restrictive phase in atransgression.
SALT DISSOLUTION
RecognitionSeveral methods can be used to help identify
areas of possible salt dissolution in theWillistonBasin. Methods commonly used includegeophysical surveys, isopach and structure maps.Care must be taken in the correlations on wirelinelogs when the data are used for recognition of saltdissolution and subsidence structures. The followingdiscussion is based upon isopach and structure mapsfor the various salts within the study area.Geophysical data were not available.
Data from isopach and structure maps can besubstantiated further by the examination of availablecores. Cores can display characteristics commonto salt collapse, such as a collapse-fill faciesconsisting of a basal zone of fine, insoluble material(mostly clays) overlain by collapse breccia (Holter,1969). This information can then be carried intoareas where the only data source is wireline logs.
Opeche B and A (Anderson and Hansen, 1957;Fig. 12a). The upper salt, Opeche A, has a slightlygreater areal extent than the lower Opeche B salt.There is a significant difference in thickness; themaximum thickness of the Opeche B is 57 ft (17.4m) and the Opeche A is 229 ft (69.8 m)(Figs. 12b,

24
Figure 12. A.) Typical log characteristics of the two massive Opeche salts, B and A.
25
A.
B.
Fig
ure
12 (c
on’t)
B.)
Isop
ach
map
of t
he O
pech
e B
salt
(C.I.
= 1
0 ft)
. C
.) Is
opac
h m
ap o
f the
Ope
che
A sa
lt (C
.I. =
20
ft).
Dis
solu
tion
edge
is m
arke
d by
tren
d fr
om A
to A
’.

26
A.
B.
Fig
ure
13.
A.) T
ypic
al lo
g ch
arac
teri
stic
s of t
he sa
lts o
f the
Spe
arfis
h Fo
rmat
ion.
B.)
Isop
ach
of th
e Pi
ne S
alt M
embe
r (C
.I. =
25
ft).

27
C.
Fig
ure
13 (c
on’t)
. C
.) Is
opac
h of
the
G sa
lt (C
.I. =
20
ft).
D.)
Area
l dis
trib
utio
n of
the
unna
med
Spe
arfis
h sa
lt.
D.

28
A.
B.
Fig
ure
14.
A.) T
ypic
al lo
g ch
arac
teri
stic
s of t
he D
unha
m sa
lt of
the
Pipe
r For
mat
ion.
B.)
Isop
ach
map
of t
he D
unha
m sa
lt (C
.I. =
25
ft).

29
MechanismsSalt dissolution can occur as localized isolated
features, a series of dissolution lenses, a channel-like structure, or as a slow moving front (dissolutionaledge). The shape of the dissolution feature and theshape of the resulting collapse feature, consideredin a regional context, may provide insight about themechanism that caused dissolution. Holter (1969)reported a correlation between many of the areasexhibiting salt dissolution with the existence ofPrecambrian highs and reactivation of pre-existingstructures. The feature common to most of the areaswas the presence of fractures or faults. Fracturesor faults allow fluid to move up and down or in andout of the salt bed. Salt removal is also intermittent,generally with long periods of no evidence ofdissolution.
Several models have been suggested for saltdissolution (Fig. 15; Holter, 1969; Gendzwill, 1978;Oglesby, 1988): 1) depositional facies control -dissolving fluids move through permeable bedsadjacent to the salt horizon; 2) compaction anddewatering of surrounding sediments supplies thefluid necessary for salt dissolution; 3) surface waterrecharge at the outcrop and resulting basinwardflow, perhaps assisted by fractures, dissolves salts.
DissolutionSeveral areas of demonstrated or probable
salt dissolution have been identified in the NorthDakota Williston Basin (Fig. 16). All were identifiedthrough a combination of salt isopach and structuremaps, and the recognition of overlying compensatingsection.
Areas of known salt dissolution include theHummingbird trough, the South Heart syncline, theNewburg syncline and the Glenburn anticline. TheHummingbird trough is a 100 mi (160 km) longdepression that extends along a northwesterly trendin southern Saskatchewan (DeMille et al., 1964;Holter, 1969). Subsidence in the Canadian part ofthe trough began as early as Late Devonian and hasrecurred repeatedly into Tertiary time. The extensionof the Hummingbird trough into North Dakotaoccurred during deposition of the Midale carbonatesand again during the deposition of the E salts.
Dissolution along the South Heart syncline was
first recognized by Anderson (1966), who reporteddissolution of the Opeche salt around Dickinson field(T139-140N, R96-97W) and locally in T138N,R100-101W. The syncline was first described asan extensive solution feature by LeFever andCrashell (1991). Subsidence along the syncline wasapparently Late Cenozoic, as the Oligocene surfacestrata are affected by the collapse.
The Newburg syncline and the Glenburnanticline were described by LeFever and Anderson(1986) and LeFever and LeFever (1991). Thesestructures overlie what was previously thought tobe the boundary between two Precambrianprovinces. Recent data has enhanced theinterpretation and subdivided the Churchill provinceinto smaller fault-bounded terranes (Trans-Hudsonorogenic belt; Green et al., 1985; Klasner and King,1986). Periodic movement has resulted in thedissolution of the Prairie salt and subsequent collapseof the overlying sediments. Limited deep controlsuggests that dissolution may have begun during thedeposition of the Dawson Bay Formation(Devonian). The dissolution front is documented inthis area by anomalous thicknesses in the overlyingstrata of Devonian and Mississippian age (Andersonand Hunt, 1964).
There are numerous structural features withinthe North Dakota part of the basin which mightinfluence dissolution of salts (Fig. 17). In somecases, as with the Dunham salt, they have apparentlydone so (Fig. 18). The Nesson anticline and theBillings anticline have been shown to consist ofindividual structural elements or blocks, which havemoved independently of the basin subsidence(LeFever et al., 1987; LeFever and Crashell, 1991).All of the structural blocks are presumably boundedby faults, although few faults have been describedin the literature. The boundaries of the blocks arethus locations where fluid movement might producesalt dissolution.
Three extensive fault systems have beendescribed within North Dakota (Fig. 19): 1) theNesson anticline boundary fault (Gerhard et al.,1982); 2) the Antelope fault (Folsom et al., 1959;Murray, 1968); and 3) the Heart River fault system(Chimney et al., 1992). All three are possiblepathways for fluid migration, although little saltsolution is evident along their extents.

30
Figure 15. Proposed models for salt dissolution. 1) Model showing dissolving fluid moving through permeable beds.This diagram is a model proposed by for Winnipegosis mounds in Montana (after Gendzwill, 1978). Model showssuggested water circulation through the mound, slumping as result of salt removal directly above the mound, accumulationof insoluble materials on top of the mound, local intense solution-collapse “X,” thickening of “salt back” over potashbeds , and thinning of the Dawson Bay Formation. 2) Compaction and dewatering of surrounding sediments supplyingdissolving fluids. The diagram shows a hypothetical model for groundwater flow related to the Leduc reefs and surroundingIreton shales (after Hugo, 1985). 3) Model of surface water recharge at the outcrop resulting in basinward flow, assistedby fractures to deliver dissolving fluids to salt horizon. Faults or linear features that are possibly rooted in basement rocksact as a conduit for fluid movement to the salts (after Shurr, 1982). 4) Model for salt dissolution and development of acompensating section along the depositional limit of the Prairie salt (Gorrell and Alderman, 1968).
1
2
3
4
31
Figure 16. Areas of known salt dissolution and related features.
Hummingbird Trough
Nesson Anticline
Antelope Anticline
Newburg Syncline
Glenburn Anticline
South Heart Syncline

32
Many of the salts show no evidence ofdissolution. However, knowledge of their existencebecomes important when drilling and exploringinanew region. The following discussion concernssalts that may have relevance to trapping andreservoir development.
Prairie FormationNumerous studies have described various
aspects of the Prairie salt on both a regional andlocal scale, from its relationship to the underlyingWinnipegosis Formation to the dissolution of thesalt and resulting tectonics and reservoirdevelopment (i.e. Anderson and Hunt, 1964;DeMille et al., 1964; Holter, 1969; Gendzwill,1978; McTavish and Vigrass, 1987; Oglesby,1988). The Prairie salt has had and continues tohave a profound influence on the overlyingsediments.
The isopach pattern of the Prairie salt reflectsthe Devonian connection with the Elk Point Basin(Fig. 9b, c). There is a gradual increase in thicknessto the north away from the zero edge. This increaseis reversed in Burke County, where the Prairie wasdeposited around the pre-existing topography ofthe Devonian Winnipegosis pinnacle reefs. TheNesson anticline was also a positive feature, andthe Prairie salt thins over the structure. Contourschange abruptly along the eastern margin of the basinin Bottineau County. The abrupt change in contoursand the presence of a small outlier of Devonian saltreflect dissolution along this edge. Although theremaining edge of the Prairie appears gradational,there is evidence that suggests that the entire limit ofthe Prairie salt results from dissolution.
Deposition of the Prairie salt is thought to haveoccurred in a “deep basin” setting (Gendzwill, 1978;Oglesby, 1988). Since evaporites accumulaterapidly, a basin with a suitable topography or waterdepth would be necessary in order to accommodatethe Prairie salt. Salts of the Prairie would fill in,around and eventually over the pre-existingWinnipegosis topography (pinnacle reefs). Thisappears to have been the case in Burke County.However, the total thickness of the salt plus thepinnacle reef is slightly less than the thickness of thesalt away from the pinnacle, which suggests loss ofsalt (dissolution) over the pinnacle. Additional
evidence for this dissolution event includes localizedcollapse structures with folds and fractures. It wassuggested by Gendzwill (1978) that only partialdissolution occurred over these reefs. Fresher wateris thought to have moved horizontally into the porouscarbonate zone where it dissolved the surroundingsalt. The brines thus generated sank, were replacedby fresher water, and dissolution continued alongthe salt-carbonate interface. Eventually insolublematerial plugged the porosity in the upper portionof the reef and prevented further dissolution.Diagenetic changes within the potential reservoirrock, in addition to the impermeable cap rock, couldprovide a suitable trap for hydrocarbons in theunderlying Winnipegosis rocks. Diagenetic changeswould have to be limited, since halite plugging,incomplete anhydrite or residue seals, and over-dolomitization may affect or destroy potentialreservoirs (Ehrets and Kissling, 1987).
The present limit of the Prairie salt in north-central North Dakota apparently results fromdissolution, not deposition. There are several linesof evidence that suggest this has occurred: 1) Theisopach map of the Prairie in this area shows anabrupt change in the contours, rapidly increasing inthickness towards the center of the basin. 2) Thereis a small outlier of salt present in the AmeradaPetroleum Corp. #1 Lila Stark (SESE Sec. 20,T162N, R78W) well. The salt is 68 ft (20.7 m)thick in the #1 Stark and is beyond the current limitof the Prairie salt. 3) There is an east to westprogression of isopach thicks for the Devonianformations overlying the Prairie. Each successivelyhigher unit has a band of isopach thicks that stepbasinward. Available well control demonstrates thatin Mississippian time compensating section wasdeposited through the Bakken, Lodgepole, Tilston,and Frobisher-Alida beds (Anderson and Hunt,1964; Parker, 1967; LeFever et al., 1991). Thiszone of compensating section also steppedbasinward through time. 4) One well, CaliforniaCompany - #1 Blanche Thompson (SWSE Sec.31, T161N, R81W), that cored the Prairie in thisarea has collapse breccia over the interval. Majorstructures resulting from the dissolution of the Prairiein this area are the Newburg syncline and theGlenburn anticline (LeFever and Anderson, 1986;LeFever and LeFever, 1991).
33
Figure 17. Known structural blocks in western North Dakota.

34
Figure 18. Isopach map of the the Dunham salt (Jurassic) in Blue Buttes Field, Nesson anticline(C.I. = 20 ft). Timing of dissolution of the salt along the northeast-trending fault is Late
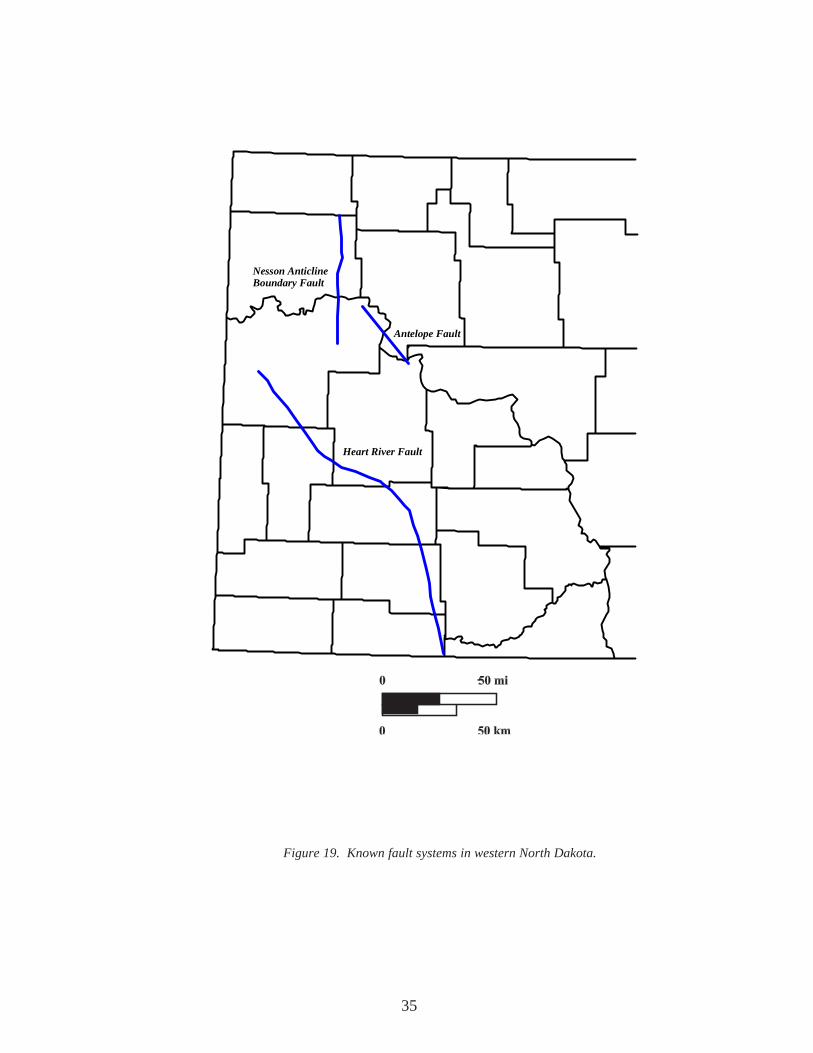
35
Nesson AnticlineBoundary Fault
Antelope Fault
Heart River Fault
Figure 19. Known fault systems in western North Dakota.

36
The limit of the Prairie salt in north-centralNorth Dakota appears to be a dissolution edgethat moved basinward through time. Dissolution isprobably related to periodic movement of faultsrooted in the Precambrian basement. This areaoverlies the junction between the Trans-HudsonOrogen and the Superior Craton. Fracturing alongthe juxtaposition of the two terranes would allowfluid to migrate into the salt. Initiation of dissolutionwas during the deposition of the Dawson BayFormation.
The southern limit of the Prairie Formation hasbeen considered to be depositional rather than adissolution edge. Examination of the isopach mapsand additional core data indicates that this limit mayalso result from dissolution of the Prairie salt.Immediately overlying the Prairie Formation is a thinbed referred to as the Second Red. This unitconsists of red to green non-fossiliferous dolomitesand calcareous shales that maintain a constantthickness of about 15 ft (4.6 m) over the study area.Where the Second Red is anomalously thick, itconsists of the original lithology plus a collapse-fillfacies of insoluble residual fines and breccia. Alldissolution wells in the basin show thickenedSecond Red (Oglesby, 1988). The isopach mapof the Second Red exhibits a series of isolated thicksalong the southern margin of the Prairie salt (Fig.9c). When this map is overlain on the Prairie saltisopach, this zone overlies the zero to 50 ft (15.2m) salt interval. This strongly suggests that in thisarea partial dissolution has occurred, resulting in athin remnant of salt that is overlain by a collapse-fillfacies and the Second Red. Extensions of thickenedSecond Red occur farther south in Billings andGolden Valley Counties and southern Dunn andStark Counties.
The occurrence of dissolution in an areapreviously thought to be depositional leads to achange in ideas on the way to explore forhydrocarbons in the area. Compensatory section,fractures, and lithofacies changes all need to betaken into account when examining an area for apotential prospect. Moreover, dissolution may haveoccurred several times in any given area.
Charles FormationThe Sherwood and Bluell salts occur in a
discontinuous band along the eastern margin of thebasin, from Bottineau County into portions of Siouxand Dunn Counties (Fig.7). Distribution of the saltsin the Bluell and Sherwood beds essentially mirroreach other. Differences are minor; the Bluell extendsfarther south and the Sherwood extends slightlyfarther west. Both salts occur slightly east of thedissolution edge of the Prairie salt. They representsabkha or salt pan deposits, are probably directlyrelated to the dissolution of the Prairie salt and, likethe Devonian and Mississippian isopachous thicksand compensatory sections, are another line ofevidence of the basinward migration of the Prairiesalt edge. The thin, localized occurrence of the F1
salt immediately south of the Prairie limit in Dunn,Billings and McKenzie Counties is also probably afunction of Prairie salt dissolution (Fig. 11a).
The F salt (“Last Charles Salt”) was depositedover most of western North Dakota (Fig. 11b).Minor thickness differences occur in the centralportion of the salt area. The convoluted zerocontour is probably the result of an irregular shorelineat the time of deposition. Isopach patterns do notreflect any of the present structures in the basin,which indicates that they were not positive elementsat the time of deposition. The F salt appears not tobe significantly affected by dissolution.
Three separate salt beds can be recognizedabove the F salt. They occur immediately abovethe Ratcliffe marker (Greenpoint anhydrite) and arerelatively thin, reaching a maximum thickness of 82ft (25 m). Although the marine connection with thebasin was westward through the central Montanatrough, the isopachs show a marked northwesterlytrend. This trend is apparent on the isopach of themain E salt bed to some degree, but is morepronounced on the E1 and E2 isopachs (Fig. 11c, d,e). These salts show the extension of theHummingbird trough of Saskatchewan into NorthDakota.
The D salt is more widely distributed thanthe E salt, and the D is thicker, reaching a maximumof 96 ft (29.3 m; Fig. 11g). The four uppermostCharles salts are less widely distributed than the Dsalt (Figs. 11h through k), and the final Charles

37
salt, A1, is restricted to two counties, McKenzieand Williams. All of the salts A through D haveprobably been affected by dissolution along theirsoutheastern limits, where the edges of the salts abutthe South Heart syncline, a known dissolutionfeature.
Opeche FormationIsopach maps were generated for the two
massive Opeche salts (Fig. 12).The Opeche salts gradually thicken towards
the south. The irregular pattern of the isopachsmay be a function of impure salt sections or mayresult from partial dissolution of the salt. Dissolutionof both salts has occurred along the southeasternlimits, along the South Heart syncline. This isreflected by the linear pattern of the Opeche saltlimit that trends northeast across Stark and Dunncounties (A to A’, Fig. 12c). Along this edge thecontours also change abruptly.
Spearfish FormationThree Spearfish salts are shown on Figure 13.
The lowermost (Pine Salt) has the greatest arealdistribution and is thickest in the southwestern cornerof the state, in the direction of the marine connectionto the Phosphoria sea (Maughan, 1966). Changesin the Pine Salt are more gradational in the northernportion of the isopach. Irregularities in the southernhalf of the map are related to later dissolution.Isolated isopach thins, areas devoid of salt, and thecurrent eastern limit of the Pine were previouslyreported by Anderson (1966). Based oncompensatory section, timing of the dissolutionappears to be Late Jurassic.
Deposition of the G salt was much more limitedthan that of the Pine (Fig. 13c). Isolated occurrencesof the salt occur to the northeast of the main depositand are probably a function of the depositionalenvironment.
Piper FormationThe irregular thickness distribution of the
Dunham is largely due to dissolution (Fig. 14).Notable dissolution has occurred along the Nessonanticline. The dissolution edge crosses the anticlinethrough Clear Creek, Hawkeye, Blue Buttes, andAntelope fields. Faulting in the area of Blue Buttes
Field is readily apparent as the salt is removedabruptly between wells in a 40 acre spacing unit(Fig. 18). Timing of this movement was LateJurassic, prior to deposition of the Cretaceous InyanKara Formation. Additional compensating sectionhas been documented along a lens of Dunham saltimmediately west of the anticline and along thenorthern portion of the anticline. Timing of thedissolution in this area was Late Jurassic-EarlyCretaceous. The presence of the Dunham salt inisolated lenses with compensatory section suggeststhat the current limit of the Dunham is a dissolutionedge.
HYDROCARBON TRAPS
Salts provide a variety of different types ofhydrocarbon traps that can form or enhance areservoir. The easiest type of trap to identify isrelated to porosity and permeability pinchouts. Thisis apparent where salt drapes over or around adepositional or structural feature. Examples in theNorth Dakota portion of the Williston Basin are theWinnipegosis pinnacle reefs (Gendzwill, 1978;Oglesby, 1988). Draping and dissolution of thePrairie salt over the reefs has resulted in theformation of hydrocarbon traps. Salt pluggingrelated to salt dissolution and/or reprecipitation inavailable porosity and permeability may also forman effective trapping mechanism, as in the DolphinField Duperow pool of Divide County. Mappingthe available well control in Dolphin Field indicatesno apparent structural closure in the field. However,the structure has been enhanced by dissolution ofthe Prairie salt. Dissolution has also resulted in areduction of porosity in the field due to salt plugging(Heck, 1988).
Structural features related to multiple stage saltcollapse are common in the Williston Basin. Fieldswith hydrocarbon accumulations that are related tosalt collapse include Hummingbird field and theElbow structure of Saskatchewan, Outlook, TuleCreek, Volt, Benrud fields of Montana, and Dolphinfield of North Dakota. Reservoirs may be enhancedby an increase in fracture porosity and by localizeddiagenetic changes. Early migration of oil into thesereservoirs is not necessary.

38
Several areas within the North Dakota portionof the Williston Basin warrant additionalexamination. One of these areas follows the limit ofthe Prairie salt. Isopachous maps and compensatorysection of successively higher formations indicatethat the limit of the Prairie salt has moved basinwardthrough time. The ability to accurately predict thismovement increases the potential of encounteringstructural traps. Additionally, the ability to map thisedge may also explain the local changes indepositional environments. Another area of interestconcerning the Prairie salt occurs in thenorthwestern corner of the state. The extension ofthe Hummingbird trough into North Dakota providesan additional exploration target. Two-stage saltdissolution has been currently documented to haveoccurred in the area and further mapping may revealpotential traps.
Since the majority of salt dissolution is relatedto faulting, dissolution of salts not associated withhydrocarbon production can provide evidence forsubtle structural features. Dissolution featuresrelated to the Opeche, Pine and Dunham salts areindirect evidence of faulting. One of the bestexamples of this concerns the Dunham salt in thesouthern portion of Blue Buttes Field. The absenceor presence of these salts may indicate local areasof re-occuring activity, as in the Medora-Fryburg-Dickinson areas.
SUMMARY
Numerous salts exist throughout the subsurfaceof the North Dakota Williston Basin. Although notall of the salts have tectonic significance, many ofthe salts can be directly or indirectly related to basinstructure. Detailed correlation and mapping of thesesalts can identify areas of possible salt collapsestructures that may entrap hydrocarbons.
REFERENCES CITED
Anderson, S. B., 1966, A look at the petroleumpotential of southwestern North Dakota: NorthDakota Geological Survey Report ofInvestigation 42, 3 sheets.
Anderson, S. B., and Hansen, D. E., 1957, Halitedeposits in North Dakota: North DakotaGeological Survey Report of Investigation 28,2 sheets.
Anderson, S. B., and Hunt, J. B. , 1964, DevonianSalt Solution in North Central North Dakota,in W. Leskela, J. Brindle, and S.H. Harris, eds.,Third International Williston Basin Symposium,Billings Geological Society, North DakotaGeological Society, and SaskatchewanGeological Society, p. 93-104.
Anderson, S. B., and Swinehart, R. P., 1979, Potashsalts in the Williston Basin, U.S.A.: EconomicGeology, v. 74, p. 358-376.
Andrichuk, J. M., 1955, Mississippian MadisonGroup stratigraphy and sedimentation inWyoming and southern Montana: AmericanAssociation of Petroleum Geologists Bulletin,v. 39, p. 2170-2210.
Baillie, A. D., 1953, Devonian names andcorrelations in the Williston Basin area:American Association of Petroleum GeologistsBulletin, v. 37, p. 444-447.
Benison, K.C., and Goldstein, R.H., 2000,Sedimentology of ancient saline pans: Anexample from the Permian Opeche Shale,Williston Basin, North Dakota, U.S.A.: Journalof Sedimentary Research, v. 70, p. 159-169.
Bluemle, J. P., Anderson, S. B., Andrew, J. A.,Fischer, D. W., and LeFever, J. A. , 1986, NorthDakota stratigraphic column: North DakotaGeological Survey Miscellaneous Series 66, 3sheets.

39
Chimney, P. J., Treska, C. E., and Wolosin,C. A.,1992, Richardton/Taylor Fields, U.S.A.,Willliston Basin, North Dakota: in N. H. Fosterand E. A. Beaumont, eds., Stratigraphic trapIII, Atlas of Oil and Gas Fields: AmericanAssociation of Petroleum Geologists Treatiseof Petroleum Geology, p. 421-445
DeMille, G., Shouldice, J. R., and Nelson, H. W.,1964, Collapse structures related to evaporitesof the Prairie Formation, Saskatchewan:Geological Society of America, v. 75, p. 307-316.
Dow, W. G., 1967, The Spearfish Formation in theWilliston Basin of western North Dakota: NorthDakota Geological Survey Bulletin 52, 28p.
Dunn, C. E., 1975, The Upper Devonian DuperowFormation in southeastern Saskatchewan:Saskatchewan Department of MineralResources Report 179, 151p.
Ehrets, J. R., and Kissling, D. L., 1987,Winnipegosis platform margin and pinnacle reefreservoirs, northwestern North Dakota, in D.W. Fischer, ed., Fifth International WillistonBasin Core Workshop Volume: North DakotaGeological Survey Miscellaneous Series 69, p.iv-32.
Fischer, D. W., and Anderson, S. B., 1984, Little-known Mid-Paleozoic salts of northwesternNorth Dakota: North Dakota GeologicalSurvey Report of Investigation 83, 18p.
Fish, A. R. and Kinard, J. C., 1958, Madison Groupstratigraphy and nomenclature in the northernWilliston Basin: Billings Geological Society 10thAnnual Field Conference, p. 50-58.
Folsom, C. B., Carlson, C. G., and Anderson, S.B., 1959, Preliminary report on the Antelope-Madison and Antelope-Sanish pools: NorthDakota Geological Survey Report ofInvestigation 32, 38p.
Gendzwill, D. J., 1978, Winnipegosis mounds andPrairie Evaporite Formation of Saskatchewan- seismic study, in D. Estelle and R. Miller, eds.,Montana Geological Society 24th AnnualConference, 1978 Williston Basin Symposium- The economic geology of the Williston Basin:Montana Geological Society, p. 121-130.
Gerhard, L. C., Anderson, S. B., LeFever, J. A.,and Carlson, C. G., 1982, Geologicaldevelopment, origin, and energy mineralresources of the Williston Basin, North Dakota:American Association of Petroleum GeologistsBulletin, v. 66, p.989-1020.
Gorrell, H. A., and Alderman, G. R., 1968, Elk PointGroup saline basins of Alberta, Saskatchewan,and Manitoba, Canada in Mattox, R. B., ed.,Saline Deposits, Geological Society of AmericaSpecial Paper 88, p. 291-317.
Green, A. G., Weber, W., and Hajnal, Z., 1985,Evolution of Proterozoic terranes beneath theWilliston basin: Geology, v. 13, n. 624-628.
Heck, T.J., 1988, An Oveview of Dolphin Field,Divide County, North Dakota: North DakotaGeological Survey Miscellaneous Series No.70, 14p.
Holter, M. E., 1969, The Middle Devonian PrairieEvaporite of Saskatchewan: SaskatchewanDepartment of Mineral Resources Report 123,134p.
Hugo, K., 1985, Hydrodynamic flow associatedwith Leduc reefs, Master’s Thesis, Universityof Alberta, Edmonton, Alberta 149p.
Klasner, J. S., and King, E. R., 1986, Precambrianbasement geology of North and South Dakota:Canadian Journal of Earth Sciences, v. 23, p.1083-1102.
Lane, D. M., 1964, Souris River Formation insouthern Saskatchewan: SaskatchewanDepartment of Mineral Resources Report 92,72p.

40
LeFever, J. A., and Anderson, S. B., 1986,Structure and Stratigraphy of the Frobisher-Alida and Ratcliffe intervals, MississippianMadison Group, north-central North Dakota:North Dakota Geological Survey Report ofInvestigation 84, 17p.
LeFever, J. A., LeFever, R. D., and Anderson, S.B., 1987, Structural Evolution of the Centraland Southern Portions of the Nesson Anticline,Williston Basin, North Dakota: in Carlson, C.G.,and Christopher, J.E., eds., Proceedings of theFifth International Williston Basin Symposium,Saskatchewan Geological Society SpecialPublication 9, p. 147-156.
LeFever, J. A., Martiniuk, C. D., Dancsok, E. F.R., and Mahnic, P. A., 1991, Petroleum potentialof the middle member, Bakken Formation,Williston Basin, in J. E. Christopher and F.Haidl, eds., Sixth International Williston BasinSymposium: Saskatchewan Geological SocietySpecial Publication 11, p. 74-95.
LeFever, R. D., and Crashell, J. J., 1991, Structuraldevelopment of the Williston Basin insouthwestern North Dakota: in Christopher,J.E., and Haidl, F., eds., Proceedings of theSixth International Williston Basin Symposium,Saskatchewan Geological Society SpecialPublication 11, p. 222-233.
LeFever, R. D., and LeFever, J. A., 1991, Newburgand South Westhope fields, in N. H. Fosterand E. A. Beaumont, eds., Stratigraphic trapII, Atlas of Oil and Gas Fields: AAPG Treatiseof Petroleum Geology, p. 161-188.
Lobdell, F. K., 1984, The Ashern Formation(Middle Devonian) in the Williston Basin, NorthDakota: Master’s Thesis, University of NorthDakota, Grand Forks, North Dakota, 187p.
LoBue, C. L., 1983, Depositional environments anddiagenesis, Interlake Formation (Silurian),Williston Basin: Master’s Thesis, University ofNorth Dakota, Grand Forks, North Dakota,233p.
Maughan, E. K., 1966, Environment of depositionof Permian salt in the Williston and Alliancebasins, in J. L. Rau, ed., Second Symposiumon Salt: Northern Ohio Geological Society, p.37-47.
McTavish, G. J., and Vigrass, L. W., 1987, Saltdissolution and tectonics, south-centralSaskatchewan, in C. G. Carlson and J.E.Christopher, eds., Fifth International WillistonBasin Symposium: Saskatchewan GeologicalSociety Special Publication 9, p. 157-168.
Murray, G. H., 1968, Quantitative fracture study -Sanish Pool, McKenzie County, North Dakota:American Association of Petroleum GeologistsBulletin, v. 52, p. 57-65.
Oglesby, C. A., 1988, Deposition and dissolutionof the Middle Devonian Prairie Formation,Williston Basin, North Dakota and Montana:Master’s Thesis, Colorado School of Mines,Golden, Colorado, 79p.
Parker, J. M., 1967, Salt solution and subsidencestructures, Wyoming, North Dakota, andMontana: American Association of PetroleumGeologists, v. 51, p. 1929-1947.
Peterson, J. A., 1987, Subsurface stratigraphy anddepositional history of the Madison Group(Mississippian), U. S. portion of the WillistonBasin and adjacent areas, in M. W. Longman,ed., Williston Basin: Anatomy of a CratonicOil Province: Rocky Mountain Association ofGeologists, p. 171-193.
Sandberg, C. A., 1973, Salt and Potash, in Mineraland Water Resources of North Dakota: NorthDakota Geological Survey Bulletin 63, p.151.
Sandberg, C. A., and C. R. Hammond, 1958,Devonian System in the Williston Basin:American Association of Petroleum GeologistsBulletin, v. 42, p. 2293-2335.
41
Shurr, G. W., 1982, Geological significance oflineaments interpreted from Landsat imagesnear the norther Black Hills; in Christopher, J.E., and Kaldi, J., eds., Fourth InternationalWilliston Basin Symposium: North DakotaGeological Society, Saskatchewan GeologicalSociety, p. 313-320.
Williams, G. K., 1984, Some musings on theDevonian Elk Point Basin, western Canada:Bulletin of Canadian Petroleum Geology, v. 32,p. 216-232.