saltwater intrusion in the quaternary aquifer of the …keywords: coastal aquifer, geochemical...
TRANSCRIPT

1. Introduction
1.1 Background
In the last two decades, the use of groundwater in Dar es Salaam City has increased considerably because of the scarcity of surface water sources. With only 25 percent of the population receiving water supplied by Dar es Salaam Water and Sewerage Authority (DAWASA), much of the water needs must be met through private boreholes (UN HABITAT, 2009). Since 1997, the Tanzanian Government, Non Government Organizations (NGOs), Community Based Organizations (CBOs) and international aid organizations have promoted the drilling of boreholes to try to meet the demand of water supply in the city. Despite the significant importance of groundwater in Dar es Salaam City, threats exist, including overabstraction that can lead to the intrusion of salt water in fresh water aquifers. A study by Nkotagu (1989) reported marine intrusion in the coastal aquifer of the Kigamboni Peninsula with elevated chloride, sulphate and sodium concentrations. A study made by the Ministry of Water (URT, 2007) to develop future water sources for Dar es Salaam City, reported an increase of salinity in several boreholes in the coastal area of the city. The increase of salinity at some points of the coastal area in Dar es Salaam Region has been surveyed over the last 20 years. According to the previous work, the cause of salinization was thought to be influenced by various sources of salinity. These include: seawater intrusion, airborne salts, water ascending from deep marine sediments, and clay-bound sands contributing salinity themselves (Mnzava, 1986; Msindai, 1988; Mjemah, 2007). Groundwater resources in coastal areas are always in danger of contamination by sea water intrusion. The likelihood of this taking place is increased when rates of extraction of groundwater close to the sea are raised due to increased demand on fresh water resources. This paper presents preliminary results of an ongoing PhD research on “Regional Hydrogeochemical Characterization of Processes in Quaternary Sand Aquifers of the Dar es Salaam Region”. It examines if saltwater intrusion is a pressing problem along the Dar es Salaam coastal area.
1.2 Population
The last national census was in 2002, so all current figures are estimates. The city’s present population is estimated to be over 3.5 million people (Fig. 1) with a growth rate of 4.3%. The high population has proven to be a serious challenge in the provision of housing and essential services such as water, sanitation and health care (URT, 2004). Population in the municipality varies from settlement to
settlement. High population densities are found in unplanned settlements, while low population densities are found in peripheral localities.
1.3 Water supply and management problems
The increased demand of water in Dar es Salaam City and uncontrolled groundwater abstraction poses a danger of seawater intrusion due to overpumping. From 1997 until the present, boreholes drilling has increased tremendously and the trend can still be expected to increase in the future. It is estimated that about 1000 boreholes are drilled annually (Baumann et al., 2005). Individuals, the Community, industries, institutions and tourist hotels have sunk a number of boreholes from which large quantities of water are withdrawn using electrical and/or diesel pumps. All these put a strain on the fresh groundwater resources and increase the possibility of sea water intrusion.
1.4 Objectives of the study
The objectives for this study were: (1) To preliminarily assess the current state of water quality in selected areas near the coastline, especially in view of assessing sea water intrusion; (2) To attempt, with data available and based on the groundwater samples of a first field campaign, to give an early warning of the threat of sea water intrusion along the Dar es Salaam coast; and (3) To review available information in relation to this study and design a strategy for further field surveys.
GEOLOGICA BELGICA (2012) 15/1-2: 16-25
Saltwater intrusion in the Quaternary aquifer of the Dar es Salaam region, TanzaniaYohana MTONI1, 2,*, Ibrahimu C. MJEMAH3, Kristoko MSINDAI4, Marc VAN CAMP1 & Kristine WALRAEVENS1
1Laboratory for Applied Geology and Hydrogeology, Ghent University, Krijgslaan 281 S8, 9000, Ghent, Belgium. 2National Environment Management Council (NEMC), P.O. Box 63154, Dar es Salaam, Tanzania3Sokoine University of Agriculture (SUA), P.O. Box 3038, Morogoro, Tanzania4Geology Department, University of Dar es Salaam, P.O. Box 35052, Dar es Salaam, Tanzania* Email for corresponding author: [email protected]
ABSTRACT. A description of the occurrence of the salt water intrusion from seawater close to the coastline of Dar es Salaam Region is presented. The present status of intrusion in two pilot areas located between Mlalakuwa and Msimbazi Rivers (locality I) and Msimbazi and Kizinga Rivers (locality II) is evaluated. The causes, effects, remedial measures and future possibility of intrusion are discussed. An investigation on the hydrodynamics of the phenomenon and analysis of the formations as well as the interfacial transition zone is currently being performed. Water samples from Mikocheni, Oysterbay, Msasani, Masaki and City Centre areas show elevated chloride, sulphate and sodium concentrations. Using Stuyfzand (1986) water classification method, about 60 percent of the samples are classified as fresh-brackish to salt and 30 percent as extremely hard. Groundwater was classified into several categories by subtype, i.e., Sodium-Chloride, Sodium-Bicarbonate, Calcium-Bicarbonate, Magnesium-Bicarbonate, Sodium-Mix and Calcium-Mix. The growing human population in and around the investigated areas has had an adverse impact on the water in the shallow aquifer through, among other factors, indiscriminate abstraction of water without knowledge of the aquifer’s capacity.
KEYWORDS: coastal aquifer, geochemical processes, salinization, Dar es Salaam, Tanzania, overexploitation
0
0.5
1
1.5
2
2.5
3
3.5
1867 1957 1967 1978 1988 2002 2008
Popu
lati
on (M
illio
ns)
Year
Figure 1. Population trend in Dar es Salaam City. Source of figures: i) URT (2002) Population and Housing Census Report, and ii) DCC (Dar es Salaam City Council) records.
Saltwater intruSion in the Quaternary aQuifer of the Dar eS Salaam region, tanzania 17
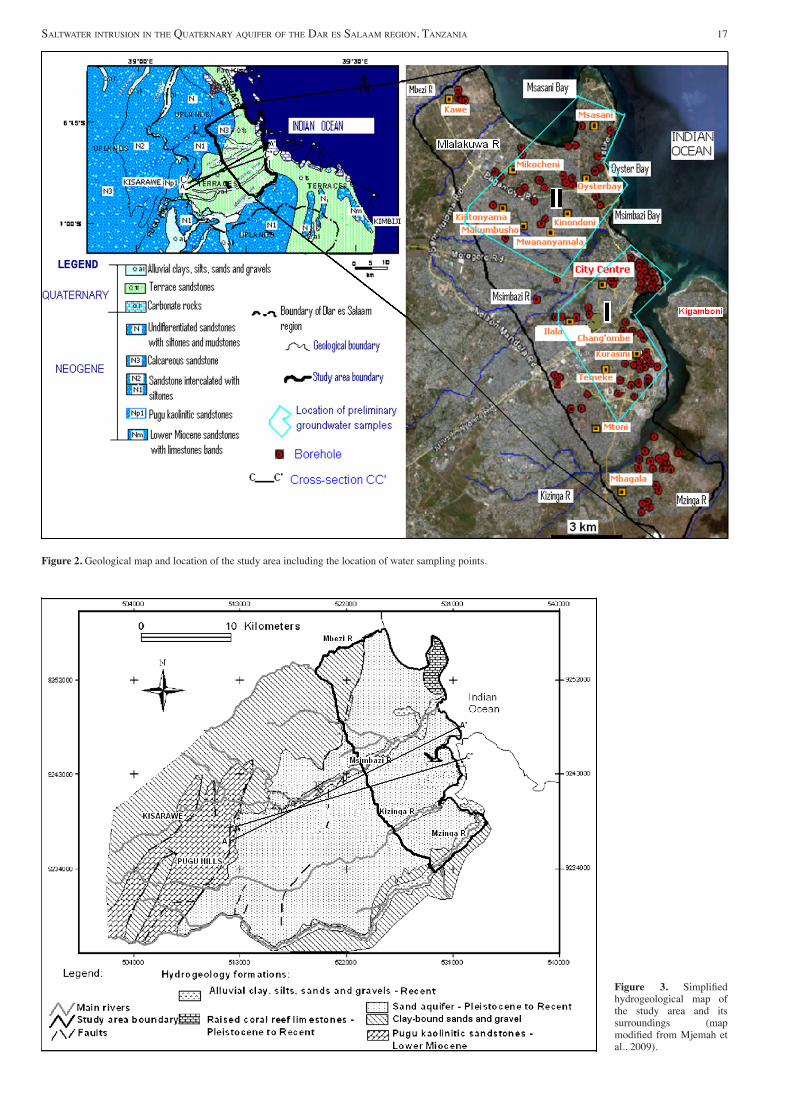
Figure 2. Geological map and location of the study area including the location of water sampling points.
Figure 3. Simplified hydrogeological map of the study area and its surroundings (map modified from Mjemah et al., 2009).

18 y. mtoni, i.C. mjemah, K. mSinDai, m. Van Camp & K. walraeVenS
2. Description of the study area
2.1 Location
The study area lies within the three municipalities which form the Dar es Salaam City: Kinondoni, Ilala and Temeke. It extends from Mbezi River and Msasani Bay in the north to the area between Kizinga and Mzinga Rivers in the south (Fig. 2). In the east the study area is bound by the Indian Ocean and Mzinga Creek. The Msimbazi River originating from Pugu Hills about 35 km west, divides the study area into north and south parts. Groundwater seepage in the central plain supports vegetation growth along the river valley forming a green strip.
2.2 Geology
The geology of the area is represented in Figs 2 and 3. In this study, two major geological units are recognized: i) the underlying substratum of (semi-)consolidated formations and outcropping rocks, and ii) superficial mainly loose sediments. The underlying (semi-)consolidated formations and outcropping rocks in Dar es Salaam region consist of Neogene clay-bound sands to hard sandstones. The far less consolidated terrace sands and sandstones of the Quaternary System are more extensive in the central and southern parts of Dar es Salaam Region (Fig. 2). In general the three main terraces in the eastern central coastal sedimentary plain are the Mtoni, Tanga and Sakura terraces (Alexander, 1968). Fig. 4 shows distinguished terraces in Dar es Salaam region. Mtoni terrace is narrow, fringing the coast line, and is elevated at about 0-10 m above mean sea level (msl). The Tanga terrace lies between 10-50 m above msl and is wide-spread within the city. The highest and most strongly dissected terrace is the Sakura terrace. The Quaternary deposits also comprise coral reef limestones, especially near the ocean. This reefal limestone crops out near the coastline. Neogene sandstone formations interbedded with siltstones and mudstones occupy the upland area south and west of the City Centre. The outcropping sediments in the study area vary from the semi-consolidated clay-bound sands and gravel of Mio-Pliocene age in the uplands in the northwest and to the southeast, to the far more unconsolidated suite of recent times, consisting of less consolidated terrace sands and sandstones and recent alluvium (Fig. 3). Coarse grained soils are dominant and are situated on the coastal terraces. An alternation of fine and coarse grained sands occurs within the valleys, creeks, deltas and mangrove sites. The mouths of Kizinga, Mzinga and Msimbazi rivers form the main deltas. In the river valleys, recent
alluvial deposits are covering the terrace sediments. Upland soils are situated on uplands and are the result of weathering of upland sandstone and siltstone of varying lithological composition.
2.3 Hydrogeology and Climate
2.3.1 HydrogeologyThe study area comprises mainly two aquifers both of Quaternary age: an upper unconfined sand aquifer and a lower semi-confined sand aquifer (Fig. 5). The upper and lower aquifers are separated by a clay aquitard. The lower aquifer overlies the substratum, formed by Mio-Pliocene clay-bound sands and gravels (undifferentiated deposits) with a thickness of several hundred meters (>740 m in borehole at Kimbiji) and the kaolinitic Pugu Sandstone (Mjemah, 2007). Near to the coastline exists the limestone aquifer, comprising the reef limestone of Pleistocene to Recent age, which is often in contact with the sandy aquifer, either underlying it or connected laterally. Although locally each of the above aquifers is significant, both sandy aquifers are the most important in Dar es Salaam for supplying groundwater, compared to the limestone aquifer. The study area is mainly covered by sandy soils, which allow a high potential infiltration.2.3.2 Rainfall The climate condition of Dar es Salaam Region is considered to be tropical, typified by hot and humid weather throughout much of the year. The wet season lasts for six months: long and heavy rains occurring in March to May, while short and light rains occur in October to December (Fig. 6). Dry seasons occur between these two periods, and are characterized by little rainfall. The area is under the influence of the SE monsoon during April to September, and the NE monsoon during October to March. It is characterized by rainfall under these two monsoons. The long-term average annual precipitation is about 1100 mm with maximum rainfall in April. The major precipitation (78.6%) is received from north east monsoons occurring during the long and short rains. The long rains have a monthly average peak of 253 mm whereas the short rains give an average peak of 117 mm.2.3.3 TemperatureTemperatures are high in November through February during which the temperature can rise up to 35oC. It is relatively cool between May and September with average temperature about 22°C. The average annual maximum temperature is around 32oC, whereas the average annual minimum temperature is 20oC.
Figure 4. Cross-section A-A’ showing elevation and coastal terraces in Dar es Salaam Region. Location of the profile is shown on Figs 2 & 3.

Saltwater intruSion in the Quaternary aQuifer of the Dar eS Salaam region, tanzania 19
2.3.4 Relative Humidity
Relative humidity in Dar es Salaam is consistently high throughout the year. The highest maximum relative humidity in the area is reached in April with 88%, whereas the lowest minimum relative humidity is achieved in June, July, August and September, and is averaged at 64%, while the average annual relative humidity is 77%.
2.3.5 Evapotranspiration
During the heavy rains occurring in March to May, precipitation is obviously greater than potential evapotranspiration. In dry months (January to February and June to September) including the period of short rains in October to December, evapotranspiration is greater than precipitation (Fig. 6). Because of the low precipitation, additional
Figure 5. Hydrogeological cross-section C-C’ of the study area (Mjemah et al., 2009). Location of the profile is shown in Figs 1 & 2
Figure 6. Average weather conditions for Dar es Salaam
20 y. mtoni, i.C. mjemah, K. mSinDai, m. Van Camp & K. walraeVenS
water used for evapotranspiration mainly comes from soil, and as a consequence soil moisture decreases in this period.
2.4 Groundwater recharge
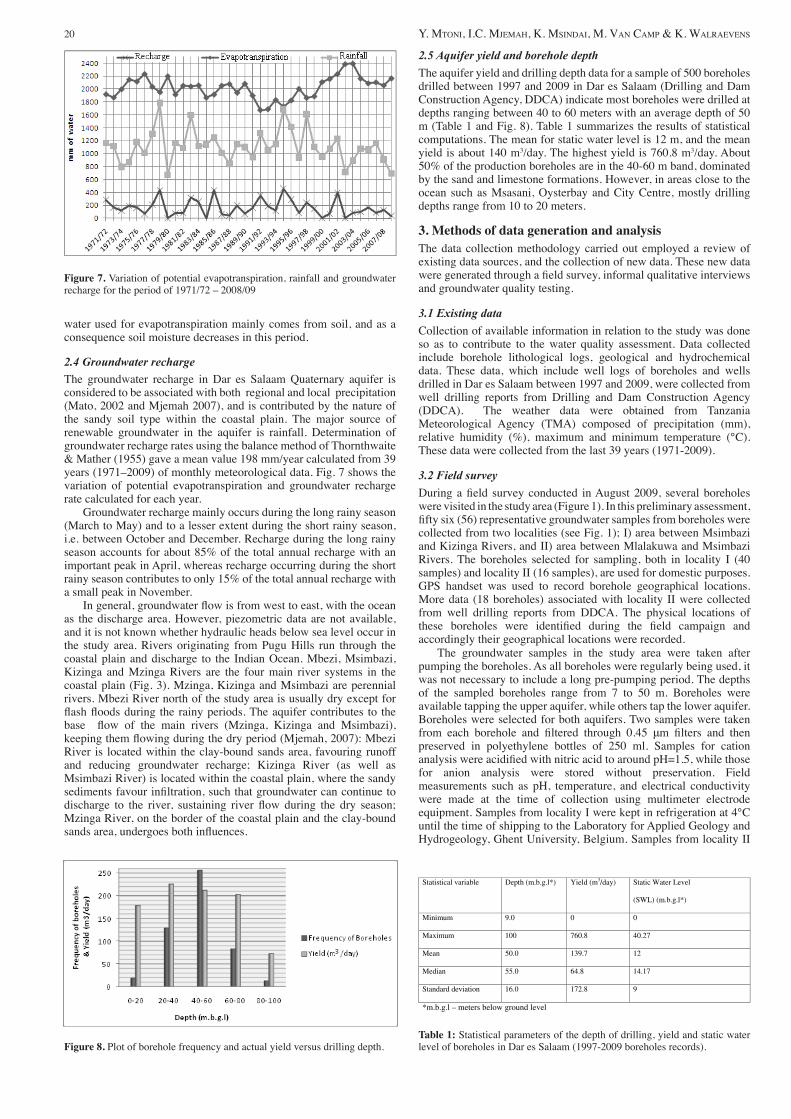
The groundwater recharge in Dar es Salaam Quaternary aquifer is considered to be associated with both regional and local precipitation (Mato, 2002 and Mjemah 2007), and is contributed by the nature of the sandy soil type within the coastal plain. The major source of renewable groundwater in the aquifer is rainfall. Determination of groundwater recharge rates using the balance method of Thornthwaite & Mather (1955) gave a mean value 198 mm/year calculated from 39 years (1971–2009) of monthly meteorological data. Fig. 7 shows the variation of potential evapotranspiration and groundwater recharge rate calculated for each year. Groundwater recharge mainly occurs during the long rainy season (March to May) and to a lesser extent during the short rainy season, i.e. between October and December. Recharge during the long rainy season accounts for about 85% of the total annual recharge with an important peak in April, whereas recharge occurring during the short rainy season contributes to only 15% of the total annual recharge with a small peak in November. In general, groundwater flow is from west to east, with the ocean as the discharge area. However, piezometric data are not available, and it is not known whether hydraulic heads below sea level occur in the study area. Rivers originating from Pugu Hills run through the coastal plain and discharge to the Indian Ocean. Mbezi, Msimbazi, Kizinga and Mzinga Rivers are the four main river systems in the coastal plain (Fig. 3). Mzinga, Kizinga and Msimbazi are perennial rivers. Mbezi River north of the study area is usually dry except for flash floods during the rainy periods. The aquifer contributes to the base flow of the main rivers (Mzinga, Kizinga and Msimbazi), keeping them flowing during the dry period (Mjemah, 2007): Mbezi River is located within the clay-bound sands area, favouring runoff and reducing groundwater recharge; Kizinga River (as well as Msimbazi River) is located within the coastal plain, where the sandy sediments favour infiltration, such that groundwater can continue to discharge to the river, sustaining river flow during the dry season; Mzinga River, on the border of the coastal plain and the clay-bound sands area, undergoes both influences.
2.5 Aquifer yield and borehole depth
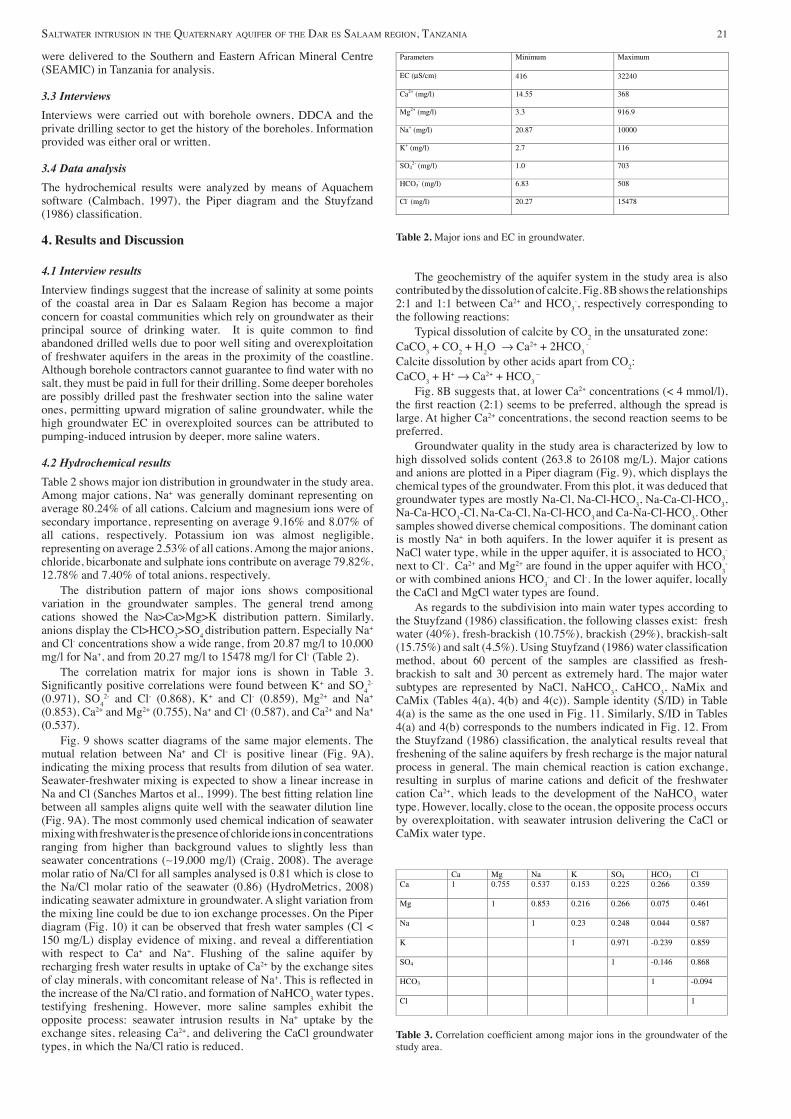
The aquifer yield and drilling depth data for a sample of 500 boreholes drilled between 1997 and 2009 in Dar es Salaam (Drilling and Dam Construction Agency, DDCA) indicate most boreholes were drilled at depths ranging between 40 to 60 meters with an average depth of 50 m (Table 1 and Fig. 8). Table 1 summarizes the results of statistical computations. The mean for static water level is 12 m, and the mean yield is about 140 m3/day. The highest yield is 760.8 m3/day. About 50% of the production boreholes are in the 40-60 m band, dominated by the sand and limestone formations. However, in areas close to the ocean such as Msasani, Oysterbay and City Centre, mostly drilling depths range from 10 to 20 meters.
3. Methods of data generation and analysisThe data collection methodology carried out employed a review of existing data sources, and the collection of new data. These new data were generated through a field survey, informal qualitative interviews and groundwater quality testing.
3.1 Existing data
Collection of available information in relation to the study was done so as to contribute to the water quality assessment. Data collected include borehole lithological logs, geological and hydrochemical data. These data, which include well logs of boreholes and wells drilled in Dar es Salaam between 1997 and 2009, were collected from well drilling reports from Drilling and Dam Construction Agency (DDCA). The weather data were obtained from Tanzania Meteorological Agency (TMA) composed of precipitation (mm), relative humidity (%), maximum and minimum temperature (°C). These data were collected from the last 39 years (1971-2009).
3.2 Field survey
During a field survey conducted in August 2009, several boreholes were visited in the study area (Figure 1). In this preliminary assessment, fifty six (56) representative groundwater samples from boreholes were collected from two localities (see Fig. 1); I) area between Msimbazi and Kizinga Rivers, and II) area between Mlalakuwa and Msimbazi Rivers. The boreholes selected for sampling, both in locality I (40 samples) and locality II (16 samples), are used for domestic purposes. GPS handset was used to record borehole geographical locations. More data (18 boreholes) associated with locality II were collected from well drilling reports from DDCA. The physical locations of these boreholes were identified during the field campaign and accordingly their geographical locations were recorded. The groundwater samples in the study area were taken after pumping the boreholes. As all boreholes were regularly being used, it was not necessary to include a long pre-pumping period. The depths of the sampled boreholes range from 7 to 50 m. Boreholes were available tapping the upper aquifer, while others tap the lower aquifer. Boreholes were selected for both aquifers. Two samples were taken from each borehole and filtered through 0.45 μm filters and then preserved in polyethylene bottles of 250 ml. Samples for cation analysis were acidified with nitric acid to around pH=1.5, while those for anion analysis were stored without preservation. Field measurements such as pH, temperature, and electrical conductivity were made at the time of collection using multimeter electrode equipment. Samples from locality I were kept in refrigeration at 4°C until the time of shipping to the Laboratory for Applied Geology and Hydrogeology, Ghent University, Belgium. Samples from locality II
Figure 7. Variation of potential evapotranspiration, rainfall and groundwater recharge for the period of 1971/72 – 2008/09
Statistical variable
Depth (m.b.g.l*) Yield (m3/day)
Static Water Level
(SWL) (m.b.g.l*)
Minimum 9.0 0 0
Maximum 100 760.8 40.27
Mean 50.0 139.7 12
Median 55.0 64.8 14.17
Standard deviation 16.0 172.8 9
*m.b.g.l – meters below ground level
Table 1: Statistical parameters of the depth of drilling, yield and static water level of boreholes in Dar es Salaam (1997-2009 boreholes records).Figure 8. Plot of borehole frequency and actual yield versus drilling depth.
Saltwater intruSion in the Quaternary aQuifer of the Dar eS Salaam region, tanzania 21
were delivered to the Southern and Eastern African Mineral Centre (SEAMIC) in Tanzania for analysis.
3.3 Interviews
Interviews were carried out with borehole owners, DDCA and the private drilling sector to get the history of the boreholes. Information provided was either oral or written.
3.4 Data analysis
The hydrochemical results were analyzed by means of Aquachem software (Calmbach, 1997), the Piper diagram and the Stuyfzand (1986) classification.
4. Results and Discussion
4.1 Interview results
Interview findings suggest that the increase of salinity at some points of the coastal area in Dar es Salaam Region has become a major concern for coastal communities which rely on groundwater as their principal source of drinking water. It is quite common to find abandoned drilled wells due to poor well siting and overexploitation of freshwater aquifers in the areas in the proximity of the coastline. Although borehole contractors cannot guarantee to find water with no salt, they must be paid in full for their drilling. Some deeper boreholes are possibly drilled past the freshwater section into the saline water ones, permitting upward migration of saline groundwater, while the high groundwater EC in overexploited sources can be attributed to pumping-induced intrusion by deeper, more saline waters.
4.2 Hydrochemical results
Table 2 shows major ion distribution in groundwater in the study area. Among major cations, Na+ was generally dominant representing on average 80.24% of all cations. Calcium and magnesium ions were of secondary importance, representing on average 9.16% and 8.07% of all cations, respectively. Potassium ion was almost negligible, representing on average 2.53% of all cations. Among the major anions, chloride, bicarbonate and sulphate ions contribute on average 79.82%, 12.78% and 7.40% of total anions, respectively. The distribution pattern of major ions shows compositional variation in the groundwater samples. The general trend among cations showed the Na>Ca>Mg>K distribution pattern. Similarly, anions display the Cl>HCO3>SO4 distribution pattern. Especially Na+ and Cl- concentrations show a wide range, from 20.87 mg/l to 10,000 mg/l for Na+, and from 20.27 mg/l to 15478 mg/l for Cl- (Table 2). The correlation matrix for major ions is shown in Table 3. Significantly positive correlations were found between K+ and SO4
2- (0.971), SO4
2- and Cl- (0.868), K+ and Cl- (0.859), Mg2+ and Na+ (0.853), Ca2+ and Mg2+ (0.755), Na+ and Cl- (0.587), and Ca2+ and Na+ (0.537). Fig. 9 shows scatter diagrams of the same major elements. The mutual relation between Na+ and Cl- is positive linear (Fig. 9A), indicating the mixing process that results from dilution of sea water. Seawater-freshwater mixing is expected to show a linear increase in Na and Cl (Sanches Martos et al., 1999). The best fitting relation line between all samples aligns quite well with the seawater dilution line (Fig. 9A). The most commonly used chemical indication of seawater mixing with freshwater is the presence of chloride ions in concentrations ranging from higher than background values to slightly less than seawater concentrations (∼19,000 mg/l) (Craig, 2008). The average molar ratio of Na/Cl for all samples analysed is 0.81 which is close to the Na/Cl molar ratio of the seawater (0.86) (HydroMetrics, 2008) indicating seawater admixture in groundwater. A slight variation from the mixing line could be due to ion exchange processes. On the Piper diagram (Fig. 10) it can be observed that fresh water samples (Cl < 150 mg/L) display evidence of mixing, and reveal a differentiation with respect to Ca+ and Na+. Flushing of the saline aquifer by recharging fresh water results in uptake of Ca2+ by the exchange sites of clay minerals, with concomitant release of Na+. This is reflected in the increase of the Na/Cl ratio, and formation of NaHCO3 water types, testifying freshening. However, more saline samples exhibit the opposite process: seawater intrusion results in Na+ uptake by the exchange sites, releasing Ca2+, and delivering the CaCl groundwater types, in which the Na/Cl ratio is reduced.
The geochemistry of the aquifer system in the study area is also contributed by the dissolution of calcite. Fig. 8B shows the relationships 2:1 and 1:1 between Ca2+ and HCO3
-, respectively corresponding to the following reactions: Typical dissolution of calcite by CO2 in the unsaturated zone:CaCO3 + CO2 + H2O → Ca2+ + 2HCO3
-
Calcite dissolution by other acids apart from CO2:CaCO3 + H+ → Ca2+ + HCO3
–
Fig. 8B suggests that, at lower Ca2+ concentrations (< 4 mmol/l), the first reaction (2:1) seems to be preferred, although the spread is large. At higher Ca2+ concentrations, the second reaction seems to be preferred. Groundwater quality in the study area is characterized by low to high dissolved solids content (263.8 to 26108 mg/L). Major cations and anions are plotted in a Piper diagram (Fig. 9), which displays the chemical types of the groundwater. From this plot, it was deduced that groundwater types are mostly Na-Cl, Na-Cl-HCO3, Na-Ca-Cl-HCO3, Na-Ca-HCO3-Cl, Na-Ca-Cl, Na-Cl-HCO3 and Ca-Na-Cl-HCO3. Other samples showed diverse chemical compositions. The dominant cation is mostly Na+ in both aquifers. In the lower aquifer it is present as NaCl water type, while in the upper aquifer, it is associated to HCO3
- next to Cl-. Ca2+ and Mg2+ are found in the upper aquifer with HCO3
- or with combined anions HCO3
- and Cl-. In the lower aquifer, locally the CaCl and MgCl water types are found. As regards to the subdivision into main water types according to the Stuyfzand (1986) classification, the following classes exist: fresh water (40%), fresh-brackish (10.75%), brackish (29%), brackish-salt (15.75%) and salt (4.5%). Using Stuyfzand (1986) water classification method, about 60 percent of the samples are classified as fresh-brackish to salt and 30 percent as extremely hard. The major water subtypes are represented by NaCl, NaHCO3, CaHCO3, NaMix and CaMix (Tables 4(a), 4(b) and 4(c)). Sample identity (S/ID) in Table 4(a) is the same as the one used in Fig. 11. Similarly, S/ID in Tables 4(a) and 4(b) corresponds to the numbers indicated in Fig. 12. From the Stuyfzand (1986) classification, the analytical results reveal that freshening of the saline aquifers by fresh recharge is the major natural process in general. The main chemical reaction is cation exchange, resulting in surplus of marine cations and deficit of the freshwater cation Ca2+, which leads to the development of the NaHCO3 water type. However, locally, close to the ocean, the opposite process occurs by overexploitation, with seawater intrusion delivering the CaCl or CaMix water type.
Parameters Minimum Maximum
EC (µS/cm) 416 32240
Ca2+
(mg/l) 14.55 368
Mg2+
(mg/l) 3.3 916.9
Na+ (mg/l) 20.87 10000
K+ (mg/l) 2.7 116
SO42-
(mg/l) 1.0 703
HCO3- (mg/l) 6.83 508
Cl- (mg/l) 20.27 15478
Table 2. Major ions and EC in groundwater.
Ca Mg Na K SO4 HCO3 Cl
Ca 1 0.755 0.537 0.153 0.225 0.266 0.359
Mg 1 0.853 0.216 0.266 0.075 0.461
Na 1 0.23 0.248 0.044 0.587
K 1 0.971 -0.239 0.859
SO4 1 -0.146 0.868
HCO3 1 -0.094
Cl 1
Table 3. Correlation coefficient among major ions in the groundwater of the study area.

22 y. mtoni, i.C. mjemah, K. mSinDai, m. Van Camp & K. walraeVenS
Fig. 11 shows the concentration of chloride in locality I. Groundwater samples at Ilala, Kariakoo, Chang’ombe, the Harbour, Kurasini and Temeke areas show relatively good quality compared to the City Centre. In the City Centre (north-east in Fig. 11), fresh water (< 150 mg/l) is present about 2 km from the sea, but within 1 km from the sea, many wells are brackish (300-1000 mg/l) to brackish-salt (1000-10000 mg/l). This evident relation to distance from the sea clearly points to seawater intrusion for the cause of salinity. For boreholes at Ilala, Kariakoo, Chang’ombe and the Harbour areas, water types range from fresh water (< 150 mg/l) to fresh-brackish (150-300 mg/l). Samples from Kurasini and Temeke areas show mainly fresh water (< 150 mg/l), except boreholes 28 and 35 which indicate brackish water (300-1000 mg/l). The effect of salinization is greater in the City Centre for boreholes drilled within 1 km from the ocean (Fig. 11). A previous survey (URT, 1997) for the augmentation of Dar es Salaam water supply mentions increased salinity caused by overpumping in the boreholes and shallow wells in the alluvium of Gerezani creek and Agip Lubricant Plant located at the City Centre close to the ocean. Most wells at Gerezani are reported to be abandoned due to salinization, but for the Agip Lubricant Plant borehole (100 meter from the sea), water quality improved to large extent after the owner reduced pumpage. The majority of the samples in locality II (Fig. 12) are not suitable for domestic purposes and far from drinking water standards, because of their high salinity. These water types signify saline water contamination. This is deduced from the dominance of the principal seawater ions (chloride and sodium) and the high electrical conductivity
(EC). EC and chloride concentration decrease from the ocean to inland (Figs 12 & 13). This is pointing to seawater intrusion causing the salinization. Boreholes at Msasani, Oysterbay, Masaki and part of Mikocheni are affected by sea water intrusion extending to at least 1 km from the ocean. These boreholes tap water from weathered/fractured calcareous limestone and are within the relatively flat land, ranging from 0-13 m above sea level. EC values in these boreholes are above the acceptable limit for drinking water (2000 µS/cm). On the other hand, boreholes at Mwananyamala, Makumbusho and Kijitonyama are found more inland, mostly at elevation greater than 15 m above sea level and are characterized by EC values within the acceptable limit for drinking water. These boreholes penetrate the medium to coarse sand formations. According to interviews with owners of boreholes number 7 and 12 (Figs 12 and 13), the water in their boreholes is not suitable for drinking but is used for watering gardens; water pumping is stopped in late summer since water becomes more saline and affects vegetation. Within the vicinity of this area, boreholes were abandoned due to high salinity, including boreholes identified as DSM 891/2005 (located at Police Officers Mess) and DSM 41/97 (located at Oysterbay Police). Along the coastline from Oysterbay to Msasani and Masaki areas, salinization is common. However, at borehole 33 and borehole 16 (located at Msasani Mosque), freshening was observed. Borehole 16 is within the dune belt which extends from the Msasani Mosque to Kawe area in the north west of the study locality. This dune occurs within the youngest Holocene formation termed the Mtoni terrace (Alexander, 1968). Freshening of aquifers in dune belts is quite
Figure 9. Scatter diagrams of some major elements. A: Chloride versus Sodium; B: Bicarbonate versus Calcium.
Figure 10. Piper plot with representation of major ions and groundwater types in the study area.

Saltwater intruSion in the Quaternary aQuifer of the Dar eS Salaam region, tanzania 23
common along coastlines and has been reported elsewhere (Walraevens and Van Camp, 2005; Namboothri et al., 2008). The challenge encountered in the study area is that the probability of saline water intrusion is high. There is a number of existing boreholes in the study area that contain salt water. Vertical electrical sounding (VES) technique was used to carry out geophysical investigations before borehole drilling in order to get an overview of subsurface conditions. The drilling depth is recommended based on the interpretation of the VES curves. Most of VES carried out in the
study area had a 3-layer geoelectric section: the top layer consists of the unsaturated zone, the intermediate layer consists of fresh-water saturated limestone or sands and the bottom layer is saltwater saturated. Fig. 14 shows an example of the VES carried out at Oysterbay at borehole number 12 (Figs 12 & 13). Shallow boreholes contain less Na+ and Cl- than deeper ones. The boreholes that are drilled down to the lower aquifer have average values of 267 and 382 mg/L for Na+ and Cl- ions respectively compared with 135 and 190 mg/L for the upper aquifer. This implies that the
S/ID Depth pH EC Na+ K+ Ca2+ Mg2+ Fe2+/3+ Mn2+ NH4+ Cl- SO4
2- NO3- NO2
- HCO3- CO3
2- PO43- Piper Stuyfzand
(m) µS/cm mg/l mg/l mg/l mg/l mg/l mg/l mg/l mg/l mg/l mg/l mg/l mg/l mg/l mg/l
1 22 8.19 1060 103.75 17 58.05 16.2 0.38 0.033 0.0002 107.6 56.528 6.859 0.003 183.6 28.8 0.04 Na-Ca-Cl-HCO3 F3-NaMix+
2 30 8.31 4020 550 42 66.45 49.75 0.54 0.031 0.0001 760.9 264.15 0.798 0.0007 411.8 66 0.161 Na-Cl B3-NaCl+
3 30 8.52 4280 632.5 42.5 41.7 33.75 0.5 0.028 0.0001 870.63 177.43 1.923 0.0006 354.4 65.4 0.055 Na-Cl B3-NaCl+
4 20 8.45 3970 464.75 59 79.15 84 0.44 0.024 0.0006 872.55 93.328 1.436 0.0007 321.5 21.6 0.026 Na-Mg-Cl B4-NaCl+
5 25 8.48 850 68.75 16 34.5 20.35 0.48 0.029 0.0002 68.255 60.506 44.91 0.0002 158 30 0.115 Na-Ca-Mg-HCO3-Cl F2-NaHCO3+
6 16 8.40 3510 430.25 30 66 62.5 0.35 0.028 0.0001 815.23 146.82 53.54 0.004 122.6 27.6 0.245 Na-Cl B4-NaCl+
7 13 8.51 17600 2492.5 116 157.65 265 0.39 0.049 0.0156 4745.2 703.05 6.705 0.0009 242.8 49.2 0.039 Na-Cl Bs5-NaCl+
8 22 8.55 1270 180 17.5 24.3 19.6 0.44 0.017 0.0001 91.206 48.41 48.89 0.0002 250.7 57 0.036 Na-HCO3-Cl F2-NaHCO3+
9 25 8.22 1320 119 24 49.7 32 0.48 0.057 0.0008 137.59 61.956 8.896 0.0188 242.2 38.4 0.044 Na-Mg-Ca-HCO3-Cl F3-NaMix+
10 30 8.59 2470 389.25 33 24.25 17.35 0.49 0.023 0.0006 355.39 85.201 2.214 0.0005 367.8 68.4 0.135 Na-Cl-HCO3 B2-NaCl+
11 30 8.45 2740 454.25 15 42.1 13.6 0.61 0.031 0.0826 311.15 121.64 0.162 0.0041 377 120.6 0.041 Na-Cl-HCO3 B2-NaCl+
12 50 8.55 1780 221.75 15 54.3 17.2 0.37 0.032 0.0005 168.73 110.06 98.08 0.0268 267.2 43.8 0.069 Na-Cl-HCO3 Fb3-NaCl+
13 50 8.22 950 55.75 18.5 75 9.2 0.51 0.038 0.0008 85.058 50.515 25.37 0.0554 161 50.4 0.462 Ca-Na-HCO3-Cl-CO2 F3-CaMix+
14 25 7.76 980 100.75 15.5 48.75 9.25 0.36 0.034 0.0002 42.107 52.65 23.72 0.0003 227.5 33.6 0.018 Na-Ca-HCO3 F2-NaHCO3+
15 50 7.92 1370 116.5 7 74.25 8.5 0.46 0.053 0.0001 160.87 51.301 64.94 0.015 109.2 11.4 0.077 Na-Ca-Cl Fb3-NaMix+
16 46 8.08 1780 173 10 57.25 20.75 0.53 0.043 0.0002 280.1 83.972 53.44 0.0006 157.4 12 0.017 Na-Ca-Cl Fb3-NaMix+
17 34 8.25 1300 81.25 19 76.2 19.95 0.35 0.16 0.0002 96.809 82.663 139.7 0.5864 119.6 34.2 0.145 Ca-Na-Cl-NO3-HCO3 F3-CaMix+
18 50 7.71 850 70.5 8.5 52.05 7.9 0.35 0.017 0.0003 85.668 26.918 22.43 0.0007 221.4 0 0.069 Na-Ca-HCO3-Cl F2-NaMix+
19 46 6.73 454 22.3 10 23.75 13.8 0.48 0.057 0.0007 20.27 17.169 36.42 1.204 118.3 0 0.016 Ca-Mg-Na-Cl-HCO3 F2-CaMix+
20 20 7.89 1250 75 36.5 77 15 0.42 0.14 0.0003 95.62 78.977 263.2 1.0404 99.43 0 0.957 Ca-Na-NO3 F3-CaNO3+
21 8.66 1860 304 19 14.55 12.05 0.07 0.018 0.00008 262.56 80.769 6.758 0.0007 228.1 67.8 0.401 Na-HCO3-Cl Fb1-NaMix+
22 40 8.55 1200 146 15.5 33.15 11.45 0.22 0.042 0.00001 102.16 64.977 51.14 0.1125 166.5 51.6 0.139 Na-Cl-HCO3 F2-NaMix+
23 20 8.33 940 64.75 9 70.1 13.55 0.13 0.054 0.0003 91.62 51.442 47.77 0.0075 120.2 26.4 0.247 Ca-Na-Cl-HCO3 F3-CaMix+
24 25 8.32 790 65.5 7 63.55 7.1 0.08 0.006 0.0001 83.6 39.135 55.09 0.1178 121.4 22.2 0.177 Ca-Na-Cl-HCO3 F2-CaMix+
25 40 8.52 1750 231.5 13.5 56.85 14.7 0.1 0.012 0.0008 290.48 71.806 0.097 0.0076 133.6 35.5 0.162 Na-Ca-Cl-HCO3 Fb3-NaCl+
26 40 8.36 640 60.25 5 41.4 4.7 0.1 0.003 0.0003 52.02 19.758 11.49 0.0016 166.5 19.2 0.215 Na-Ca-Cl-HCO3 F2-NaMix+
27 30 8.38 1530 201.5 11.5 54 20.85 0.06 0.013 0.00008 209.79 83.267 6.354 0.0006 220.2 40.8 0.205 Na-Ca-Cl-HCO3 Fb3-NaMix+
28 45 8.10 1765 222 9 88.45 15.65 0.07 0.011 0.00006 306.25 91.292 4.174 0.0007 215.3 0 0.016 Na-Ca-Cl-HCO3 B3-NaCl+
29 18 8.35 830 67.5 8.5 65.8 7.9 0.28 0.071 0.00008 71.39 21.419 64.5 0.1459 189.7 9.6 0.245 Ca-Na-HCO3-Cl F2-CaMix+
30 16 8.29 700 26.5 19 75.95 8.4 0.12 0.062 0.0004 39.068 27.381 73.07 0.0007 172.6 18 0.202 Ca-HCO3 F3-CaHCO3+
31 40 8.22 560 69.7 4.5 18.85 3.3 0.3 0.028 0.0001 60.644 19.949 11.78 0.0372 109.2 16.8 0.168 Na-Ca-HCO3-Cl F1-NaMix+
32 32 8.20 760 54.05 12 42.25 12.95 0.54 0.224 0.0001 71.616 70.094 0.515 0.0007 133.6 10.2 0.009 Na-Ca-HCO3-Cl-SO4 F2-NaMix+
33 30 7.98 416 30.7 6.5 20.45 6.2 0.2 0.04 0.00001 29.091 23.121 37.89 0.0167 85.4 0 0.069 Na-Ca-HCO3-Cl F1-NaMix+
S/ ID/
S/No.
Location Depth
(m)
pH EC Ca2+
Mg2+
Na+
K+
SO42-
HCO3-
CO32-
Cl- Piper Stuyfzand
µs/cm mg/l mg/l mg/l mg/l mg/l mg/l mg/l mg/l
1 Kijitonyama 48 6.83 1340 31.41 20.35 204.53 7.48 100 20.74 3.6 255 Na-SO4-Cl Fb2-NaCl+
2 Makumbusho 50 6.92 1050 37.04 18.87 135.46 24.52 88 18.91 1.8 78 Na-Ca-Mg-Cl-SO4 F2-NaMix+
3 Mwananyamala 45 7.17 990 38.7 20.73 106.81 19.84 83 17.08 3.6 202 Na-Ca-Mg-Cl-SO4 Fb2-NaCl+
4 Mwananyamala 42 7.13 424 25.03 16.89 20.87 5.74 1 6.83 0.48 114.4 Mg-Ca-K-Cl F2-MgCl+
5 Mwananyamala 45 7.55 1390 70.75 21.3 66.39 53.78 81 10.07 0 241.5 Na-Mg-Cl Fb3-NaCl+
6 Oysterbay 15 7.25 1640 51.97 51.14 163.97 24.05 80 17.08 0.6 436.5 Na-Mg-Ca-Cl B3-NaCl+
7 Oysterbay 15 6.96 3820 54.61 74.13 621.37 59.13 192 23.18 0.6 1198.6 Na-Cl Bs4-NaCl+
8 Mikocheni 30 7.76 1880 18.09 14.98 288.11 13.6 133 28.06 2.4 381 Na-Cl-SO4 B2-NaCl+
9 Oysterbay 28 7.17 4350 71.7 71.41 778.58 60.15 294 37.21 0 1463 Na-Cl Bs4-NaCl+
10 Msasani 28 6.96 2030 88.65 58.12 158.13 69.04 138 21.35 0 543 Na-Mg-Ca-Cl-SO4 B4-NaCl+
11 Msasani 25 7.04 2030 89.71 45.79 155.01 49.28 105 15.86 0 464 Na-Ca-Mg-Cl B4-NaCl+
12 Oysterbay 7 8.11 7490 220 121.6 1150 10 20 291.8 2.4 2500 Na-Cl Bs5-NaCl+
13 Oysterbay 22 7.05 1270 71.95 41.14 77.7 43.57 90 25.62 0 328 Ca-Mg-Na-Cl-SO4 B3-CaCl+
14 Msasani 18 7 2810 46.69 67.25 395.96 45.44 173 21.18 0.48 798 Ca-Na-Mg-Cl-SO4 B3-CaCl+
15 Oysterbay 15 7.98 32000 140 442 9500 70 188 192 0 15000 Na-Cl S6-NaCl+
16 Msasani 12 7.13 1250 115.93 93.08 189.11 9.66 168 12.81 0 125 Na-Cl-SO4 F2-NaCl+
Table 4(a). Physico – chemical parameters of the groundwater samples for the area located between Msimbazi and Kizinga Rivers. Water types were classified according to Piper and Stuyfzand (1986) methods.
Table 4(b). Physico – chemical parameters of the groundwater samples for the area located between Mlalakuwa and Msimbazi Rivers (Field survey). Water types were classified according to Piper and Stuyfzand (1986) methods.

24 y. mtoni, i.C. mjemah, K. mSinDai, m. Van Camp & K. walraeVenS
deep boreholes are more exposed to salt water intrusion or contain relict saline water. Certainly, the hypothesis of airborne salts being the cause of the salinity is refuted by this finding. Bicarbonate is the dominant anion in the upper aquifer. In the lower aquifer, chloride is the dominant anion. The dominant cation is Na+ in both aquifers.
A clear example of groundwater quality evolution occurs within the Tanga terrace in Kurasini, Changombe and Temeke areas. In these localities, zones of different water type occur, that trend in the direction of groundwater flow, from west to east. Groundwater types are from the inland toward the coast: CaMix, NaMix, and NaCl, showing increasing influence of salinity.
4.3 Mechanism of saltwater intrusion
The findings that salinity decreases with increasing distance from the coast and that salinity increases with increasing depth, indicate that seawater intrusion causes the salinization. The hypothesis of airborne salts is an unlikely explanation for the increase in chloride concentrations.
The possibility for upward leakage of saltwater from deep marine sediments through joints, fractures, collapse features, or other structural anomalies needs to be verified by further investigations. However, available data indicate that this mechanism is more important inland, to the west of the study area, where the induced salinity levels seem to remain often lower compared to those found in groundwater near the coast.
5. Preliminary conclusions and further work
5.1 Preliminary conclusions
Preliminary evaluation of salt water pollution in aquifers in two pilot areas located between Msimbazi and Kizinga Rivers (locality I) and Mlalakuwa and Msimbazi Rivers (locality II) has shown that there exists sea water intrusion in sites close to the coastline.
Geological mapping, limited geo-electric surveys and borehole data show that the aquifer rocks near the coast comprise limestone reefs backed by semi-consolidated sands and sandstone/siltstone terraces intercalated with clays. Concealed limestones also occur within the terraces and upland clay bound sands.
The coastal aquifers are characterized by the interactions between continental and marine conditions (Mjemah, 2007). Furthermore, this study has shown that this geological and hydrogeological setting has resulted in groundwater pollution. In the close proximity to the coastline, this situation has resulted in salinization. Water samples from boreholes at the City Centre and along the coastline from Oysterbay to Msasani and Masaki areas, show elevated chloride, sulphate and sodium concentrations. The findings that salinity decreases with increasing distance from the coast and that salinity increases with increasing depth, indicate that seawater intrusion causes the salinization. This has been induced mainly by excessive pumping to meet the increasing water demand for Dar es Salaam City.
S/No. S/ID
Location Depth
(m)
pH EC
µs/cm
Ca2+
(mg/l)
Mg2+
(mg/l)
Na+
(mg/l)
K+
(mg/l)
SO42-
(mg/l)
HCO3-
(mg/l)
Cl-
(mg/l)
Piper Stuyfzand
17 616/2007 Oysterbay 16 7.1 15400 220 377 2500 20 344.8 356.6 6094 Na-Cl Bs6-NaCl+
18 615/2007 Oysterbay 15 7.4 17930 240 498.6 2500 25 356 330 5800 Na-Mg-Cl Bs6-NaCl+
19 34/2003 Kijitonyama 50 8.4 2010 58 22.9 300 6 185 300 497 Na-Cl-HCO3 B3-NaCl+
20 439/2003 Mwananyamala 45 8.4 820 27.6 10 175 25 42.5 330 66.7 Na-HCO3-Cl F2-NaHCO3+
21 284/2008 Oysterbay 15 114 21.2 50 5 2.1 330 118.8 Ca-Na-HCO3-Cl F3-CaHCO3+
22 394/2007 Oysterbay 14 112 70.5 800 25 96 280 1431 Na-HCO3-Cl Bs4-NaCl+
23 65/2005 Mikocheni 24 8.4 2532 34 18.2 500 15 200 348 550 Na-Cl-HCO3 B2-NaCl+
24 68/2006 Msasani 17 54 45 750 7.5 270 508 788 Na-Cl B3-NaCl+
25 224/2006 Mikocheni 13 7.1 7620 368 231 900 7.5 125 454 2084 Na-Mg-Cl Bs6-NaCl+
26 687/2006 Oysterbay 18 6.9 3480 80 80 450 30 275 476 790 Na-Cl B4-NaCl+
27 799/2008 Oysterbay 15 6.9 2580 97.6 63.2 350 20 175 429 482.1 Na-Ca-Cl-HCO3 B4-NaCl+
28 548/2005 Oysterbay 12 8.4 3520 100 46.2 600 8 165 492 674.5 Na-Cl-HCO3 B4-NaCl+
29 891/2005 Oysterbay 15 7.4 32240 140 442 10000 70 188 192 15076 Na-Cl-HCO3 S6-NaCl+
30 62/2007 Oysterbay 112 28 350 15 162.5 402 464.9 Na-Cl-HCO3 B3-NaCl+
31 559/2007 Oysterbay 220 121.6 1150 10 20 291.8 2500 Mg-Ca-HCO3 Bs5-NaCl+
32 79/2005 Msasani 7 8.5 6130 172 107 1000 15 337 254 1846 Na-Cl Bs5-NaCl+
33 732/2006 Msasani 24 7.2 1456 120 73 50 12 250 422 72 Mg-Ca-Cl-HCO3-SO4 F4-MgHCO3+
34 392/99 Masaki 15 6.9 32200 304 916.9 7500 2.7 9 134 15,478 Na-Cl S7-NaCl+
Table 4(c). Physico – chemical parameters of the groundwater samples for the area located between Mlalakuwa and Msimbazi Rivers (DDCA Dataset). Water types were classified according to Piper and Stuyfzand (1986) methods.
Figure 11. Map showing concentration of chloride in locality I.
Figure 12. Concentration of chloride in the area between Mlalakuwa and Msimbazi Rivers.

Saltwater intruSion in the Quaternary aQuifer of the Dar eS Salaam region, tanzania 25
5.2 Further work
In order to properly assess the origin, nature and mobility of solutes within this aquifer system, the ongoing PhD research will focus on the following:
• Determine groundwater flow, by collecting piezometric data.
• Mapping of deduced hydrogeochemical classes.
• Continue to collect and re-evaluate groundwater geochemical data as a means of tracking potential trends in water quality.
• Additional sampling of boreholes not sampled before will improve understanding the spatial distribution of fresh and saline groundwater and the processes that determine groundwater quality evolution.
• In order to provide valuable information on the hydrogeologic system of the aquifers, the subsurface lithology and the groundwater salinity, vertical electrical resistivity soundings (VES) and profiling will be carried out.
• Developing a mathematical model to perform impact assessment and prediction into the future. This will involve, among others, to find out the impact of pumping on the hydraulic head at the coastline of Dar es Salaam Region.
6. Acknowledgements
The authors thank BTC (Belgian Technical Cooperation) for granting a PhD scholarship to the first author. The authors are grateful to M. Polemio, an anonymous reviewer and the editor, J-C Duchesne, for their valuable comments and excellent review processes, which greatly contributed to improving the manuscript.
7. ReferencesAlexander, C.S., 1968. The marine terraces of the northeast coast of Tanganyika.
Zeitschrift fur Geomorphologie, Supplement band 7, 133-154.Baumann, E., Ball, P. & Beyene, A., 2005. Rationalization of Drilling
Operations in Tanzania. Review of the Borehole Drilling Sector in Tanzania.
Calmbach, L., 1997. AquaChem 3.6.2, Hydrogeochemical data analysis, plotting and modeling, Waterloo Hydrogeologic, Ontario, Canada.
Craig, D.S.A., 2008. The Saline Interface of Shallow Unconfined Aquifer, Rangitikei Delta. MSc thesis, Victoria University of Wellington, New Zealand.
HydroMetrics, L.L.C., 2008. Seawater Intrusion Response Plan Sea Side Basin, Monterey Country California. Prepared for Seaside Basin Watermaster. (http://www.seasidebasinwatermaster.org/Other/Final_Draft.pdf)
Mjemah, I.C., 2007. Hydrogeological and Hydrogeochemical Investigation of a Coastal aquifer in Dar es Salaam, Tanzania. PhD thesis, Ghent University, Belgium, 222 p.
Mjemah, I.C., Van Camp, M. & Walraevens, K., 2009. Groundwater exploitation and hydraulic parameter estimation for a Quaternary aquifer in Dar es Salaam Tanzania. Journal of African Earth Sciences, 55, 134-146.
Mnzava, J., 1986. The distribution, chemistry and origin of saline groundwaters in Dar es Salaam area. MSc thesis, Geology Dept, University of Dar es Salaam.
Namboothri, N., et al., 2008. Beyond the Tsunami: Coastal Sand Dunes of Tamil Nadu, India - An Overview. UNDP/UNTRS, Chennai and ATREE, Bangalore, India. 56 p.
Nkotagu, H., 1989. Geochemistry of shallow groundwater at Kigamboni peninsula along Dar es Salaam coastal strip Tanzania. Journal of African Earth Science, 9, 739-748.
Sanchez Martos, F., Pulido Bosch, A. & Calaforra, Jm., 1999. Hydrogeochemical processes in an arid region of Europe (Almeria, SE Spain). Applied Geochemistry, 14, 735-745.
Stuyfzand, P.J., 1986. A new hydrogeochemical classification of water types: principles and application to the coastal dunes aquifer system of the Netherlands. Proceedings 9th SWIM, Delft (The Netherlands), 641-656.
Thornthwaite, C.W. & Mather, J.R., 1955. The water balance. Laboratory of Climatology, No. 8, Centerton New Jersey.
URT, 2002. Population and Housing Census Report Summary.URT, 1997. Study for the Augmentation of Dar es Salaam Water Supply: Final
Report, Volume 1, Main Report. Ministry of Water.URT, 2004. Dar es Salaam City Profile.URT, 2007. Development of a Future Water Source for Dar es Salaam: Pre-
design and Environment Report, Phase 2. Ministry of Water.Un Habitat, 2009. Regional and Technical Cooperation Division, Tanzania,
Dar es Salaam City Profile.
Manuscript received 08.02.2010, accepted in revised form 28.06.2011, available on line 25.07.2011.
Figure 14. Representative VES in the study area.
Figure 13. Lithological cross-section A-A’ showing electrical conductivity and chloride concentration values decreasing from the coastline to inland. Location of the profile is shown in Fig. 12.