samknows sample size methodology … · the information contained in this document is provided for...
TRANSCRIPT

SAMKNOWS QUALITY CONTROLLED DOCUMENT.
SQ REV LANG STATUS OWNER DATED
307 003 EN FINAL NC 20150611
307 001 EN FINAL NC 20140124
REVISION HISTORY
DATED REV AUTHOR COMMENTS
20150611 003 JP Minor correction
DOCUMENT REFERENCE: SQ307-003-EN
SAMKNOWS SAMPLE SIZE METHODOLOGY
Statistical information relating to broadband download speeds
CONFIDENTIAL
June 2015

CONFIDENTIAL JUNE 2015
SamKnows | 2 of 16
Contents
1 IMPORTANT NOTICE 3
2 EXECUTIVE SUMMARY 4
3 MINIMUM SAMPLE SIZE 6 3.1 Exploration of the shape of the distribution of download speed 6 3.2 Minimum acceptable sample size 7 3.3 Methodology 7 3.4 Results 8
4 SAMPLE SIZE AND RELIABILITY 9
5 OTHER TECHNIQUES FOR SMALL SAMPLES 13
6 CONCLUSIONS 16

CONFIDENTIAL JUNE 2015
SamKnows | 3 of 16
1 Important Notice
IMPORTANT NOTICE
Limitation of Liability The information contained in this document is provided for general information purposes only. Whilst care has been taken in compiling the information herein, SamKnows does not warrant or represent that this information is free from errors or omissions. To the maximum extent permitted by law, SamKnows accepts no responsibility in respect of this document and any loss or damage suffered or incurred by a person for any reason relying on any of the information provided in this document and for acting, or failing to act, on any information contained on or referred to in this document. Copyright The material in this document is protected by Copyright. No part of the materials in this document may be reproduced for any purpose whatsoever without the written permission of SamKnows.

CONFIDENTIAL JUNE 2015
SamKnows | 4 of 16
2 Executive Summary Background to SamKnows
In 2008, SamKnows developed a prototype for measuring internet performance. The platform was initially deployed in the UK and in 2010, SamKnows extended the platform to incorporate the USA. In early 2011, the platform was further extended to include the 27 member states of the European Union and in December 2011 SamKnows launched the platform in Singapore, marking its entrance into Asia. In 2012, the SamKnows platform expanded into South America and Canada. 2014 saw an expansion into Hong Kong and the launch of mobile speed test applications in many territories across the globe. In 2015, SamKnows arrived in Brunei and Mongolia, with many more exciting new prospects on the horizon.
The SamKnows platform is acknowledged to be the most accurate way of measuring internet performance. The system is currently used in studies covering more than half the world’s internet population. Our projects span the whole of Europe, North and South America, and parts of Asia.
Today, SamKnows is the global leader in broadband performance measurement market, and the systems it developed are the standard used around the world by governments, regulators, ISPs, and the research community.
Purpose of this document
As a consequence of its projects with governments around the world, SamKnows has an extensive dataset of internet performance across many geographies, technologies, operators and service tiers. SamKnows has reviewed this dataset with a view to creating guidelines and best practices for sample plan design, in particular the requirements for minimum sample sizes.
The practical concern is to understand: the minimum number of Whiteboxes to deploy, alternative significance tests for those occasions when only small samples are available, the effect of distortion of the data on confidence intervals and the effect of the number of Whiteboxes on confidence interval estimation.
Considerations
The data tends to have an asymmetrical distribution which raises questions regarding the assumption of normality and whether a sample size is large enough to ensure reasonable results.
CONFIDENTIAL JUNE 2015
SamKnows | 5 of 16
Summary of Findings
In order to understand the minimum number of units to deploy, SamKnows examined the assumption of normality for t-tests and confidence intervals to understand the validity of the estimates. The results of the experiments show that for a sample over 45 the assumptions are not violated. This means that a sample size on n>45 generates valuable information and is recommended as a minimum sample size.
Nevertheless when it is impractical to collect data for more than 45 units, other tests can be applied to the data and with high distortion, tests based on Johnson’s modified t-test or bootstrapping are more appropriate that a Student’s confidence interval. Alternatively, to complement our study, Johnson’s modified t confidence interval can be tested on sample sizes over 13 and is relatively easy to implement for statistical analysis validation of potentially asymmetrical data sets. Moreover, the confidence interval's elasticity of samples exceeding 130 converges to an asymptotic behaviour for which the increased population sample would offer very limited contribution.

CONFIDENTIAL JUNE 2015
SamKnows | 6 of 16
3 Minimum Sample Size A few guidelines will help ISPs and regulators to decide what sample sizes they should use for reliability and validity. SamKnows undertook an empirical examination of the impact of sample size on the validity and reliability of the estimates.
In order to cover all the different distributions of ISP download speed, the first part of this investigation is an exploration of the different distributions of average download speed.
3.1 Exploration of the shape of the distribution of download speed
Different distribution shapes based on symmetry, peak and tail length are investigated and a total of 14 ISP packages are tested for asymptotically normal distribution with the aim of understanding whether the central limit theorem is applicable.
Three distributions are shown on the chart1 below for illustrative purposes.
Chart 1. Histogram of mean download speeds of the 3 main technologies used by ISP to provide broadband to customers
706050403020100
90
80
70
60
50
40
30
20
10
0
Mean Download Speed
%
cablefibrelow speed DSL
group
Chart 1. Histogram of Mean Download Speed

CONFIDENTIAL JUNE 2015
SamKnows | 7 of 16
The ISP packages’ download speed distributions are split into five distribution shapes looking at symmetry, peak and tail length.
The shapes were described as “Negative skew”, “Narrow”, “Close to normal”, “Bandwidth throttling”, and “Distribution mix” (ie: looking like two different packages merged together).
3.2 Minimum acceptable sample size
To understand the minimum sample size required to be able to compare ISP download speeds, this part of the paper investigates the validation of the assumptions required in using the t-test and the confidence interval. In the aim to understand if there is, and if so, what is the minimum acceptable sample size required.
If the download speed distribution is not normal, the mean has an unknown distribution and strictly speaking the t-test is inapplicable. However according to the central limit theorem, as the sample size increases, the distribution of the mean tends to be normal. Therefore if the sample size is big enough, the t-test and confidence interval are valid even if the download speed is not from a normal distribution.
The central limit theorem (CLT) predicts that the mean of random samples of a sufficiently large size will be approximately normally distributed regardless of the distribution of the population.
3.3 Methodology
To test the assumptions, or rather, to understand the minimum sample size required for the mean to have a normal distribution, a random sampling experiments approach is used to determine when CLT’s asymptotic theory can be applied to a sample of size n.
The process comprises of 2 steps:
1. Generate random samples of size n using a re-sampling technique.
2. Test if the normality of the mean distribution is acceptable using non-parametric testing.
We started by testing if and when the central limit theorem could be applied to the mean distribution of any ISP package - meaning that the distribution of the mean is normal. The test involved bootstrapping samples of 30, 35, 40, 45 and 50 and then testing the normality of the sample mean data. To avoid any assumptions, the distributions were tested using the Kolmogorov-Smirnov non-parametric test using straightforward normality plots.

CONFIDENTIAL JUNE 2015
SamKnows | 8 of 16
3.4 Results
We found that with a sample size of 45 or more units, we had no reason to reject normality at the 5% significance level for all ISP packages and, for many packages, 30 units were sufficient. From table 1, 9 out of the 15 tested packages do not reject normality with 30 units and all samples do not reject normality at 5% significance with sample n>45.
Table 1. Kolmogorov-Smirnov (normality) test results: for each package, 1000 bootstraps of size n were generated. A ✓ means that less than 5% of the bootstrap sample rejected the normality of the distribution at a 5% significance level.
Sample size 30 35 40 45
Canadian Cable product û û û ü Canadian Cable product ü Canadian Cable product û û ü Singapore Cable product ü
UK Cable product ü UK Fibre product ü UK Fibre product ü USA -‐ DSL product ü USA Cable product ü USA Cable product ü USA Cable product û û ü USA Cable product û û û ü USA DSL product ü USA Fibre product ü
ü No reason to reject the normality at 5% û Normality rejected at 5% level 2.
The results follow to some degree the original classification of the distribution shape. For instance, SamKnows found that of the packages which required more than 30 units to adhere to normality all have a bandwidth throttling with over 80% of the Whiteboxes units hitting that threshold . Consequently this impacts only cable technology. Across the different distribution categories, degree of skewness did not seem to have an impact, therefore those categories show similar results. In conclusion, samples of n>45 have a mean which adhere to a normal distribution and therefore the t-test and confidence interval are applicable when comparing the speed of different packages.

CONFIDENTIAL JUNE 2015
SamKnows | 9 of 16
4 Sample size and reliability
Just how large must the sample be in order to have sufficient reliability and useful results? The answer to this seems largely to be governed by this question, “what degree of accuracy is required”. The number necessary then is largely a matter for the exercise of practical judgment.
To explore sample reliability, the different ISP packages were repeatedly sampled with the aim of examining interval estimation with different sample sizes.
Increasing the sample size is of twofold significance:
- The fluctuation of the mean of the average download speed reduced as the sample size increased.
- The confidence interval decreased as the sample size increase.
The sample size is driven by the accuracy required; larger sample sizes improved the accuracy of the results. The confidence intervals for samples over 130 seem to be more accurate and more stable.
Below is a graph showing the elasticity of the confidence interval, depending on the expected standard deviation of the data.

CONFIDENTIAL JUNE 2015
SamKnows | 10 of 16
Data were analysed from different ISP packages. To explore sample reliability, the different ISP packages were repeatedly sampled with the aim of examining interval estimation with different sample sizes. Charts 2, 3 and 4 illustrate simulations from 3 different ISP packages with different variances.
The bootstrapping method to generate the bootstraps sample can be outlined as follows. Given one ISP package’s data, bootstrap resampling was used to compute samples with replacement of the same size n. Next the confidence interval was calculated using the standard method for all the samples. The operation was repeated for sample sizes n of 50 to 150.
Chart 2. Confidence interval variation using bootstraps.
For each size n, bootstraps were generated from a total sample of 349 units with an average download speed of 30.67Mbits and a standard deviation of 2.04. This standard deviation is considered “quite small” compared to the download speed.

CONFIDENTIAL JUNE 2015
SamKnows | 11 of 16
Chart 3. Confidence interval variation using bootstraps.
For each size n, bootstraps were generated from a total sample of 151 units with an average download speed 15.69Mbits and standard deviation 2.24. The standard deviation is considered as “average” compared to the download speed.
Chart 4. Confidence interval variation using bootstraps.
For each size n, bootstraps were generated from a total sample of 131 units with an average download speed of 2.33Mbits and standard deviation of 0.71. The standard deviation is considered quite large compared to the download speed.

CONFIDENTIAL JUNE 2015
SamKnows | 12 of 16
Charts 2 to 4 show the elasticity of the confidence interval under different variances and also demonstrate how the sample becomes more reliable as it increases in size. Sample sizes over 130 units overall are less sensitive to outliers and appear more reliable.
Of course , there are some fluctuations between the bootstraps samples but it is worthwhile to notice that the fluctuations of the mean decrease as the sample size increases and the confidence interval converges to a narrow range.
So the increasing of sample size is of twofold significance:
1. The fluctuation of the mean of the average download reduced as the sample size increased
2. As the sample size increased the confidence interval decrease
Stabilization of the results occurs at a sample size of around 130 units. And even with packages with a larger standard deviation compared to the mean, as illustrated by chart 4, the results show the same conclusions.
Chart 5: Confidence interval width variation using bootstraps sample
Above are the results of two other ISP packages. The charts illustrate clearly how the confidence intervals decrease as the sample size increase. The confidence interval reduced by nearly a third when the sample size increased from 40 to 150.
0.00
0.05
0.10
0.15
0.20
0.25
0.30
40 50 60 70 80 90 100 110 120 130 140 150
Width of 95% CI, Cable Package
0
0.05
0.1
0.15
0.2
0.25
0.3
0.35
0.4
0.45
0.5
40 50 60 70 80 90 100 110 120 130 140 150
Width of 95% CI, DSL Package

CONFIDENTIAL JUNE 2015
SamKnows | 13 of 16
5 Other techniques for small samples
Here are presented different techniques to generate confidence intervals using a weakening set of assumptions with regard to the distribution of the sample mean.
The presented techniques include Johnson’s confidence interval and bootstrapping.
Johnson’s confidence interval is suggested here because of its ability to compute an accurate confidence interval of the mean of an asymmetrical distribution, as it makes adjustments for skewness. Furthermore, empirical studies have shown that hypothesis tests determined by this procedure compare favourably with tests determined by other methods for samples as small as 13 drawn with distributions as asymmetrical as χ² with 2 degrees of freedom, and the t-test is a natural extension of the confidence interval.
Johnson’s confidence interval corrects the usual confidence interval based on Student’s t-test distribution by adding a term involving the third moment (skewness of the data):
t! = 𝑋 +𝜇!6𝑠!𝑁 (±)𝑡!/!,!𝑠/√𝑁
where 𝜇! is the estimated third moment, 𝑋 is the mean, N the sample, s the standard deviation and 𝑡!/!,! is obtained from the student t distribution with v=N-1
Bootstrap testing is a practical, versatile and accurate technique that leads to useful confidence interval estimation.
Unlike the other tests, this method does not make any assumptions about the distribution of the underlying population and therefore can be used across most distributions, including those unable to be tested using the other tests.
Given a sample of observations of download speeds for one specific ISP package, the method can be used in the following way. First, use bootstrap resampling to compute 5000 samples of the same size as the original sample using replacement. (Sampling with replacement allows a particular observation to appear multiple times (or no times) in the bootstrap sample.) Next compute the mean of each bootstrap sample. Finally use the corresponding 2.5th and 97.5th percentiles of the bootstrap distribution to estimate the confidence interval. This method also has the advantage over the earlier approaches that it allows the investigation of the width of the confidence interval.
CONFIDENTIAL JUNE 2015
SamKnows | 14 of 16
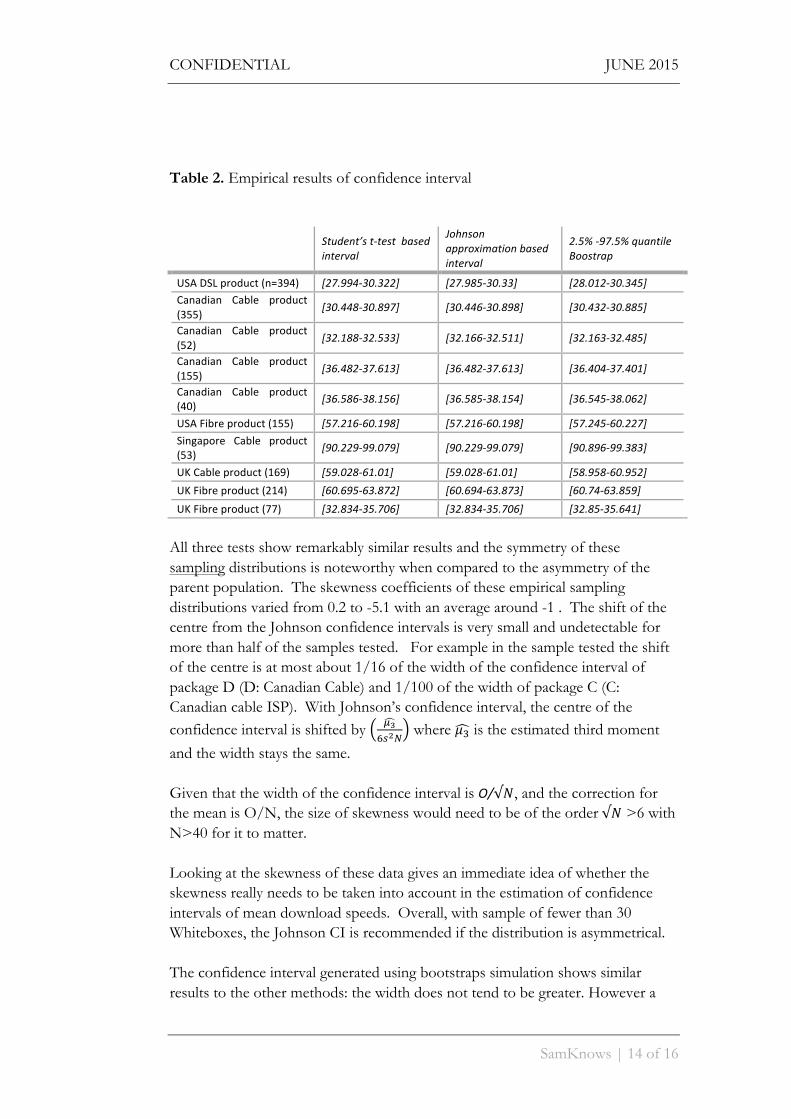
Table 2. Empirical results of confidence interval
Student’s t-‐test based interval
Johnson approximation based interval
2.5% -‐97.5% quantile Boostrap
USA DSL product (n=394) [27.994-‐30.322] [27.985-‐30.33] [28.012-‐30.345] Canadian Cable product (355) [30.448-‐30.897] [30.446-‐30.898] [30.432-‐30.885]
Canadian Cable product (52) [32.188-‐32.533] [32.166-‐32.511] [32.163-‐32.485]
Canadian Cable product (155) [36.482-‐37.613] [36.482-‐37.613] [36.404-‐37.401]
Canadian Cable product (40) [36.586-‐38.156] [36.585-‐38.154] [36.545-‐38.062]
USA Fibre product (155) [57.216-‐60.198] [57.216-‐60.198] [57.245-‐60.227] Singapore Cable product (53) [90.229-‐99.079] [90.229-‐99.079] [90.896-‐99.383]
UK Cable product (169) [59.028-‐61.01] [59.028-‐61.01] [58.958-‐60.952] UK Fibre product (214) [60.695-‐63.872] [60.694-‐63.873] [60.74-‐63.859] UK Fibre product (77) [32.834-‐35.706] [32.834-‐35.706] [32.85-‐35.641]
All three tests show remarkably similar results and the symmetry of these sampling distributions is noteworthy when compared to the asymmetry of the parent population. The skewness coefficients of these empirical sampling distributions varied from 0.2 to -5.1 with an average around -1 . The shift of the centre from the Johnson confidence intervals is very small and undetectable for more than half of the samples tested. For example in the sample tested the shift of the centre is at most about 1/16 of the width of the confidence interval of package D (D: Canadian Cable) and 1/100 of the width of package C (C: Canadian cable ISP). With Johnson’s confidence interval, the centre of the confidence interval is shifted by !!
!!!! where 𝜇! is the estimated third moment
and the width stays the same. Given that the width of the confidence interval is O/√𝑁, and the correction for the mean is O/N, the size of skewness would need to be of the order √𝑁 >6 with N>40 for it to matter. Looking at the skewness of these data gives an immediate idea of whether the skewness really needs to be taken into account in the estimation of confidence intervals of mean download speeds. Overall, with sample of fewer than 30 Whiteboxes, the Johnson CI is recommended if the distribution is asymmetrical. The confidence interval generated using bootstraps simulation shows similar results to the other methods: the width does not tend to be greater. However a

CONFIDENTIAL JUNE 2015
SamKnows | 15 of 16
disadvantage of this technique is that the confidence test is not necessarily easy to set up for this computer-intensive method. Overall there is no real advantage in using any particular technique, with sample size over 40 or 45. These results support the initial findings that there is no reason to reject the normality of the sample mean download speed distribution with sample size over 40 or 45 units. It is worth noting that even if this paper presents methods to analyse small sample sizes like Johnson’s and the bootstrap confidence interval, small samples are not always highly accurate and therefore larger sample sizes will produce smaller and more consistent confidence intervals. These tests allow sample sizes to be calculated that will yield specific confidence intervals if required. In addition, more care needs to be taken with sample selection when small sample sizes are used.

CONFIDENTIAL JUNE 2015
SamKnows | 16 of 16
6 Conclusions
For sample sizes over 45, standard confidence intervals, Johnson and bootstrap confidence interval perform equivalently and are indistinguishable in terms of accuracy and stability. Thus the choice between these methods should be governed by the feasibility of their implementation. For smaller samples, with high skewness, Johnson’s modified t confidence interval or bootstrapping is more appropriate than a Student’s confidence interval. Johnson’s modified t confidence interval can be tested on sample size over 13 and is relatively easy to implement. The information contained here can be used as guidelines for selecting appropriate procedures for testing mean download speeds, provides an indication of the minimum number of Whiteboxes to deploy to ensure asymptotic normality, and offers an approach that can be used to identify the optimal number of Whiteboxes to ensure a required level of reliability. In conclusion, we have found that a sample size of 40 to 45 Whiteboxes (or greater) provides an acceptable level of sampling reliability, can be considered asymptotically normally distributed, and will be robust for statistical analysis.
[DOCUMENT ENDS]