sample costs to produce fresh market …coststudyfiles.ucdavis.edu/.../tomatofrmktsj07.pdfsample...
TRANSCRIPT

TM-SJ-07
UNIVERSITY OF CALIFORNIA COOPERATIVE EXTENSION
2007
SAMPLE COSTS TO PRODUCE
FRESH MARKET
TOMATOES
SAN JOAQUIN VALLEY Furrow Irrigated
C. Scott Stoddard UCCE Farm Advisor, Merced County Michelle LeStrange UCCE Farm Advisor, Tulare & Kings Counties Brenna Aegerter UCCE Farm Advisor, San Joaquin County. Karen M. Klonsky UC Cooperative Extension Specialist, Department of Agricultural and Resource Economics, UC Davis Richard L. De Moura UC Cooperative Extension Staff Research Associate, Department of Agricultural and Resource Economics, UC Davis

2007 Tomatoes Costs and Returns Study (Fresh Market) San Joaquin Valley UC Cooperative Extension 2
UNIVERSITY OF CALIFORNIA COOPERATIVE EXTENSION
SAMPLE COSTS TO PRODUCE FRESH MARKET TOMATOES San Joaquin Valley - 2007
CONTENTS
INTRODUCTION................................................................................................................................ 2 ASSUMPTIONS .................................................................................................................................. 3 Cultural Practices and Material Inputs................................................................................................ 3 Labor, Interest & Equipment Costs .................................................................................................... 6 Cash Overhead................................................................................................................................... 6 Non-Cash Overhead........................................................................................................................... 7 REFERENCES..................................................................................................................................... 9 Table 1. Costs Per Acre to Produce Fresh Market Tomatoes .............................................................. 10 Table 2. Costs and Returns Per Acre To Produce Fresh Market Tomatoes ......................................... 12 Table 3. Monthly Cash Costs Per Acre To Produce Fresh Market Tomatoes ...................................... 14 Table 4. Ranging Analysis ................................................................................................................. 16 Table 5. Whole Farm Annual Equipment, Investment And Business Overhead Costs ........................ 18 Table 6. Hourly Equipment Costs ...................................................................................................... 19 Table 7. Operations with Equipment and Materials ............................................................................ 20 Sample costs to produce fresh market tomatoes in the San Joaquin Valley are presented in this study. This study is intended as a guide only, and can be used to make production decisions, determine potential returns, prepare budgets and evaluate production loans. Practices described are based on those production practices considered typical for the crop and area, but will not apply to every farm. Sample costs for labor, materials, equipment and custom services are based on current figures. A blank column, “Your Costs”, in Tables 1 and 2 is provided to enter your farming costs. The hypothetical farm operation, production practices, overhead, and calculations are described under the assumptions. For additional information or an explanation of the calculations used in the study call the Department of Agricultural and Resource Economics, University of California, Davis, (530) 752-3589 or your local UC Cooperative Extension office. Sample Cost of Production Studies are available for many commodities. All current and some archived studies can be downloaded from the Agricultural and Resource Economics website at UC Davis http://coststudies.ucdavis.edu. These studies as well as other archived studies not on the website can be requested through the department by calling (530) 752-1517.
The University of California is an affirmative action/equal opportunity employer
The University of California and the United States Department of Agriculture cooperating.

2007 Tomatoes Costs and Returns Study (Fresh Market) San Joaquin Valley UC Cooperative Extension 3
ASSUMPTIONS The following assumptions refer to Tables 1 to 7 and pertain to sample costs to produce fresh market tomatoes in the San Joaquin Valley. The cultural practices described represent production operations and materials considered typical for a well managed farm in the region. Costs, materials, and practices in this study will not apply to all farms. Timing and types of cultural practices will vary among growers within the region and from season to season due to variables such as weather, soil, insect and disease pressure. This cost study is intended as a guide only. For more information on California fresh market tomato production visit the UC Vegetable Research and Information Center website at www.vric.ucdavis.edu. The use of trade names and cultural practices in this report does not constitute an endorsement or recommendation by the University of California nor is any criticism implied by omission of other similar products or cultural practices. Farm. The cost study is based on a hypothetical non-contiguous 1,200 acre farm of which 150 rented acres are planted to fresh market tomatoes. Other crops grown on the farm are almonds and crops in rotation with tomatoes may include small grains, cotton, corn, cantaloupes, peppers, green and dry beans. The rented land includes developed wells and irrigation system. All costs for the land and the irrigation system including property taxes are incurred by the landowner.
Cultural Practices and Material Inputs Land Preparation. Primary tillage is done in the fall (November in this study) preceding planting. Tillage operations consist of disking twice, chiseling twice, triplaning twice, spreading a soil amendment, disking, listing beds, shaping beds and applying herbicide. When an operation is done twice, it is usually in two different directions. The crop year in this study begins with land preparation in November and continues through harvest. Planting. No specific fresh market variety is planted in this study, except that the data is based on early to midseason plantings and harvest. Beds on five-foot centers are made in the fall with a three-row lister and shaped with a bed-shaper. In the spring, the beds are cultivated with a rolling cultivator to mulch the surface. The seedlings (transplants) are grown by a commercial greenhouse from seed supplied by the grower. The cost for both the seed and seedlings are included in the planting costs. Seedlings (transplants) are planted from mid-February through July using a three-row transplanter. A mid-April planting date is used in this report. The plants are spaced 16 inches apart in a single row on 60 inch beds, for a total of 6,550 plants per acre. The planting crew uses one tractor driver, six persons on the transplanter, one water truck driver, and one additional person for miscellaneous work. Nutrition. In the fall during land preparation, one to two tons of gypsum or lime is applied to the field. Two tons of gypsum are applied in this study. Nitrogen (N), phosphorus (as P2O5) and potassium (as K2O) plus zinc are supplied from a complete liquid fertilizer blend, 8-8-8, preplant incorporated at 1,000 pounds per acre into the bed below the planting line. Fertilizer as 10-34-0 at 3.5 gallons (41.3 pounds) per acre, zinc at 0.50 gallon and humic acid at 1 gallon per acre are added to the transplant water for a total of 5 gallons of material. Seventy pounds of N as UN-32 are sidedressed in May. Ten pounds of N per acre from CAN17 are applied in the irrigation water (water-run N) in June, giving a total of 164 pounds of N for the season from all nitrogen fertilizers applied.
Fertilizer Analysis. Soil samples are taken in the fall prior to land preparation and tissue samples are taken once in early June by the PCA or as a custom service by a commercial lab. For each collection, one sample per 20 acres is taken. Costs shown are for the lab analysis ($2) and for collection by the PCA ($2).

2007 Tomatoes Costs and Returns Study (Fresh Market) San Joaquin Valley UC Cooperative Extension 4
Irrigation. Furrow irrigation using siphon tubes are used for this study. The irrigation water is supplied by the local irrigation district at $40 per acre foot ($3.33 per acre inch) plus $20 per acre stand-by charge and other administrative costs (paid by landlord). The first irrigation occurs in April shortly after planting, followed by subsequent irrigations at 8 to 12 day intervals depending on the weather in May, June and early July. A total of 36 acre-inches are applied to the crop. Pest Management. The pesticides and rates mentioned in this cost study are listed in Integrated Pest Management for Tomatoes and UC Pest Management Guidelines, Tomato. For more information on pest identification, monitoring, and management visit the UC IPM website at www.ipm.ucdavis.edu. For information and pesticide use permits, contact the local county Agricultural Commissioner's office. Adjuvants or surfactants may be recommended for use with some pesticides, but are not included in this study. Pesticide costs vary by location and grower volume. Pesticide costs in this study are taken from a single dealer and shown as full retail. All tomato fields will experience some pest incidence, but the specific pests and management will vary between fields due to planting date, location, microclimate, and pest pressure. Integrated pest management is used to control weeds, insects, diseases, and related pests. Controls in this study are based on early to midseason plantings. Pest Control Adviser (PCA). The PCA or crop consultant monitors the field for agronomic problems including pests and nutrition and writes pesticide recommendations. Growers may hire private PCAs or receive the service as part of a service agreement with an agricultural chemical and fertilizer company. An independent PCA is assumed for this study, with a seasonal rate of $20 per acre plus additional charges for collecting soil and tissue samples. Weeds. The most troublesome weeds in tomatoes are field bindweed, nightshade, nutsedge, purslane, and occasionally dodder. Treflan is applied to the beds in the fall during listing and Roundup is applied to the fallow beds in March. Prior to transplanting in the spring, Treflan and Dual are applied and incorporated into the beds. Dual is also applied at layby in June. Weed control also includes hand hoeing prior to layby (June) and three mechanical cultivations – one in April prior to planting to breakup the surface and two after planting (May, June). Insects. General foliage and fruit feeders are tomato fruitworms, various armyworms, leafminers, russet mites, stink bugs, thrips, and potato aphids. Beet leafhoppers and pinworms are an occasional problem. In this study beet leafhoppers (Circulifer tenellus) and thrips (various species), consperse stink bug (Euschistis conspersus), russet mite (Aculops lycopersici), and armyworm (Spodoptera spp.) are the target pests. The insects and mites are controlled with three ground applications of insecticides. The first application is at or within a few weeks of planting (April); the second is 4-5 weeks after planting (May); and the third is at layby in June. The first application is a transplant water drench or sidedress of Admire Pro for thrips and leafhoppers. The russet mites, stinkbugs, and worms are managed with two tank mix applications. The first application contains Kelthane for russet mite and Asana for stink bug. The second application contains Asana, Agri-Mek, and Avaunt for stinkbug, russet mite and armyworms. Disease. Although there are many diseases affecting tomatoes, incidence is usually patchy and left untreated. However, early to midseason plantings may require copper protectant applications for bacterial speck or fungicide protection from late blight, while mid to late season plantings may require fungicide applications to prevent or minimize damage from powdery mildew, late blight, and black mold. Bacterial speck (Pseudomonas syringae pv. tomato) in this study is prevented with two ground applications of Kocide (copper)

2007 Tomatoes Costs and Returns Study (Fresh Market) San Joaquin Valley UC Cooperative Extension 5
and Dithane fungicide in late April and early May. Tomato spotted wilt, a viral disease transmitted by thrips, has been increasing in tomatoes in the San Joaquin Valley and for that reason thrips control is included under insect management costs. Harvest. The tomato crop is hand harvested 80 to 110 days after transplanting (mid to late July in this study) by contract labor. Tomatoes are picked and hauled from the field to the packing shed. A tractor pulls a flatbed trailer with a gondola through the field, one trailer per 35 to 40 persons picking crew, one-half the crew working on each side of the trailer. Each picker has two 5-gallon buckets holding about 35 pounds of fruit. The picker takes about 2 to 2.5 minutes to fill two buckets, go to the trailer, hand buckets to dumper, record dump with checker and return to picking. One dumper is on each side of the trailer to dump the buckets and one checker stands at the end of the trailer to record picker’s dumps. Custom harvesting of the tomatoes costs $62 per gross ton plus $12 per gross ton to haul the tomatoes to the packing shed for a total of $74 per gross ton.
Yields. Gross crop yields range from 12 to 25 tons per acre in the San Joaquin Valley. The average packout rate ranges from 60-75 percent, netting 8-18 tons per acre of marketable fruit. In general early to mid-season tomatoes (transplanted February – May) have higher yields than late season tomatoes (June – July transplant dates). This study assumes a gross yield of 18 tons and a packout rate of 72% netting 13 tons or 1,040 packed 25 pound boxes. The $74 picking and hauling cost per gross ton equates to $1.28 per packed box.
Packing. Packing fees vary between sheds and include the costs of packing labor, packaging materials such as cartons and pallets, selling fees, and miscellaneous costs. This study uses a packing fee of $2.50 per 25 pound box. The total harvest and packing cost is $3.78 per packed box.
Returns. Growers may produce some tomatoes under contract, but most are sold on the open market and prices will vary. Differences in fresh market tomato prices and yields can be substantial over the season. Average prices for San Joaquin Valley growers for 2002 to 2006 (County Ag Commissioner Reports) are $6.38 per box ranging from $4.85 to $7.69. Due to the market fluctuation of prices received by growers, an assumed return price rounded to $6.50 per box is used in this study based on the 2005 to 2006 average. Table 4, Ranging Analysis, shows the net returns above operating costs, cash costs and total costs for various price and yield levels.
Assessments. Tomato growers are assessed a fee for the Curly Top Virus Control Program (CTVCP)
administered by the California Department of Food and Agriculture (CDFA). Growers in District II pay $0.127 per net ton. District II includes San Joaquin Valley counties from Merced to Kern. Field Cleanup. After harvest, the crop residue is mulched with a flail-type mower, then disked in two passes with a stubble disk. Truck/Pickup. General pickup use is listed as a separate line item. A water truck is used during the season to water the roads usually daily and twice a day during the harvest season. The mileage and times are estimated and not taken from any specific data.
Labor, Equipment, and Interest Costs
Labor. Labor rates of $13.50 per hour for machine operators and $10.80 for general labor includes payroll overhead of 35%. The basic hourly wages are $10.00 for machine operators and $8.00 for general labor. The overhead includes the employers’ share of federal and California state payroll taxes, workers' compensation insurance for truck crops (code 0172), and a percentage for other possible benefits. Workers’ compensation

2007 Tomatoes Costs and Returns Study (Fresh Market) San Joaquin Valley UC Cooperative Extension 6
costs will vary among growers, but for this study the cost is based upon the average industry final rate as of January 1, 2007 (personal email from California Department of Insurance, May 18, 2007, unreferenced). Labor for operations involving machinery are 20% higher than the operation time given in Table 1 to account for the extra labor involved in equipment set up, moving, maintenance, work breaks, and field repair. Equipment Operating Costs. Repair costs are based on purchase price, annual hours of use, total hours of life, and repair coefficients formulated by American Society of Agricultural Engineers (ASAE). Fuel and lubrication costs are also determined by ASAE equations based on maximum power takeoff (PTO) horsepower, and fuel type. Prices for on-farm delivery of diesel and gasoline are $2.30 and $2.80 per gallon, respectively. Fuel costs are derived from American Automobile Association (AAA) and Energy Information Administration 2006 monthly data. The cost includes a 2% local sales tax on diesel fuel and 8% sales tax on gasoline. Gasoline also includes federal and state excise tax, which are refundable for on-farm use when filing your income tax. The fuel, lube, and repair cost per acre for each operation in Table 1 are determined by multiplying the total hourly operating cost in Table 6 for each piece of equipment used for the selected operation by the hours per acre. Tractor time is 10% higher than implement time for a given operation to account for setup, travel and down time. Interest on Operating Capital. Interest on operating capital is based on cash operating costs and is calculated monthly until harvest at a nominal rate of 10.00% per year. A nominal interest rate is the typical market cost of borrowed funds. The interest cost of post harvest operations is discounted back to the last harvest month using a negative interest charge. The rate will vary depending upon various factors, but the rate in this study is considered a typical lending rate by a farm lending agency as of January 2007. Risk. Perishability of fresh vegetables diminishes the opportunity to wait for a better market and price. Because of the risk involved, access to a market is crucial. A market channel should be determined before any tomato production begins. Fresh market vegetables are a high risk enterprise because the market for fresh vegetables is volatile for both price and quantity. Risk is caused by uncontrollable factors such as a decrease in the demand, an oversupply, weather causing planting and harvesting delays, and diseases and insects which may lower quality.
Cash Overhead
Cash overhead consists of various cash expenses paid out during the year that are assigned to the whole farm and not to a particular operation. These costs include property taxes, interest on operating capital, office expense, liability and property insurance, and investment repairs. Property Taxes. Counties charge a base property tax rate of 1% on the assessed value of the property. In some counties special assessment districts exist and charge additional taxes on property including equipment, buildings, and improvements. For this study, county taxes are calculated as 1% of the average value of the property. Average value equals new cost plus salvage value divided by two on a per acre basis. Insurance. Insurance for farm investments vary depending on the assets included and the amount of coverage. Property insurance provides coverage for property loss and is charged at 0.714% of the average value of the assets over their useful life. Liability insurance covers accidents on the farm and costs $1,296 for the entire farm.

2007 Tomatoes Costs and Returns Study (Fresh Market) San Joaquin Valley UC Cooperative Extension 7
Office Expense. Office and business expenses are estimated at $75 per acre. These expenses include office supplies, telephones, bookkeeping, accounting, and legal fees for whole farm. The cost is a general estimate and not based on any actual data. Land Rent. Land rents for the eight counties in the San Joaquin Valley depend on the irrigation district (2007 Trends and Leases) and ranged from $100 to $350 per acre. Land rents according to growers in the area ranged from $225 to $250 per acre. For this study, $250 is the rental value and the landowner pays the basic monthly water service charge (standby and administrative charges) and the grower pays the cost for the water used. Sanitation Rental. The cost includes double unit toilets with washbasins, delivered and serviced weekly. The double toilets with hand washing facilities are rented for five months of weekly service beginning in mid March. The number of toilets required depends upon crew size. Environmental Fees. Growers are assessed various fees by government agencies to protect the environment. Examples of some fees are water quality, air quality, pesticide permits, etc. Some are charged per farm or grower and some by the acre. For example an air quality permit costs $75 to $150 per grower, whereas growers must belong to a water coalition for surface water monitoring that cost $5 per acre. For this study a fee is estimated based on some available data as reported by the growers plus some charges not currently known.
Non-Cash Overhead Non-cash overhead is calculated as the capital recovery cost for equipment and other farm investments. Capital Recovery Costs. Capital recovery cost is the annual depreciation and interest costs for a capital investment. It is the amount of money required each year to recover the difference between the purchase price and salvage value (unrecovered capital). It is equivalent to the annual payment on a loan for the investment with the down payment equal to the discounted salvage value. This is a more complex method of calculating ownership costs than straight-line depreciation and opportunity costs, but more accurately represents the annual costs of ownership because it takes the time value of money into account (Boehlje and Eidman). The formula for the calculation of the annual capital recovery costs is ((Purchase Price – Salvage Value) x Capital Recovery Factor) + (Salvage Value x Interest Rate). Salvage Value. Salvage value is an estimate of the remaining value of an investment at the end of its useful life. For farm machinery (tractors and implements) the remaining value is a percentage of the new cost of the investment (Boehlje and Eidman). The percent remaining value is calculated from equations developed by the American Society of Agricultural Engineers (ASAE) based on equipment type and years of life. The life in years is estimated by dividing the wearout life, as given by ASAE by the annual hours of use in this operation. For other investments including irrigation systems, buildings, and miscellaneous equipment, the value at the end of its useful life is zero. The salvage value for land is the purchase price because land does not depreciate. The purchase price and salvage value for equipment and investments are shown in Table 5. Capital Recovery Factor. Capital recovery factor is the amortization factor or annual payment whose present value at compound interest is 1. The amortization factor is a table value that corresponds to the interest rate used and the life of the machine. Interest Rate. An interest rate of 7.25% is used to calculate capital recovery. The rate will vary depending upon loan amount and other lending agency conditions, but is the basic suggested rate by a farm lending agency as of January 2007.

2007 Tomatoes Costs and Returns Study (Fresh Market) San Joaquin Valley UC Cooperative Extension 8
Building. The metal building(s) are on a cement slab and total approximately 2,400 square feet. The buildings are used for shops and equipment storage. Fuel Tanks. Two 350 gallon fuel tanks are on metal stands in cement containment meeting federal and state regulations. Shop/Field Tools. Includes shop equipment and tools and small tools and/or small hand equipment used in the field. Siphon Tubes. The grower owns 300 two-inch siphon tubes used mainly on the tomatoes. Equipment. Farm equipment is purchased new or used, but the study shows the current purchase price for new equipment. The new purchase price is adjusted to 60% to indicate a mix of new and used equipment. Annual ownership costs for equipment and other investments are shown in Table 6. Equipment costs are composed of three parts: non-cash overhead, cash overhead, and operating costs. Both of the overhead factors have been discussed in previous sections. The operating costs consist of repairs, fuel, and lubrication and are discussed under operating costs. Table Values. Due to rounding, the totals may be slightly different from the sum of the components.

2007 Tomatoes Costs and Returns Study (Fresh Market) San Joaquin Valley UC Cooperative Extension 9
REFERENCES
Agricultural Commissioner’s Office. 2002, 2003, 2004, 2005, 2006, Annual Crop Reports. Merced County. Merced, CA; San Joaquin County, Stockton, CA; Stanislaus County, Modesto, CA; Tulare County, Tulare, CA; Madera County, Madera, CA; Fresno County, Fresno, CA.
American Automobile Association. 2007. Gas Price Survey 2006. AAA Public Affairs, San Francisco, American Society of Agricultural Engineers. (ASAE). 1992. American Society of Agricultural Engineers
Standards Yearbook. St. Joseph, MO. Boehlje, Michael D., and Vernon R. Eidman. 1984. Farm Management. John Wiley and Sons. New York, NY. Doanes Editors. Facts and Figures for Farmers. 1977. Doane Publishing, St. Louis, MO. P 292. California Chapter of the American Society of Farm Managers and Rural Appraisers. 2007. Trends in
Agricultural Land and Lease Values. California Chapter of the American Society of Farm Managers and Rural Appraisers, Inc. Woodbridge, CA.
California State Board of equalization. Fuel Tax Division Tax Rates. Internet accessed January 2007.
http://www.boe.ca.gov/sptaxprog/spftdrates.htm Energy Information Administration. 2006. Weekly Retail on Highway Diesel Prices. Internet accessed January
2007. http://tonto.eix.doe.gov/oog/info/wohdp Le Strange, Michelle, Wayne L. Schrader, and Timothy K. Hartz. 2000. Fresh Market Tomato Production in
California. University of California, Division of Agriculture and Natural Resources. Oakland, CA. Publication 8017.
Le Strange, Michelle, Bill L. Weir, Jesus G. Valencia, Karen M. Klonsky, Richard L. De Moura, and Scott
Stoddard. 2000. Sample Costs to Produce Fresh Market Tomatoes. University of California Cooperative Extension, Department of Agricultural and Resource Economics, Davis, CA.
Miyao, Gene, Karen Klonsky, and Pete Livingston. 2007. Sample Costs to Produce Processing Tomatoes in
Yolo County. University of California, Cooperative Extension. Department of Agricultural and Resource Economics. Davis, CA.
University of California Statewide Integrated Pest Management Program. UC Pest Management Guidelines,
Tomatoes. 2006. University of California, Davis, CA. http://www.ipm.ucdavis.edu

2007 Tomatoes Costs and Returns Study (Fresh Market) San Joaquin Valley UC Cooperative Extension 10
UC COOPERATIVE EXTENSION Table 1. COSTS PER ACRE TO PRODUCE FRESH MARKET TOMATOES
SAN JOAQUIN VALLEY – 2007 Operation Cash and Labor Costs per Acre Time Labor Fuel, Lube Material Custom/ Total Your Operation (Hrs/A) Cost & Repairs Cost Rent Cost Cost Cultural: Nutrition: Soil Sampling (PCA, analysis) 0.00 0 0 0 4 4 Land Prep: Stubble Disk 2X 0.30 5 12 0 0 17 Land Prep: Chisel 2X 0.60 10 25 0 0 34 Land Prep: Triplane 2X 0.24 4 10 0 0 14 Nutrition: Soil Amendments (gypsum) 0.22 4 6 84 0 94 Land Prep: Disk 0.10 2 4 0 0 6 Land Prep/Weed: List Beds/Spray Treflan 0.20 3 8 3 0 14 Land Prep: Shape Beds/Incorporate Treflan 0.25 4 10 0 0 14 Weed: Spray Beds (Roundup) 0.10 2 3 24 0 29 Weed: Cultivate (break up surface) 0.14 2 2 0 0 5 Nutrition: Shank Fertilizer (8-8-8+Zn) 0.22 4 7 70 0 80 Weed: Spray & Incorporate herbicide (Treflan, Dual) 0.25 4 8 23 0 36 Plant: Transplant. Fertilize (10-34-0+Zn+Humic). Insect: Thrips, Leafhoppers (Admire) 0.33 38 9 464 0 511 Irrigate: Make Ditches 0.06 1 2 0 0 3 Irrigate: (water & labor) 3.50 38 0 120 0 158 Disease: Speck (Kocide, Dithane) 2X 0.20 3 6 26 0 35 Irrigate: Close Ditch & Drag 0.06 1 2 0 0 3 Weed: Cultivate 0.55 9 10 0 0 19 Weed: Hand Hoe 0.00 0 0 0 70 70 Insect: Stinkbug, Mites (Asana, Kelthane) 0.10 2 3 16 0 20 Nutrition: Fertilize Sidedress (UN32) 0.22 4 7 32 0 43 Nutrition: Tissue (leaf) Sampling 0.00 0 0 0 4 4 Insect: Stinkbug, Mites, Worms (Asana AgriMek Avaunt) 0.10 2 3 127 0 132 Weed: Layby (Dual) 0.14 2 3 20 0 25 Nutrition: Fertilize Waterrun (CAN 17) 0.00 0 0 8 0 8 Pest Control Adviser 0.00 0 0 0 20 20 Water Truck 0.08 1 1 0 0 2 Pickup 0.83 14 8 0 0 22 Clean Up: Mow/Shred plants (post harvest) 0.14 2 5 0 0 7 Clean Up: Disk crop residue (post harvest) 0.29 5 11 0 0 16 TOTAL CULTURAL COSTS 9.25 163 164 1,017 98 1,443 Harvest: Field Pick 0.00 0 0 0 1,116 1,116 Haul To Shed 0.00 0 0 0 216 216 Box, Pack & Sell 0.00 0 0 0 2,600 2,600 Assessment: 0.00 0 0 2 0 2 TOTAL HARVEST COSTS 0.00 0 0 2 3,932 3,934 Interest on operating capital @ 10.00% 82 TOTAL OPERATING COSTS/ACRE 163 164 1,019 4,030 5,458

2007 Tomatoes Costs and Returns Study (Fresh Market) San Joaquin Valley UC Cooperative Extension 11
UC COOPERATIVE EXTENSION
Table 1. Continued SAN JOAQUIN VALLEY –2007
Operation Cash and Labor Costs per Acre Time Labor Fuel, Lube Material Custom/ Total Your Operation (Hrs/A) Cost & Repairs Cost Rent Cost Cost CASH OVERHEAD: Liability Insurance 1 Office Expense 75 Rent - Tomato Land 250 Sanitation (Portable Washing & Toilets) 8 Environmental Fees 10 Property Taxes 4 Property Insurance 3 Investment Repairs 2 TOTAL CASH OVERHEAD COSTS 352 TOTAL CASH COSTS/ACRE 5,810 NON-CASH OVERHEAD (Capital Recovery): Per producing Annual Costs Acre Capital Recovery Buildings, 2400 sqft 63 5 5 Tools: Shop/Field 13 1 1 Fuel Tanks 3 0 0 Siphon Tubes 28 7 7 Equipment 500 65 65 TOTAL NON-CASH OVERHEAD COSTS 605 79 79 TOTAL COSTS/ACRE 5,889 TOTAL COST/BOX 5.66
2007 Tomatoes Costs and Returns Study (Fresh Market) San Joaquin Valley UC Cooperative Extension 12
UNIVERSITY OF CALIFORNIA COOPERATIVE EXTENSION
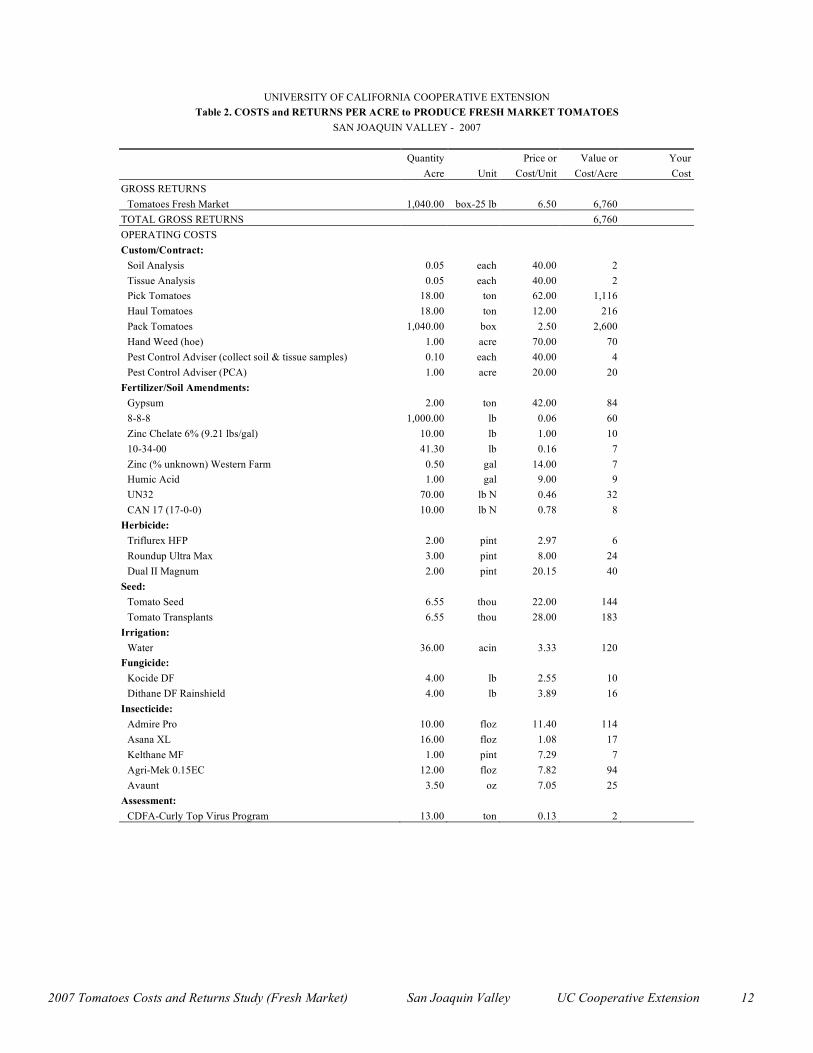
Table 2. COSTS and RETURNS PER ACRE to PRODUCE FRESH MARKET TOMATOES SAN JOAQUIN VALLEY - 2007
Quantity Price or Value or Your Acre Unit Cost/Unit Cost/Acre Cost GROSS RETURNS
Tomatoes Fresh Market 1,040.00 box-25 lb 6.50 6,760 TOTAL GROSS RETURNS 6,760 OPERATING COSTS Custom/Contract:
Soil Analysis 0.05 each 40.00 2 Tissue Analysis 0.05 each 40.00 2 Pick Tomatoes 18.00 ton 62.00 1,116 Haul Tomatoes 18.00 ton 12.00 216 Pack Tomatoes 1,040.00 box 2.50 2,600 Hand Weed (hoe) 1.00 acre 70.00 70 Pest Control Adviser (collect soil & tissue samples) 0.10 each 40.00 4 Pest Control Adviser (PCA) 1.00 acre 20.00 20
Fertilizer/Soil Amendments: Gypsum 2.00 ton 42.00 84 8-8-8 1,000.00 lb 0.06 60 Zinc Chelate 6% (9.21 lbs/gal) 10.00 lb 1.00 10 10-34-00 41.30 lb 0.16 7 Zinc (% unknown) Western Farm 0.50 gal 14.00 7 Humic Acid 1.00 gal 9.00 9 UN32 70.00 lb N 0.46 32 CAN 17 (17-0-0) 10.00 lb N 0.78 8
Herbicide: Triflurex HFP 2.00 pint 2.97 6 Roundup Ultra Max 3.00 pint 8.00 24 Dual II Magnum 2.00 pint 20.15 40
Seed: Tomato Seed 6.55 thou 22.00 144 Tomato Transplants 6.55 thou 28.00 183
Irrigation: Water 36.00 acin 3.33 120
Fungicide: Kocide DF 4.00 lb 2.55 10 Dithane DF Rainshield 4.00 lb 3.89 16
Insecticide: Admire Pro 10.00 floz 11.40 114 Asana XL 16.00 floz 1.08 17 Kelthane MF 1.00 pint 7.29 7 Agri-Mek 0.15EC 12.00 floz 7.82 94 Avaunt 3.50 oz 7.05 25
Assessment: CDFA-Curly Top Virus Program 13.00 ton 0.13 2

2007 Tomatoes Costs and Returns Study (Fresh Market) San Joaquin Valley UC Cooperative Extension 13
UNIVERSITY OF CALIFORNIA COOPERATIVE EXTENSION
Table 2. CONTINUED SAN JOAQUIN VALLEY - 2007
Quantity Price or Value or Your Acre Unit Cost/Unit Cost/Acre Cost Labor (machine) 6.90 hrs 13.50 93 Labor (non-machine) 6.50 hrs 10.80 70 Fuel - Gas 2.08 gal 2.80 6 Fuel - Diesel 45.90 gal 2.30 106 Lube 17 Machinery repair 36 Interest on operating capital @ 10.00% 82 TOTAL OPERATING COSTS/ACRE 5,458 NET RETURNS ABOVE OPERATING COSTS 1,302 CASH OVERHEAD COSTS: Liability Insurance 1 Office Expense 75 Rent - Tomato Land 250 Sanitation (Portable Washing & Toilets) 8 Environmental Fees 10 Property Taxes 4 Property Insurance 3 Investment Repairs 2 TOTAL CASH OVERHEAD COSTS/ACRE 352 TOTAL CASH COSTS/ACRE 5,810 NON-CASH OVERHEAD COSTS (Capital Recovery) Buildings, 2400 sqft 5 Tools: Shop/Field 1 Fuel Tanks 0 Siphon Tubes 7 Equipment 65 TOTAL NON-CASH OVERHEAD COSTS/ACRE 79 TOTAL COSTS/ACRE 5,889 NET RETURNS/ ACRE 871

2007 Tomatoes Costs and Returns Study (Fresh Market) San Joaquin Valley UC Cooperative Extension 14
UNIVERSITY OF CALIFORNIA COOPERATIVE EXTENSION
Table 3. MONTHLY CASH COSTS PER ACRE TO PRODUCE FRESH MARKET TOMATOES SAN JOAQUIN VALLEY –2007
Beginning NOV 06 NOV DEC JAN FEB MAR APR MAY JUN JUL AUG SEP OCT TOTAL Ending OCT 07 06 06 07 07 07 07 07 07 07 07 07 07 Cultural: Nutrition: Soil Sampling 4 4 Land Prep: Stubble Disk 2X 17 17 Land Prep: Chisel 2X 34 34 Land Prep: Triplane 2X 14 14 Nutrition: Soil Amendments (gypsum) 94 94 Land Prep: Disk 6 6 Land Prep/Weed: List Beds/Spray Treflan 14 14 Land Prep: Shape Beds/Incorporate Treflan 14 14 Weed: Spray Beds (Roundup) 29 29 Weed: Cultivate (break up surface) 5 5 Nutrition: Shank Fertilizer (8-8-8+Zn) 80 80 Weed: Spray & Incorporate herbicide (Treflan, Dual) 36 36 Plant/Nutrition: Transplant/Fertilize (10-34-0+Zn+Humic). Insect: Thrips, Leafhoppers (Admire) 511 511 Irrigate: Make Ditches 1 2 3 Irrigate: (water & labor) 23 45 68 23 158 Disease: Speck (Kocide, Dithane) 2X 17 17 35 Irrigate: Close Ditch & Drag 1 1 1 3 Weed: Cultivate 9 9 19 Weed: Hand Hoe 70 70 Insect: Stinkbug, Mites (Asana, Kelthane) 20 20 Nutrition: Fertilize Sidedress (UN32) 43 43 Nutrition: Tissue (leaf) Sampling 4 4 Insect: Stinkbug, Mites, Worms (Asana AgriMek Avaunt) 132 132 Weed: Layby (Dual) 25 25 Nutrition: Fertilize Waterrun (CAN 17) 8 8 Pest Control Adviser (PCA) 2 2 2 2 2 2 2 2 2 2 20 Water Truck 0 0 0 0 0 0 0 0 0 0 2 Pickup 2 2 2 2 2 2 2 2 2 2 22 Clean Up: Chop/Mulch plants (post harvest) 7 7 Clean Up: Disk crop residue (post harvest) 16 16 TOTAL CULTURAL COSTS 188 19 4 4 33 677 210 253 28 27 0 0 1,443

2007 Tomatoes Costs and Returns Study (Fresh Market) San Joaquin Valley UC Cooperative Extension 15
UNIVERSITY OF CALIFORNIA COOPERATIVE EXTENSION
Table 3. continued SAN JOAQUIN VALLEY – 2007
Beginning NOV 06 NOV DEC JAN FEB MAR APR MAY JUN JUL AUG SEP OCT TOTAL Ending OCT 07 06 06 07 07 07 07 07 07 07 07 07 07 Harvest: Field Pick 1,116 1,116 Haul To Shed 216 216 Box, Pack & Sell 2,600 2,600 Assessment: 2 2 TOTAL HARVEST COSTS 3,932 2 3,934 Interest on operating capital @ 10.00% 2 2 2 2 2 8 9 12 45 0 82 TOTAL OPERATING COSTS/ACRE 190 20 6 6 35 684 220 264 4,004 29 0 0 5,458 OVERHEAD: Liability Insurance 1 1 Office Expense 8 8 8 8 8 8 8 8 8 8 75 Rent - Tomato Land 250 250 Sanitation (Portable Washing & Toilets) 1 2 2 2 2 1 8 Environmental Fees 10 10 Property Taxes 2 2 4 Property Insurance 1 1 3 Investment Repairs 0 0 0 0 0 0 0 0 0 0 0 0 2 TOTAL CASH OVERHEAD COSTS 8 8 11 9 8 9 9 19 12 8 0 250 352 TOTAL CASH COSTS/ACRE 197 28 17 15 43 693 229 283 4,017 37 0 250 5,810

2007 Tomatoes Costs and Returns Study (Fresh Market) San Joaquin Valley UC Cooperative Extension 16
UNIVERSITY OF CALIFORNIA COOPERATIVE EXTENSION Table 4. RANGING ANALYSIS SAN JOAQUIN VALLEY - 2007
COSTS PER ACRE AT VARYING YIELDS TO PRODUCE FRESH MARKET TOMATOES
*YIELD (BOX/ACRE) 920 960 1,000 1,040 1,080 1,120 1,160 OPERATING COSTS/ACRE: Cultural Cost 1,443 1,443 1,443 1,443 1,443 1,443 1,443 Harvest (pick) 987 1,030 1,073 1,116 1,159 1,202 1,245 Haul 191 199 208 216 224 233 241 Pack 2,300 2,400 2,500 2,600 2,700 2,800 2,900 Assessment 1 2 2 2 2 2 2 Interest on operating capital @ 10.00% 78 79 81 82 83 84 86 TOTAL OPERATING COSTS/ACRE 5,000 5,153 5,307 5,459 5,611 5,764 5,917 TOTAL OPERATING COSTS/BOX 5.43 5.37 5.31 5.25 5.20 5.15 5.10 CASH OVERHEAD COSTS/ACRE 352 352 352 352 352 352 352 TOTAL CASH COSTS/ACRE 5,352 5,505 5,659 5,811 5,963 6,116 6,269 TOTAL CASH COSTS/BOX 5.82 5.73 5.66 5.59 5.52 5.46 5.40 NON-CASH OVERHEAD COSTS/ACRE 79 79 79 79 79 79 79 TOTAL COSTS/ACRE 5,431 5,584 5,738 5,890 6,042 6,195 6,348 TOTAL COSTS/BOX 5.90 5.82 5.74 5.66 5.59 5.53 5.47 *box = 25 lbs
NET RETURNS PER ACRE ABOVE OPERATING COSTS
Tomatoes YIELD (BOX/ACRE) $/box 920 960 1,000 1,040 1,080 1,120 1,160 4.50 -860 -833 -807 -779 -751 -724 -697 5.50 60 127 193 261 329 396 463 6.00 520 607 693 781 869 956 1,043 6.50 980 1,087 1,193 1,301 1,409 1,516 1,623 7.00 1,440 1,567 1,693 1,821 1,949 2,076 2,203 7.50 1,900 2,047 2,193 2,341 2,489 2,636 2,783 8.00 2,360 2,527 2,693 2,861 3,029 3,196 3,363
NET RETURNS PER ACRE ABOVE CASH COSTS
Tomatoes YIELD (BOX/ACRE)
$/box 920 960 1,000 1,040 1,080 1,120 1,160 4.50 -1,212 -1,185 -1,159 -1,131 -1,103 -1,076 -1,049 5.50 -292 -225 -159 -91 -23 44 111 6.00 168 255 341 429 517 604 691 6.50 628 735 841 949 1,057 1,164 1,271 7.00 1,088 1,215 1,341 1,469 1,597 1,724 1,851 7.50 1,548 1,695 1,841 1,989 2,137 2,284 2,431 8.00 2,008 2,175 2,341 2,509 2,677 2,844 3,011

2007 Tomatoes Costs and Returns Study (Fresh Market) San Joaquin Valley UC Cooperative Extension 17
UNIVERSITY OF CALIFORNIA COOPERATIVE EXTENSION
Table 4. CONTINUED SAN JOAQUIN VALLEY – 2007
NET RETURNS PER ACRE ABOVE TOTAL COSTS
Tomatoes YIELD (BOX/ACRE)
$/box 920 960 1,000 1,040 1,080 1,120 1,160 4.50 -1,291 -1,264 -1,238 -1,210 -1,182 -1,155 -1,128 5.50 -371 -304 -238 -170 -102 -35 32 6.00 89 176 262 350 438 525 612 6.50 549 656 762 870 978 1,085 1,192 7.00 1,009 1,136 1,262 1,390 1,518 1,645 1,772 7.50 1,469 1,616 1,762 1,910 2,058 2,205 2,352 8.00 1,929 2,096 2,262 2,430 2,598 2,765 2,932

2007 Tomatoes Costs and Returns Study (Fresh Market) San Joaquin Valley UC Cooperative Extension 18
UNIVERSITY OF CALIFORNIA COOPERATIVE EXTENSION
Table 5. WHOLE FARM ANNUAL EQUIPMENT, INVESTMENT, AND BUSINESS OVERHEAD COSTS SAN JOAQUIN VALLEY - 2007
Cash Overhead Yrs Salvage Capital Insur- Yr Description Price Life Value Recovery ance Taxes Total 07 130 HP 2WD Tractor 93,043 10 27,483 11,435 430 603 12,468 07 200 HP MFWD Tractor 154,000 10 45,489 18,927 712 997 20,636 07 92 HP 2WD Tractor 59,563 10 17,594 7,320 275 386 7,981 07 Bed Shaper - 3 Row 13,292 12 1,841 1,594 54 76 1,724 07 Cultivator-Rolling 3 Row 8,535 12 1,182 1,024 35 49 1,107 07 Disk - Offset 26' 25,071 12 3,472 3,007 102 143 3,252 07 Disk - Stubble 16' 13,176 12 1,825 1,581 54 75 1,709 07 Ditcher - V 8,631 12 1,195 1,035 35 49 1,120 07 Fertilizer Injector 5,091 10 900 669 21 30 720 07 Flail Shredder 15' 13,675 10 2,418 1,797 57 80 1,935 07 Incorporator - 15' 18,644 9 3,725 2,584 80 112 2,776 07 Lister - 3 Row 15' 5,500 12 762 660 22 31 713 07 Pickup 1/2 ton 28,000 5 12,549 4,703 145 203 5,051 07 Saddle Tank 300 gal #1 2,374 5 773 449 11 16 476 07 Saddle Tank 300 gal #2 2,374 5 773 449 11 16 476 07 Scraper - Drag 10' 2,581 18 172 256 10 14 280 07 Spray Boom 20' 1,424 10 252 187 6 8 201 07 Spray Boom 25' 1,781 10 315 234 7 10 252 07 Subsoiler - 8' 12,500 10 2,211 1,642 53 74 1,768 07 Transplanter 3 Row 16,200 10 2,865 2,128 68 95 2,292 07 Triplane - 16' 22,253 12 3,082 2,669 90 127 2,886 07 Truck Water (2 ton) 52,000 10 15,360 6,391 240 337 6,968 TOTAL 559,708 146,238 70,742 2,520 3,530 76,792 60% of New Cost * 335,825 87,743 42,445 1,512 2,118 46,075 *Used to reflect a mix of new and used equipment
ANNUAL INVESTMENT COSTS Cash Overhead Yrs Salvage Capital Insur- Description Price Life Value Recovery ance Taxes Repairs Total Buildings 2400 sqft 75,000 30 6,196 268 375 1,500 8,339 Fuel Tanks 2-300 gal 3,200 20 320 300 13 18 64 395 Shop/Field Tools 15,000 20 1307 1,413 58 82 350 1,902 Siphon Tubes (300) 4,200 5 1,031 15 21 84 1,151 TOTAL INVESTMENT 97,400 1,627 8,941 354 495 1,998 11,787
ANNUAL BUSINESS OVERHEAD Units/ Price/ Total Description Farm Unit Unit Cost Environmental Fees 1,200 acre 10.00 12,000 Liability Insurance 1,200 acre 1.08 1,296 Office Expense 1,200 acre 75.00 90,000 Rent - Tomato Land 150 acre 250.00 37,500 Sanitation (Toilets) 150 acre 7.50 1,125

2007 Tomatoes Costs and Returns Study (Fresh Market) San Joaquin Valley UC Cooperative Extension 19
UNIVERSITY OF CALIFORNIA COOPERATIVE EXTENSION
Table 6. HOURLY EQUIPMENT COSTS SAN JOAQUIN VALLEY – 2007
Actual Cash Overhead Operating Hours Capital Insur- Fuel & Total Total Yr Description Used Recovery ance Taxes Repairs Lube Oper. Costs/Hr. 07 130 HP 2WD Tractor 1200 5.72 0.22 0.30 4.15 19.96 24.11 30.35 07 200 HP MFWD Tractor 1600 7.10 0.27 0.37 3.93 30.70 34.63 42.37 07 92 HP 2WD Tractor 1200 3.66 0.14 0.19 2.66 11.95 14.61 18.60 07 Bed Shaper - 3 Row 166 5.76 0.20 0.27 2.62 0.00 2.62 8.85 07 Cultivator-Rolling 3 Row 166 3.70 0.13 0.18 1.69 0.00 1.69 5.70 07 Disk - Offset 26' 166 10.87 0.37 0.52 3.91 0.00 3.91 15.67 07 Disk - Stubble 16' 166 5.70 0.19 0.27 2.06 0.00 2.06 8.22 07 Ditcher - V 164 3.79 0.13 0.18 2.30 0.00 2.30 6.40 07 Fertilizer Injector 121 3.32 0.11 0.15 1.94 0.00 1.94 5.52 07 Flail Shredder 15' 200 5.40 0.17 0.24 6.40 0.00 6.40 12.21 07 Incorporator - 15' 166 9.37 0.29 0.41 5.39 0.00 5.39 15.46 07 Lister - 3 Row 15' 166 2.38 0.08 0.11 1.09 0.00 1.09 3.66 07 Pickup 1/2 ton 283 9.97 0.31 0.43 1.81 8.05 9.86 20.57 07 Saddle Tank 300 gal #1 300 0.90 0.02 0.03 0.65 0.00 0.65 1.60 07 Saddle Tank 300 gal #2 300 0.90 0.02 0.03 0.65 0.00 0.65 1.60 07 Scraper - Drag 10' 166 0.93 0.04 0.05 0.37 0.00 0.37 1.39 07 Spray Boom 20' 150 0.75 0.02 0.03 0.38 0.00 0.38 1.18 07 Spray Boom 25' 150 0.94 0.03 0.04 0.47 0.00 0.47 1.48 07 Subsoiler - 8' 200 4.93 0.16 0.22 2.80 0.00 2.80 8.11 07 Transplanter 3 Row 150 8.51 0.27 0.38 4.27 0.00 4.27 13.43 07 Triplane - 16' 250 6.40 0.22 0.30 3.33 0.00 3.33 10.25 07 Truck Water (2 ton) 200 19.15 0.72 1.01 4.93 7.93 12.86 33.74

2007 Tomatoes Costs and Returns Study (Fresh Market) San Joaquin Valley UC Cooperative Extension 20
UNIVERSITY OF CALIFORNIA COOPERATIVE EXTENSION
Table 7. OPERATIONS WITH EQUIPMENT & MATERIAL INPUTS San Joaquin Valley - 2007
Non-Mach Operation Equipment Labor Broadcast Operation Month Tractor Implement hrs/acre Material Rate/acre Unit Cultural: Nutrition: Soil Sampling Nov Contract (PCA) Soil Analysis 0.05 each Land Prep: Stubble Disk 2X Nov 200HP MFWD Stubble Disk Land Prep: Chisel/Rip 2X Nov 200HP MFWD Subsoiler Land Prep: Triplane 2X Nov 200HP MFWD Triplane Nutrition: Soil Amendment Nov 130HP 2WD Fertilizer Spreader Gypsum 2.00 ton Land Prep: Disk Nov 200HP MFWD Disk Offset 26 ft Land Prep: List Beds/Spray Herbicide Nov 200HP MFWD Lister Triflurex 1.00 pt 2-Saddle Tanks Spray Boom 20 ft Land Prep: Shape Beds/Incorporate Herbicide Nov 200HP MFWD Bed Shaper 3 Row Weed: Spray Beds Mar 130HP 2WD 2-Saddle Tanks Roundup 3.00 pt Spray Boom 25 ft Weed: Cultivate (break surface) Apr 92HP 2WD Rolling Cultivator 3 Row Nutrition: Fertilize Apr 130HP 2WD Fertilizer Injector 8-8-8 1,000.00 lb 2-Saddle Tanks Zinc 10.00 lb Weed: Spray & Incorporate Herbicide Apr 130HP 2WD Incorporator 3 Row Triflurex 1.00 pt 2-Saddle Tanks Dual 2.00 pt Plant: Transplant Seedlings/Fertilize/Insect Apr 92HP 2WD Transplanter 3 Row Seed 6.55 thou 2-Saddle Tanks Transplants 6.55 thou 10-34-00 30.00 lb Zinc 0.50 gal Humic Acid 1.00 gal Admire 10.00 floz Irrigation: Make Ditches Apr 130HP 2WD Ditcher - V June 130HP 2WD Ditcher - V June 130HP 2WD Ditcher - V Irrigation: Close Ditch May 130HP 2WD Scraper - Drag June 130HP 2WD Scraper - Drag July 130HP 2WD Scraper - Drag Irrigate Apr 0.50 Water 5.14 acin May 1.00 Water 10.28 acin June 1.50 Water 15.42 acin July 0.50 Water 5.16 acin Disease: Speck Apr 130HP 2WD 2-Saddle Tanks Kocide 2.00 lb Spray Boom 25 ft Dithane 2.00 lb May 130HP 2WD 2-Saddle Tanks Kocide 2.00 lb Spray Boom 25 ft Dithane 2.00 lb Weed: Cultivate May 92HP 2WD Rolling Cultivator 3 Row June 92HP 2WD Rolling Cultivator 3 Row Weed: Hand Hoe May Custom/Contract Insect: Stinkbug & Mites May 130HP 2WD 2-Saddle Tanks Asana 8.00 floz Spray Boom 25 ft Kelthane 1.00 pt Insect: Stinkbug, Mites, Worms June 130HP 2WD 2-Saddle Tanks Asana 8.00 floz Spray Boom 25 ft Agri-Mek 12.00 floz Avaunt 3.50 oz Nutrition: Tissue Samples June Contract (PCA) Analysis 0.05 each Weed: Layby June 92HP 2WD Rolling Cultivator Dual 1.00 pt 2-Saddle Tanks Spray Boom 20 ft Nutrition: Fertilize (sidedress) May 130HP 2WD Fertilizer Injector UN 32 70.00 lb N 2-Saddle Tanks Nutrition: Fertilize (water run) June CAN 17 10.00 lb N

2007 Tomatoes Costs and Returns Study (Fresh Market) San Joaquin Valley UC Cooperative Extension 21
UNIVERSITY OF CALIFORNIA COOPERATIVE EXTENSION
Table 7. CONTINUED San Joaquin Valley - 2007
Non-Mach Operation Equipment Labor Broadcast Operation Month Tractor Implement hrs/acre Material Rate/acre Unit Harvest: Pick July Custom/Contract 18.00 ton Harvest: Haul to Shed July Custom/Contract 18.00 ton Pack July Custom/Contract 1,040.00 box Water Roads All Water Truck Field Cleanup: Mow plants Aug 130HP 2WD Flail Shredder 15 ft Field Cleanup: Disk Crop Residue Aug 200HP MFWD Stubble Disk