sampling design of the oregon department of fish …appendix a sampling design of the oregon...
TRANSCRIPT

Appendix A
Sampling Design of the Oregon Department of Fish and
Wildlife’s Ocean Recreational Boat Survey (ORBS)
Eric Schindler, Mark Freeman, and Bryan Wright
Marine Resources Program - ODFW
March 10, 2015
Introduction
The Oregon Department of Fish and Wildlife (ODFW) annually surveys the marine
recreational fishery. The ocean boat fishery is sampled by the Ocean Recreational Boat
Survey (ORBS), and estimates of catch and effort are made for this fishery. In addition,
ORBS also samples estuary boats in the lower estuary areas where ocean sampling is
occurring. Shore based anglers and estuary boat anglers are typically sampled by the
Shore and Estuary Boat (SEB) survey in years when that survey is in operation.
This report summarizes the basic elements of the ORBS project as current in 2014. This
includes data collection, formulas used in calculations, and adjustments to the data, as
they relate to the estimation of effort and catch. Other components of ORBS including
length-weight data collection, at-sea observations, and other side projects are not detailed.
Background
Sampling and catch estimation of the ocean salmon recreational fishery on the Oregon
Coast began its development with some loosely coordinated efforts by the Oregon
Department of Fish and Wildlife in 1976. It was soon apparent that there was a need for
a more accurate and reliable program, and the salmon sampling project underwent a
series of reviews and developed into a program that could generate accurate estimates of
catch in a timely manner by the start of the 1979 ocean salmon season. Largely as a
result of the development of the Pacific Fishery Management Council and the need for
more accurate catch and effort information on the ocean harvest of coho and Chinook
salmon, the Ocean Recreational Boat Survey (ORBS) (formerly known as the Ocean
Salmon Sampling Project) formalized sampling activities and began to make weekly
catch and effort estimates for all major ports along the Oregon Coast throughout the
salmon season. The improved project also included estimates for effort and catch of non-
salmon marine species occurring during the traditional ocean salmon season time period.
At the same time that ORBS was being developed in 1979, the Marine Recreational
Finfish Statistical Survey (MRFSS) was also being put into play by the National Marine
Fisheries Service (NMFS). The MRFSS was developed to be an all-encompassing
survey of all marine recreational fisheries (excluding shellfish) including both the ocean
and the estuaries, and beach, bank, jetty, pier, and boat anglers. This survey had at its
core the goal of being able to provide a large scale view of the marine recreational
fisheries of Oregon, and was viewed as the best means of estimating non-salmon marine

2
species effort and harvest. Unfortunately, the design of MRFSS did not allow for the fine
scale of resolution by time or area needed for active fisheries management.
In 1982, an extremely strong El Niño developed in the Eastern Pacific and did not
dissipate until late in 1983. In its wake were decimated populations of salmon,
bottomfish, marine mammals, and other sea life. As a result, salmon fishing in 1984 and
1985 was sharply curtailed due to poor forecasts for salmon that occurred due to the
effects of the El Niño. Because of the poor condition of salmon stocks and the restricted
seasons, more and more charter operators and recreational anglers began to look to non-
salmon species like rockfish, lingcod, and Pacific halibut as alternatives to salmon
fishing. However, since recreational fishery sampling was scheduled to largely match the
salmon seasons, this resulted in inadequate sampling of the non-salmon species
increasingly targeted by anglers.
By the 1986 season, coho salmon, which had always been the mainstay of the Oregon
recreational ocean salmon fishery, looked to be on the rebound, with increased quotas
and fishing opportunity. Once again, the non-salmon sampling from the salmon
management program appeared to be adequate to address the needs of fishery
management. However, the resurgence of the coho was short lived and by the early
1990’s things had gone from bad to worse, with coho fishing all but eliminated by 1993.
Also by the mid-1990’s, the increase in fishing activity for Pacific halibut was resulting
in early attainment of the halibut quota, in-season closures to the fishery, and more
restrictive seasons. Halibut quota management at this time was using a catch estimate
that was not based on a statistically valid survey method. These issues underscored the
need for more consistent sampling of the recreational non-salmon fisheries.
Minor changes to ORBS had been occurring in almost all years to generate better
estimates for both salmon and non-salmon species, but a comparison of catch estimates of
lingcod from the ORBS and the Marine Recreational Finfish Statistical Survey (MRFSS)
raised concerns when the two estimates were generating substantially different estimates
of catch. This resulted in a series of meetings beginning in late 1997 between staff from
ODFW, NMFS, and the Pacific States Marine Fisheries Commission (PSFMC) to look
into the causes for the differences between the two estimates. The results of these
meetings included a three year sampling add-on to ORBS to look at over-winter fishery
activity in several major ports, the eventual disassembly of MRFSS program and its
reconstitution as the Shore and Estuary Boat Survey (SEBS) with a more limited but
focused role, and several other significant changes to ORBS to better address non-salmon
fishing activity.
Presently the ORBS project samples at the top ten to eleven ocean access points (Figure
1). There are an additional eleven access points which are estimated to account for less
than 2% of the ocean boat activity in total based on evaluations from salmon catch
records. For Nehalem and Port Orford recent MRIP funded surveys confirmed the low
level of ocean recreational activity and catch of bottomfish species. Note that many of
these minor access points are considered unsuitable for ocean access by the Oregon State
Marine Board. At the five most significant ports with recognized good non-salmon

3
fishing activity, ORBS begins sampling in early March and continues through October.
This period accounts for approximately 96% of the non-salmon fishing effort in those
ports. The remaining sampled ports typically have start up dates for sampling in the first
week of May or the third week of June, with an end to sampling in late September. This
sampling period in these ports accounts for an estimated 60%-90% of the activity
occurring in those locations. Additionally, catch and effort estimates have been made for
unsampled time periods based on either the temporal patterns observed in the previously
noted over-winter study, or on current over-winter sampling in Depoe Bay, Newport, and
Brookings by PSMFC samplers working with ODFW.
During the 2011-12 winter period, special additional sampling was funded through the
Marine Recreational Information Program (MRIP) to conduct full year sampling in all
currently sampled ports. An additional MRIP study during 2012-13, included over winter
sampling in specific ports and extended sampling in several others. The data collected
from these two studies is currently being evaluated for improving the ORBS full year
estimates for non-salmonid catches and fishing effort.
Effort is estimated by counting the number of boat trips through one of several methods.
The adopted method varies by port and boat type (charter boat or private boat), and is
selected based on available staffing, the port and fishery layout, and other logistical
considerations. For charter vessels operating out of a fixed station or office, the trip
effort is collected from the office for all days of the week; and for private boats (as well
as charter vessels operating without a fixed station or office) estimates are made using
either vessel bar crossing counts in real time by an on-site employee, a trailer and
moorage slip count with tracking of additional launches, or review of digital video
recordings made of the bar. As of the 2014 season, on-site bar crossing counts were
conducted only at the Columbia River; trailer and moorage slip counts were conducted at
Pacific City, Florence, and Bandon; and video bar crossing counts were conducted at all
remaining sampled ports.
Sampling and estimates of catch are stratified by port, week, season type, boat type, and
trip type for charters (target species group as defined in table 1); domains include private
boat trip types and area of catch (Figure 1). Location of catch for non-salmon bottomfish
species is narrowed down further to whether or not the activity took place inside or
outside of 30 fathoms of depth, and within which major reef/bottom complex area did the
catch primarily occur. Interviews are conducted on a boat level of stratification to match
with the effort counting methodology. Total catch, effort, and released fish data are
gathered from each interviewed boat.
The ORBS also gathers length and weight statistics for use in converting numbers of fish
into weight. This information is also utilized in assessing stock health. Recently, ORBS
began collecting information of the average bottom depth where bottomfish were caught.

4
A separate project, consisting of three PSMFC employees working with ODFW,
conducts at-sea observations of charter fishing activity to gather information on retained
and discarded fish (species, number per angler, average size, location of catch, depth of
water, etc.) as well as shoreside sampling to collect age structures from select non-salmon
species during the spring through fall. In the winter, these three samplers conduct ORBS
sampling in Newport, Depoe Bay, and Brookings.
The ORBS project typically utilizes 24 seasonal port samplers and two crew leaders (one
on the North Coast and one on the South Coast to collect the data needed to estimate the
effort and catch in the ocean recreational boat based fishery, and collect other fishery

5
related information. At the start of seasonal employment, each seasonal employee is
typically given a three to four day training and orientation session at the Newport office,
and new hires are given an in-port orientation to familiarize them with the port where
they will be stationed. During the peak months of the season (May through September),
all data is delivered to the Marine Resources Program headquarters in Newport on
Monday or Tuesday following the end of the prior statistical week. The data is error
checked by Newport ORBS data staff, any errors are corrected, the data is then
processed, and preliminary effort and catch estimates available by Thursday following
the end of the sampling week.
The ORBS project has never been a static program. The project continues to evolve and
make changes to sampling structure and methodology. These changes are related to
either changes in the fishery, new management needs, recognition of short falls in the
project, or improvements in efficiency. The project has gone from using paper forms
with a staff of data entry personnel, to an optically scanned form, and most recently to
handheld computers for data collection. The project has changed effort counting methods
to add to overall project efficiency and to account for late trips, and in the last three years
has transitioned most ports over to video recording equipment for improved effort counts.
The future will undoubtedly hold many more changes to the project, and the project will
continue to strive to provide the most accurate estimates of catch and effort possible to
support the fishery management process.
Methodology: Effort Estimation
Effort estimation for the ocean fishery falls to one of several different methods that are
dependent largely on the logistics of the port, and the boat type (charter, guide, or
private). Effort estimates are made individually for each port, and then summed to
estimate effort by area or for the statewide total.
Charter Vessel Effort Estimation
For charter vessels, ORBS relies on contacting each charter office to find out the number
of trips by target species for each day of the week. For those few charters who are more
transient in nature (they do not have a permanent charter office within the port) charters
trips are accounted for using the same effort methods listed below for private boats, but
they are recorded as “guides” to be able to identify the level of activity by category as
needed. These trip counts are transferred to the “Recreational Ocean Fishery Effort
Form” (Figure 2). This form is a weekly summary of all recreational ocean effort in a
port. In rare instances, individual charter offices have refused to provide the effort
information. In the event of such an occurrence, the charter effort has been estimated in
the same manner as for private boats as listed in the next sections. Also the charter effort
totals can be cross checked with the bar crossing counts to confirm that accurate
information is being provided by the charter offices.
Private Vessel Effort Estimation
For private fishing vessels and guides/charters that are not associated with a local
storefront or booking office, effort counts are made using one of three general methods:

6
real time bar crossing counts, digital video bar crossing counts, or trailer/slip counts. In
making the counts, the ORBS employees must make some judgment calls related to
whether certain boats are on commercial fishing trips, and whether sailboats or yachts are
pleasure cruising or are possibly on a fishing trip. If any potential exists that a
commercial boat, sailboat, or yacht is on a recreational fishing trip then the boat is
included in the effort count and is included in the sampling frame. Some of the smallest
commercial boats that are easily confused with recreational boats are added to a list for
boat count reference use, and local ORBS sampling staff are familiarized with those
vessels. In situations where these small commercial fishing boats cannot be separated by
the counter, they are included in the sampling frame and sampled as a private non-fishing
trip with a notation to indicate they were on a commercial trip.
Private Vessel Bar Crossing Count Method: Until 2010, this had been the primary
method for counting private ocean recreational boats. This method involves making real
time “bar crossing” counts for a set period of time. This standard method is currently
used only in ports when there is a breakdown in the video boat counting equipment. A
modified version of this counting method is used in Astoria and is described separately
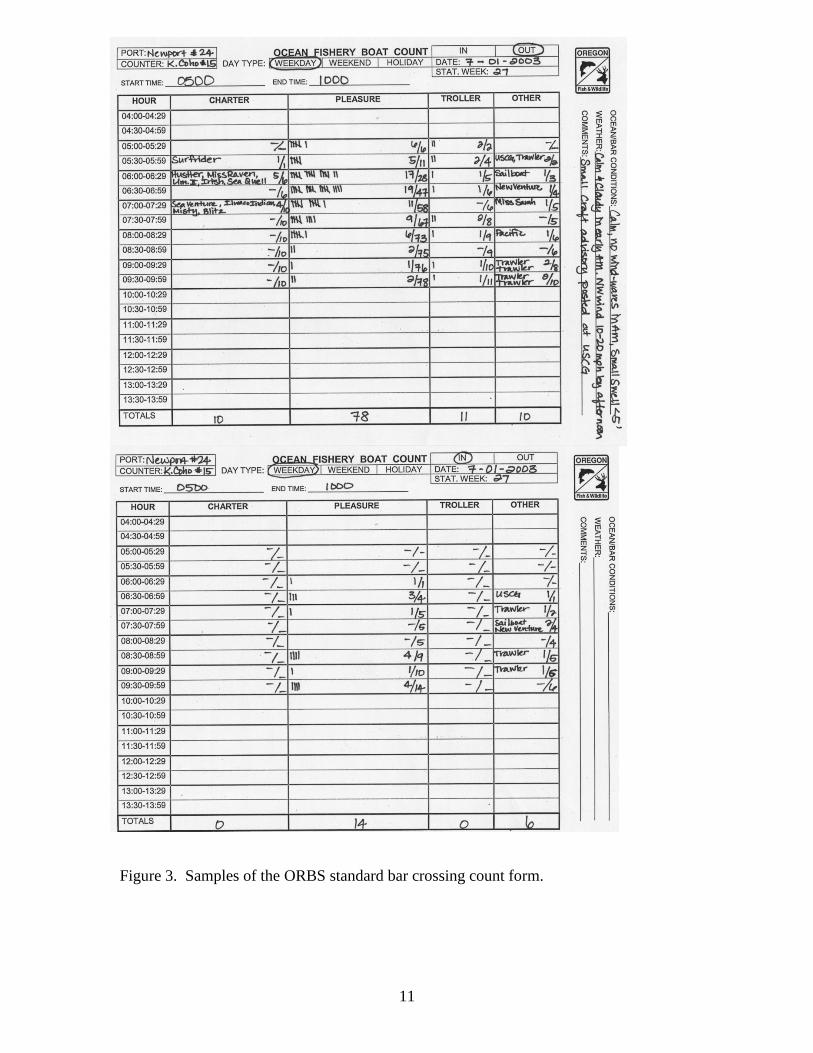
below (Figure 1). The count period is typically from dawn through 10:15. Both out and
in counts are made using the “Ocean Fishery Boat Count” form. For each day that a
count is made, the ORBS employee will fill out one form for the “OUT” count and a
second form for the “IN” count of returning boats (Figure 3). The form includes fields
for the port, boat counter’s name, day type, IN/OUT count, date, statistical week, ocean
conditions, weather conditions, and other comments. The boat counter makes their count
within the specified time frame as scheduled, and records on the form both the starting
and ending time of the count. The primary use of the “IN” count, is as a correction of the
“OUT” count for boats that turned around early and returned due to weather, sea, or other
unforeseen circumstances prior to when ORBS samplers would have a chance to
interview them. These early returning boats (usually prior to 7:45 AM) on the “IN” count
are deducted from the total on the “OUT” count by the project leader the following week
when the data arrives at the Newport field office.
Private boat “OUT” counts are transferred to the “Recreational Ocean Fishery Effort
Form” (Figure 2), under the header of “PRIV OCEAN BOAT TRIPS”. If adjustments are
made to the “OUT” count for early returning trips, the adjusted “OUT” count is what is
recorded in this column. The next column (labeled “FOR OFFICE USE ONLY”) is the final
estimate of the ocean private boat effort for the day, and is entered by project staff after
making corrections and adjustments (as described below) to the count.
Private Digital Video Bar Crossing Count Method: Beginning in 2009, cameras and
digital video recorders (DVRs) began to supplant the real time count methodology. As of
the end of the 2014 season, ORBS had implemented video counts as the primary
methodology in Garibaldi, Depoe Bay, Newport, Winchester Bay, Charleston, Gold
Beach, and Brookings (Figure 4).
Digital video counts are conducted at some point after the actual period for the count has
elapsed. Videos are reviewed in a fast forward scan until a vessel crosses the field of

7
view of the camera, and then the video is slowed and/or replayed as needed to correctly
identify the vessel type. On average, video review takes approximately 12 minutes for
each hour of count. Video advantages have proven to include an increase to the number
of counts conducted, as well as increasing the length of count periods. ORBS originally
adopted a standard count period of 04:15-16:15, but has since expanded the end of the
counting period to 20:15. By extending the count period to 20:15 the accuracy of the
“out count” can be evaluated when compared to the “in count”. This has proven
invaluable in correcting for days when heavy fog obscures the video in the early part of
the count. Additionally, the “in count” is used to correct for early returning trips as
described for the live counting methodology above. The video system also allows for the
counting period to be revised at any time to count later or earlier as the DVRs are
recording at all times.

8
Figure 2. ORBS Ocean Recreational Fishery Effort summary form.

9
Bar Crossing Count Expansions: For effort counts utilizing either the standard “bar
crossing count” or the “digital video bar crossing count”, the sample data for the week is
examined to determine the proportion of interviewed boats that crossed the bar either
before or after the “bar crossing” count was conducted. This information is used to
generate expansion factors which are applied back to the “OUT” counts to estimate the
total number of private boats that entered the ocean during the day. Most typically, a
single expansion factor for all days of the week is calculated, but in weeks with
significantly different season types (e.g., deep-water halibut season open for two days of
the week, coho salmon season opens or closes mid-week, etc.) then separate expansion
factors are calculated for each season type. Generally, the expansion equates to 10% or
less of the total effort for the week for the real time count method, and less than 1% for
the video count method. The formula used for the expansion of effort for trips crossing
the bar outside the count period is:
𝑬𝒕 = 𝑺𝒄
(𝑺𝒄 − 𝑺𝒐)× 𝑪
Where:
Et = Total ocean effort of private boats
Sc = Number of private boats interviewed
So = Number of private boats interviewed outside the count window
C = Bar crossing count of private boats
Private Vessel Bar Crossing Count Method – Foggy days and Columbia River
Estuary: At the Columbia River, as well as in some other ports when fog severely limits
visibility at the normal count location, a somewhat different “bar crossing” count is
utilized. Due to the facts that two state’s (Oregon and Washington) boats cross at the
mouth of the Columbia and the long distance across the Columbia River, there is no way
to effectively conduct a count of vessels leaving Oregon ports and crossing the bar. In
other ports, bar crossing counts may be hampered by summer fog which can restrict
visibility to less than 200 yards. For these situations, a count of boats heading
downstream from a different location with better visibility can be made. On the
Columbia River, the count definition is downstream from a North/South line from the
Hammond Boat Basin to the Washington shore. At other ports when fog becomes a
limiting factor on the exit count, a new count location is selected where both an accurate
count can be made and where anglers/boaters will be aware they have passed that specific
location when interviewed dockside. Most commonly sites such as bridges, buoys, or
significant landmarks are utilized.
The count utilizes the same forms as in the standard bar crossing, and the count is entered
on the “Recreational Ocean Fishery Effort Form” under the header of “private ocean boat
trips”. The count is later adjusted by the ORBS staff based on the proportion of boats
interviewed that went downstream from the count location but did not enter the ocean,
and the proportion of boats interviewed that departed outside of the effort count period
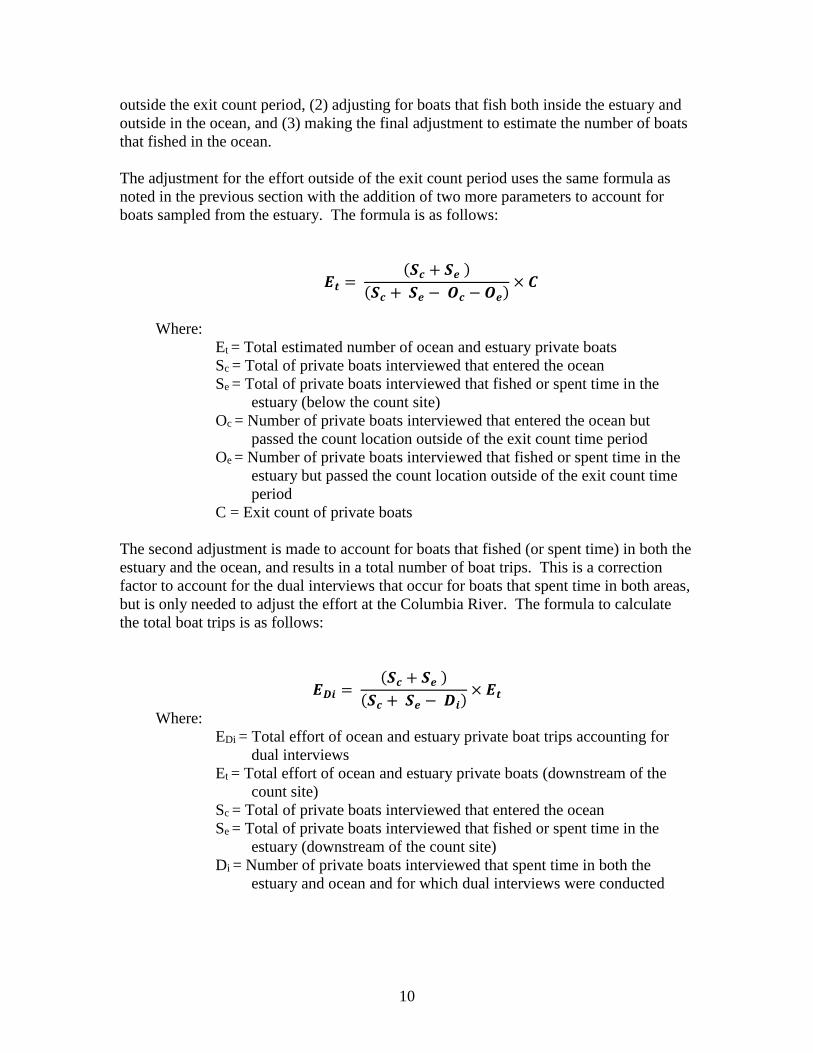
(as described above). This is a three stage process that involves (1) adjusting for effort
10
outside the exit count period, (2) adjusting for boats that fish both inside the estuary and
outside in the ocean, and (3) making the final adjustment to estimate the number of boats
that fished in the ocean.
The adjustment for the effort outside of the exit count period uses the same formula as
noted in the previous section with the addition of two more parameters to account for
boats sampled from the estuary. The formula is as follows:
𝑬𝒕 = (𝑺𝒄 + 𝑺𝒆 )
(𝑺𝒄 + 𝑺𝒆 − 𝑶𝒄 − 𝑶𝒆)× 𝑪
Where:
Et = Total estimated number of ocean and estuary private boats
Sc = Total of private boats interviewed that entered the ocean
Se = Total of private boats interviewed that fished or spent time in the
estuary (below the count site)
Oc = Number of private boats interviewed that entered the ocean but
passed the count location outside of the exit count time period
Oe = Number of private boats interviewed that fished or spent time in the
estuary but passed the count location outside of the exit count time
period
C = Exit count of private boats
The second adjustment is made to account for boats that fished (or spent time) in both the
estuary and the ocean, and results in a total number of boat trips. This is a correction
factor to account for the dual interviews that occur for boats that spent time in both areas,
but is only needed to adjust the effort at the Columbia River. The formula to calculate
the total boat trips is as follows:
𝑬𝑫𝒊 = (𝑺𝒄 + 𝑺𝒆 )
(𝑺𝒄 + 𝑺𝒆 − 𝑫𝒊)× 𝑬𝒕
Where:
EDi = Total effort of ocean and estuary private boat trips accounting for
dual interviews
Et = Total effort of ocean and estuary private boats (downstream of the
count site)
Sc = Total of private boats interviewed that entered the ocean
Se = Total of private boats interviewed that fished or spent time in the
estuary (downstream of the count site)
Di = Number of private boats interviewed that spent time in both the
estuary and ocean and for which dual interviews were conducted
11
Figure 3. Samples of the ORBS standard bar crossing count form.

12
Figure 4. Sample of the ORBS video boat count form (front and back of both “Out” and
“In” pages).

13
One final calculation is needed at the Columbia to correct for the proportion of estuary
trips in the sampling. This formula results in an estimate of the number of private boat
trips actually in the ocean, and is as follows:
𝑬𝒐 = 𝑺𝒄
(𝑺𝒄 + 𝑺𝒆)× 𝑬𝑫𝒊
Where:
EO = Estimated total number of ocean private boat trips
EDi = Total effort of ocean and estuary private boat trips accounting for
dual interviews
Sc = Total of private boats interviewed that entered the ocean
Se = Total of private boats interviewed that fished or spent time in the
estuary (below the count site)
For the video boat count, there is no means by which to change the location of the camera
to adjust to fog. Instead, samplers reviewing video note the time periods when fog
precludes getting an accurate vessel count, and an interpolation of the surrounding count
periods may be used to fill in for periods when counts were not possible.
Private Vessel Alternative Effort Count: The ports of Florence and Bandon currently
utilize what is known as the “Alternative Effort Count”. This method can only be utilized
in smaller ports with a view of the exit channel and a single boat basin area that handles
the vast majority of the ocean effort and that can be viewed completely by the ORBS
sampler at all times.
The alternative effort count form involves four components to estimate the effort (Figure
5). First, the ORBS sampler makes a count of all boat trailers and moorage slips that are
currently in use but vacant at the time of the count. This count needs to include all
locations that ocean boats are using such as moorage or access points. This count is
typically made only once at the start of the sampling day, usually between 8:00 AM and
9:00 AM, and before the fishing boats start returning to port. The start time and initial
count may need to occur earlier based on weather conditions and angler success rates. It
is important that the ORBS sampler be familiar with which moorage slips are currently
occupied by private boats, and which boat trailers are simply being stored in the parking
area.
The second component of the alternative effort count is to count any additional departing
private boats throughout the day. This includes boats launching at the ramp, boats
leaving moorage slips, and boats heading downstream from other moorage areas
upstream. The third component involves keeping a count of all private boats that are
returning to their moorage slips, the boat ramp, and upstream moorage sites.
The fourth and final component is to tally the boats that are interviewed by category on
the form. The categories are ocean trips (all trip types), and estuary trips which are split
out for salmon, non-salmon, and non-fishing trip types.

14
These components are plugged into the following formula to estimate the ocean private
boat effort for the day:
𝑬𝒕 = (𝑻 + 𝑳)𝑶𝒊
(𝑶𝒊 + 𝑩𝒊)
Where:
Et = Total ocean effort of private boats
T = Initial count of trailers and slips at launch and moorage locations
L = Total of all additional private boat departures during the day
Oi = Total of ocean private boat interviews
Bi = Total of estuary private boat interviews
The total effort is entered onto the “Recreational Ocean Fishery Effort Form”, under the
header of “PRIV OCEAN BOAT TRIPS”. No further adjustments to the effort are made.
Private Vessel Alternative Effort Count – Pacific City: The fishery and fleet at the
“port” of Pacific City requires a slightly modified alternative count method for
accounting for private boat effort. Pacific City is a beach access point where flat
bottomed dories are launched through the surf. A large number of the boats in the dory
fleet have commercial fishing licenses and on any given day may be either sport fishing
or commercial fishing. In order to accurately estimate the component of the fleet that is
sport fishing, a separate count form is used at Pacific City (Figure 6). This method
accounts for the commercial traffic in much the same way that the “alternative effort
count form” deals with estuary fishing activity in other ports.
The ORBS sampler starts the form by making a count of all trailers on the beach and the
adjacent parking lot just south of Cape Kiwanda at the start of the sampling day. This
initial count usually needs to occur between 7:00 AM and 9:00 AM. There is one
additional beach site for launching a few miles North of Cape Kiwanda, Tierra del Mar
that may need to be counted if the beach conditions at Cape Kiwanda deteriorate (i.e. soft
sand at entrance point, too many rocks on the beach, etc.). Next, any additional boat
launches are recorded during the hour in which they occurred.

15
Figure 5. Private boat effort count form currently in use at ORBS at the ports of Florence
and Bandon.

16
Throughout the day, the ORBS sampler tallies all returning boats on the form in column
C as they land back on the beach. Then the sampler tallies each boat as to the category
the boat falls within: “private boat”, “charter boat”, “commercial salmon”, or
“commercial/other” based on contacts with vessels. These components are then entered
into the following formula to calculate total private boat effort:
𝑬𝒕 = (𝑻 + 𝑳)𝑷𝒊
(𝑷𝒊 + 𝑮𝒊 + 𝑪𝒊)
Where:
Et = Total effort of private boats
T = Initial count of trailers
L = Total of all additional boat departures during the day (includes
commercial boats)
Pi = Interviewed ocean private boats returning to beach
Gi = Interviewed charter boats returning to beach
Ci = Interviewed commercial and other boats returning to beach (sum of
all types)
This total is entered onto the “Recreational Ocean Fishery Effort Form”, under the header
of “PRIV OCEAN BOAT TRIPS”. Recently, more kayaks and personal watercraft (PWC)
have been using Pacific City to access the ocean. An additional “trailer” is added to the
count for each extra kayak or PWC beyond one per vehicle. No further adjustments to
the effort are made.
Private Vessel Effort Counts – Expansions for non-count days: Typically ORBS
conducts private boat effort counts at a minimum of four days each week (both weekend
days and two weekdays). In most ports and weeks, ORBS actually conducts five or six
effort counts each week, and counts for all seven days of the week may be available in
major ports during peak season as well for locations utilizing video counts. For those
days when there were no effort counts made, expansions are made by ORBS staff in
Newport to account for the non-counted days. These expansions are simple averages of
the counted days that are of similar day and season types. In other words, if it is a deep
water halibut season weekday, then only other deep water halibut season weekdays will
be used to average the effort.
In some cases, there may have been a storm or other extreme weather or ocean conditions
that occurred on the non-counted day. If information is available to indicate that there
were no ocean trips on a non-counted day (US Coast Guard kept the bar closed, adjacent
port with a zero count, etc.), then the effort would be assigned a zero count for the day.

17
Methodology: Interviews
The primary goals of the ORBS dockside interviews are to generate accurate and
unbiased estimates of anglers per boat and catch by species per boat for the ocean
recreational boat fishery, and to sample for and recover from the ocean recreational
salmon fishery coded wire tags (CWTs). Further, the estimates are expected to be
accurate at the level of statistical week, port, boat type, trip type, season type, and area of
effort/catch. To sample salmon adequately for CWTs, a minimum sampling rate standard
of 20% of landed salmon by port and week has been established to better insure that
CWT recoveries will represent the actual fishery interceptions occurring for any given
strata. The ORBS has generally adopted this as the minimum standard for all fisheries
and time periods sampled.
A variety of other data are also collected, including information on the number of fish
released, lengths and weights of fish, departure time, interview time, and information on
estuary trips. The data is stratified by port and summed over ports to generate estimates
for catch areas and the entire state.
Interview Selection and Bias Avoidance
Due to substantial differences between charters and private boats (i.e., charters often use
moorage areas that are separated from the private boat use areas, have a wider range in
number of anglers, and the fact that charter trip type and return time is available in
advance), charter boat effort is stratified to trip type prior to the interview, and interviews
are selected by samplers to be representative of the fleet activity for the various target
species over the course of the week or season type. Private boats cannot be stratified to
trip type prior to the interview, and therefore interviews are selected in a random fashion
within the boat basin and launch ramp area to reduce potential sampling bias towards trip
type.
ORBS samplers are instructed to interview private boats without prejudice to size,
number of anglers, presence or absence of fish or fishing tackle, etc. Samplers are
instructed to always interview the “next boat” that they see returning to their area of
operation, and once that interview is completed, to look for the next returning boat.
Private boat interviews are recorded for any boat that has completed their trip; regardless
of whether they entered the ocean or even fished (a correct proportion of non-fishing trips
is needed to determine actual fishing effort).
Sampling schedules are set in advance by ORBS permanent staff to provide
representative sampling coverage for all day types, season types, and to cover the hours
of the day when charter and private fishing vessels can be expected to return from the
ocean. Interviews are always initiated at the boat at the time that it arrives back at the
dock or ramp to insure that all anglers and catch are present from the trip.

18
Figure 6. Effort count form currently in use by ORBS at Pacific City to estimate
recreational fishing effort (identifies proportion of commercial fishing boats in trailer
count).

19
ORBS Interview
The dockside interview is recorded on a handheld computer which utilizes a program
developed by ORBS staff. This program assists in making sure that all pertinent
interview data is gathered and that errors are minimized by using a series of prompts for
data that falls outside of expected ranges. The ORBS interview is not static; it has
continued to evolve throughout the history of the project, and the future is certain to hold
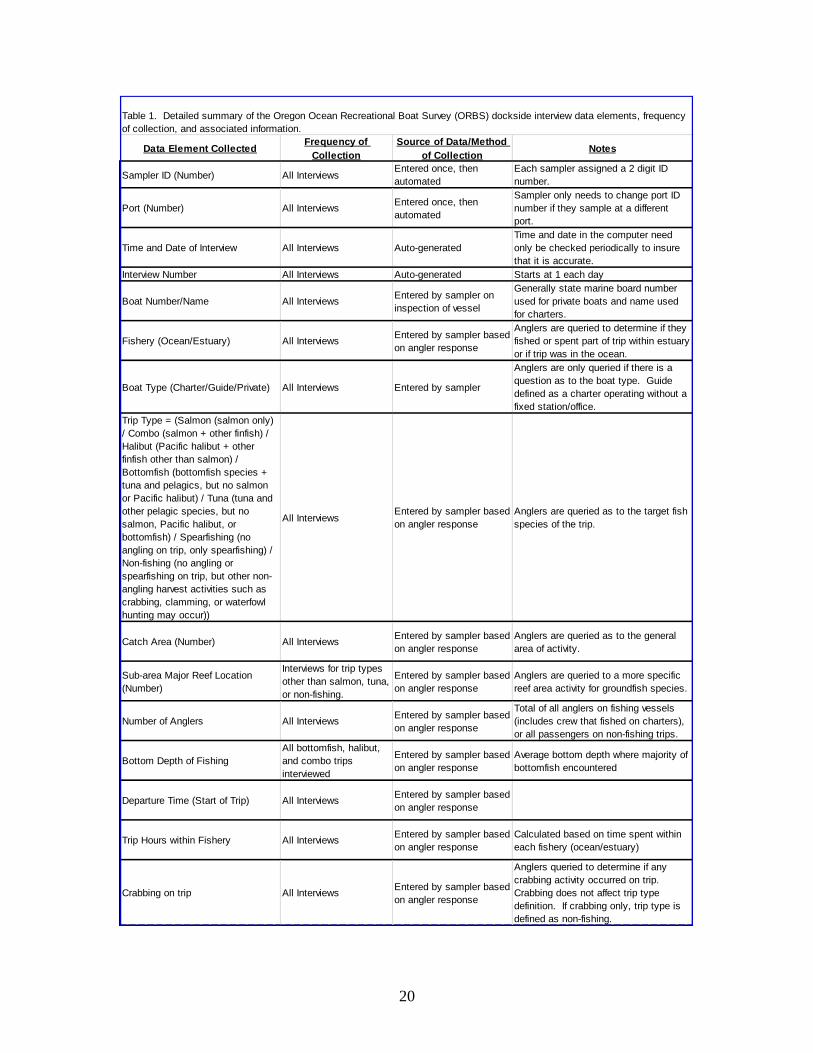
more refinements to the interview. The current content and source of the interview data
is summarized in Table 1. Additional specialized data elements such as profiles of
fishing gear, PIT tag scanning, etc., are occasionally collected, but are not part of the
standard ORBS interview.
20
Data Element CollectedFrequency of
Collection
Source of Data/Method
of CollectionNotes
Sampler ID (Number) All InterviewsEntered once, then
automated
Each sampler assigned a 2 digit ID
number.
Port (Number) All InterviewsEntered once, then
automated
Sampler only needs to change port ID
number if they sample at a different
port.
Time and Date of Interview All Interviews Auto-generated
Time and date in the computer need
only be checked periodically to insure
that it is accurate.
Interview Number All Interviews Auto-generated Starts at 1 each day
Boat Number/Name All InterviewsEntered by sampler on
inspection of vessel
Generally state marine board number
used for private boats and name used
for charters.
Fishery (Ocean/Estuary) All InterviewsEntered by sampler based
on angler response
Anglers are queried to determine if they
fished or spent part of trip within estuary
or if trip was in the ocean.
Boat Type (Charter/Guide/Private) All Interviews Entered by sampler
Anglers are only queried if there is a
question as to the boat type. Guide
defined as a charter operating without a
fixed station/office.
Trip Type = (Salmon (salmon only)
/ Combo (salmon + other finfish) /
Halibut (Pacific halibut + other
finfish other than salmon) /
Bottomfish (bottomfish species +
tuna and pelagics, but no salmon
or Pacific halibut) / Tuna (tuna and
other pelagic species, but no
salmon, Pacific halibut, or
bottomfish) / Spearfishing (no
angling on trip, only spearfishing) /
Non-fishing (no angling or
spearfishing on trip, but other non-
angling harvest activities such as
crabbing, clamming, or waterfowl
hunting may occur))
All InterviewsEntered by sampler based
on angler response
Anglers are queried as to the target fish
species of the trip.
Catch Area (Number) All InterviewsEntered by sampler based
on angler response
Anglers are queried as to the general
area of activity.
Sub-area Major Reef Location
(Number)
Interviews for trip types
other than salmon, tuna,
or non-fishing.
Entered by sampler based
on angler response
Anglers are queried to a more specific
reef area activity for groundfish species.
Number of Anglers All InterviewsEntered by sampler based
on angler response
Total of all anglers on fishing vessels
(includes crew that fished on charters),
or all passengers on non-fishing trips.
Bottom Depth of Fishing
All bottomfish, halibut,
and combo trips
interviewed
Entered by sampler based
on angler response
Average bottom depth where majority of
bottomfish encountered
Departure Time (Start of Trip) All InterviewsEntered by sampler based
on angler response
Trip Hours within Fishery All InterviewsEntered by sampler based
on angler response
Calculated based on time spent within
each fishery (ocean/estuary)
Crabbing on trip All InterviewsEntered by sampler based
on angler response
Anglers queried to determine if any
crabbing activity occurred on trip.
Crabbing does not affect trip type
definition. If crabbing only, trip type is
defined as non-fishing.
Table 1. Detailed summary of the Oregon Ocean Recreational Boat Survey (ORBS) dockside interview data elements, frequency
of collection, and associated information.

21
Data Element CollectedFrequency of
Collection
Source of Data/Method
of CollectionNotes
Both Ocean and Estuary on Same
Trip (Y/N)All Interviews
Entered by sampler based
on angler response
This is assigned a yes value if two
interviews need to be conducted for the
two separate fisheries for the same trip.
Encounter Data: Species ID Code
All Interviews with
Landed or Released
Catch
Entered by sampler
Encounter Data: Species Retained
(Number)
All Interviews with
Landed Catch
Entered by sampler based
on actual count of fish
Samplers count all landed catch with
exceptions for crab and albacore tuna
where angler estimate of catch is
accepted and "baitfish" (herring,
anchovies, etc.) where an estimate of
the number of fish caught is used.
Encounter Data: Species
Released (Number)
All Interviews with
Reported Released
Catch
Entered by sampler based
on angler response
Anglers are queried as to whether they
released any fish during the trip. If yes,
they are queried for number by species.
Additional "pop-up" question when
specific rockfish species are reported
as released to identify whether a
"release at depth" device was used.
Encounter Data: Number of Coded
Wire Tagged Salmon Retained
All Interviews with
Landed Chinook or Coho
Salmon or steelhead
Entered by sampler based
on examination of catch
Samplers electronically inspect all
Chinook, Coho, and steelhead for tags
Encounter Data: Number Adipose
Fin Clipped Salmon Retained
All Interviews with
Landed Chinook or Coho
Salmon or steelhead
Entered by sampler based
on examination of catch
Visual inspection of retained salmon
and steelhead for adipose fin clips
Biological Data -Length/Weight:
Species ID CodeEntered by sampler
Biological Data -Length/Weight:
Fork Length (mm)
Entered by sampler to at
least the nearest 5 mm
based on measurement
from measuring board
Biological Data -Length/Weight:
Weight (kg)
Entered by sampler to at
least the nearest 0.1 kg
based on measurement
from hand scale
Biological Data -Lengths: Species
ID CodeEntered by sampler
Biological Data -Lengths: Fork
Length (mm)
Entered by sampler to the
nearest 5 mm
Biological Data - CWT: Species ID
CodeEntered by sampler
Biological Data - CWT: Fork
Length (mm)
Entered by sampler to the
nearest 5 mm
Biological Data - CWT: CWT ID
Number
Entered by sampler based
on the unique ID number
that is assigned the fish.
Biological Data - CWT: CWT
Collected (Y/N)
Entered by sampler, "Y" if
CWT was collected "N" if
CWT was not collected.
Biological Data - CWT: Snout
Snout recovered for all
CWTs whenever possible,
unique ID number is
included with snout in
plastic bag.
Table 1 (continued). Detailed summary of the Oregon Ocean Recreational Boat Survey (ORBS) dockside interview data
elements, frequency of collection, and associated information.
All landed Chinook
Salmon, Coho Salmon,
and steelhead that test
positive for the presence
of a CWT will have an
entry even if tag is not
able to be recovered.
As needed to meet
sampling goals for
various species from the
ocean fishery: 15 per
non-salmon species per
week, and all Coho from
2 boats per day.
Length/Weight data is not collected for
Pacific Halibut, salmon other than
Coho, or other species in excess of
900mm. For Coho Salmon, weights are
taken from fish that are commercially
dressed i.e. gutted and gilled. For all
other species, weights are for fish in the
round.
All landed Chinook
salmon (ocean caught
only) and all Pacific
Halibut from every other

22
Figure 7. The weekly ORBS interview summary form (front and back).

23
Interview Summary Form
At the end of each work day, each ORBS sampler is required to run a data summary
program on their handheld data computer. The results of this summary are then
transferred to a two sided summary form (Figure 7). The summary form has two primary
uses. First, it provides minimal information from the interviews that could be used to
recreate the majority of the data in the event of failure of the handheld computer. The
second use is for mid-week updates on the fishery. This is primarily used for near real-
time monitoring of quota managed salmon fisheries and making sure that the overall
landings do not exceed the quota.
Final Catch and Effort Expansion
The remaining process is to make the final expansion of the interview data to the fishing
population within each strata. Due to the nature of the effort estimates, separate estimates
and expansions are made for charter boats and private/guide boats.
Methodology: Estimation
With the two components of effort and interviews in hand, estimates can now be
generated for each of the parameters from the interviews. There are two stages to this
process. The first is to calculate design-based estimates of total catch and associated
variances according to the assumed sampling design (i.e., stratified, simple random
sampling). This stage is described briefly below but more detailed documentation,
including computer code and variance estimation formulae, is available upon request.
The second stage in the process involves model-based steps to account for potential
undercoverage errors in the sampling frame and is done at the request of RecFIN.
Design-based estimation of all sampling parameters (i.e. anglers, catch by species,
released catch by species) is calculated by assuming that sampled boats are a simple
random sample of all boats in a given stratum. The standard, unbiased estimator for a
total is used for estimation:
𝑃𝑡 = 𝐸𝑡 (𝑃𝑠
𝑆𝑐)
Where:
Pt = Total estimated parameter (i.e. anglers, catch by species, released
catch by species)
Ps = Sum of sampled units by parameter
Sc = Number of sampled boats
Et = Total effort in number of boats
Catch and effort are summed across pertinent strata to generate the final estimate. For
example, total of salmon angler trips is the sum of anglers on salmon trips and anglers on
combination trips for all season types during the week; while the total of coho salmon
catch for a port and week is the sum of coho caught on each of the trip types (salmon,
combination, bottomfish, halibut, tuna, and spearfishing).

24
The variance of the total is calculated using the standard formula for simple random
sampling (shown here without indices for strata):
𝑉𝑎𝑟(𝑃𝑡) = 𝐸𝑡2 (1 −
𝑆𝑐
𝐸𝑡) (
𝑠2
𝑆𝑐),
𝑤ℎ𝑒𝑟𝑒 𝑠2 =1
𝑆𝑐 − 1∑(𝑝𝑖 − �̅�)2
𝑖𝜖𝑆𝑐
Where:
Pt = Total estimated parameter (i.e. anglers, catch by species, released
catch by species)
Ps = Sum of sampled units by parameter
Sc = Number of sampled boats
Et = Total effort in number of boats
pi = Measurement (i.e. anglers, catch by species, released catch by
species) on sample boat i
RecFIN Expansion for Unsampled Ports and Time Periods
The Pacific States Marine Fisheries Commission (PSMFC) maintains a recreational
fisheries database known as the Recreational Fishery Information Network (RecFIN).
Much of the data in the RecFIN system was originally provided by MRFSS, but now the
ocean boat portion of the data is supplied by ORBS. At the request of the RecFIN
Statistics Subcommittee in 2000, an additional set of expansions is used to address those
time periods and ports where sampling is not occurring for the recreational groundfish
fishery. Due to the extreme seasonal nature of fisheries for salmon, Pacific halibut, and
albacore tuna, the following expansions are not made for those species. The weekly
estimates with expansions are summed to the monthly level and provided to PSMFC for
inclusion in the RecFIN database. The ORBS does not use or maintain these estimates
after they have been transferred to and uploaded by PSMFC to RecFIN. Variances noted
above are currently not extended to include the RecFIN expansions.
The first level of RecFIN expansion simply addresses fishing activity outside the hours
when ORBS staff is sampling and also expands for unsampled small-access locations
(those never included in the standard ORBS sampling frame). The expansion applies to
estimates of effort and catch on private bottomfishing and spearfishing trips for each
week that estimates of catch and effort are made. Since video boat counts occur at almost
all major ports and give us virtually 24 hour coverage of vessel trips, the expansion is
only applied to ports without video boat counts. The formula that is used is as follows:
𝑃𝐸𝑥𝑝 =𝑃𝑡
𝐸𝑥𝑝
Where:
25
PExp = Total expanded parameter (effort by trip type, catch by species,
released fish by species) for private boat bottomfish and
spearfishing trips stratified by port, trip type, and catch area
Pt = Total estimated parameter (effort by trip type, catch by species,
released fish by species) for private boat bottomfish and
spearfishing trips stratified by port, trip type, and catch area. This
is the final ORBS estimate by parameter
Exp = Expansion factor for unsampled ports and outside hours. Currently
0.96 is used at the recommendation of the RecFIN Statistics
Subcommittee in 2000.
The next level of RecFIN expansion generates estimates for unsampled ports. They are
dynamically generated using data from previously sampled time periods at these ports.
These previously sampled time periods are partitioned into two seasons, summer and
winter. The summer season extends throughout the period when full port sampling effort
is occurring, June – September (weeks 25-38). The winter season is November through
February. Currently, winter season data used for unsampled port expansions are those
collected coastwide during the November 2011 – February 2012 MRIP-supported pilot
project intended to collect updated winter effort and catch information. MRIP also
supported winter sampling in most Oregon ports in 2013-14; these data will be added to
the expansion procedures after further processing. Both season partitions have sampling
data for each week of the season.
The time of year for which unsampled port estimates are being generated determines
whether summer or winter data from previously sampled time periods are used.
Estimates generated for the March through October timeframe use summer data, whereas
estimates for the November through February timeframe use winter data.
The estimates for boat effort and catches/releases in numbers of fish for unsampled ports
use the following three data components:
Unsampled Port Boat Effort: Unsampled port fishing effort (number of boat-
trips) is estimated using the weekly average of effort at the currently
unsampled port’s last previous sampling seasons compared to the total effort
for all ports during the same time period. Estimates outside the November –
February winter season are generated using data from the three previous
summer seasons, while estimates made for weeks during the November –
February season use the 2011-2012 winter sampling data.
Unsampled Port Catch per Boat: Unsampled port catch per boat is estimated
using the average of the single year sampled catch per boat data determined
by the season for which the estimates are generated.
Unsampled Port Species Composition: Unsampled port species compositions
are estimated using the average of the single year sampled species

26
composition data determined by the season for which the estimates are
generated.
Effort estimate calculations use data differently depending on when the estimate is being
created for. Estimates for weeks during March through October use the average of the
three most recent summer sampling seasons. Using three years increases the amount of
data available for average effort calculations. Limiting the period to three years
minimizes impacts of longer term effort shifts seen within the fishery. When generating
estimates for weeks in November through February, data from the 2011-2012 winter
sampling season are used (data from the 2013-2014 winter sampling project will be
incorporated soon). Catch-per-boat and species composition estimates use data from the
previous one year only, to minimize management-induced differences seen in catches and
releases.
Expansions include both charter and private boats, and are stratified by port and statistical
week for each statistical month and then provided to RecFIN. Ports that historically have
little or no bottomfishing activity (i.e., Astoria, Florence, and Winchester Bay) are
excluded from these over-winter effort expansions.
Unsampled Port Effort Estimation: Current unsampled port effort estimates are
created by generating an all-ports effort estimate for the sampled week, calculating a ratio
of the currently unsampled port’s previous season effort to the all-ports previous season
effort, and applying that ratio to the current week’s all-ports effort:
𝑬𝑼 = �̅�𝑼𝟑
�̅�𝑺𝟑
× 𝑬𝑺
Where:
𝑬𝑼 = Total groundfish estimated effort for currently unsampled ports
�̅�𝑼𝟑 = 3-year previous season groundfish estimated average effort for
currently unsampled ports
�̅�𝑺𝟑 = 3-year previous season groundfish estimated average effort for
sampled ports
𝑬𝑺 = Total groundfish estimated effort for currently sampled ports
Unsampled Catch per Boat (CPUE) Estimate: To generate catch estimates for
unsampled ports, a catch per unit effort (CPUE; in ORBS, the unit of effort is the boat-
trip) estimate is created based on the catch per boat data from the one previously sampled
season:
𝑪𝑷𝑼𝑬𝑼 =�̅�𝑼𝟏
�̅�𝑼𝟏
Where:

27
𝑪𝑷𝑼𝑬𝑼 = Estimated catch per boat for currently unsampled ports
�̅�𝑼𝟏 = 1-year previous season groundfish estimated average catch in
numbers of fish for current unsampled ports
�̅�𝑼𝟏 = 1-year previous season groundfish estimated average effort for
current unsampled ports
Unsampled Catch Estimate: The current unsampled port catch by species is estimated
by multiplying each unsampled port’s estimated groundfish boat effort by the previous
year’s catch per boat estimate, and then by the previous year’s estimated groundfish
species composition.
𝑪𝑼 = 𝑬𝑼 × 𝑪𝑷𝑼𝑬𝑼 × 𝑺𝑼𝟏
Where:
𝑪𝑼 = Estimated catch by species for currently unsampled ports in
numbers of fish
𝑬𝑼 = Total groundfish estimated effort for currently unsampled ports
𝑪𝑷𝑼𝑬𝑼 = Estimated catch per boat for currently unsampled ports
𝑺𝑼𝟏 = 1-year previous season groundfish species composition for
currently unsampled ports
In general, this expansion accounts for less than 6% of the statewide annual bottomfish
effort and catch.
Summary
The ORBS program provides a number of different management entities with accurate
and timely effort, catch, and CWT data from the ocean recreational boat fishery off
Oregon. This data is stratified to levels usable for adaptive management strategies, and
has been the only source of data that can be accessed in a real time manner to address
quota fishery management needs. The program continues to evaluate its effectiveness in
meeting the needs of fishery management, and has adjusted to changing needs and to
improve efficiencies in the light of reduced funding.