sampling distributions psychology 302 william p. wattles, ph.d
TRANSCRIPT

Sampling Distributions
Psychology 302William P. Wattles, Ph.D.

Exam 1 & exam 1 make-upFrequency Distribution
exam1 Freq20% 030% 040% 050% 060% 270% 680% 090% 1
100% 0

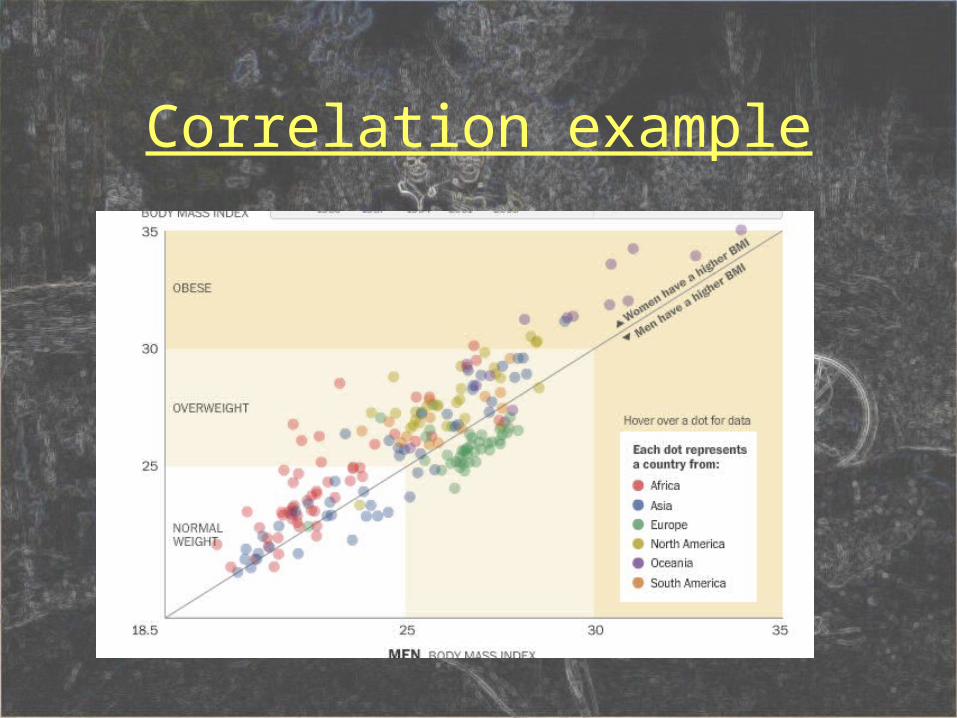
Correlation example
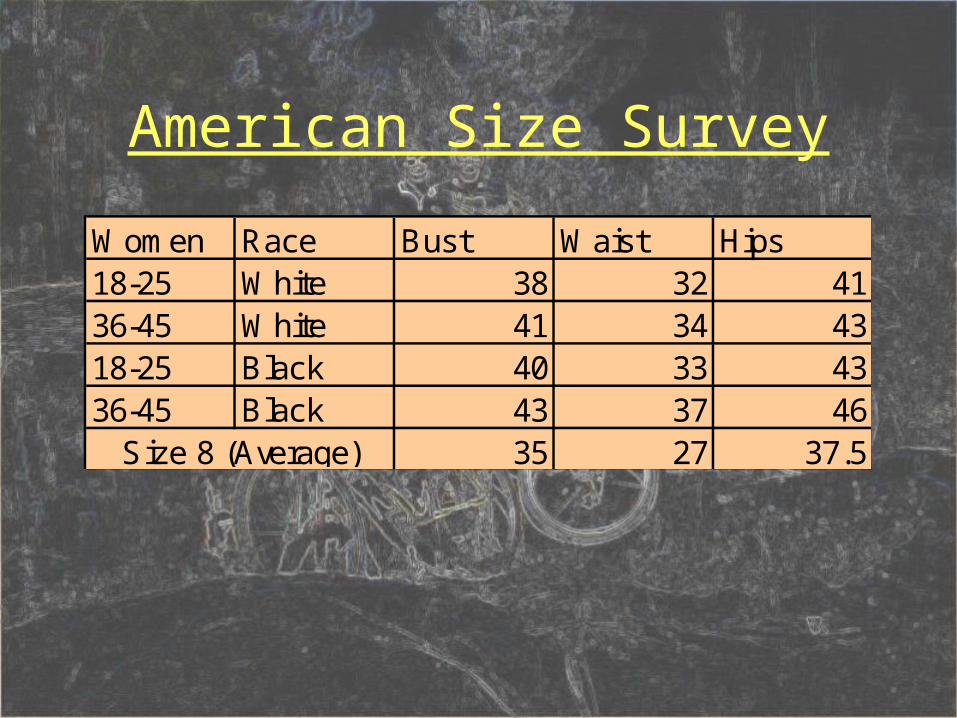
American Size Survey
Women Race Bust Waist Hips18-25 White 38 32 4136-45 White 41 34 4318-25 Black 40 33 4336-45 Black 43 37 46
35 27 37.5Size 8 (Average)

American Size Survey
Men Race Chest Waist Hips Collar18-25 Black 41 37 41 1636-45 Black 43 37 42 1718-25 White 41 35 41 1636-45 White 44 38 42 16
40 34 40 15.540 Regular (Average)

Statistical Inference
• We use information from a sample to infer something about a wider population.
• American Size Survey Measured 10,000 people

Population
Sample
M

ProbabilityProbability
• The probability of any outcome is the proportion of times it would occur in a long series of repetitions.
• The relative frequency of an event in the population equals the probability of the event.

Relative
• Considered in comparison with something else: the relative quiet of the suburbs.
• Dependent on or interconnected with something else; not absolute.

Relative Frequency ?
• (.33)

Relative Frequency ?
• (.20)
Probability DistributionProbability Distribution
• The probability distribution of a random variable tells us the possible values of the variable and the probability associated with each value.
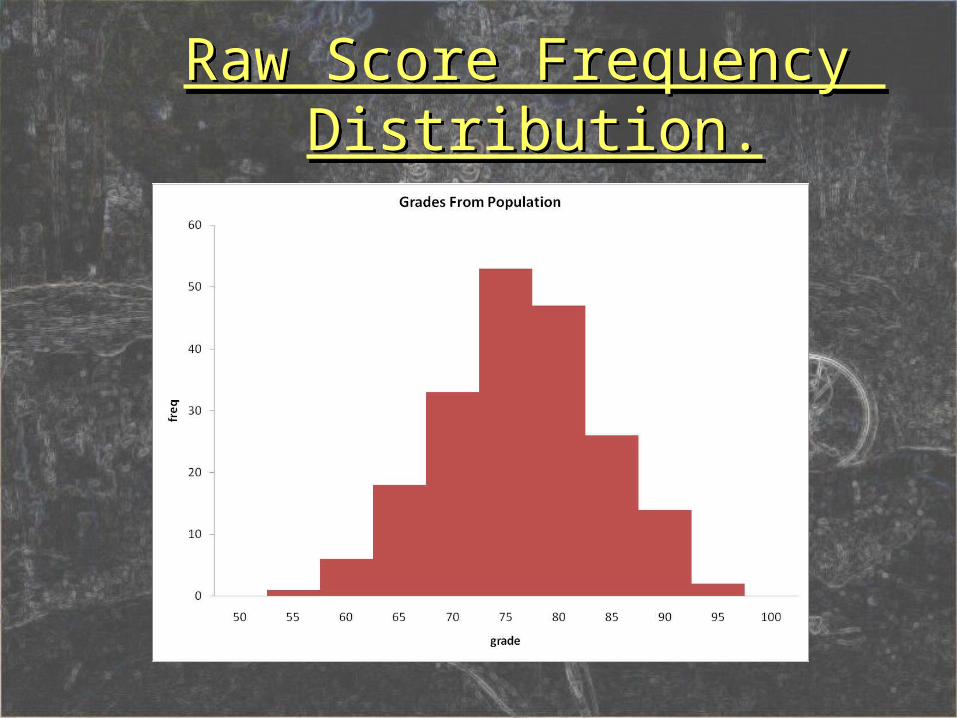
Raw Score Frequency Distribution.
Raw Score Frequency Distribution.

Raw Score Probability Distribution.
Raw Score Probability Distribution.

Frequency distribution versus probability
distribution
Frequency distribution versus probability
distribution• Given the formula for probability it
is clear that the curves will be the same.
• The relative frequency of scores in the population equals the probability of those scores.
• Y axis is probability rather than frequency.

The Normal curve
• When the data are normal we can use table A to determine the probability of an event.

Using the standard normal curve to describe samplesUsing the standard normal curve to describe samples• Instead of using a frequency
distribution of raw scores we will obtain a frequency distribution of sample statistics
• Called a sampling distribution

Sampling VariabilitySampling Variability
• The basic fact that different random samples will choose different subjects and no doubt produce a different value for the statistic.

Sampling Distribution exercise
• http://onlinestatbook.com/stat_sim/sampling_dist/index.html
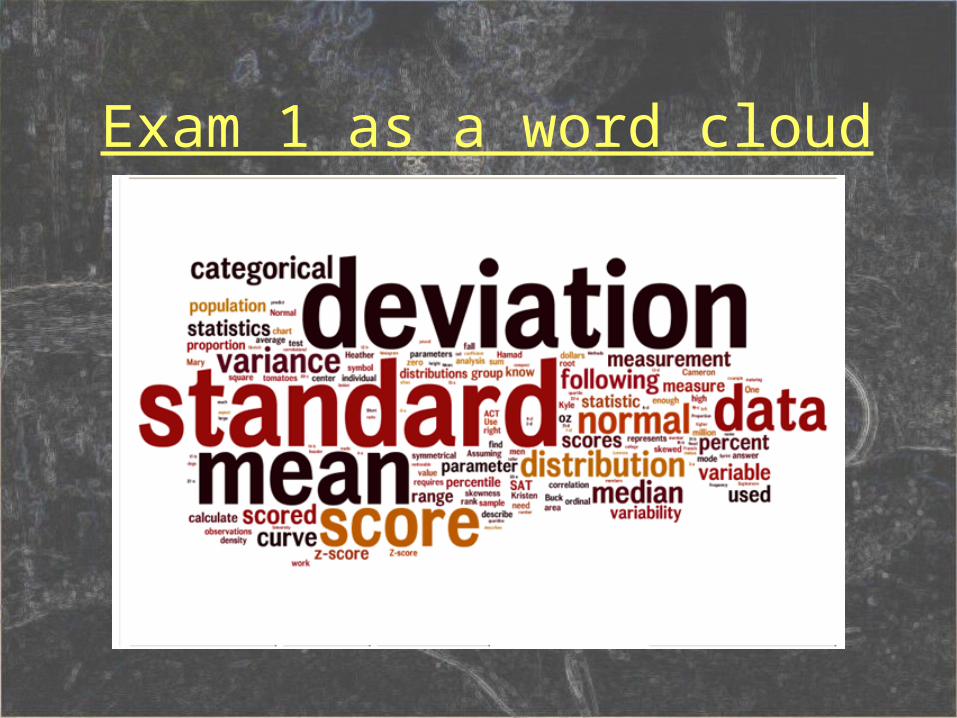
Exam 1 as a word cloud
Sampling Distribution
• The values that the statistic can take and the relative frequency of each.
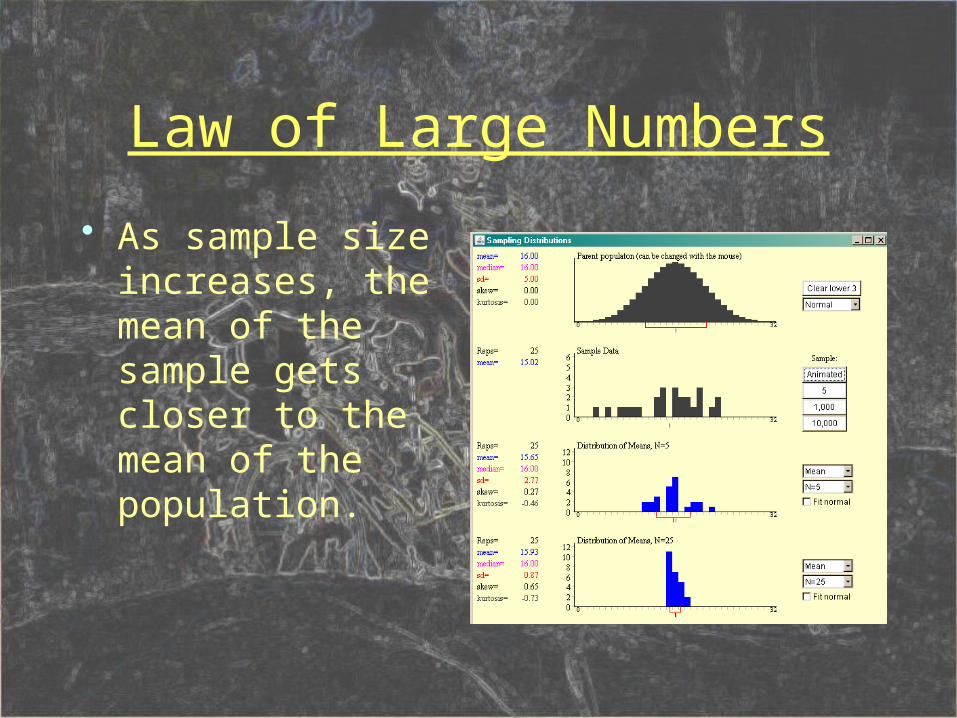
Law of Large Numbers
• As sample size increases, the mean of the sample gets closer to the mean of the population.


Law of Large Numbers
• As the sample size increases the standard error of the mean (SEM) decreases.
Sampling VariabilitySampling Variability
• Random phenomenon-individual outcomes are uncertain but regularly distributed.
• Probability of an outcome is the proportion of times the outcome would occur in a long series of repetitions.

A sampling distribution of the means
A sampling distribution of the means
• provides us with a theoretical probability distribution that describes the probability of obtaining any sample mean when we randomly select a sample of a particular N from a particular raw score population.

A sampling distribution of the means
A sampling distribution of the means
• is the distribution of all possible values of random sample means when an infinite number of samples of the same size are selected from one raw score population.

Sampling distributions.Sampling distributions.
• Y axis still measures frequency• X axis now measures values the
statistic (I.e., the sample mean) can take rather than values of the individual raw score.

Sampling distributions.Sampling distributions.
• The variability will be much less. It is easier to get one extreme score than to get a bunch of extreme scores
• Sampling distributions exist for many types of sample statistics


Raw Score Probability Distribution.
Raw Score Probability Distribution.

Sampling DistributionSampling Distribution
frequency

Characteristics of a sampling distributionCharacteristics of a
sampling distribution• All the samples contain raw scores
from the same population• All the samples are randomly
selected• All the samples have the same size
N.• The sampling distribution
represents all possible values of the sample statistic

Sample ProportionsSample Proportions
• Used mostly for categorical variables
• How good an estimator of the population parameter is the sample proportion?
• Sampling distribution of sample proportions is close to normal
• Mean of the sampling distribution is equal to the proportion of the population

Sample MeansSample Means
• Used instead of proportion for continuous data.
• Less variable than individual observations
• More normal than individual observations.

Central Limit Theorem:Central Limit Theorem:
• the sampling distribution of means will:– form an approximately normal
distribution.– have a mean that equals the mean of
the raw scores.– have a standard deviation
mathematically related to the standard deviation of the raw scores.

The central limit theorem
Population with strongly skewed
distribution
Sampling distribution of
for n = 2 observations
Sampling distribution of
for n = 10 observations
Sampling distribution of for n = 25 observations
x
x
x
x

How large a sample size?
– A sample size of 25 is generally enough to
obtain a normal sampling distribution
from a strong skewness or even mild
outliers.
– A sample size of 40 will typically be good
enough to overcome extreme skewness
and outliers.

Standard Error of the Mean
Standard Error of the Mean
• The standard error of the mean is a standard deviation calculated just like any other standard deviation.
• Has a different name because it refers to means not scores
• Is related to the standard deviation of the raw scores.

Standard ErrorStandard Error
X X N /

Standard ScoreStandard Score
z X X ( )

Problem
• Mean loss $250• Std dev $1,000
• If they sell 10,000 policies what are the chances the loss will be less than $275?
Problem
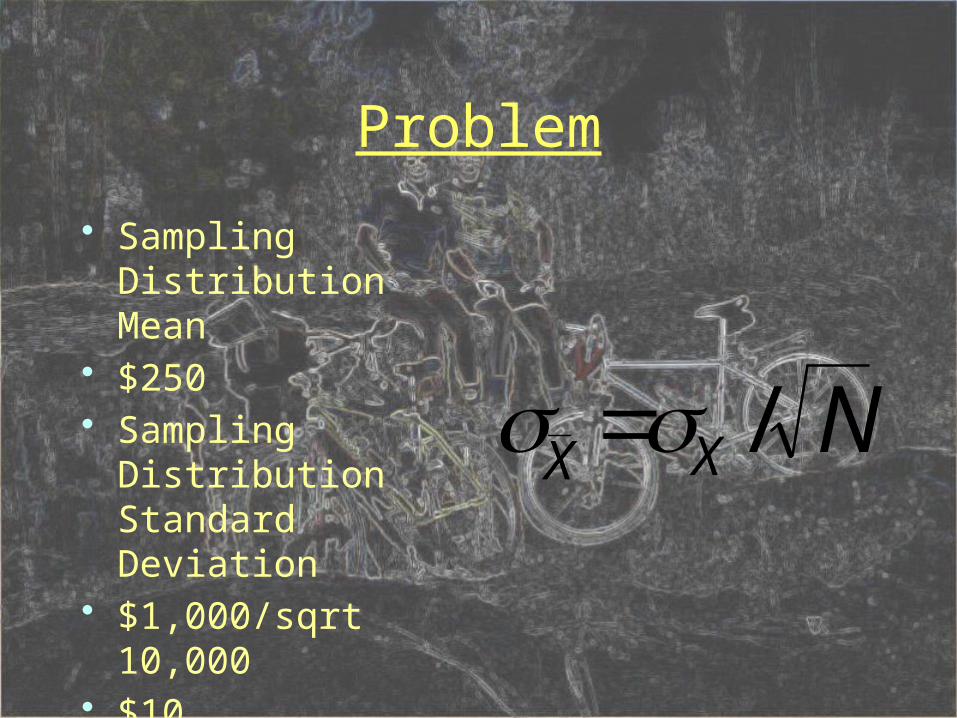
• Sampling Distribution Mean
• $250• Sampling
Distribution Standard Deviation
• $1,000/sqrt 10,000
• $10
X X N /

• Z= xbar- μ/ σ• 275-250/10• Z=2.5• To the left .9938• 99.4% certain that it
will not exceed $275

The End

Percentile score
• A percentile rank indicates the percentage of a reference or norm group obtaining scores equal to or less than the test-taker's score

Question 1

Question 2
*zX=1.5*30+125

Question 3
0.1915
=(900-800)/200 =+.5

Question 4
• One number that tells us about the spread using all the data.
• The group not the individual has a standard deviation.


18
Measuring spread with the standard deviation
• The standard deviation is the most common measure of statistical dispersion, measuring how widely spread the values in a data set are. – If many data points are close to the mean,
then the standard deviation is small;– if many data points are far from the mean,
then the standard deviation is large. • If all the data values are equal, then the
standard deviation is zero

Z=1.0 Percentile = 84%Z=2.0 Percentile = 97.7%

Wikipedia
• A percentile is the value of a variable below which a certain percent of observations fall.
• So the 20th percentile is the value (or score) below which 20 percent of the observations may be found.

Percentile
• A test score in and of itself is usually difficult to interpret.
• For example, if you learned that your score on a measure of shyness were 35 out of a possible 50, you would have little idea how shy you are compared to other people.
• More relevant is the percentage of people with lower shyness scores than yours.

65th Percentile
• If 65% of the scores were below yours, then your score would be the 65th percentile

The End