s&p global ratings aviation seminar
TRANSCRIPT

S&P Global Ratings Aviation Seminar
May 20, 2019Copyright © 2018 by S&P Global. All rights reserved.
Copyright © 2019 by S&P Global. All rights reserved.

U.S. Airlines
S&P Global Ratings Aviation Seminar
May 20, 2019
Philip Baggaley, CFA
Managing Director
Corporate Ratings
Copyright © 2019 by S&P Global.
All rights reserved.

Audience Poll
Private & Confidential 3
To what extent do you believe that the North American airline industry is, or is
not, fundamentally less risky than in the past?
A. Consolidation and better management have made the industry fundamentally more stable
and less cyclical
B. The industry is clearly more profitable, but whether it is less cyclical remains to be seen
C. The revenue picture has improved, but costs are increasing and upside is limited
D. Industry fundamentals have not really changed, although market conditions are currently
favorable

Private & Confidential 4
Jet Fuel Prices
Source: US Energy Information Administration. Jet fuel is Refiner Price to End User, expressed as $/barrel
$0
$20
$40
$60
$80
$100
$120
$140
Crude Oil and Jet Fuel Prices ($/bbl)
WTI Crude Jet Fuel

Revenues / ASM Correlates With Jet Fuel Prices
Private & Confidential 5
$0.00
$0.50
$1.00
$1.50
$2.00
$2.50
$3.00
$3.50
14.0
14.5
15.0
15.5
16.0
16.5
2013 2014 2015 2016 2017 2018
TRASM (cents) vs. Jet Fuel ($/gal.)
TRASM (left scale) Jet Fuel (right scale)
American + Delta + Southwest + United vs. U.S. Jet Fuel Prices
Source: Company Financial Reports, Energy Information Administration

Jet Fuel Prices: Recent and Forecast
Private & Confidential 6
$1.40
$1.50
$1.60
$1.70
$1.80
$1.90
$2.00
$2.10
$2.20
$2.30
$2.40
1Q2017
2Q2017
3Q2017
4Q2017
1Q2018
2Q2018
3Q2018
4Q2018
1Q2019
2Q2019F
3Q2019F
4Q2019F
1Q2020F
2Q2020F
3Q2020F
4Q2020F
Quarterly Average U.S. Jet Fuel Prices
Energy Information Administration Forecast, May 2019

S&P’s Corporate Criteria Framework
Private & Confidential 7

Assessments as of May 9, 2019
minimal modest intermediate significant aggressive highly leveraged
sati
sfa
cto
ry
excellent
strong
satisfactory
fair
weak
vu
lnera
ble
vulnerable
- investment grade * not exposed to high risk countries
Financial Risk
Bu
sin
ess R
isk o
f A
irlin
es*
fair
weak
Co
mp
etitive
Positio
n

Cash Flow / Leverage Analysis Ratios1 -- Standard Volatility
-- Core ratios---- Supplementary coverage
ratios---- Supplementary payback ratios--
FFO / debt (%)
Debt / EBITDA (x)
FFO / cashinterest (x)
EBITDA / interest (x)
OCF / debt (%)
FOCF / debt (%)
DCF / debt (%)
Minimal > 60 < 1.5 > 13 > 15 > 50 > 40 > 25
Modest 45 - 60 1.5 - 2 9 - 13 10 - 15 35 - 50 25 - 40 15 - 25
Intermediate 30 - 45 2 - 3 6 - 9 6 - 10 25 - 35 15 - 25 10 - 15
Significant 20 - 30 3 - 4 4 - 6 3 - 6 15 - 25 10 - 15 5 -10
Aggressive 12 - 20 4 - 5 2 - 4 2 - 3 10 - 15 5 - 10 2 - 5
Highly Leveraged < 12 > 5 < 2 < 2 < 10 < 5 < 2
Determining The Financial Risk Profile: Ratio Guidelines
(1) Standard & Poor’s adjusted amounts.Primary Core Ratio
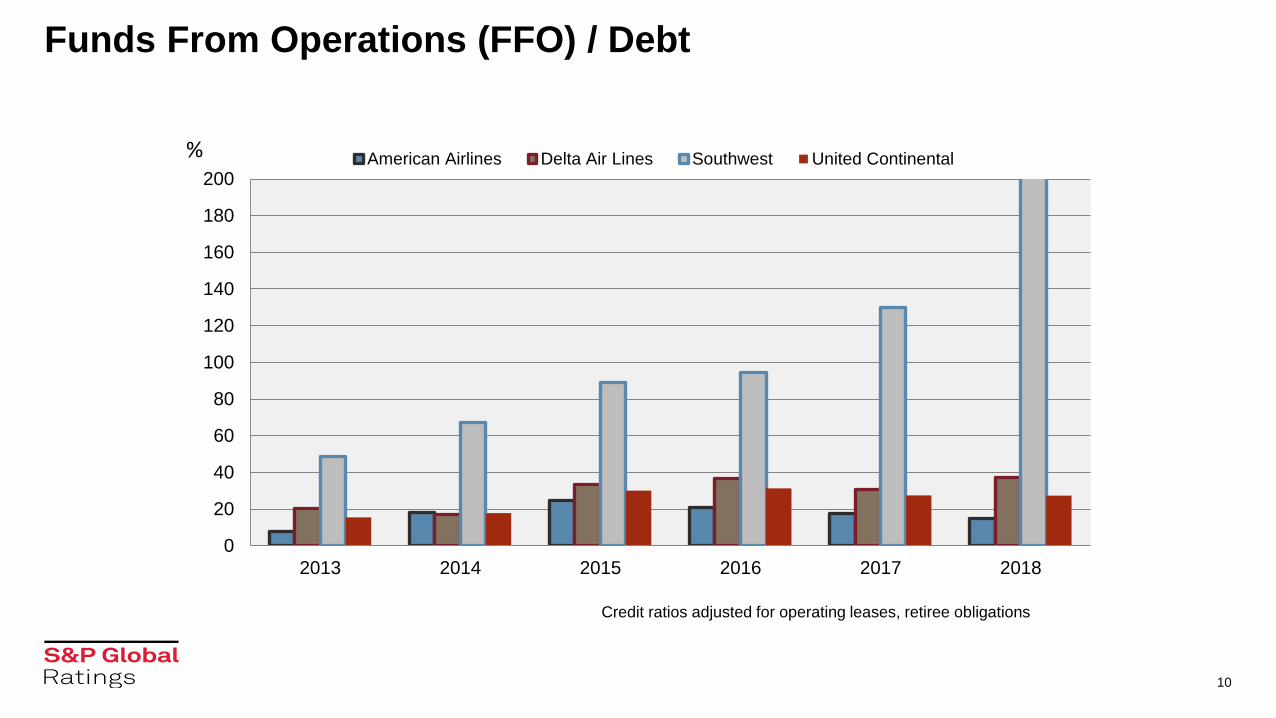
Funds From Operations (FFO) / Debt
0
20
40
60
80
100
120
140
160
180
200
2013 2014 2015 2016 2017 2018
American Airlines Delta Air Lines Southwest United Continental
10
Credit ratios adjusted for operating leases, retiree obligations
%

Funds From Operations (FFO) / Debt
0
5
10
15
20
25
30
35
40
2013 2014 2015 2016 2017 2018
American Airlines Delta Air Lines United Continental
11
Credit ratios adjusted for operating leases, retiree obligations
%

Free Operating Cash Flow (FOCF) / Debt
-50
0
50
100
150
200
2013 2014 2015 2016 2017 2018
American Airlines Delta Air Lines Southwest United Continental
12
Credit ratios adjusted for operating leases, retiree obligations
%

Free Operating Cash Flow (FOCF) / Debt
-10
-5
0
5
10
15
20
25
30
35
40
2013 2014 2015 2016 2017 2018
American Airlines Delta Air Lines United Continental
13
Credit ratios adjusted for operating leases, retiree obligations
%

Audience Poll – Our Take
Private & Confidential 14
To what extent do you believe that the North American airline industry is, or is
not, fundamentally less risky than in the past?
A. Consolidation and better management have made the industry fundamentally more stable
and less cyclical
B. The industry is clearly more profitable, but whether it is less cyclical remains to be seen
C. The revenue picture has improved, but costs are increasing and upside is limited
D. Industry fundamentals have not really changed, although market conditions are currently
favorable

When The Cycle Turns…
Private & Confidential 15
Cushions to the downside
• Oil (and jet fuel) prices would likely fall sharply
• Most airlines can dial back capacity to some extent
• Ample liquidity and generous (or absent) covenants
Some areas of concern
• Labor costs have been rising and continue upwards
• U.S. airlines have spent billions on share buybacks, foregoing debt reduction
• Vulnerability to non-economic shocks: terrorism, war, epidemic disease, cyberattacks
How Well Prepared Are U.S. Airlines?

Enhanced Equipment Trust Certificates
Private & Confidential 16
Cape Town Convention
• Avianca Brasil, continued
S&P Counterparty Criteria change
• Previously limited EETC rating to liquidity provider rating in almost all cases
• New criteria allow for greater rating elevation above “threshold rating” of liquidity
provider upgrades
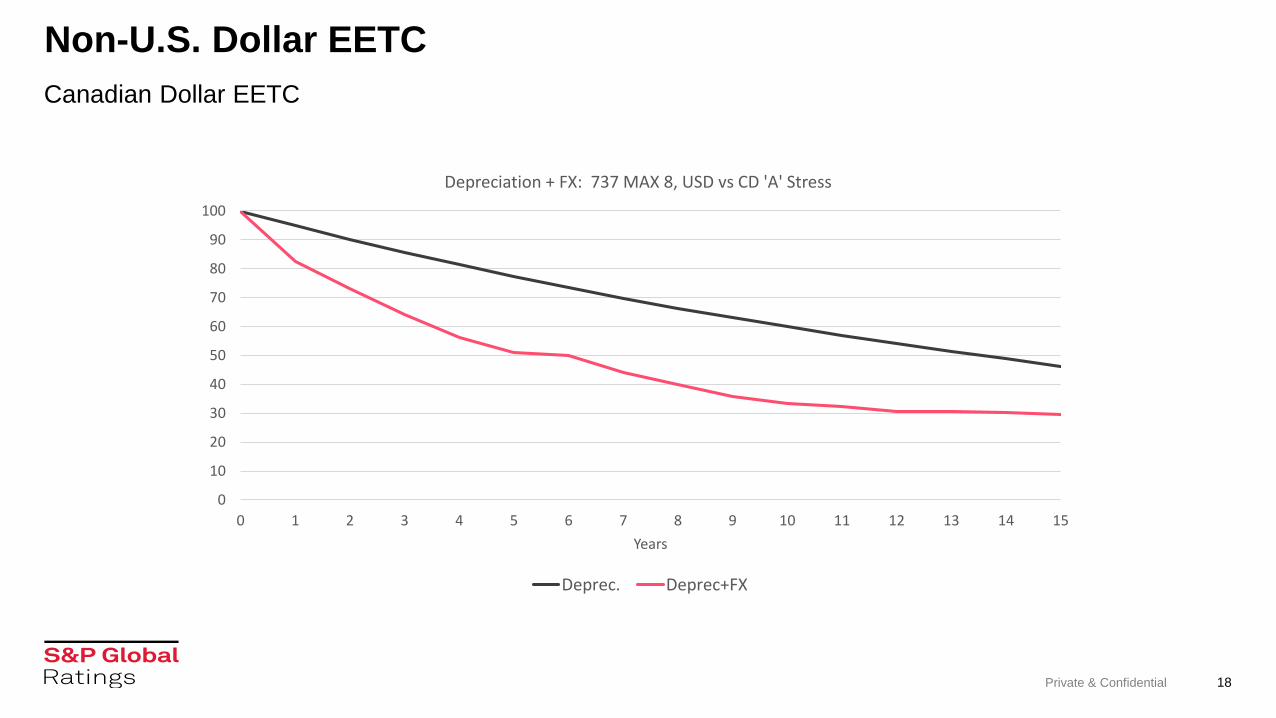
Non-US$ EETC
• Risk of $ weakening Eroding collateral value
Current Developments

Non-U.S. Dollar EETC
Private & Confidential 17
Canadian Dollar EETC
0
10
20
30
40
50
60
70
0 4 8
12
16
20
24
28
32
36
40
44
48
52
56
60
64
68
72
76
80
84
88
92
96
10
0
10
4
10
8
11
2
11
6
12
0
12
4
12
8
13
2
13
6
14
0
14
4
14
8
15
2
15
6
16
0
16
4
16
8
17
2
17
6
18
0
Months
FX Stresses (%)
AAA AA A BBB BB B
Non-U.S. Dollar EETC
Private & Confidential 18
Canadian Dollar EETC
0
10
20
30
40
50
60
70
80
90
100
0 1 2 3 4 5 6 7 8 9 10 11 12 13 14 15
Years
Depreciation + FX: 737 MAX 8, USD vs CD 'A' Stress
Deprec. Deprec+FX

Enhanced Equipment Trust Certificates
Private & Confidential 19
Bullet EETCs
• Overcollateralize to the level needed at maturity
• Increased rejection risk?
What About the 737 MAX?
• Is there a material, permanent diminution in collateral ‘quality’?
• Do the appraisers lower their base values materially?
• Might prolonged problems change an airline’s interest in keeping it?
Current Developments, continued

Canadian Airlines
S&P Global Ratings Aviation SeminarMay 20, 2019
Alessio Di Francesco, CFA
Associate Director
Corporate Ratings
Copyright © 2019 by S&P Global.
All rights reserved.

21
Air Canada vs WestJet
Credit Rating – May 20, 2019 BB+/Stable BBB-/Watch Neg
Revenue C$18.1 billion C$4.7 billion
S&P Adj. EBITDA margin 17.9% 16.8%
Available Seat Miles (ASM) 110.9 million 32.9 million
Revenue per ASM 16.3 cents 14.4 cents
CASM (excluding fuel) – CAD 11.2 cents 10.1 cents
Load Factor 83.3% 83.8%
Fleet size (as of Mar. 31, 2019) 401 182
737 MAX fleet 24 13
737 MAX % of 2019 capacity ~8% ~10%
Average age of fleet 14.8 years 8.1 years
Average Stage Lengths (miles) 1,738 860
S&P Adj. Debt-to-EBITDA 2.0x 1.7x
S&P Adj. FFO-to-Debt 42.8% 52.3%
S&P Adj. FOCF-to-Debt 16.3% 3.2%
2018 unless stated otherwise
• WestJet’s rating is one notch higher than Air Canada driven by the company’s historically stronger credit measures and profitability
• S&P placed WestJet’s ratings on Watch Negative following the recently announced acquisition by Onex.
• We believe the transaction is likely to result in more aggressive financial policies and weaker credit measures when compared to Air Canada.
• S&P upgraded Air Canada by one notch in March
• AC’s credit risk has reduced significantly from lower debt levels and improved profitability.
• We expect this trend to continue with Adj. FFO/Debt of 50%-55% in 2019 and 55%-60% in 2020
• Compared to WestJet, we believe Air Canada benefits from stronger market share, diversification, and scale.

Private & Confidential 22
Air Canada Has Closed The Profitability Gap With WestJet
0%
5%
10%
15%
20%
25%
30%
35%
0
500
1,000
1,500
2,000
2,500
3,000
3,500
06A 07A 08A 09A 10A 11A 12A 13A 14A 15A 16A 17A 18A* Q1/19LTM*
S&P
Ad
j. E
BIT
DA
Mar
gin
(%)
S&P
Ad
j. E
BIT
DA
(C$
mil
lio
ns)
EBITDA - WJA EBITDA - AC EBITDA Margin - AC EBITDA Margin - WJA
*includes IFRS 16 impact

Private & Confidential 23
Air Canada Credit Measures Have Strengthened Considerably
0%
10%
20%
30%
40%
50%
60%
0.0
2.0
4.0
6.0
8.0
10.0
12.0
06A 07A 08A 09A 10A 11A 12A 13A 14A 15A 16A 17A 18A* Q1/19LTM*
S&P
Ad
j. F
FO-t
o-D
eb
t (%
)
S&P
Ad
j. D
eb
t-to
-EB
ITD
A (x
)
Debt/EBITDA - WJA Debt/EBITDA - AC FFO/Debt - AC FFO/Debt - WJA
WJA BBB- BBB- BBB- BBB- BBB- BBB- BBB- BBB- BBB- BBB- BBB- BBB- BBB- BBB-
AC B B B CCC+ B- B- B- B- B B+ BB- BB- BB BB+
*includes IFRS 16 impact

24
Update On The 737 MAX Grounding
On March 13, 2019, Canada joined many other countries in grounding the 737 MAX aircraft.
Air Canada and WestJet are removing the 737 MAX from their schedules until at least July 31, 2019 and
suspended their public guidance for the year.
WestJet should be more adversely impacted as the 737 MAX represents a larger portion of its fleet
• WestJet has 13 737 MAX aircraft that represent ~10% of 2019 capacity
• Air Canada has 24 737 MAX aircraft that represent ~8% of 2019 capacity
We anticipate the grounding to have a moderate impact on 2019 results in the form of lower capacity
and fuel efficiency as well as higher costs related to flight cancelations and reschedules.
Steps to mitigate operating disruptions include:
• Redeploy underutilized aircraft from less profitable routes to fill capacity gaps
• Extend aircraft leases to meet demand in the busy summer months
• Defer certain cabin upgrades and maintenance
If regulators sign off on a return to service, we expect it would take several weeks before Air Canada and
WestJet could get all MAX’s back in the air and that their return to service should be gradual. We also
believe it could take time for passengers to regain confidence in the aircraft

IMO 2020
The Tsunami Approaches
S&P Global Platts Analytics
Lenny Rodriguez
Team Lead
Arbitrage & Latin American Oil
S&P Global Ratings Aviation Seminar
May 20, 2019
Copyright © 2019 by S&P Global.
All rights reserved.

Global bunker fuel specs will tighten in 2020 forcing
widespread disruptive changes within and beyond the oil
industry
• Around 3.5 MMB/D of high sulfur residual fuel oil will be affected
• Most will change to low sulfur blends/gasoil
• Scrubbers increasing but not enough for 2020; LNG limited to small fraction
• Spec change will occur despite counterarguments, compliance concerns
• Multiple forces will push toward higher compliance
• Non-compliance and waivers will likely have only a small impact on HS bunker demand
• Impact will drive price, trade, operations
• Refining industry will be severely stretched; trade patterns will change
• Light product prices spike, HSFO prices fall, LS-HS spreads widen
• Freight costs for all goods increase; ripple effects in other industries
Up to $1 trillion transfer from consumers & HS crude producers to refiners & LS producers**
** 5 year total, net oil price impact only

Global bunker fuel spec changes in 2020 will force ~3 MMB/D of
HSFO to switch to LSFO and distillates
0
1
2
3
4
5
6
7
8
2010 2015 2020 2025 2030
High Sulfur Residual Fuel Oil
Distillates
Dist for Blending
LS HFO
0.5%S
LSFO
and
Blends
Global Bunker Demand, MMB/D
LNG

There are multiple options for compliance with the new IMO
bunker fuels specification
● Purchase/use compliant fuels
• 0.5%S bunkers for open seas and 0.1%S in ECAs
● Invest in scrubbers
• Scrubber penetration to date somewhat limited
• Installations to date mostly ferries/cruise ships in ECAs, but spreading to larger ships
• Known/planned scrubbers will be in 2200 vessels by 1/1/2020 = 500 MB/D of Fuel Oil
● Invest in Dual Fuel engines capable of burning LNG or liquid fuels
• LNG bunker use rare (except for LNG carriers) due lack of delivery infrastructure
● Seek waivers or disregard new standard (non-compliance)

Multiple refining factors will be needed to meet 2020 demand
including higher crude runs leading to higher crude prices
Maximizing distillate
Increase distillates yield (+1% yield)
Increase HCU and Coker Utilization
Increase Crude throughput (more distillates, lightends and fuel oil)
Maximize LSFO Production
Segregation of low sulfur crudes
Maximize residue desulfurization capacity
Displace LS VGO and LSLR from FCCU runs for Fuel Oil Blend Stock
Minimize HSFO/HSLR Production
Increase fuel oil destruction through higher complex capacity utilization (i.e., coking)
Shifting fuel oil pool from viscosity-limited to sulfur-limited
Increase HSFO sales for non-Bunkers use

Decline in Fuel Oil demand due to IMO 2020 will be offset by the significant increase in Gasoil demand
-1.0
-0.5
0.0
0.5
1.0
1.5
2.0
2.5
3.0
1Q18 2Q18 3Q18 4Q18 1Q19 2Q19 3Q19 4Q19 1Q20 2Q20 3Q20 4Q20
Other Residual Fuel Oil Distillates JK Gasoline Naphtha LPG
MM
B/D
1.491.791.59
1.26
In absence of IMO spec
change, oil demand would
slow down further in 2020
1.79
-0.38
-0.15
1.26
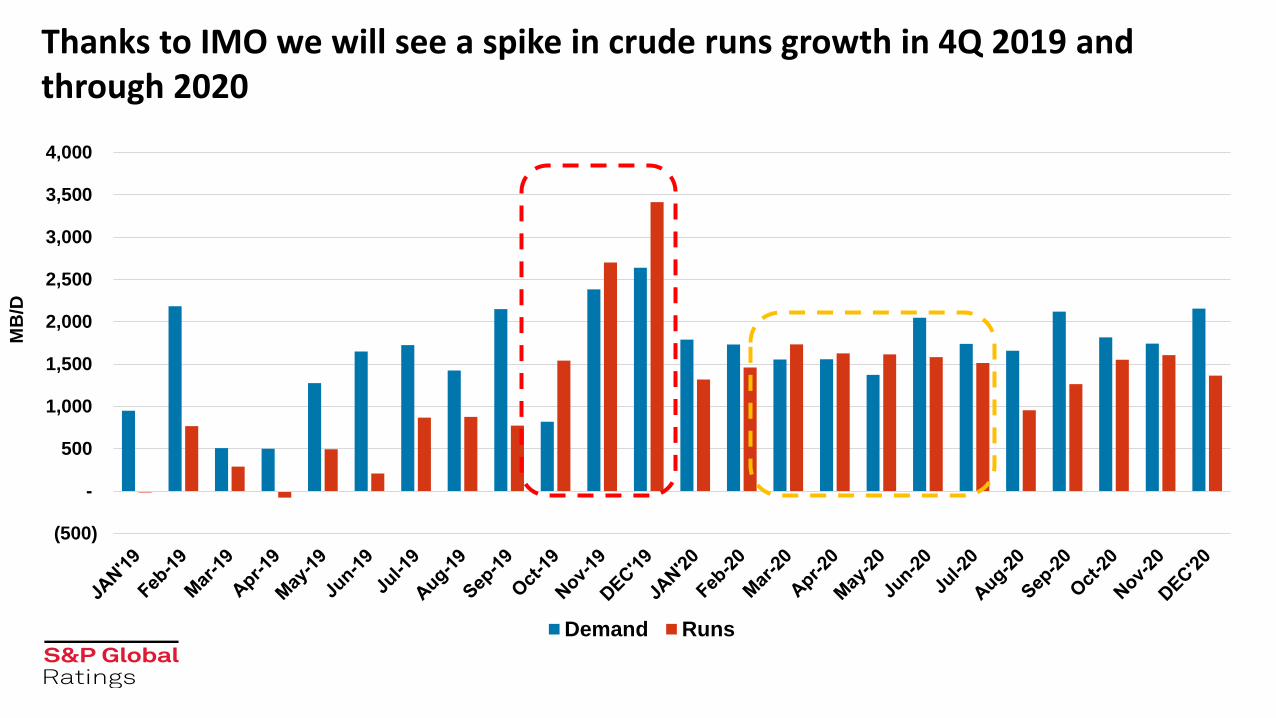
(500)
-
500
1,000
1,500
2,000
2,500
3,000
3,500
4,000
Demand Runs
Thanks to IMO we will see a spike in crude runs growth in 4Q 2019 and through 2020
MB
/D

The IMO Tsunami Approaches…
-5
-4
-3
-2
-1
0
1
2
3
4
5
-40
-30
-20
-10
0
10
20
30
40
Jan-19 Apr-19 Jul-19 Oct-19 Jan-20 Apr-20 Jul-20 Oct-20
Th
ou
sa
nd
s
HSFO LS Residuals LS Gasoil for blends MGO
MGO
$/Bbl
HS carriage ban
HSFO arb to Asia
collapses
HSFO
Blends
Diesel vs Brent
HSFO vs Brent
Bunker Demand, MMB/D

Middle distillates ease in 1H19 but then soar late in 2019 and peak
in 1H20 with IMO 2020. Forward curve does not reflect this
5
10
15
20
25
30
35
Jan-18 Jan-19 Jan-20
ARA ULSD vs Dated Brent
ICE Forward Curve - Apr 19 Forecast - Prompt
$/Bbl
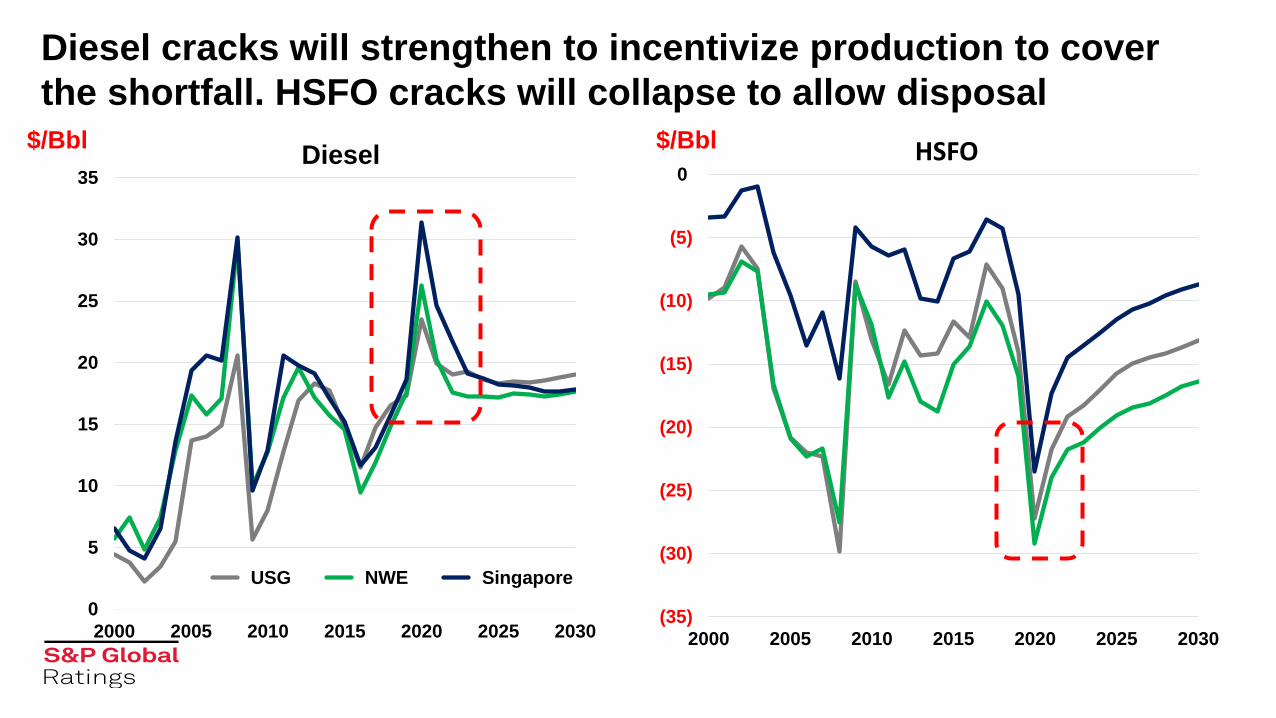
(35)
(30)
(25)
(20)
(15)
(10)
(5)
0
2000 2005 2010 2015 2020 2025 2030
0
5
10
15
20
25
30
35
2000 2005 2010 2015 2020 2025 2030
USG NWE Singapore
Diesel
Diesel cracks will strengthen to incentivize production to cover
the shortfall. HSFO cracks will collapse to allow disposal$/Bbl HSFO$/Bbl
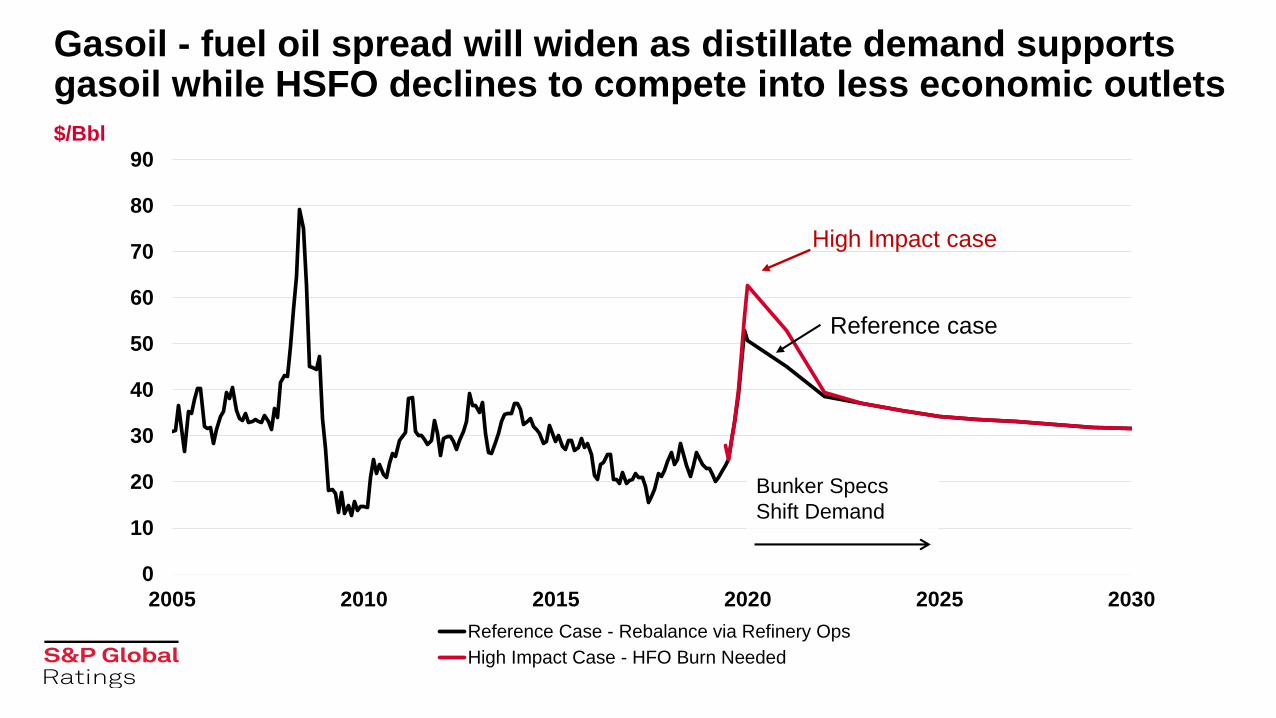
0
10
20
30
40
50
60
70
80
90
2005 2010 2015 2020 2025 2030
Reference Case - Rebalance via Refinery Ops
High Impact Case - HFO Burn Needed
Bunker Specs
Shift Demand
$/Bbl
Gasoil - fuel oil spread will widen as distillate demand supports gasoil while HSFO declines to compete into less economic outlets
Reference case
High Impact case

0
5
10
15
20
25
30
35
2000 2005 2010 2015 2020 2025 2030
USG NWE Singapore
Gasoline cracks get some support from IMO 2020 as FCC feed
tightens; jet fuel cracks soar tracking LS diesel $/Bbl Gasoline
0
5
10
15
20
25
30
35
2000 2005 2010 2015 2020 2025 2030
Jet Fuel$/Bbl

-5
0
5
10
15
20
2000 2005 2010 2015 2020 2025 2030 2035 2040
NWE Urals Cracking Singapore Dubai Cracking
Singapore Dubai Simple
Cracking
Sour crude
Hydroskimming
Conversion margins will soar with changes in product cracks &
crude differentials before quickly returning to historical trends
Europe and Asia Margins Constant $/Bbl Constant $/Bbl
0
5
10
15
20
25
2000 2005 2010 2015 2020 2025 2030 2035 2040
USG Margins
USG LLS Cracking USG Maya Coking
Cracking
Coking

Freight rates will increase with higher fuel costs, increased tonne miles and tighter availability due to scrappage & floating storage
0.00
0.50
1.00
1.50
2.00
2.50
3.00
3.50
VLCC-WAFR to Asia Suezmax-WAFR toUKC
MR-NWE to USAC
HSFO 0.5% @ +$200/ton0.5% @+$300/ton 0.5% @+$400/ton
Flat rates, $/MT
0
5
10
15
20
25
30
35
40
45
50
2000 2005 2010 2015 2020 2025
WAFR to Asia WAFR to UKC NWE to USAC
Transport Cost, $/Bbl

2019 Global Jet Fuel prices expected to track similar to last year
thru the Fall but supported later by the IMO 2020 diesel pull
30
40
50
60
70
80
90
100
110
120
Jan Feb Mar Apr May Jun Jul Aug Sep Oct Nov Dec
USGC Jet Fuel Price Forecast
2017 2018 2019 2020
$/Bbl
IMO 2020 effectkicks in 4Q19
30
40
50
60
70
80
90
100
110
120
Jan
-17
Ap
r-1
7
Jul-
17
Oct
-17
Jan
-18
Ap
r-1
8
Jul-
18
Oct
-18
Jan
-19
Ap
r-1
9
Jul-
19
Oct
-19
Jan
-20
Ap
r-2
0
Jul-
20
Oct
-20
USGC Jet Fuel Price Buildup
USGC Jet Crack LLS
$/Bbl

Global jet fuel demand growth to stay healthy in 2020 despite IMO
impact
0
1000
2000
3000
4000
5000
6000
7000
8000
9000
2018 2019 2020
ME/Africa Europe/FSU Latin America China Asia (ex. China) US/CanadaMB/D
175 MB/D190 MB/D

Commercial Aerospace
Outlook
S&P Global Ratings Aviation Seminar
May 20, 2019
Christopher DeNicolo, CFA
Senior Director
Lead Aerospace & Defense Analyst
Copyright © 2019 by S&P Global.
All rights reserved.

737 MAX Grounding: Update
Oct. 29, 2018 Lion Air accident
March 10, 2019 Ethiopian Airlines accident
March 11, 2019 China grounds MAX
March 13, 2019 FAA grounds MAX, Boeing suspends deliveries
April 4, 2019 Preliminary Ethiopian findings
April 5, 2019 Boeing lowers production to 42/month from 52/month
April 29, 2019 FAA stands up global group to review MCAS software update
42

737 MAX Grounding: Boeing Impact
Sufficient liquidity and cushion in rating to survive crisis
• $7.7 billion of cash and $5.1 billion of revolver at March 31, 2019
• Put in temporary $1.5 billion revolver
• Raised $3.5 billion new debt
• Suspended share repo
1Q impact moderate, but worst yet to come as inventories build and other costs mount
Temporary production cut conserves some cash and helps preserve supply chain
China Airbus order, Garuda cancellation likely not start of more lost sales
Long term impacts
• Reputation
• Market Share
• NMA/777X
• Investigations
43

737 MAX Grounding: Supplier Impact
Impact will vary by supplier
Spirit AeroSystems and GE/CFM staying at 52/month
Could help some suppliers who were behind catch up (e.g. castings/forgings, engines)
Likely help from Boeing, tier 1 suppliers for lower tier suppliers
Cost drag as most were already prepared for jump to 57/month
Lower aftermarket provisioning
44

Audience Poll
When do you think Boeing will resume deliveries of the 737 MAX?
A. June 2019
B. September 2019
C. December 2019
D. After December 2019
45

737 MAX Grounding: Things to Watch For
• FAA certification of updated software
• Approval by other global regulatory
agencies
• Boeing resumes deliveries
• Airlines resume flying
• Restored trust of airlines, pilots,
regulators, flying public
• Final outcome of accident
investigations, investigations of
certification process
• Boeing increases production to
57/month
• Order cancellations
46
Source: Boeing website
Middle East/Africa8%
US23%
North and Central America (ex US)
6%
South America3%China
2%Asia (ex China)
23%
Europe15%
Unidentified20%
737 Backlog by Region (March 2019)

Order Cycle Has Peaked
47

Air Traffic Slowing, But Remains Strong
48
Source: IATA
0%
1%
2%
3%
4%
5%
6%
7%
8%
9%
10%
Jan-18 Feb-18 Mar-18 Apr-18 May-18 Jun-18 Jul-18 Aug-18 Sep-18 Oct-18 Nov-18 Dec-18 Jan-19 Feb-19 Mar-19
Global Passenger Traffic Growth
YoY Change Historical Average

Long Wait For Popular Aircraft
49
Source: Manufacturers' websites, S&P Global estimates
0 1 2 3 4 5 6 7 8 9
B737
A320
B767
A330
B787
B777
A350
B747
Years Backlog at Planned Near Term Production Rates

Some uptick in airline failures, cancellations, deferrals
Failures
• WOW Air
• Avianca Brasil
• Jet Airways (125 737 MAX, 10 787-9, 5 A330 on order)
• Germania
• Flybmi
• Flybe
Cancellations/deferrals
• Garuda (cancel 49 737 MAX)
• Emirates (cancel 39 A380)
• Etihad (cancel 42 A380, 42 A350)
• American (defer 40 737 MAX, 22 A321neo)
• Air New Zealand (defer 3 A320/A321neo, 2 widebodies)
50

Audience Poll
Where are we in the aircraft delivery cycle?
A. Near peak
B. Past peak
C. Plateauing
D. What cycle?
51

Delivery Increase in 2019 Tempered by MAX Grounding?
52
?

Supply Chain Key Risk to Higher Production
Delays of 737 MAX deliveries last year due to engine, fuselage issues
• Temporary production cut may provide some relief
Continuing delays to A320neo deliveries due to engines
Engine delays due mostly to constraints at casting/forging suppliers
Interiors also causing issues, especially for widebodies
Some suppliers straining to increase production profitably
Pricing pressures are increasing
• Boeing’s “partnering for success” program
• Spirit AeroSystems making suppliers rebid with 15%-35% lower prices
• OEMs need to balance lower costs with disrupting production
53

Boeing Redefining Supplier/OEM Relationship
Trying to capture more life cycle value of aircraft, increase control of development and
production process
Went too far with 787 outsourcing
Vertical integration (e.g. 777X wing, 737 actuators, nacelles, avionics, seats, APUs)
Expanding into aftermarket
• “All about the parts”
• Trying to keep more IP
• Component repair
Suppliers responding by consolidating, repositioning
Winners and losers will become clear on next new aircraft
54

M&A
Airbus bought C-Series (now A220) to expand product line
Boeing pursuing combination with Embraer to get access to engineers, faster development
process
Boeing bought KLX to expand parts distribution business
Supplier consolidation
• UTC bought Rockwell Collins to broaden product line in response to pressures from OEMs, now splitting up
aerospace, commercial business
• Spirit AeroSystems buying Asco to improve diversity, increase defense, fabrication work
• TransDigm bought Esterline
• More likely
55

Boeing Still Evaluating Launch of NMA
Trying to close business case to
produce aircraft airlines want, at a price
they will pay, that is still profitable
Originally ATO this year, launch next
year, and first delivery 2025 to take
advantage of 757/767 replacement cycle
Competition from A321neo at low end
and own 787 at upper end
Choice of engine?
Impact of MAX grounding
• Certification
• Resource constraints
• New narrowbody instead?
56
Source: Boeing Capital Financiers and Investors Conference, April 9, 2019

Other Markets Mostly Weak
Business jet market weak, but seeing signs of life?
• Small and mid-sized demand still weak, but improving
• Large cabin solid
• New models supporting modest production growth
Regional jets
• Some demand for larger jets
• 50-seat replacement?
Helicopters
• Significant impact from lower oil prices, especially for larger helicopters
Aftermarket
• Solid traffic growth should support demand, but uneven due to airline and distributor inventory management
• Airline profitability could drive more refurbishment demand
57
Future Competitors?
Russia and China had first flights of the MC-21 and C919 narrowbodies last year, but first
deliveries still a few years out
Possibly competitors to 737/A320, but questions about performance, reliability, and support
likely to limit customers to home country and allies in developing countries that can’t afford
Western jets
• Chinese government could force local airlines to use C919 instead of buying Airbus or Boeing jets
Russia and China formed joint venture to build larger jet
Mitsubishi Regional Jet repeatedly delayed
58

US Commercial Aerospace Outlook Distribution
59
Source: S&P Global RatingsAs of May 8, 2019
Stable68%
Positive4%
Negative28%

Credit Quality Stable to Somewhat Negative Overall
MAX grounding impact
Supplier earnings and cash flow has not benefited from solid demand the past few years due
to investments to support higher rates and operational problems resulting in some
downgrades or outlook changes
Industry changes likely to put further pressures on supplier credit quality
M&A impact on credit quality
60

Aircraft Leasing
S&P Global Ratings Aviation Seminar
May 20, 2019
Betsy Snyder, CFA
Director
Corporate Ratings
Copyright © 2019 by S&P Global.
All rights reserved.

Boeing Global Forecast 2018-2037
Source: Boeing Commercial Market Outlook

Airbus Global Forecast 2018-2037
Source: Airbus Global Market Forecast

Annual growth forecast at around 5%
Global population growth
Middle class growth with more disposable income
All age segments
Trips per capita in 2017
• U.S.: 1.9
• China: 0.4
• India: 0.1
Estimated 250 million new passengers in 2019
Global Air Traffic Growth Continues Strong And
Above Long-term Trends

Lessor Share Of Global Fleet
Source: Boeing Capital Corp.
Source: Boeing Current Aircraft Finance Market Outlook
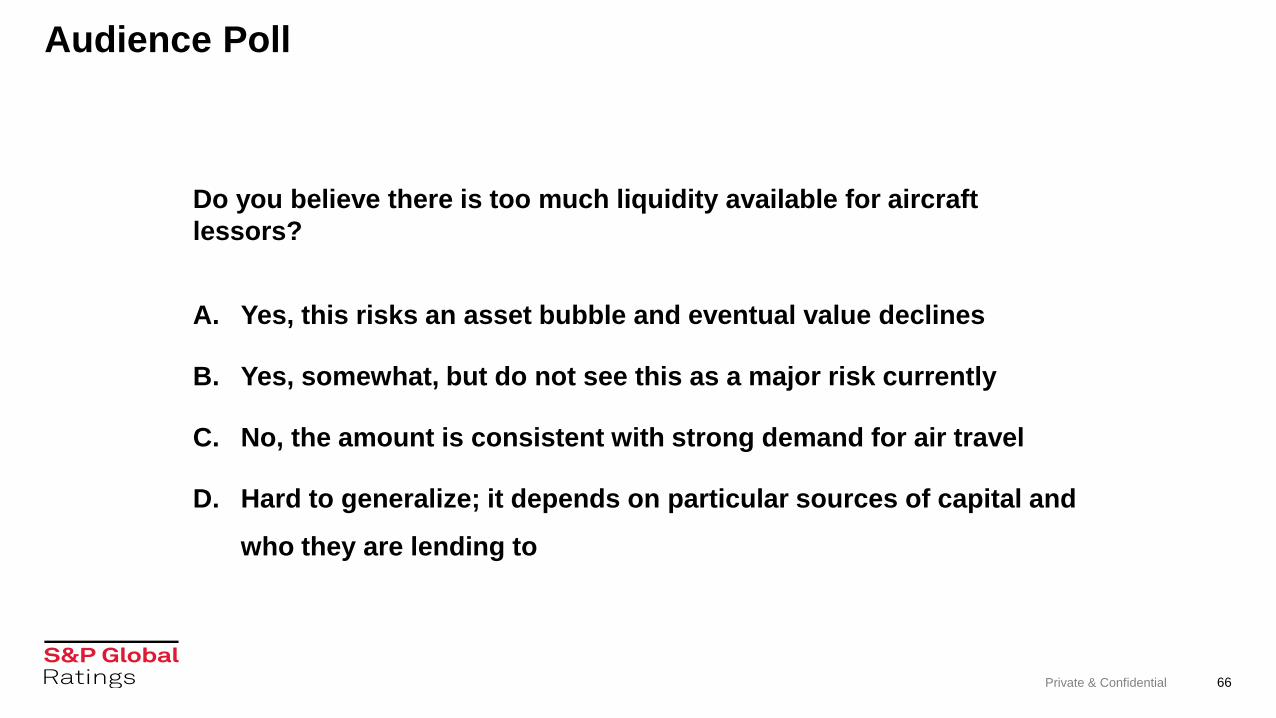
Audience Poll
Private & Confidential 66
Do you believe there is too much liquidity available for aircraft
lessors?
A. Yes, this risks an asset bubble and eventual value declines
B. Yes, somewhat, but do not see this as a major risk currently
C. No, the amount is consistent with strong demand for air travel
D. Hard to generalize; it depends on particular sources of capital and
who they are lending to

Private & Confidential 67
Lessor Sources of Financing
Source: Boeing Current Aircraft Finance Market Outlook
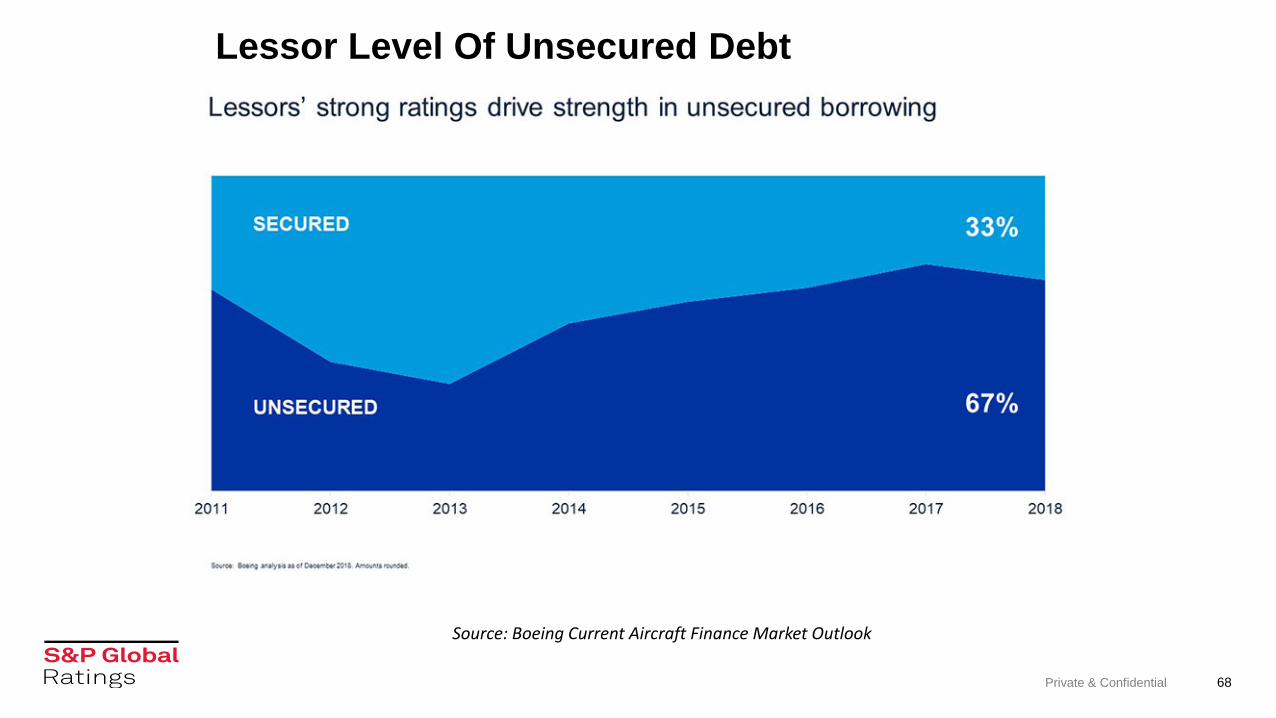
Private & Confidential 68
Lessor Level Of Unsecured Debt
Source: Boeing Current Aircraft Finance Market Outlook
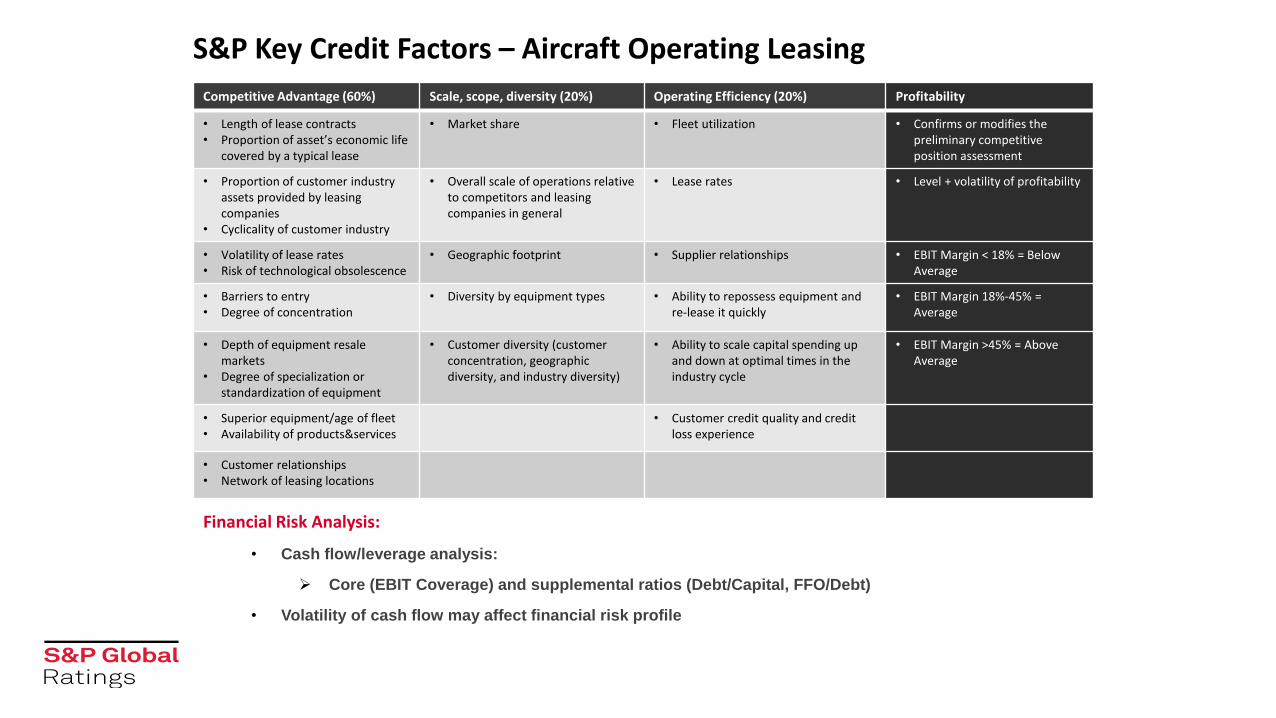
S&P Key Credit Factors – Aircraft Operating Leasing
Financial Risk Analysis:
• Cash flow/leverage analysis:
Core (EBIT Coverage) and supplemental ratios (Debt/Capital, FFO/Debt)
• Volatility of cash flow may affect financial risk profile
Competitive Advantage (60%) Scale, scope, diversity (20%) Operating Efficiency (20%) Profitability
• Length of lease contracts• Proportion of asset’s economic life
covered by a typical lease
• Market share • Fleet utilization • Confirms or modifies the preliminary competitive position assessment
• Proportion of customer industry assets provided by leasing companies
• Cyclicality of customer industry
• Overall scale of operations relative to competitors and leasing companies in general
• Lease rates • Level + volatility of profitability
• Volatility of lease rates• Risk of technological obsolescence
• Geographic footprint • Supplier relationships • EBIT Margin < 18% = BelowAverage
• Barriers to entry• Degree of concentration
• Diversity by equipment types • Ability to repossess equipment and re-lease it quickly
• EBIT Margin 18%-45% = Average
• Depth of equipment resale markets
• Degree of specialization or standardization of equipment
• Customer diversity (customer concentration, geographic diversity, and industry diversity)
• Ability to scale capital spending up and down at optimal times in the industry cycle
• EBIT Margin >45% = Above Average
• Superior equipment/age of fleet• Availability of products&services
• Customer credit quality and credit loss experience
• Customer relationships• Network of leasing locations

S&P’s Operating Leasing Criteria Framework
Private & Confidential 70
Competitive Advantage
Scale, Scope & Diversity
Operating Efficiency
Profitability: EBIT Margin,
Volatility
Core: Volatility adjusted
EBIT/Interest
Supplemental: Debt/Capital
FFO/Debt

Aircraft Lessors Issuer Credit Ratings
Business Risk Profile
Financial Risk Profile
Minimal Modest Intermediate Significant Aggressive Highly Leveraged
Excellent
Strong
Satisfactory
BOC Aviation Ltd. (A-)*
Air Lease Corp. (BBB)
Aviation Capital Group Corp. (A-)*
SMBC Aviation Capital Ltd. (A-)*
AerCap Holdings N.V. (BBB-)
Aircastle Ltd. (BBB-)
Avolon Holdings Ltd. (BBB-)
Dubai Aerospace Enterprise Ltd. (BB+)
Fair Fly Leasing Ltd. (BB-)
Weak Avation PLC (B+)Voyager (Intrepid)
(B+)
Vulnerable
As of 5/17/2019 * Incorporates three notches of parent support

Sector Outlook:
• Global air traffic growth continues strong and above long-term trends
• Demand remains strong for narrowbody (single-aisle) planes, somewhat softer for widebody
(twin-aisle)
• Oil price decline from several years ago has narrowed lease rate premium for fuel efficient
new technology planes, but demand remains strong for them
• Lessors have so far managed repossessions well
• Consolidation, aircraft portfolio sales
Credit Outlook:
• Relatively stable credit metrics forecast; all rating outlooks positive or stable
• Rising interest rates should not present a problem, so long as they are not sudden and
unexpected
• Potential Chinese tariffs on Boeing aircraft
• Potential impact of Boeing 737 MAX grounding
• Ample liquidity has driven up values and driven down lease rates; some risk of disruption
when new entrants face a downturn with limited staff and experience
Aircraft Lessors

Aircraft ABS
S&P Global Ratings Aviation Seminar
May 20, 2019
Belinda Ghetti
Analytical Leader
Structured Finance / Non-Traditional
Kate Scanlin
Senior Director
Structured Finance / Non- Traditional

2019 Themes
Observations in new issuance transactions
Considerations with maintenance cash flows
Appraisal valuation differences
Airline-owned vs. airline-leased aircraft economic life
Performance of existing book
Impact of recent credit events
74

Copyright © 2019 by Standard & Poor’s Financial Services LLC. All rights reserved.
No content (including ratings, credit-related analyses and data, valuations, model, software or other application or output therefrom) or any part thereof (Content) may be modified, reverse
engineered, reproduced or distributed in any form by any means, or stored in a database or retrieval system, without the prior written permission of Standard & Poor’s Financial Services LLC or
its affiliates (collectively, S&P). The Content shall not be used for any unlawful or unauthorized purposes. S&P and any third-party providers, as well as their directors, officers, shareholders,
employees or agents (collectively S&P Parties) do not guarantee the accuracy, completeness, timeliness or availability of the Content. S&P Parties are not responsible for any errors or
omissions (negligent or otherwise), regardless of the cause, for the results obtained from the use of the Content, or for the security or maintenance of any data input by the user. The Content is
provided on an “as is” basis. S&P PARTIES DISCLAIM ANY AND ALL EXPRESS OR IMPLIED WARRANTIES, INCLUDING, BUT NOT LIMITED TO, ANY WARRANTIES OF
MERCHANTABILITY OR FITNESS FOR A PARTICULAR PURPOSE OR USE, FREEDOM FROM BUGS, SOFTWARE ERRORS OR DEFECTS, THAT THE CONTENT’S FUNCTIONING WILL
BE UNINTERRUPTED OR THAT THE CONTENT WILL OPERATE WITH ANY SOFTWARE OR HARDWARE CONFIGURATION. In no event shall S&P Parties be liable to any party for any
direct, indirect, incidental, exemplary, compensatory, punitive, special or consequential damages, costs, expenses, legal fees, or losses (including, without limitation, lost income or lost profits
and opportunity costs or losses caused by negligence) in connection with any use of the Content even if advised of the possibility of such damages.
Credit-related and other analyses, including ratings, and statements in the Content are statements of opinion as of the date they are expressed and not statements of fact. S&P’s opinions,
analyses and rating acknowledgment decisions (described below) are not recommendations to purchase, hold, or sell any securities or to make any investment decisions, and do not address the
suitability of any security. S&P assumes no obligation to update the Content following publication in any form or format. The Content should not be relied on and is not a substitute for the skill,
judgment and experience of the user, its management, employees, advisors and/or clients when making investment and other business decisions. S&P does not act as a fiduciary or an
investment advisor except where registered as such. While S&P has obtained information from sources it believes to be reliable, S&P does not perform an audit and undertakes no duty of due
diligence or independent verification of any information it receives.
To the extent that regulatory authorities allow a rating agency to acknowledge in one jurisdiction a rating issued in another jurisdiction for certain regulatory purposes, S&P reserves the right to
assign, withdraw or suspend such acknowledgement at any time and in its sole discretion. S&P Parties disclaim any duty whatsoever arising out of the assignment, withdrawal or suspension of
an acknowledgment as well as any liability for any damage alleged to have been suffered on account thereof.
S&P keeps certain activities of its business units separate from each other in order to preserve the independence and objectivity of their respective activities. As a result, certain business units of
S&P may have information that is not available to other S&P business units. S&P has established policies and procedures to maintain the confidentiality of certain non-public information received
in connection with each analytical process.
S&P may receive compensation for its ratings and certain analyses, normally from issuers or underwriters of securities or from obligors. S&P reserves the right to disseminate its opinions and
analyses. S&P's public ratings and analyses are made available on its Web sites, www.standardandpoors.com (free of charge), and www.ratingsdirect.com and www.globalcreditportal.com
(subscription), and may be distributed through other means, including via S&P publications and third-party redistributors. Additional information about our ratings fees is available at
www.standardandpoors.com/usratingsfees.
Australia
Standard & Poor's (Australia) Pty. Ltd. holds Australian financial services license number 337565 under the Corporations Act 2001. Standard & Poor’s credit ratings and related research are not
intended for and must not be distributed to any person in Australia other than a wholesale client (as defined in Chapter 7 of the Corporations Act).
STANDARD & POOR’S, S&P and RATINGSDIRECT are registered trademarks of Standard & Poor’s Financial Services LLC.
75