samsmriti - sambhram group of institutions on asset allocation pattern of retail investors of...
TRANSCRIPT


SAMSMRITI – The SAMS Journal
EDITORIAL BOARD
Chief Patron
Mr. R Venkatesh, Chairman, Sambhram Group of Institutions, Bangalore
Patron
Mr. V Nagaraj, Vice – Chairman, Sambhram Group of Institutions, Bangalore
Editor - in – Chief
Dr. K C Mishra, Director , Sambhram School of Management, Bangalore
Editorial Advisory Board
Prof. K B Akhilesh, Professor, Department of Management Studies, Indian Institute of Science, Bangalore
Prof. G M Naidu, Professor Emeritus of Marketing, University of Wisconsin – Whitewater, USA
Prof. Raghuvir Dutt Pathak, Head, Graduate School of Business, The University of the South Pacific, Suva, Fiji
Prof. Kamal Nayan Agarwal, Head, School of Business, Howard University, Washington DC
Prof. Normah Omar, Director, Accounting Research Institute,Universiti Teknologi MARA, Selangor, Malaysia
Prof. Vishal Gupta, Professor,School of Management,State University of New York – Binghamton
Associate Editors
Dr. Zabiulla, Associate Professor, Sambhram School of Management, Bangalore
Prof. H A Raghavendra, Associate Professor, Sambhram School of Management, Bangalore
Prof. Rema Narayanswamy, Associate Professor, Sambhram School of Management, Bangalore
SAMSMRITI –The SAMS Journal is a peer reviewed
Bi-Annual flagship publication of Sambhram
Academy of Management Studies, Bangalore
published in January and July every year; the aim
is to connect to the Management Fraternity—
Academia, Corporate Houses, Public Institutions,
NGOs and Civil Society and the Government: by
way of motivating basic and applied research and
publishing rigorous, clear and widely accessible
articles concerning business management and
broader society. It culminates creating a platform
for researchers, academicians and practitioners
from diverse domains of management to share
research achievements and practical experiences
to stimulate scholarly debate in the development
of management science and decision making. It also
endeavors to promote and disseminate knowledge
in the complex multi-disciplinary management field.
Views expressed by contributors are not
necessarily views espoused by SAMS, Bangalore,
India. It is always an attempt to see to ensure that
papers published do not contain plagiarized
materials. The ultimate onus for ensuring that no
plagiarism has been resorted to, however, rests
with the authors of published pieces.
CONTACT ADDRESS
The Editor-in-Chief
SAMSMRITI – The SAMS Journal,
Sambhram School of Management,
Sambhram Academy of Management and Studies
M. S. Palya, Via Jalahalli East, Bangalore - 560097
Ph-91-80-6450 7087
Email- [email protected]
Website-www.sambhram.org

SAMBHRAM GROUP OF INSTITUTIONS
In 1991 a group of experts who were a perfect blend from industry and academic forayed in to Higher
Education and established Sambhram Group of Institutions (SGI) at Bangalore. The team led by the
founder Chairman Sri R. Venkatesh, consists of eminent educationists, distinguished personalities and
philanthropists with a global perspective who have laid solid foundation and are nurturing it to grow
phenomenally. The SGI forayed into Higher Education sector and established its cradle in the IT hub
Bangalore launching the Management Program at the outset.
With a humble and genuine beginning the SGI from then till now have the following Institutions under its
aegis:
Sambhram School of Management- Bangalore(Post Graduate Wing)
Sambhram Academy of Management Studies(SAMS)- Bangalore
Sambhram Institute of Technology - Bangalore
Sambhram College of Hotel Management - KGF
Sambhram Institute of Medical Sciences and Research- KGF
KGF College of Dental Sciences and Hospital-KGF
Sambhram College of Nursing-KGF
Sambhram Pre-University College – Bangalore
Sambhram Degree College -Chittoor
Sambhram Junior College - Chittoor
Sambhram International School-Chittoor
SAMBHRAM SCHOOL OF MANAGEMENT
Sambhram School of Management is the Post Graduate Wing of Commerce and Management offering MBA
and M.Com Programs affiliated to Bangalore University. The Programs are accredited by NAAC and
recognized by AICTE, New Delhi; started in 1999 with a vision to impart education in the field of
professional management with the mission of providing work-oriented education combined with ethical
values and character building in the context of new millennium and successfully marched towards
creating its brand name, popularity and reputation in the competitive academic world.
The School is marching towards excellence in all its spheres ranging from teaching to research and
consultancy to gain competitive edge in a socially responsible manner. It has been rated as one of the best
B-Schools in India . It is also ranked in the top 100 B-Schools (# 111) category by The Week- Hansa B-
School Survey, 2014.
We strive to explore new horizons across industry and government interfaces, cross sectional learning
from one’s diverse peer group and involve in current events to shape the economy through academic-
corporate engagement. We believe in providing practical exposure to students apart from building strong
layers of theoretical base. In this endeavor, we organize number of Guest Lectures-cum- Seminars by
inviting experts from industry and academia; arrange frequent industrial visits to imbibe a sense of
corporate culture and functionalities. We have both academic and activity clubs that help students to
unfold their potentials and add value in order to make them employable. The School has built an excellent
faculty pool with experience and a rich intellectual capital base, state-of-the-art infrastructure, technology-
savvy campus along with other bests towards ensuring quality.
CONTENTS
Financial Reporting, Accounting Standards and their Implications for Financial Management in Centrally Funded Universities in India ………………………………………………………………pp. 1-8
Mohan Kumar C.P. and Dr Ritika Sinha The Government of India has prescribed uniform accounting formats for autonomous bodies. Keeping in step with this, the Ministry of Human Resources Development (MHRD) and the University Grants Commission have, over the last couple of years, prescribed uniform accounting formats and adoption of certain accounting standards for centrally funded higher education institutions. The objectives of these formats and standards are to promote better accountability,
transparency, adoption of best financial practices and fiscal prudence. The new system also envisages flexibility to the Universities while broadly complying with the standards. Thus, the new accounting format poses challenges as well as opens up opportunities for the Universities. Along with proper disclosure, it is also important that the public funded Universities are encouraged to generate resources for operations, replacement of assets and as well as for building up the corpus
of the Universities without compromising on their ability and eligibility to receive grants from the government. For this purpose, a realistic depiction of capital funds and assets is necessary. Similarly, a realistic assessment of long term liabilities, like pension liability, is also necessary with concomitant policy changes on how to fund this provision for pension and retirement benefits in the current policy context. This paper analyses the implications, opportunities and the challenges arising
out of new accounting formats and adoption of accounting standards in the centrally funded higher education institutions in India.
Impact of Lifestyle Characteristics of Investors on Asset Allocation Strategies ………………………………………pp. 9-15
Geetha Salageri Asset allocation decision among investors is influenced by several factors. The investment decision making process of investors is not only driven by demographic
factors but also psychographic factors. Given the rise in the income level of the individuals in the recent past, this study examines the effect of psychographic variables on asset allocation pattern of retail investors of Bangalore. With a sample of 120 randomly selected respondents, the results of the chi-square test showed that the life style cluster and investment choice affect the asset allocation strategies of the investors.
Teaching Management Concepts Through Cinema - An Empirical Study ………………………………………pp. 16-22
Padmalini Singh and Dr.Rizwana Cinema is the most interesting and powerful way of communication used by majority of the marketers. Through cinema one can understand his/her own life and
can visualize the actual functioning of the society which they belong to. Cinemas have a very strong audio-visual element that appeal to larger audience. When cinema can provide entertainment to the masses undoubtedly it can become an excellent mode of mass teaching and mass education. In this context, the present study is an attempt to understand whether cinema can be used as effective media to study management concepts. For the purpose of study, survey was conducted
using structured questionnaire that were sent randomly to the teachers and students across different city in India through e-mail. As respondents were spread over diverse area convenience sampling technique has been employed. The study found that there is high acceptability for integrating cinema as a part of curriculum
and it can also be used as an effective medium to study management concepts. This paper provides an opportunity for educational institutions to know the importance of cinema as a tool to study management concepts and include it in their course material.
Performance Analysis of Selected Tax Saving Mutual Funds in India ………………………………………pp. 23-35
Yashik Fawas A N In this research paper it is explored, whether tax savings mutual funds offer investors a better return than the market returns. It also tries to assess the
diversification benefits provided by the fund managers of these schemes. The sample size is 30 schemes. Various performance measures are used to assess the risk-return profile of these schemes. It was inferred from the study that majority of the tax savings schemes failed to outperform the broad market index and provided diversification advantages to the investors.
A Comparative Analysis of Performance of Microfinance Institutions in India, Bangladesh and Pakistan ………….pp.36-41
Dr. Mihir Dash
This study examines the performance of microfinance institutions (MFIs) in India as compared to their counterparts in Bangladesh and Pakistan. The data for the study was collected for a sample of fifty-seven MFIs in India, thirty in Bangladesh, and fifteen in Pakistan, for the years 2010-11 and 2011-12, collected from the
Microfinance Information eXchange (MIX). The results of study suggest that Indian MFIs have been performing better than Bangladeshi and Pakistani MFIs in
terms of Borrowers per Staff Member, and more or less at par with them in terms of Gross Loan Portfolio, Number of Active Borrowers, and Average Outstanding Balance. This may be due to the impetus provided by the government and the RBI towards financial inclusion. Further, the results of the study present a skewed
picture of MFI performance within India, with south Indian MFIs performing better than those in other regions in terms of Gross Loan Portfolio and Number of Active Borrowers. Indian MFIs need to support greater communication, coordination, and transparency between themselves to expand outreach in a sustainable manner, and to prevent crisis in the future.
Changing Paradigms of Rural Development …………………....pp.42-48
Ashvin M Gutti
The United Nations defines “Rural Development is a process of change, by which the efforts of people themselves are united, those of Government authorities to improve their economic, social and cultural conditions of communities into the life of the nation and to enable them to contribute fully to national program. Rural
Development is a process of bringing change among rural community from the traditional way of living to progressive way of living. It is also expressed as a movement for progress”. Major change in the global economy like, improved transportation, improved communications, costs reductions, changing trade patterns for goods and commodities, globalization and the emergence of important non-farm activities in rural regions confront rural regions with some obvious threats but also with significant opportunities. These being the background, policy makers recognize the need and demand that conventional sectoral policies need to be
upgraded and at times, need to be phased out and substituted with more appropriate steps.
Trends in Mergers and Acquisitions – Indian Perspective …….………….pp.49-57
Dr. Y Nagaraju and Samiya Mubeen The corporate sector all over the world is restructuring its operations through different types of consolidation strategies like mergers and acquisitions in order to
face challenges posed by the new pattern of globalization, which has led to the greater integration of national and international markets. The intensity of such operations is increasing with the de-regulation of various government policies. The reforms process initiated by the Indian government since 1991, has influenced the functioning and governance of Indian firms which has resulted in adoption of different growth and expansion strategies by the corporate firms. These reforms
have opened up a whole lot of challenges both in the domestic and international spheres. In that process, Indian organizations are facing challenges from both, domestic competitors as well as foreign competitors, who can suddenly appear from anywhere on the globe. Collaborations, strategic alliances, powerful partnerships will strengthen the economy. Encouragements from Governments through legislations and tax concessions will further strengthen mergers and
acquisitions. This study focuses on factors for the failure of mergers and acquisitions globally and more particularly in India and to review the success mantra for effective implementation of mergers and acquisitions. Mergers and acquisitions (M&A) in the corporate world are achieving increasing importance and attention especially in the advent of intense globalization. This is evident from the magnitude and growth of deal values and resultant „mega-mergers‟ transacted in recent times. As expert advisory are sought in M&A activities to facilitate the undertaking and maximize the value of the transaction, advisory firms begin to play a more
significant and at the same time lucrative role in M&A activities, to the extent of determining the outcome of such projects. This study is conceptual in nature. The studies undertaken guide the management and persons involved not to fail to understand the reasons for pre and post merger failures. Understanding culture, training of managers to develop change agents, communication to stake holders, building targets, developing a new culture, leader to lead, careful planning and
implementation at each stage of mergers make merger successful.
Application of Green Marketing in Marketing Mix: A Case of Large Retail Stores in Bangalore ………………….pp.58-60
Janardhan Shetty and Dr. Akhila R Udupa Green Marketing is a concept of marketing which has assumed lot of attention and application across organizations in this decade. Green Marketing refers to holistic marketing concept where in the production, consumption marketing and disposal are closely conducted without adding any social cost. There is a need for
us to use environment friendly practices in the context of marketing our products. Large retail store is a retail format where there is lot of scope for using Green marketing concepts. This paper focuses on some Green marketing strategies used in the Marketing mix of large retail stores like Reliance Fresh and Heritage Foods. This is a descriptive paper and the objective is to understand the applications of green marketing in LRS. Further, the authors have tried to include the
effectiveness of these initiatives in LRS.
Creating a Sustainable Lens for Higher Education: The New Urgency ………….pp.61-63
Sunder Rajan The quantity of education needs to be supported with quality of education in order to make it effective to create responsible future citizens of any country. Many developing and developed countries have taken education of its citizens as a mainstream agenda to develop the nation. Educational institutions generate students who will be the products of development in Academia, Research Institutions, Industry, Managing Governmental Organizations and various other Corporations.
Unless students are linked to these occupations and understand them better and develop the right perspectives “education will be just a process than the purpose”.
In this direction several academic institutions in the recent past have been conducting various Conferences to find ways and means of “purposeful career oriented education for enhancing employability”. Towards this direction factors such as goal orientation for employment oriented education, knowing the gap between the
institution and the industry, faculty development programs and developing student to the employability needs could be visualized for enriching the purpose of education.

EDITORIAL
Our Journal SAMSMRITI is ready to enter into a new phase to disseminate specific knowledge to all its
readers in purely a different format. Hope all of you continue to patronage as you have been doing in the
past. The present issue is again a turning point as we have something to say about Financial Management
of Centrally Funded Universities analyzing the implications, opportunities and the challenges arising out
of new accounting formats and adoption of such accounting standards.
Then article is about investment decision making process of investors which examines effect of
psychographic variables on asset allocation pattern of retail investors. One interesting study is about
cinema’s powerful way of communication to teach management concepts. Some interesting focus in the
subsequent articles is:
Whether tax saving mutual funds offers investors a better return than the market returns.
MFIs in India have been performing better than their Bangladesh and Pakistan counterparts.
For Rural Development conventional sectored policies need to be upgraded and at times need to
be phased out and substituted with more appropriate steps.
Focus on factors for the failure of mergers and acquisitions globally and more particularly in India
and to review the success mantra for effective implementation of mergers and acquisitions.
Thrust on Green Marketing strategies used in the marketing mix of large retail stores like Reliance
Fresh and Heritage Foods.
We are sure the rigor of these articles will benefit Management Professionals to look at further research in
these sectors. A Forum is being created under the aegis of the Journal to evolve pedagogic changes to
teach any management subject with basic thrust on research which will be shared with all in due course.
Dr. K. C Mishra
Editor-in- Chief

1
Financial Reporting, Accounting Standards and their
Implications for Financial Management in Centrally
Funded Universities in India
SAMSMRITI – The SAMS Journal
Vol. 9(2), July – December 2015
pp. 1-8
Mohan Kumar C.P.1
Dr Ritika Sinha2
1 Registrar, TISS, Mumbai 2 Assistant Professor, CBSMS, Bangalore University, Bangalore
Key words
Accounting standards;
Centrally funded universities;
Financial reporting;
Higher education
Abstract: The Government of India has prescribed uniform accounting formats for
autonomous bodies. Keeping in step with this, the Ministry of Human Resources Development
(MHRD) and the University Grants Commission have, over the last couple of years, prescribed
uniform accounting formats and adoption of certain accounting standards for centrally funded
higher education institutions. The objectives of these formats and standards are to promote
better accountability, transparency, adoption of best financial practices and fiscal prudence.
The new system also envisages flexibility to the Universities while broadly complying with the
standards. Thus, the new accounting format poses challenges as well as opens up
opportunities for the Universities. Along with proper disclosure, it is also important that the
public funded Universities are encouraged to generate resources for operations, replacement
of assets and as well as for building up the corpus of the Universities without compromising
on their ability and eligibility to receive grants from the government. For this purpose, a
realistic depiction of capital funds and assets is necessary. Similarly, a realistic assessment of long term liabilities, like pension liability, is also necessary with concomitant policy changes on
how to fund this provision for pension and retirement benefits in the current policy context.
This paper analyses the implications, opportunities and the challenges arising out of new
accounting formats and adoption of accounting standards in the centrally funded higher
education institutions in India.
Introduction
Universities are the backbone of higher education and research for the progress of any country
and it is no different for a country like India. The fiscal strength of a University has a direct impact
on its teaching and research. For Universities to be progressive, they need to have financial
resources and fiscal prudence. The first Prime Minister of India, Pandit Jawaharlal Nehru had
said: “a University stands for humanism, for tolerance, for reason, for progress, for the adventure
of ideas and for the search of truth. It stands for the onward march of the human race towards
even higher objectives. If the Universities discharge their duty adequately, then it is well with the
nation and the people. But if the 'temple of learning‟ itself becomes a home of narrow bigotry and
petty objectives, how then will the nation prosper or a people grow in stature? A vast
responsibility, therefore, rests on our Universities and educational institutions and those who
guide their destinies. They have to keep their lights „burning and must not stray from the right
path even when passion convulses the multitude and blinds many amongst those whose duty it
is to set an example to others.” (Nehru, 1950).
It was realised quite early that a strong, self-reliant and modern industrial economy needs to be
built only on the foundations of a good and strong higher education system. The fact that higher
education has generally been recognised as a “public good” warrants that the government (both
at the Centre and state levels) should play a more active role in the financing of higher education.
Since Independence, the government has been the principal contributor in funding higher
education in India.

2
Importance of Higher Education
In the field of higher education, Universities are entrusted with the responsibility of building
human resources by imparting knowledge and skills necessary for active and effective
participation of the people in the country‟s development. Conventional state Universities deal with
disciplines such as humanities, basic and social sciences and cater to the higher education
requirements of a large population who cannot afford professional education in private colleges.
These Universities are mainly dependent on the government for their financial requirements and
possess limited avenues to attract alternate resources (Jayadev & Ramesh, 2011). The
University is no longer a quiet place to teach and do scholarly work at a measured pace and
contemplate the universe as in centuries past. It is now a large, complex, demanding,
competitive business requiring large-scale on-going investment.
A well developed and equitable higher education system that promotes quality learning as a
consequence of both teaching and research is central for success in the emerging knowledge
economy. It is widely acknowledged that education contributes significantly to economic
development. The developed world understood much earlier the fact that individuals with higher
education have an edge over their counterparts. They are the ones who always believed that any
amount of investment in higher education was justifiable. It is, therefore, imperative for
developing countries too, to give due importance to both the quantitative and qualitative
expansion of higher education (Ved Prakash, 2007). But the Indian higher education system is
presently facing several challenges. The challenge of global competitiveness has added to other
demanding tasks such as access, equity, relevance, quality, privatisation and internationalisation
in the face of severe resource crunch. In order to meet all these challenges, Universities need to
bring in professionalism in their academics and in the management of University finances so that
they could face these challenges squarely and seek to come out on top.
Higher education has always been an important priority in the public agenda. It is a repository
and defender of culture, an agent of change in the culture, an engine for national economic
growth, and an instrument for the realization of collective aspirations. Furthermore, the public
interest in higher education is generally present whether the delivering institutions are publicly or
privately owned, and /or are publicly or privately financed (Johnstone, 1998). As the higher
education institutions serve, major cause of public interest in promoting individual excellence and
collective good of the society by seeding the wisdom, the Universities must have efficient
financial management in place to become institutions of excellence.
Fiscal Management in Universities
Managing finance is one of the key challenges facing the higher educational institutions all over
the globe. Due to the recent infamous financial crisis and economic recession, the problem has
further escalated as the whole sector is experiencing difficulties in accessing funding
opportunities as well as finding financing options (Hamadeen, 2013). Financial management of
Universities is almost entirely dependent on the data and information available from the accounts
database of the institution. The quality and of information that the finance and accounts wing of
the Institute is able to provide to the University Management has an important role to play in
financial management decision making. When we talk of quality it would mean the accuracy,
reliability, nature and promptness or timeliness of the availability of the financial information.

3
Education is on the „Concurrent list‟ subject to Entry 66 in the Union List of the Constitution. This
makes both Central and State Government responsible to make policies to provide for the
planned development of educational institutions, inculcation of healthy educational practice,
maintenance and improvement in the standards of education and better organisation, discipline
and control over educational institutions with a view to fostering the harmonious development of
the mental and physical faculties of students.
At present, Ministry of Human Resource & Development (MHRD) regulates education in India
and operates mainly through two departments, namely Department of School Education &
Literacy and Department of Higher Education. The higher education system in India has grown in
a remarkable way, particularly in the post-independence period. It is the third largest system in
the world, after China and the United States (Institute of Chartered Accountants of India [ICAI],
2011). As higher education has grown, and other pressures have constrained state funding, the
financial sustainability of Universities and other institutions of higher education has become an
issue for policy makers, and for those who govern and manage these institutions.
Given the historical background of development of educational institutions primarily as a not-for-
profit activity, accounting and financial reporting practices followed by nongovernmental
educational institutions have been oriented towards meeting the needs of the governing bodies
running the educational institutions. However, in recent years, with increase in government aid to
educational institutions particularly in the form of concessions and incentives, increased fees
charged from the students and increased donations by certain donor-agencies, greater need is
being felt for accountability of the financial resources used by the educational institutions.
Financial planning exercises in Indian Universities reveal a lack of clarity in objectives, absence
of short and long-range plans, non-fixation of priorities, and lack of procedures, methods, and
systems. Administrators are preoccupied with matters of immediate concern and find very little
time to the long range needs of the institution. Even important issues are brought before the
administration in a most haphazard manner. Administrators under pressure find it easier to follow
procedures and patterns developed years ago. They are reluctant to infuse modern concepts of
management (Rao, Prasad & Kiranmayi, 1987). The main challenge for those who lead, govern,
and manage higher education institutions is how to manage the institution to secure its financial
and academic sustainability at a time when the funding and policy environment is becoming
much more competitive and challenging.
Accounting System in Universities
Accounting is an integral part of every organization, be it a commercial or non-profit organization.
The accounting system of an institution of higher education is of vital importance for knowing the
financial state of affairs of such institutions. Accounting includes recording of financial
transactions and maintenance of financial statements to disclose financial and economic
information which have an impact on the financial position of an institution. It provides a detailed
classification of expenditure and matching of income and expenditure after analyzing the
financial data which are extracted from the financial records of the organization. Accounting gives
a detailed economic picture of the organization through the annual statements of accounts to the
interested parties and to the public in general. Analyzing the annual statements of accounts one
can judge the financial position of the organisation on a particular date and its operating
efficiency (Mahanta, 2013).

4
Over the years, Universities and other Research and Education institutions had, like other
government departments, been following the system of single entry system of accounting and
cash based accounting. Usually, a Receipts and Payments Account classified across various
receipt and payment heads would be prepared. To this end, the auditors of the Accountant
General‟s office were quite satisfied with the preparation of financial statements on cash basis
and in single entry system. More than anything this system served the immediate purpose of
showing the utilisation of the grants received under various heads.
Therefore, financial reporting was more in terms of receipts and payments account and
statements of expenditure and utilisation certificates. Receipts and Payments accounts and
Statement of Expenditure offered little opportunities for analysis and Management Information
System for management decision making, what with the nature of classification and heads of
accounts differing across organisations. The scope for analysis and interpretations were thus
limited.
While the present system of accounting and financial reporting followed by educational institution
differs widely from institution to institution it does not also meet the accountability concerns of the
donors, including government and other stakeholders such as members/ beneficiaries, governing
board, management, staff, volunteers and general public. This is because educational institutions
in India follow not only diverse accounting practices but also different basis of accounting and
therefore the financial statements are not amenable to comparison and interpretation. Therefore,
there is a greater call now for better accountability of the financial resources, particularly public
resources, being used by the educational institutions. It is understood and acknowledged now
that a sound accounting and financial reporting framework acts is an important ingredient for
promoting transparency, accountability and reliability for the growth and development of the
education sector.
In order to bring about uniformity in accounting practices and ease of comparability, the MHRD in
India issued guidelines in 2012 on a common format of accounting, to be followed by all
institutions of higher learning including the IITs, centrally funded Universities and centrally funded
deemed to be Universities. The format itself underwent further changes and there were
consultations with the Universities. Some of the Universities did seek further clarifications and
guidance from the Ministry in its implementation. The Ministry had obtained the support and
advice of the ICAI and Comptroller and Auditor General of India in assessing the requirements of
the Universities, the application of Accounting Standards and in drawing up these formats. The
formats and guidelines are analysed so that we have an understanding of the challenges that the
Universities face in the successful implementation of the common format of financial reporting.
The financial data was therefore required to be made available in a form that would be easier to
analyse and observe the utilisation of resources, the pattern of utilisation and compliances with
funding caveats and other conditions. Further, the aim of the Government of India to bring about
uniformity in accounting across autonomous bodies and more specifically across institutions of
higher education prompted it to initiate steps to introduce a common accounting format across all
educational institutions funded by the government. The features of this format were the following:
1) Accrual based accounting was to be followed as against the cash based accounting;
2) Double entry system of accounting to be adopted as against the single entry system
followed hitherto;
3) Preparation of Income and Expenditure account and Balance Sheet;

5
4) Preparation of appropriate schedules to the Balance Sheet and Income and Expenditure
Account;
5) Preparation of a Receipt and Payment account; and
6) Make some of the relevant Standards of Accounting applicable to these institutions.
While making these recommendations, the government did envisage certain difficulties in switch
over and thus the Expert Committee (Ramaswamy, 2010) in its Report stated that the objective
to bring about uniformity in approach towards preparation and presentation of financial
statements of Central Autonomous organisations and encourage comparability, it was felt that it
would not serve the purpose of bringing out different formats for different class of organisations.
The committee was of the view that a common format be attempted to cover the transactions and
events of common nature, as a benchmark, providing some flexibility for exceptions.
The Committee further added that to avoid any rigidity in approach to preparation of the financial
statements it has taken care in prescribing that the suggested format shall be adhered to subject
to any special features applicable to certain specialised entities, and the statement can be
prepared in the formats, or as near thereto as possible. The formats need not, therefore, be
viewed as rigid in that there is some degree of flexibility in their adoption. The common formats
give the basic structure and its rigid application is not envisaged. Suitable additions and deletions
within the basic structure of the format are permitted.
Thus, while introducing the format, the government does envisage a certain degree of flexibility
to the Universities in the formats to suit their specific needs, while advocating a certain uniform
benchmark of the structure. This needs to be kept in mind when we examine the challenges that
Universities face in adoption of these formats and the other concomitant recommendations.
However, there should be no doubt as to the adoption of the double entry system and accrual
based system of accounting, which is inevitable in any case.
Important Issues in Implementation of the New Formats
The primary and probably the real challenge for any institution which hitherto was following the
single entry system would be to convert their financial data into a double entry system of
accounting. From a simple Receipts and Payments Account, the Universities were now expected
to prepare Income and Expenditure Accounts and Balance Sheets. This entailed adoption of
accrual accounting and the Matching Principle of accounts. The difficulties initially would be in
assessing the accrued income and accrued expenses and prepaid expensed and incomes
received in advance. In some institutions that are totally new to this system, they needed to redo
their books of accounts right from journalising the transactions in double entry system. Be that as
it may, some of the real issues in implementation lay where policy interventions, interpretations
and long term implications for the Universities were involved. Let us see what these could be,
what they entail and how such a change could be useful to the financial management of the
institution.
1. Creation and sustaining a Corpus Fund
The Punnaya Committee Report (1992-1993) has indicated that higher educational
institutions in the country are very much dependent upon the public funds and other
income to a very large extent and the share of fees is quite low in the overall budget of
the higher educational institutions. This was found to be true even in the case of
advanced countries like the USA and Britain. There has, however, been constant

6
pressure from the Government of India on higher educational institutions to increase their
income from fees. The government at the same time aspires to bring in inclusiveness in
education thorough direct funding by way of scholarship/ fellowship to students.
The Punnayya Committee further strongly recommended in para 9.6 of its report that
Universities must be allowed to retain the additional earning and savings raised by their
own efforts and these should not be adjusted against their maintenance grants. The
income so generated must be kept in a separate fund and utilised in the furtherance of
their objectives. In fact, the Punnayya Committee has postulated that these additional
earnings should not bridge the gap in normal funding but should be used only to achieve
higher standards and further recommended that a portion of the additional resources be
kept aside to build a corpus.
Educational policy makers therefore have the task of laying down not only the policy for
creation of a corpus but also address the accounting problem of keeping aside a portion
of additional resources generated for adding it to the corpus fund. The accountants tend
to take rule book approach to the issue. How is the additional earning to be presented in
the financial statements and what would be the options and the implications of each
option? Most centrally funded deemed to be Universities are created as trusts and
therefore come within the purview of Charity Commissioners of the respective states
where they are registered or incorporated. Charity Commissioners, like accountants,
interpret corpus as the one created by the founders or to which specific donations have
been received. Corpus needs to be defined differently for Universities. It should be
differentiated from the promoter‟s contributions and policy makers need to think
differently, and treat corpus as the fund created for the rainy day to meet exigencies if the
minimum required funding is not coming forth. They look at corpus as a long term
strategy to create financial strength, to enhance their financial base and to use the
earnings from the investment of the corpus for meeting exigencies not provided for by the
provider, i.e. the government. To this end the Punnayya Committee (1992-1993)
suggested even a scheme of matching grant to encourage the University to raise
additional resources.
The matching grant scheme has also been successfully implemented by the University
Grants Commission and quite a few Universities have derived benefit from this scheme.
A purely accounting approach to this issue would be to over simplify a complex, but
important issue for the Universities. If all revenue generated is directly brought into the
Income and Expenditure Account, Universities which are constantly in a deficit every year
stand to lose out since the additional resources generated would be subsumed into the
total income and, given the deficit, there is hardly any chance of accretion to the corpus
fund which would defeat the purpose of creation of the corpus fund itself.
The option to redistribute the additional resource component of Income through the
Income and Expenditure (Appropriation) Account in certainly not a comfortable thought,
since the question would arise as to when there is an overall deficit in the Income and
Expenditure, and how could the additional resource component alone be redistributed to
close with a higher, but true deficit. This approach could be potentially disastrous for the
finances of Universities. If they are not so distributed and subsumed in the income, then
the very purpose of the recommendations of the Punnayya Committee (para 9.23 and
para 9.24 of the report) will be defeated. A clear definition of the corpus needs to be

7
made and differentiated form the promoters or trustees contributions to the creation of
the University.
2. Providing for Depreciation and realistic depiction of Assets
In the single entry system, the depreciation in the value of assets owned by a University
was not recognised. This was due to the funding system that all resources for creation or
purchase of fixed assets was provided for by the government and the resources for their
repair and replacement was also provided for by the government and therefore, it was
not felt necessary to provide for the normal wear and tear of the asset, more so when
depreciation did not involve out go of cash. However, this presented the assets at an
inflated and more than realistic value in the books of accounts. So both the asset and its
funding source- the Capital Fund - was stated at higher than the actual level in the
Balance Sheet. So the ratios that one would analyse with respect to these items in the
Balance Sheet would be not present a correct picture.
From a financial management perspective it would be worthwhile to depreciate the
assets and show them at the correct levels in the Balance Sheet. However, the
challenge, particularly for older institutions, is how to actually calculate the value of
assets which are probably more than several decades old, if not older like the Indian
Institute of Science, Bangalore or some of the Indian Institutes of Technology. Here, a
pragmatic and reasonable approach rather than a rigid approach would be helpful and in
accordance with the recommendations of the Expert Committee which has
recommended the adoption of a Common format of accounting for educational
institutions.
The best option would be to try and ascertain which is the earliest date from which the
accounting data of the value of fixed assets and their date of commencement of use is
available and then adopt a certain percentage of the assets to be written down as on the
date of the latest balance sheet (a cut-off date so to say) and thereafter put in place a
system of depreciation as per the provisions of the Income Tax Act.
From the financial management perspective, it is wise to provide for depreciation not only
to depict the Capital Funds and the Fixed Assets at their true values. However, from the
perspective of constantly creating a fund for repairs and replacement, it does make good
financial management sense in order that the burden of major repairs or replacement of
fixed assets would not be crippling and critical for the Universities, particularly those
departments which use a lot of scientific equipment. It is also necessary that the cost of
using an asset for a particular year is charged to the Income and Expenditure Account by
way of depreciation for the wear and tear of using the asset during the year. If, however,
a policy could be framed to create a sinking fund, which would enable the replacement of
these depreciable assets, it would be of immense help to most public funded institutions,
particularly the science and engineering departments of centrally funded and state
funded Universities in maintaining and replacing the assets since funding for capital
assets is always that much more difficult to find.
3. Providing for Pension and Retirement Benefits
This is an issue of more concern to the institutions which were in existence as on 1st
January 2014 as compared to the new educational institutions since the Pension Scheme
has ceased for entrants after 2014, and has been replaced by the New Defined

8
Contributory Pension Scheme. The common format speaks of adopting the Accounting
Standard 15, which envisages an actuarial valuation of the retirement benefits to be done
by professional actuaries based on the age profile and the retirement plan. Based on
such actuarial valuation, an annual charge is to be made to the Income and Expenditure
account as a Provision for retirement benefits and on superannuation or retirement of the
employee the Provision is debited and payments made to the retiring employee. The
challenge here is more in terms of financing by the MHRD or UGC. The Government of
India allocates budget to all the Universities and educational institutions funded by them
on actual basis with respect to the retirement benefits.
Thus, in the Income and Expenditure there would be the grant received taken as income
and a payment for the retirement benefits paid during the year. In addition, if a provision
is carved out of each year‟s grants, it could help create a fund for meeting the pension
and retirement benefit commitments and future payments shall be met out of this fund. Of
course, the government would probably think of creating such a fund at the macro level
to manage the total pension liability. However, doing this at the Institutional level would
be more valuable and give a more correct assessment of each organisation‟s liability on
this count.
References
1. Hamadeen, R.A. (2013).Good practices in financial management of higher education.
Jordan: Al- Hussein Bin Talal University.
2. Institute of Chartered Accountants of India (2011). Report on Implementation of
Accounting Standards in Educational Institutions of Department of Higher Education.
New Delhi: Ministry of Human Resource Development.
3. Jayadev, M. and Ramesh, G. (2011). University Finances: A Study of Karnataka State
Universities. Bangalore: Karnataka Knowledge Commission.
4. Johnstone, D.B. (1998). The Financing and Management of Higher Education: A Status
Report on Worldwide Reforms. UNESCO World Conference on Higher Education, held in
Paris, France.
5. Mahanta, D.K. (2013).Financial Management of Higher Education: A Study on Gauhati
University. Unpublished PhD Thesis. Gauhati: Department of Commerce, University of
Gauhati University.
6. MHRD‟s Common Format of Accounting for centrally funded higher educational
institutions (2012)
7. Nehru, J. (1950). Indian Opinion. Page 1. 7th April 1950, Mumbai
8. OECD (2004). On the Edge: Securing a Sustainable Future for Higher Education. Report
of the OECD Project on Financial Management and Governance of Higher Education
Institutions.
9. Punnayya, K. (1993). Report on the UGC Funding of Institutions of Higher Education.
New Delhi: University Grants Commission.
10. Ramaswamy, B.S. (2010). Accounting Handbook for Central Autonomous Organisations
& Universities, New Delhi: Taxmann‟s.
11. Rao, K.V., Prasad, G. and Kiranmayi, Y.S. (1987). Can Universities Continue to Relegate
Financial Administration to the Background? Vikalpa. Vol. 12, No. 2.
12. Ved Prakash (2007). Trends in Growth and Financing of Higher Education in India,
Economic and Political Weekly. Vol. 42, Issue No.31.

9
Impact of Lifestyle Characteristics of
Investors on Asset Allocation Strategies
SAMSMRITI – The SAMS Journal
Vol. 9(2), July – December 2015
pp. 9-15
Geetha Salageri1
1Lecturer,Sambhram Academy of Management Studies, Bangalore
Key words
Asset allocation strategies
Financial planning;
Life style characteristics;
Life style clusters
Abstract: Asset allocation decision among investors is influenced by several factors. The
investment decision making process of investors is not only driven by demographic factors but
also psychographic factors. Given the rise in the income level of the individuals in the recent
past, this study examines the effect of psychographic variables on asset allocation pattern of
retail investors of Bangalore. With a sample of 120 randomly selected respondents, the
results of the chi-square test showed that the life style cluster and investment choice affect
the asset allocation strategies of the investors.
Introduction
Individual financial planning has recently gained a lot of momentum in developing countries including India. The basic factors behind this include excellent economic growth resulting into the corresponding rise in individual income level. The beginning of globalization process during the early 1990s opened a new gateway for economic development in these countries. The availability of a large number of prospective consumers in these countries made them target markets for major global players. This, supported by the reform measures undertaken by these countries, proved to be a boon for masses in general and for middle-income group in particular. On the one hand, this class is benefited with excellent employment opportunities at local and global level, and on the other hand, growing economies have resulted in manifold rise in individual income level. This has resulted in a sudden growth in household savings and investments. This study examines the impact of investor lifestyles on the selection of various investment products.
Literature Review Langer (1975) finds that self-reported risk tolerance does the best job of explaining differences in both portfolio diversification and portfolio turnover across individual investors. Barnewall (1987) finds that an individual investor can be found by lifestyle characteristics, risk aversion, control orientation and occupation. Barnewall(1988) suggests the use of psychographics as the basis of determining an individual's financial services needs and takes one closer to the truth from the customer's perspective of need to build a marketing program. Statman (1988) observed that people trade for both cognitive and emotional reasons. They trade because they think they have information, when in reality they make nothing but noise and trade only because trading brings them joy and pride . Harlow and Brown (1990) observes that psychologists tend to believe that an individual's choice is primarily determined by factors unique to the particular decision setting, whereas economists assume that there is some individual-specific mechanism playing a common role in all economic decisions. Gupta (1991) argues that designing a portfolio for clients is much more than merely picking up securities for investment. The portfolio manager needs to understand the psyche of his clients while designing his portfolio.
10
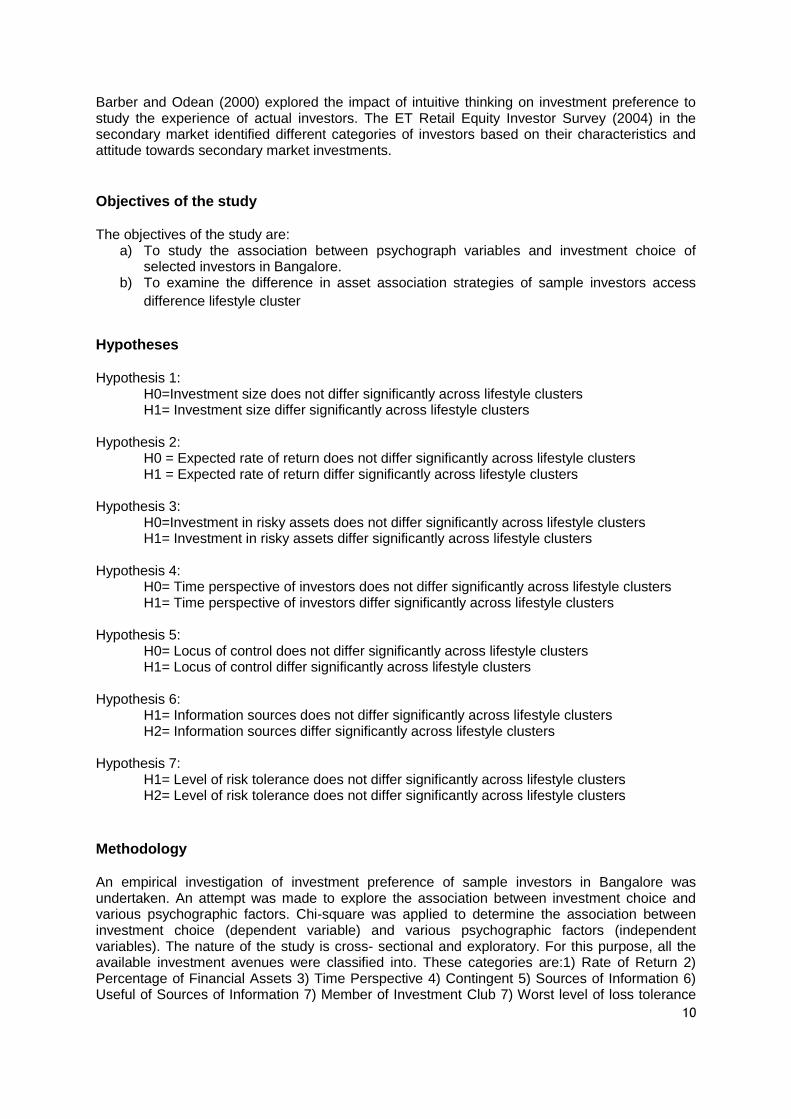
Barber and Odean (2000) explored the impact of intuitive thinking on investment preference to study the experience of actual investors. The ET Retail Equity Investor Survey (2004) in the secondary market identified different categories of investors based on their characteristics and attitude towards secondary market investments.
Objectives of the study The objectives of the study are:
a) To study the association between psychograph variables and investment choice of selected investors in Bangalore.
b) To examine the difference in asset association strategies of sample investors access
difference lifestyle cluster
Hypotheses Hypothesis 1:
H0=Investment size does not differ significantly across lifestyle clusters H1= Investment size differ significantly across lifestyle clusters
Hypothesis 2:
H0 = Expected rate of return does not differ significantly across lifestyle clusters H1 = Expected rate of return differ significantly across lifestyle clusters
Hypothesis 3: H0=Investment in risky assets does not differ significantly across lifestyle clusters H1= Investment in risky assets differ significantly across lifestyle clusters
Hypothesis 4:
H0= Time perspective of investors does not differ significantly across lifestyle clusters H1= Time perspective of investors differ significantly across lifestyle clusters
Hypothesis 5:
H0= Locus of control does not differ significantly across lifestyle clusters H1= Locus of control differ significantly across lifestyle clusters
Hypothesis 6:
H1= Information sources does not differ significantly across lifestyle clusters H2= Information sources differ significantly across lifestyle clusters
Hypothesis 7: H1= Level of risk tolerance does not differ significantly across lifestyle clusters H2= Level of risk tolerance does not differ significantly across lifestyle clusters
Methodology An empirical investigation of investment preference of sample investors in Bangalore was undertaken. An attempt was made to explore the association between investment choice and various psychographic factors. Chi-square was applied to determine the association between investment choice (dependent variable) and various psychographic factors (independent variables). The nature of the study is cross- sectional and exploratory. For this purpose, all the available investment avenues were classified into. These categories are:1) Rate of Return 2) Percentage of Financial Assets 3) Time Perspective 4) Contingent 5) Sources of Information 6) Useful of Sources of Information 7) Member of Investment Club 7) Worst level of loss tolerance

11
in investment. Psychographic variables considered for the studies are and qualification. The target population for the study is selected investors of Bangalore. The sampling method used can best be described as a mix of judgmental and convenient sampling. The data was collected through a self – structured questionnaire, which was administered on 150 respondents. Out of this 120 responses were finally considered for the study, hence the acceptance rate was 80%. The analysis of the data was carried out using Statistical Package for the Social Sciences (SPSS) 17.0 for Windows.
Limitations of the study The limitations of the study are:
a) The time period selected for conducting the study was limited.
b) Sample size is limited to 120 respondents. c) The analysis and interpretation purely based on data collected from the respondents.
Results, analysis and discussions
This section presents the analysis and discussions of the results. Table 1 shows the Lifestyle clusters and investment size of sample respondents. The analysis of the table reveals that most of the sample investors were classified as aggressive, followed by conservative investors. Of the 54 aggressive investors 29 were having an annual investment of up to Rs.50000.About 17 respondents were investing about Rs.50000 –Rs.100000. Out 37 conservative investors about 14 and 15 investors were saving up to Rs.50000 and Rs.50000-100000. The chi square value at 5% level of significance stood at 4.381 where as the p-value was 0.625.the calculated value is greater than the table value, the null hypothesis is rejected. Therefore, it is concluded that investment size differ significantly across different lifestyle clusters.
Table 1 Lifestyle cluster and Investment size
Clusters Investment size (Rs.) Total
Up to Rs.
50,000
Rs. 50,000-
Rs. 1 Lakh
Rs. 1 Lakh-
Rs. 2 Lakh
Above Rs.
2 Lakh
Aggressive investors 29 17 7 1 54
Moderate investors 11 12 4 2 29
Conservative investors 14 15 5 3 37
Total 54 44 16 6 120
Pearson Chi-Square Value = 4.381
Asymp. Sig. (2-sided) = 0.625
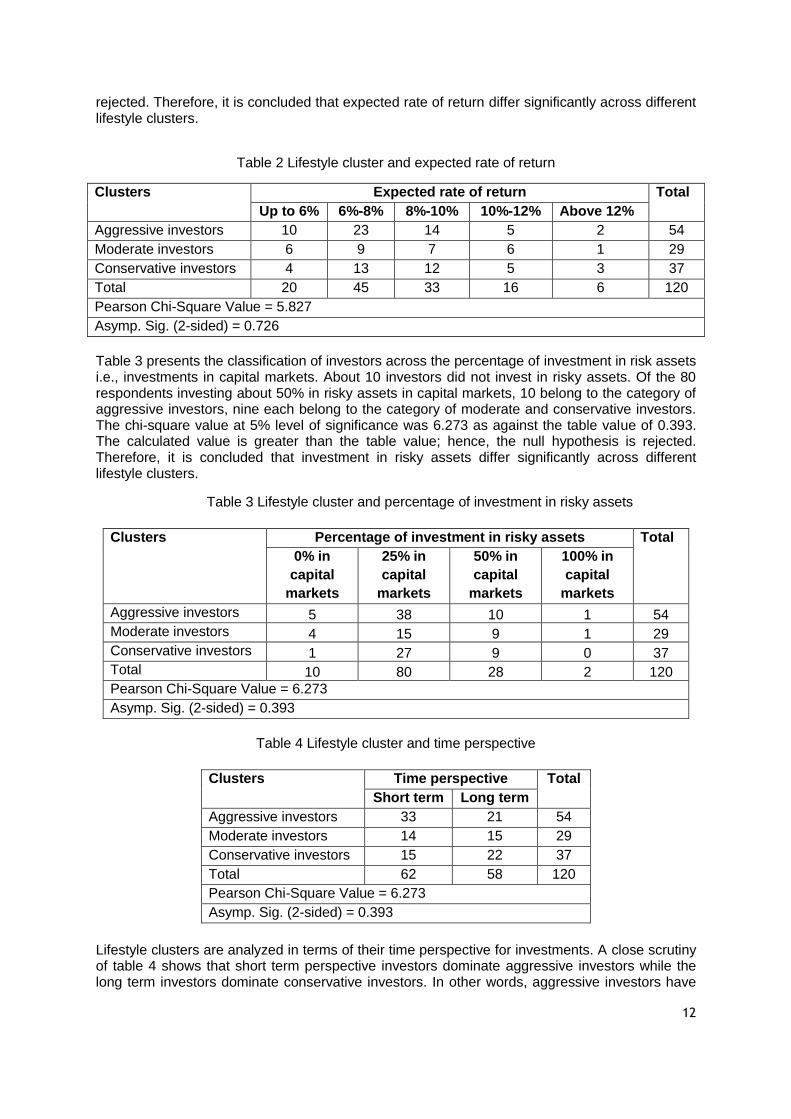
Table 2 shows the lifestyle clusters and rate of return expected by investors from their investments. It is evident from the above table, that majority of the aggressive investors (23) expect the rate of return between 6% - 8% followed by 14 sample investors with the expected return ranging between 8%-10%. The analysis also indicate that among the conservative investors, about 13 prefer the return to be between 6% - 8% followed by 12 sample investors with the expected return ranging between 8%-10%. The number of investor stood at six with the expected return of over 12%. Of these six, two were aggressive investors, one from moderate investor category and the remaining three were from the category of conservative investor cluster. The chi square value at 5% level of significance stood at 5.827 as against the table value of 0.726. The calculated value is greater than the table value; hence, the null hypothesis is
12
rejected. Therefore, it is concluded that expected rate of return differ significantly across different lifestyle clusters.
Table 2 Lifestyle cluster and expected rate of return
Clusters Expected rate of return Total
Up to 6% 6%-8% 8%-10% 10%-12% Above 12%
Aggressive investors 10 23 14 5 2 54
Moderate investors 6 9 7 6 1 29
Conservative investors 4 13 12 5 3 37
Total 20 45 33 16 6 120
Pearson Chi-Square Value = 5.827
Asymp. Sig. (2-sided) = 0.726
Table 3 presents the classification of investors across the percentage of investment in risk assets i.e., investments in capital markets. About 10 investors did not invest in risky assets. Of the 80 respondents investing about 50% in risky assets in capital markets, 10 belong to the category of aggressive investors, nine each belong to the category of moderate and conservative investors. The chi-square value at 5% level of significance was 6.273 as against the table value of 0.393. The calculated value is greater than the table value; hence, the null hypothesis is rejected. Therefore, it is concluded that investment in risky assets differ significantly across different lifestyle clusters.
Table 3 Lifestyle cluster and percentage of investment in risky assets
Clusters Percentage of investment in risky assets Total
0% in
capital
markets
25% in
capital
markets
50% in
capital
markets
100% in
capital
markets
Aggressive investors 5 38 10 1 54
Moderate investors 4 15 9 1 29
Conservative investors 1 27 9 0 37
Total 10 80 28 2 120
Pearson Chi-Square Value = 6.273
Asymp. Sig. (2-sided) = 0.393
Table 4 Lifestyle cluster and time perspective
Clusters Time perspective Total
Short term Long term
Aggressive investors 33 21 54
Moderate investors 14 15 29
Conservative investors 15 22 37
Total 62 58 120
Pearson Chi-Square Value = 6.273
Asymp. Sig. (2-sided) = 0.393
Lifestyle clusters are analyzed in terms of their time perspective for investments. A close scrutiny of table 4 shows that short term perspective investors dominate aggressive investors while the long term investors dominate conservative investors. In other words, aggressive investors have

13
more preference for short term instruments while conservative investors prefer for long term investment. Further, the analysis of chi-square indicate that the time perspective of investors differ significantly across different lifestyle clusters as the calculated value exceeds the table value at 5% level of significance.
Table 5 Lifestyle cluster and locus of control
Clusters Locus of control Total
Internal control External control
Aggressive investors 35 19 54
Moderate investors 20 9 29
Conservative investors 28 37 37
Total 83 65 120
Pearson Chi-Square Value = 1.215
Asymp. Sig. (2-sided) = 0.545
Locus of control is a specific personality characteristic. It is concerned with whether the individual sees reward as contingent upon his own behaviour (internal control) or as a result of luck, chance etc., (external control). The locus of control of sample investors was inquired into through Likert type statement in the questionnaire. On the whole, 70% of the respondents are found as internals and 30% as externals. Of these 70% internals, 35 belong to aggressive investors category, 20 belong to moderate investor category while the remaining 28 falls under conservative investor category. About 37 conservative investors opine that their reward is contingent upon luck, chance etc. The chi square value at 5% level of significance was 1.125 as against the table value of 0.545. The calculated value is greater than the table value; hence, the null hypothesis is rejected. Therefore, it is concluded that locus of control differ significantly across different lifestyle clusters.
Table 6 Lifestyle cluster and sources of investment information
Clusters Sources of investment information Total Share
brokers Investment
analyst / consultants
Journal and
magazines
Financial newspapers
Peer groups
TV channels
Aggressive
investors
26 10 4 6 1 7 54
Moderate
investors
11 8 2 5 2 1 29
Conservative
investors
11 6 4 6 1 9 37
Total 48 24 10 17 4 17 120
Pearson Chi-Square Value = 10.727
Asymp. Sig. (2-sided) = 0.379
The usefulness of various sources of information has also been enquired and analyzed across different lifestyle of investors. Majority of the aggressive investors were sourcing information through share brokers followed by investment consultants and analysts. Peer groups and TV channels were least preferred source of information. The chi square value at 5% level of significance was 10.727 as against the table value of 0.379. The calculated value is greater than the table value; hence, the null hypothesis is rejected. Therefore, it is concluded that the sources of information used for investments decisions differ significantly across different lifestyle clusters.

14
The level of risk tolerance among the investors based on different lifestyle clusters are presented in table 7. The analysis shows that out of 29 conservative investors, 22 of them expect a level of risk tolerance not exceeding 5%. Of the 54 aggressive investors, about 45 of them too preferred to expose their level of investments to a risk level of not in excess of 5%. The chi square value at 5% level of significance was 8.128 as against the table value of 0.229. The calculated value is greater than the table value; hence, the null hypothesis is rejected. Therefore, it is concluded that the risk tolerance level differ significantly across different lifestyle clusters.
Table 7 Lifestyle cluster and level of risk tolerance
Clusters Level of risk tolerance Total
Zero % Less than
5%
5%-10% 11%-15%
Aggressive investors 2 45 6 1 54
Moderate investors 2 22 4 1 29
Conservative investors 1 23 12 0 37
Total 5 90 22 3 120
Pearson Chi-Square Value = 8.128
Asymp. Sig. (2-sided) = 0.229
Table 8 Life style cluster and investment choice
Sl. No. Investment Choice
Cluster Total
Aggressive
investors
Moderate
investors
Conservative
investors
1 Equity shares 9 3 9 21
2 Mutual funds 1 1 2 4
3 Fixed deposits 1 1 4 6
4 Post office savings schemes
7 3 1 11
5 Life insurance policies
8 3 8 19
6 Debentures 8 5 4 17
7 Gold and silver 8 6 4 18
8 Real estate 6 3 2 11
9 Recurring deposits 2 2 2 6
10 Derivatives 4 2 1 7
Total 54 29 37 120
Lifestyle cluster wise segregation of investors towards preferred investment choice is exhibited in table 8. The analysis show that of the 54 aggressive investors, 17% preferred equity shares, 13% preferred post office saving schemes, 15% each preferred life insurance products, debentures, gold and silver. Only 2% of the aggressive investors preferred mutual fund and fixed deposits. The analysis of investment choice of moderate investors show that 21% of the moderate investors preferred gold and silver followed by 17% in debentures. Investment choice was very less in mutual funds and fixed deposits. Conservative investors preferred equity shares and life insurance policies as a preferred choice as indicated by 24% and 22% respectively. Followed by this, fixed deposits, debentures, gold and silver were in the list of their investment preferences.

15
Conclusion and scope for further study
It can be concluded that the modern investor is a mature and adequately seasoned person. In spite of its phenomenal growth in the capital market and quality IPOs in the market, the individual investor prefers less risky investment products such as life insurances, debentures and fixed deposits etc. Occasion of blind investments are scarce as a majority of the investors are found to be using some source of information to take investment decision. They consider multiple factors and seek diversified information before executing the investment transaction. Psychographics i.e., life style characteristics play an important role in determining the investment behaviour and preference of individual investors. Brokers who are in direct touch with the investors play an important role in keeping the capital market vibrant by providing various services to the investors furnishing update and relevant information, probably would be the major contribution of these middlemen. Consultants and analysts in the capital market also play the same role.
Future studies can be undertaken on the effect of psychological biases in investment decision making process. Neural networks can be used to assess the investor behaviour. Besides, the study can be extended to a larger sample with different models for examining the patterns in investor behaviour.
References
1. Barber B and Odean T (2001), " Boys will be Boys: Gender, Overconfidence and Common Stock
Investment ", Quarterly Journal of Economics, Vol. 116, No. 2, pp. 261-292. 2. Barnewall M (1987), “Psychological Characteristics of the Individual Investors"' in William Droms ,
ed., Asset Allocation for the Individual Investor, Charlottesville , Va: The Institute Of Chartered Financial Analysts.
3. BarnewallMacGruder M (1988), “Examining the Psychological Traits Of Passive and Active Investors ", Journal of Financial Planning, available at www.fpanet.org/journals/articles/1988_issues.
4. Chandra .P (2010) Investment Analysis and Portfolio Management, Noida:Tata McGraw Hill Education.
5. Gupta Ramesh (1991), "Portfolio Management: The Process and Its Dynamics ", Working Paper No.923, January - March, Indian Institute of Management, Ahmadabad.
6. Harlow W V and Keith C Brown (1990), the Role of Risk Tolerance in the Asset Allocation Process: A New Perspective, Association for Investment Management.
7. Khan and Jain (2007). Financial Management. New Delhi: Tata McGraw-Hill Education. 8. Langer E J (1975)," The illusion of Control ", Journal of Personality and Social Psychology,
Vol.32,No.2, pp.311-328. 9. R. Shanmugham (2010) Financial Services, New Delhi; Wiley India Pvt Ltd. 10. Statman Meir (1988), "Investor psychology and Market Inefficiencies", in Katrina F Sherrerd (Ed.),
Equity Markets and valuation Methods, The Institute of Chartered Financial Analysts, Charlottesville, Virginia.
16
Teaching Management Concepts Through Cinema - An
Empirical Study
SAMSMRITI – The SAMS Journal
Vol. 9(2), July – December 2015
pp. 16-22
Padmalini Singh1
Dr.Rizwana2
1 Assistant Professor, Department of Management Studies, M .S.Ramaiah Institute of Technology, Bangalore. 2Associate Professor, Department of Management Studies, M .S.Ramaiah Institute of Technology, Bangalore.
Key words
Cinema;
Learning;
Management;
Teaching
Abstract: Cinema is the most interesting and powerful way of communication used by
majority of the marketers. Through cinema one can understand his/her own life and can visualize the actual functioning of the society which they belong to. Cinemas have a very
strong audio-visual element that appeal to larger audience. When cinema can provide
entertainment to the masses undoubtedly it can become an excellent mode of mass teaching
and mass education. In this context, the present study is an attempt to understand whether
cinema can be used as effective media to study management concepts. For the purpose of
study, survey was conducted using structured questionnaire that were sent randomly to the
teachers and students across different city in India through e-mail. As respondents were
spread over diverse area convenience sampling technique has been employed. The study
found that there is high acceptability for integrating cinema as a part of curriculum and it can
also be used as an effective medium to study management concepts. This paper provides an
opportunity for educational institutions to know the importance of cinema as a tool to study
management concepts and include it in their course material.
Introduction
Learning starts as a casual instruction from our home and progressively stretches out itself as a
formal education in classroom in schools and colleges in a highly composed and formal manner
.In the due course of learning, there are numerous lessons taught by the teachers and
instructors, few of which gets cluttered as the time goes by and very few are carried all through
our lifetime. Despite the fact that every lesson is just as imperative however its consistency in our
memory is easy to refute. Management lessons taught in customary manner from books have
taken a leap to new approaches by the premier institutions in our country. Teaching management
lessons from cinema is one of the most recent teaching methodologies, which is proving
promising amongst the students. Since its inception, cinema has promoted awareness of ethical
problems (Juan Jorge Michel Farina, 2009). Its supreme presence and its exposure to bigger
gatherings make it easily acceptable form of learning. Cinemas have an audio - visual element
along with characters and dialogues make the students to involve completely in the story and
help them to extract management lessons very easily. The messages passed on through the
cinema have an enduring impact on the listeners than any other medium. The audiences have
complete emotional and moral involvement during the course of events that takes place in the
cinema Different characters, their method for conveying a dialogs leaves a long lasting impact on
the gatherings of people. Cinemas have the best potential to be one of the most effective media
to convey thoughts, ideas, imagination, morals, culture and ethics. When cinema can provide
entertainment to the masses, certainly it could become a means of mass instruction and mass
education.
Review of Literature
In order to conceive the objective of the study an extensive review of literature about role of cinema in teaching has been studied. For the purpose of research few important literatures has been summarized below.
17
Mahmood (2013) in his study titled “Influence of cinema on the life style of educated youth: A study on university of Bangladesh” made an effort to understand the influence of the film/cinema on university students of Bangladesh. The required data for the study has been collected through structured questionnaire method and purposive sampling was used to collect data from 120 respondents. The study found that there is unquestionable influence exist between cinema and society. Cappelletti, Gabriela, & Tenutto (2007) in their study titled “Can we teach better: the relationship between cinema and teaching “made an attempt to provide few ideas about the importance of cinema with its audio visual narrative. The study stated that the use of film in teaching offers the probablity of enhancing students ability to reflect on the issues of importance. Berk (2009) in his study titled “Multimedia teaching with video clips: TV, movies, YouTube, and mtv in the college classroom.” made an attempt to prove how can video clips embedded in multimedia presentations be used to improve learning in college courses. It was stated that a video can have a strong effect on one‟s mind and senses. The same impact of experiencing the powerful cognitive and emotional feel will exist among students when a faculty uses video clips as an instructional tool. Pandey (2012) in his study titled “Using popular movies in teaching cross‐cultural management”
made an attempt to understand context and dynamics of cognitive learning of students as an outcome of the usage of popular movies as a learning tool in the management classroom and particularly in the perspective of a course on cross‐cultural management issues. The findings of
this study reveals that the respondents found selected movies very relevant and effective in learning cross‐cultural theories, issues and developing cross‐cultural competence. Both the
students and instructors showed a positive sign regarding the effectiveness of movies as classroom learning tool. Bay & Felton (2012) in their study titled” Using Popular Film as a Teaching Resource in Accounting classes” described a pedagogical experiment that utilized feature films in a senior accounting class to stimulate development of student competencies and raise ethical issues. The students found that the movies propelled them to learn, producing more than the standard measure of support, and they considered the task important and most completed these homework assignments.
Objective of the Study
The main objective of the study is to determine whether cinema can be used as an effective media to study management concepts.
Research Methodology
For the purpose of study survey was conducted using structured questionnaire that were sent randomly to the teachers and students across different city in India through e-mail. Convenience sampling was employed as respondents were spread over diverse area. Questionnaire was sent to 200 respondents (teachers and students) across India, out of which 121 responses were obtained (52 teachers and 69 students). The results of the research have been analysed using SPSS 15.0 software.
Limitations of the Study
Due to time constraints only 121 responses were collected through internet and hence deeper insights about the respondents‟ opinion was not possible through interview schedule.

18
Results and Discussions
Table 1 Cinema conveying message
Occupation
Cinema conveys message
Total
Str
on
gly
d
isag
ree
Dis
ag
ree
Ne
utr
al
Ag
ree
Str
on
gly
ag
ree
Teacher
Count 1 9 9 28 5 52
% within Occupation 1.9% 17.3% 17.3% 53.8% 9.6% 100.0%
% of Total 0.8% 7.4% 7.4% 23.1% 4.1% 43.0%
Student
Count 4 5 20 33 7 69
% within Occupation 5.8% 7.2% 29.0% 47.8% 10.1% 100.0%
% of Total 3.3% 4.1% 16.5% 27.3% 5.8% 57.0%
Total
Count 5 14 29 61 12 121
% within Occupation 4.1% 11.6% 24.0% 50.4% 9.9% 100.0%
% of Total 4.1% 11.6% 24.0% 50.4% 9.9% 100.0%
The analysis of table 1 reveals that 63.4% teachers and 57.9% students agree that they watch films as it conveys some message. This implies that cinema is watched for extracting some message both by teachers as well as students.
Table 2 Audio-visual-character impact on retaining message
Occupation
Audio-visual-character impact on retaining message
Total
Str
on
gly
dis
ag
ree
Dis
ag
ree
Ne
utr
al
Ag
ree
Str
on
gly
a
gre
e
Teacher
Count 0 2 1 35 14 52
% within Occupation 0% 3.8% 1.9% 67.3% 26.9% 100.0%
% of Total 0% 1.7% .8% 28.9% 11.6% 43.0%
Student
Count 1 2 8 42 16 69
% within Occupation 1.4% 2.9% 11.6%
60.9% 23.2% 100.0%
% of Total 0.8% 1.7% 6.6% 34.7% 13.2% 57.0%
Total
Count 1 4 9 77 30 121
% within Occupation 0.8% 3.3% 7.4% 63.6% 24.8% 100.0%
% of Total 0.8% 3.3% 7.4% 63.6% 24.8% 100.0%
From table 2 it is interpreted that 94.2% teachers and 84.1% students agrees that the character
in the films along with audio-visuals have a strong impact on their message retention.

19
Table 3 Self- learning from cinema
Occupation
Self- learning from cinema
Total
Str
on
gly
d
isag
ree
Dis
ag
ree
Ne
utr
al
Ag
ree
Str
on
gly
ag
ree
Teacher
Count 1 2 9 34 6 52
% within Occupation 1.9% 3.8% 17.3% 65.4% 11.5% 100.0%
% of Total .8% 1.7% 7.4% 28.1% 5.0% 43.0%
Student
Count 2 2 10 44 11 69
% within Occupation 2.9% 2.9% 14.5% 63.8% 15.9% 100.0%
% of Total 1.7% 1.7% 8.3% 36.4% 9.1% 57.0%
Total
Count 3 4 19 78 17 121
% within Occupation 2.5% 3.3% 15.7% 64.5% 14.0% 100.0%
% of Total 2.5% 3.3% 15.7% 64.5% 14.0% 100.0%
It is inferred from table 3 that 76.9 % teachers and 79.7% students feels that films helps in self learning. It infers that people can learn from cinema.
Table 4 Cinema for mass education
Occupation
Cinema for mass education
Total
Str
on
gly
d
isag
ree
Dis
ag
ree
Ne
utr
al
Ag
ree
Str
on
gly
ag
ree
Teacher
Count 1 1 4 28 18 52
% within Occupation 1.9% 1.9% 7.7% 53.8% 34.6% 100.0%
% of Total 0.8% .8% 3.3% 23.1% 14.9% 43.0%
Student
Count 1 3 10 38 17 69
% within Occupation 1.4% 4.3% 14.5% 55.1% 24.6% 100.0%
% of Total 0.8% 2.5% 8.3% 31.4% 14.0% 57.0%
Total
Count 2 4 14 66 35 121
% within Occupation 1.7% 3.3% 11.6% 54.5% 28.9% 100.0%
% of Total 1.7% 3.3% 11.6% 54.5% 28.9% 100.0%
Table 4 reveals that 88.4% teachers and 79.7% students have opined like responses that cinema can be used for mass education. It reflects that cinema can cater to large audience to deliver message. Cinema can also be customised to fit a particular audience for educating them over issues.

20
Table 5 Cinema as a medium to study management concepts
Occupation
Cinema as a medium to study management concepts
Total
Str
on
gly
d
isag
ree
Dis
ag
ree
Ne
utr
al
Ag
ree
Str
on
gly
ag
ree
Teacher
Count 1 1 6 28 16 52
% within Occupation 1.9% 1.9% 11.5% 53.8% 30.8% 100.0%
% of Total 0.8% 0.8% 5.0% 23.1% 13.2% 43.0%
Student
Count 1 3 16 36 13 69
% within Occupation 1.4% 4.3% 23.2% 52.2% 18.8% 100.0%
% of Total 0.8% 2.5% 13.2% 29.8% 10.7% 57.0%
Total
Count 2 4 22 64 29 121
% within Occupation 1.7% 3.3% 18.2% 52.9% 24.0% 100.0%
% of Total 1.7% 3.3% 18.2% 52.9% 24.0% 100.0%
Table 6 Cinema is more effective than case study
Occupation
Cinema is more effective than case study
Total
Str
on
gly
d
isag
ree
Dis
ag
ree
Ne
utr
al
Ag
ree
Str
on
gly
ag
ree
Teacher
Count 2 9 15 17 9 52
% within Occupation 3.8% 17.3% 28.8% 32.7% 17.3% 100.0%
% of Total 1.7% 7.4% 12.4% 14.0% 7.4% 43.0%
Student
Count 1 9 11 31 17 69
% within Occupation 1.4% 13.0% 15.9% 44.9% 24.6% 100.0%
% of Total .8% 7.4% 9.1% 25.6% 14.0% 57.0%
Total
Count 3 18 26 48 26 121
% within Occupation 2.5% 14.9% 21.5% 39.7% 21.5% 100.0%
% of Total 2.5% 14.9% 21.5% 39.7% 21.5% 100.0%
The figures in table 5 shows that those 84.6% teachers and 71% students feel that cinema can be used as an effective medium to study management concepts. Only 1.9% and 4.3% teachers and students respectively disagree with this idea. Majority of them believe that cinema can be used to study management concepts. It is inferred from table 6 that, 37.2% teachers and 44.9% students agree and 17.3% teachers and 24.6% students strongly agree that cinema is more effective than case studies. It shows that students strongly favour cinema over case study and even teachers do.

21
Table 7 Cinema focuses on practical issue
Occupation
Cinema focuses on practical issue
Total
Str
on
gly
d
isag
ree
Dis
ag
ree
Ne
utr
al
Ag
ree
Str
on
gly
ag
ree
Teacher
Count 1 5 13 25 8 52
% within Occupation 1.9% 9.6% 25.0% 48.1% 15.4% 100.0%
% of Total 0.8% 4.1% 10.7% 20.7% 6.6% 43.0%
Student
Count 2 6 10 35 16 69
% within Occupation 2.9% 8.7% 14.5% 50.7% 23.2% 100.0%
% of Total 1.7% 5.0% 8.3% 28.9% 13.2% 57.0%
Total
Count 3 11 23 60 24 121
% within Occupation 2.5% 9.1% 19.0% 49.6% 19.8% 100.0%
% of Total 2.5% 9.1% 19.0% 49.6% 19.8% 100.0%
It is inferred from table 7 that 63.5% teachers and 73.9% students opines that cinema focuses on practical issue that are more easy to understand. However, 25% teachers and 14.5% students gave neutral response that means 39.5% neutral response may agree with the statement in future.
Table 8 Cinema learning‟s in MBA Curriculum
Occupation
Cinema learning‟s in MBA Curriculum
Total
Str
on
gly
dis
ag
ree
Dis
ag
ree
Ne
utr
al
Ag
ree
Str
on
gly
a
gre
e
Teacher
Count 1 2 2 25 22 52
% within Occupation 1.9% 3.8% 3.8% 48.1% 42.3% 100.0%
% of Total 0.8% 1.7% 1.7% 20.7% 18.2% 43.0%
Student
Count 2 4 5 31 27 69
% within Occupation 2.9% 5.8% 7.2% 44.9% 39.1% 100.0%
% of Total 1.7% 3.3% 4.1% 25.6% 22.3% 57.0%
Total
Count 3 6 7 56 49 121
% within Occupation 2.5% 5.0% 5.8% 46.3% 40.5% 100.0%
% of Total 2.5% 5.0% 5.8% 46.3% 40.5% 100.0%

22
Table 8 shows that 90.4% teachers and 84% students feel that learning‟s from films should be included in MBA curriculum. The result shows that teachers are more inclined towards the idea of teaching management concepts from cinema.
Conclusion
The study found that that teachers as well as students agrees to the fact that cinema contributes to study management concepts and majority among them wants cinema learning to be included in MBA curriculum. Movies offers easy way of learning concepts through visuals and allows people to relate themselves to characters of the movie and helps them to retain ideas and concepts. Time has come when selected movies should be added to a course material in management colleges and even its importance should be realised soon in corporate to develop and train employees by motivating them and making them learn some essential management lessons from movies.
References
1. Bay, D., & Felton, S. (2012). Using Popular Film As A Teaching Resource In Accounting Classes. American Journal of Business Education , 5 (2), 159-172.
2. Berk, R. A. (2009). Multimedia teaching with video clips: TV, movies, YouTube, and mtvU in the college classroom. International Journal of Technology in Teaching and Learning , 5 (1), 1-21.
3. Cappelletti, G. L., Gabriela, M. J., & Tenutto, M. A. (2007). Can we teach better: The relationship between cinema and teaching . Retrieved June 5, 2015, from http://revistamedicinacine.usal.es/es/volumenes/90-vol3/num315/872-can-we-teach-better-the-relationship-between-the-cinema-and-teaching
4. Juan Jorge Michel Farina (2009). A model for teaching bioethics and human rights through cinema and popular TV series: A methodological approach. Counselling Psychology Quarterly , 22 (1), 105-117.
5. Mahmood, I. (2013). Influence and importance of cinema on the lifestyle of educated youth: A study on university of bangladesh. Journal of Humanities and Social Science , 17 (6), 77-80.
6. Pandey, S. (2012). Satish Pandey, (2012) "Using popular movies in teaching cross‐cultural management. European Journal of Training and Development , 36 (2/3),
329-350.

23
Performance Analysis of Selected Tax Saving Mutual
Funds in India SAMSMRITI – The SAMS Journal
Vol. 9(2), July – December 2015 pp. 23-35
Yashik Fawas A N
Transaction Processing Officer, Mphasis, Bangalore
Key words
Stock selection;
Market performance;
Market timing;
Mutual funds
Abstract: In this research paper it is explored, whether tax savings mutual funds offer
investors a better return than the market returns. It also tries to assess the diversification
benefits provided by the fund managers of these schemes. The sample size is 30 schemes.
Various performance measures are used to assess the risk-return profile of these schemes. It
was inferred from the study that majority of the tax savings schemes failed to outperform the
broad market index and provided diversification advantages to the investors.
Introduction
Everybody in the world wants to maximize his/her wealth. Another very important observation to make along with the first one is that, equity is the only asset class which outperforms all other asset classes in the long run. However, very few people prefer investing in the equity. This is because, investments in direct equity are highly volatile and a wrong stock picking may result in destruction of capital leaving aside earning good returns. Wealth creation from investing directly in stock depends a lot on investor‟s knowledge, patience and time dedicated to the investments. However most retail investor‟s route to the markets is what Mutual Fund is known as. This route offers several important advantages over direct stock-picking. Mutual Fund is an institution that pools the savings of small investor‟s for investment in capital market and money market securities. The Mutual Fund invests in diversified securities so as to reduce the investment risks. The portfolio is managed by the Mutual Fund and the returns from the investments are distributed to the Mutual Fund investors as dividends. Even a small amount can be invested in the units of Mutual Fund schemes. This enables the investors to derive the benefits of diversification which otherwise would not have been possible with smaller investments. Mutual Fund concept has emerged basically to address two issues. First, the investors may not be in a position to choose the securities for their portfolio from among the multitude of securities available in the market. It is better to leave the job of selection to experts. Second, because of the limited fund available with an investor, he may not be able to have a diversified portfolio and thus derive the benefit of risk reduction. Mutual funds come handy for those investors to derive the diversification benefits with smaller amounts of investment.
Review of Literature
Treynor (1965) devised a concept of fund performance which takes investment of risk into account. He used a concept „characteristic line‟ for relating expected rate of return of a fund to the rate of a return of a suitable market average so as to obtain satisfactory performance measure. Risk in a diversified fund is a sum of responses to a) general market fluctuation and b) fluctuation peculiar to the particular securities held by the fund. If a fund is properly diversified, the later risk tends to average out. In a sample of 54 American mutual funds, it was found that four out of five demonstrate fairly clear-cut characteristic line partners with the correlation coefficient equal to or exceeding 90%. Sharpe (1966) attempted to evaluate the performance of mutual funds through the capital market model that deals with future predictions regarding performance by substituting actual returns and actual standard deviation values i.e. Ai and Vi respectively instead of expected return and

24
predicted deviation values. The performance analysis of 34 open-ended mutual funds during the period 1954-63 showed that mutual funds with large average returns typically exhibit greater variability than those with small average returns. Moreover, the relationship is approximately linear and significant. Treynor and Mazuy (1966) conducted a study whether Mutual Fund managers can outguess the market i.e. can they anticipate successfully the major changes in the stock market? In this context, the study examines whether there is any evidence that the volatility of the fund was higher in years when the market did well than in years when the market did badly. The analysis of a sample of 57 open-ended funds over a time period from 1953-62 showed that none of the investments managers of these 57 funds has successfully outguessed the market. It is not to be mentioned that a fund manager cannot provide the investor with a rate of return that is higher in rising or falling markets and also provide that to fund manager‟s ability to identify unpredicted industries and companies will lead to improvement in rate of return rather than due to any ability to outguess the moves in the market and thus, they should not be held responsible for failure to foreseen changes in the market climate. Jensen (1968) conducted a study to evaluate performance of portfolios of risky investments from distinct dimension of portfolio manager‟s predictive ability- that is his ability to earn returns through successful prediction of security prices which are higher than those which we could expect given that the level of risk of his portfolio. Fama (1972) developed a methodology for evaluating investment performance of managed portfolios. He suggested that the overall performance could be broken down into several components. Robert J Shiller (1993) reported that many investors do not have data analysis and interpretation skills. This is because data from the market supports the merit of index investing; passive investors are more likely to base their investment choices of information received from objective or scientific sources. Jayadev (1996) evaluated the performance of two growth-oriented mutual funds namely Mastergain and Magnum express by using monthly returns. Jensen, Sharpe and Treynor measures have been applied in the study and the pointed out that according to Jensen and Treynor measure Mastergain have performed better and the performance of Magnum was poor according to all three measures. Afza and Rauf (2009) in their study of open-ended Pakistani mutual funds performance using the quarterly data for the period of 1996-2006 measured the fund performance by using Sharpe ratio with the help of pooled time-series and cross sectional data and also focused on different attributes such as fund size, expenses, age, turnover and liquidity. The results found significant impact on fund performance. Debasish (2009) studied the performance of selected schemes of mutual funds based on risk and return models and measures. The study covered the period from April 1996 to March 2005 (nine years). The study revealed that Franklin Templeton and UTI were the best performers and Birla Sun life, HDFC and LIC mutual funds showed poor performance. Ali, Naseem and Rehman (2010) in their study examined the performance of 10 mutual funds in which 5 were conventional and 5 were Islamic for the period from 2006 to 2008 by using Sharpe and Treynor measures. The results found that the funds of Pakistan were able to add more value either conventional or Islamic. The study also found that some of the funds were underperformed, so these funds were facing diversification problems during the study period. Sondhi and Jain (2010) examined the market risk and investment performance of equity mutual funds in India. The study used a sample of 36 equity fund for a period of 3 years. The study

25
examined whether high beta of funds have actually produced high returns over the study period. The study also examined that open-ended or close ended categories, size of fund and the ownership pattern significantly affect risk-adjusted investment performance of equity fund. The results of the study confirmed with the empirical evidence produced by Fama (1992) that high beta funds (market risks) may not necessarily produced high returns. The study revealed that the category, size and ownership have been significantly determined the performance of mutual funds during the study period. Prabakaran and Jayabal (2010) evaluated the performance of Mutual Fund schemes. The study conducted a sample of 23 schemes were chosen as per the priority given by the respondents in Dharmapuri district covered a period from April 2002 to March 2007. The study used the methodology of Sharpe, Jensen and Fama for the performance evaluation of mutual funds. The results of the study found that 13 schemes out of 23 schemes selected had superior performance than the benchmark portfolio in terms of Sharpe ratio, 13 schemes had superior performance of Treynor ratio and 14 schemes had superior performance according to Jensen measure. The Fama‟s measure indicated in the study that the returns out of diversification were less. Thus the India Mutual funds were not properly diversified. Garg (2011) examined the performance of top ten mutual funds that was selected on the basis of previous years return. The study analyzed the performance on the basis of return, standard deviation, beta as well as Treynor, Jensen and Sharpe indexes. The study also used Carhart‟s four-factor model for analyze the performance of mutual funds. The results revealed that Reliance Regular Saving Scheme Fund had achieved the highest final score and Canara Robeco Infra had achieved the lowest final score in the one year category. Zabiulla (2014) examined the portfolio strategies of fund managers in the Indian capital market. The study found that the fund managers exhibited poor stock selection skills and failed to show any distinguishable ability in timing. The fund managers were unsuccessful in determining the right time to enter or exit the market.
Statement of the Problem The impressive in the growth in the Mutual Fund in the recent years can largely be attributing to various factors such as household savings, comprehensive regulatory framework, favourable tax policies, introduction of several new products, investors education campaign and role of distributors. SEBI has introduced various regulatory measures in order to protect the interest of small investors and the tax benefits allowed on mutual funds schemes are tax deductions under Sec 80 C of the Income Tax Act also have helped Mutual Fund to evolve as the preferred form of investment among the salaried income earners. The investors prefer safety of the principal amount, regular return, long term growth, income tax benefit etc. The mutual funds schemes have been design based on the preferences of the investors. But the Mutual Fund in our country have been quite wrongly promoted as an alternative to equity investing and create very high expectations in the minds of investors. The investors who invest in growth or equity schemes consider it is an alternative to stock market investing and the investors who invest in dept schemes expect higher returns on their investment than return on bank deposits. So this analysis evaluating that, the Mutual Fund is an ideal investment vehicle for today‟s complex and modern financial scenario and also analyzes the performance of selected tax saving Mutual Fund scheme to fulfil the objective of the investors.
Objectives of the study
The study has the following objectives:
a) To evaluate the performance of selected schemes in comparison with benchmark index BSE Sensex.

26
b) To assess the fund performance using risk return framework c) To compare the performance of selected tax saving Mutual Fund schemes with market
portfolio.
Hypotheses
Hypothesis 1 H0: Mutual Fund scheme offer high return than market index. H1: Mutual Fund scheme do not offer high return than market index. Hypothesis 2 H0: Mutual Fund scheme are riskier than market index. H1: Mutual Fund scheme are not riskier than market index. Hypothesis 3 H0: Mutual Fund scheme offer the benefit of diversification. H1: Mutual Fund scheme do not offer the benefit of diversification
Sample
The study revolves around selected tax saving Mutual Fund Scheme in India. The choice of the sample is largely based on the availability of the necessary data. Daily Net Asset Value (NAV) data has been used for performance evaluation. The sample includes the following schemes:
Table 1 Sample tax saving mutual fund schemes
Sl. No. Schemes
Sl. No. Schemes
1 Axis Long Term Equity Fund 16 IDFC Tax Advantage(ELSS) Fund
2 Baroda Pioneer ELSS 96 17 ING Tax Saving Fund
3 Birla Sun Life Tax Plan 18 JM Tax Gain Fund
4 BOI Axa Tax Advantage Fund-Eco 19 JP Morgan India Tax Advantage Fund
5 BOIAxa Tax Advantage Fund-Reg 20 Kotak Tax Saver
6 Canara Robecco Equity Tax Saver 21 LIC Nomura Tax Plan
7 DSP Blackrock Tax Saver Fund 22 Principal Personal Tax Saver
8 DWS Tax Saving Fund 23 Principal Tax Saving Fund
9 Edelweiss ELSS Fund 24 Quantum Tax Saving Fund
10 Escort Tax Plan 25 Reliance Tax Saver (ELSS)Fund
11 Franklin India Taxsheild 26 Sahara Tax Gain
12 HDFC Long Term Advantage Fund 27 Sundaram Tax Saver
13 HDFC Tax Saver 28 Tata Tax Saving Fund
14 HSBC Tax Saver Equity Fund 29 Taurus Tax Shield
15 ICICI Prudential Tax Plan 30 UTI Equity Tax Saving Plan
The study is entirely based on secondary data. The information regarding the Mutual Fund Industry, its growth an about its future were collected through Magazine, Journals and Website etc. The data regarding NAVs were collected from Association of Mutual Fund in India

27
(AMUTUAL FUNDI). The Market Return and risk free rate of return were calculated from nseindia.com. The study period is 48 months (Jan 2010 to Dec 2013). Daily NAV as declared by Mutual Fund for the period has been used for the purpose. Any missing value for the scheme and for the index series has been excluded to equalize the two.
Methodology The following measures are used to evaluate the performance of Selected Tax Saving Mutual Fund Scheme in India: Average Returns: Return for both market and the scheme has been calculated from the daily index value and Net Asset Value (NAV) respectively. The value for each day over the previous day has been calculated and it has been divided by the value of previous day. Then the average of the series so developed has been taken. The daily return is calculated as: NAVt -NAVt-1 Portfolio Return Rit = NAV t-1
Where Rit is the difference between Net Asset Value (NAVs) for two consecutive days divided by the NAV of proceeding day. M.Indt – M.Ind t-1
Market Return Rmt = M.Ind t-1
Where Rmt is the difference between markets indices of two consecutive days divided by market index of preceding day. Beta: Beta coefficient compares the variability of the funds return to the market as a whole. It is a relative measure unlike absolute measure (Standard Deviation). By convention, market will have a beta 1.0. Mutual Fund can be as volatile, more volatile or less volatile. If a fund has below market beta of 0.86, it can be said that fund has 86% of the volatility of the market. I.e. relative to the market index it will capture only 86% of the gain in up markets and decline by 86% of the drop in the index in down markets. Diversifiable Risk: The diversified risk is defined as the excess of ratio of standard deviation of portfolio to the standard deviation of portfolio over the beat of the portfolio. It is calculated as: Diversified Risk= {(σp/σm) – βp} For a well diversified portfolio, diversifiable risk is zero. Higher the value, more poor is the diversifiable and vice-versa. Sharpe’s Ratio: Given W F Sharpe‟s in 1966, it is expressed as the ratio of the excess return per unit of risk, where risk is measured by the standard deviation of the rate of return. In short, it is the reward to variability ratio and is defined as: Sharpe‟s Index: SI= (RP-Rf)/σP Where SI= Sharpe‟s Ratio RP= Average return on fund p

28
σp= Standard deviation of return on fund p and Rf = Risk free rate of return The ratio is based on the fact that preferred portfolio lies on the most counter clockwise ray in the expected return and standard deviation space I.e. the slope of the ray is maximized and is denoted by Sharpe‟s ratio. The ratio views at the decision from the angel of the investor who chooses Mutual Fund that represents the majority of his investment. Treynor’s Index: Given by Jack Treynor in 1965, it is expressed as a ratio of returns to systematic risk (beta). Precisely, it is reward to volatility ratio and is defined as: Treynor‟s Index: TI = (RP – Rf) / βp Where TI = Treynor‟s Ratio β p = sensitivity ratio R p = Average return on fund p and R f = Risk free rate of return This measure is based on the fact that preferred portfolio lies on the most counter clockwise ray in the expected return- beta space i.e. the slope of the ray is maximized and is expressed as Treynor‟s ratio. It measures portfolio risk in terms of beta that is the weighted average of individual security beta. The ratio is relevant to investors for whom the fund represents only a fraction of their total of their total assets. The higher the ratio better is the performance. Jensen’s Measure: It is a regression of excess fund return with excess market return given by MC Jensen in 1968. It is popularly known as Jensen‟s alpha, is based on Capital Asset Pricing Model (CAPM). It reflects the difference between the return actually earned on a portfolio and return the portfolio was suppose to earn, given its beta as per the CAPM. Thus, the Jensen measure is expressed as: JM= Rp - [Rf+ βp (Rm -Rf )] Where JM = Jensen‟s Measure Rp = Average return on fund p Rf = Risk rate of return Βp = Portfolio beta A positive and significant alpha reflects superior performance of the scheme and vice-versa.
Limitations of the study
Limitation of the study reveals the drawback of the data, analysis and techniques. The limitations are:
a) The time period selected for conducting the study was limited. b) The analysis and interpretation purely based on data collected from various website. The
accuracy of interpretation depends on the accuracy of these data c) The data collected for analysis were only for 3 years (January 2010 to December 2013).
Hence, the findings of the study may vary during other market cycles.
Results and Discussions The average daily returns of Axis Long Term Equity Fund (0.552), HDFC Long Term Advantage Fund (0.0396), IDFC Tax Advantage (ELSS) Fund (0.0394), ICICI Prudential Tax Plan (0.0383), Quantum Tax Saving Fund (0.0372), Franklin India Taxsheild (0.0363), Canara Robecco Equity Tax Saver (0.0345), Reliance Tax Saver (ELSS) Fund (0.0334), Edelweiss ELSS Fund (0.0308), DSP Blackrock Tax Saver Fund (0.0306), JP Morgan India Tax Advantage Fund (0.0277), Sahara Tax Gain (0.0257), HDFC Tax Saver (0.0261), Birla Sun Life Tax Plan (0.0257), HSBC
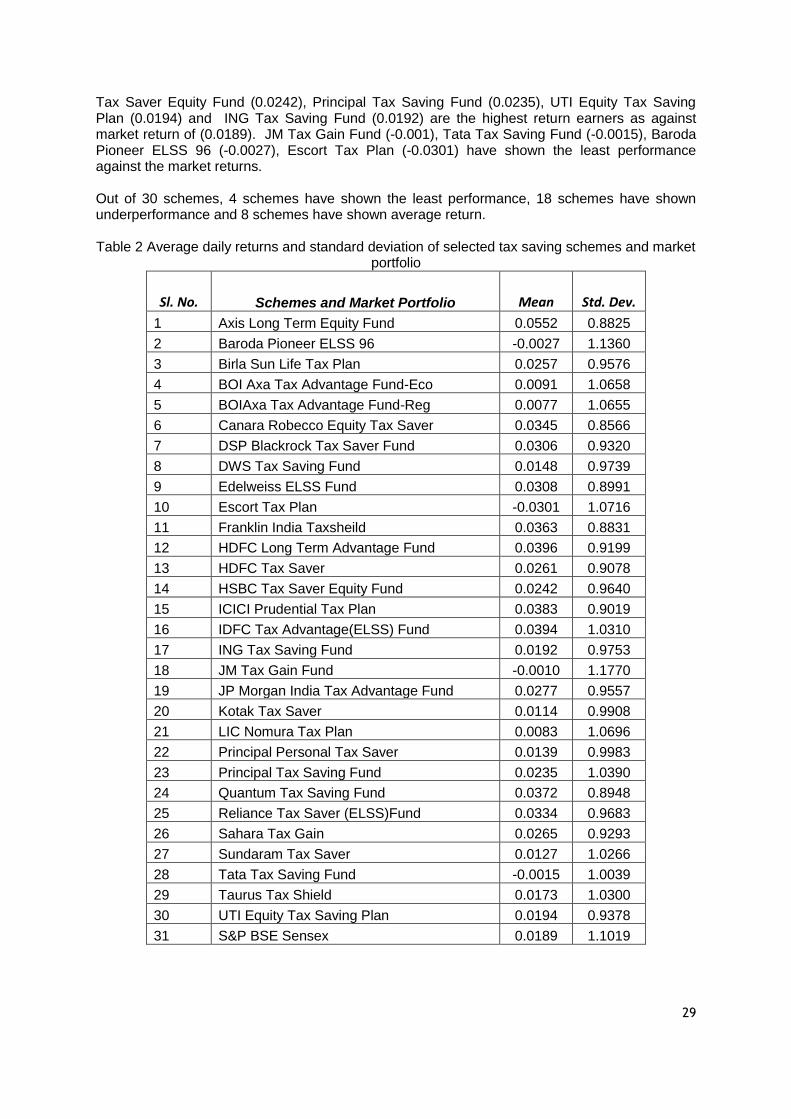
29
Tax Saver Equity Fund (0.0242), Principal Tax Saving Fund (0.0235), UTI Equity Tax Saving Plan (0.0194) and ING Tax Saving Fund (0.0192) are the highest return earners as against market return of (0.0189). JM Tax Gain Fund (-0.001), Tata Tax Saving Fund (-0.0015), Baroda Pioneer ELSS 96 (-0.0027), Escort Tax Plan (-0.0301) have shown the least performance against the market returns. Out of 30 schemes, 4 schemes have shown the least performance, 18 schemes have shown underperformance and 8 schemes have shown average return.
Table 2 Average daily returns and standard deviation of selected tax saving schemes and market
portfolio
Sl. No. Schemes and Market Portfolio Mean Std. Dev.
1 Axis Long Term Equity Fund 0.0552 0.8825
2 Baroda Pioneer ELSS 96 -0.0027 1.1360
3 Birla Sun Life Tax Plan 0.0257 0.9576
4 BOI Axa Tax Advantage Fund-Eco 0.0091 1.0658
5 BOIAxa Tax Advantage Fund-Reg 0.0077 1.0655
6 Canara Robecco Equity Tax Saver 0.0345 0.8566
7 DSP Blackrock Tax Saver Fund 0.0306 0.9320
8 DWS Tax Saving Fund 0.0148 0.9739
9 Edelweiss ELSS Fund 0.0308 0.8991
10 Escort Tax Plan -0.0301 1.0716
11 Franklin India Taxsheild 0.0363 0.8831
12 HDFC Long Term Advantage Fund 0.0396 0.9199
13 HDFC Tax Saver 0.0261 0.9078
14 HSBC Tax Saver Equity Fund 0.0242 0.9640
15 ICICI Prudential Tax Plan 0.0383 0.9019
16 IDFC Tax Advantage(ELSS) Fund 0.0394 1.0310
17 ING Tax Saving Fund 0.0192 0.9753
18 JM Tax Gain Fund -0.0010 1.1770
19 JP Morgan India Tax Advantage Fund 0.0277 0.9557
20 Kotak Tax Saver 0.0114 0.9908
21 LIC Nomura Tax Plan 0.0083 1.0696
22 Principal Personal Tax Saver 0.0139 0.9983
23 Principal Tax Saving Fund 0.0235 1.0390
24 Quantum Tax Saving Fund 0.0372 0.8948
25 Reliance Tax Saver (ELSS)Fund 0.0334 0.9683
26 Sahara Tax Gain 0.0265 0.9293
27 Sundaram Tax Saver 0.0127 1.0266
28 Tata Tax Saving Fund -0.0015 1.0039
29 Taurus Tax Shield 0.0173 1.0300
30 UTI Equity Tax Saving Plan 0.0194 0.9378
31 S&P BSE Sensex 0.0189 1.1019

30
It may be noted that the standard deviation is ranging from 1.117 to 0.8599. all the schemes having standard deviation less than the market return (1.1019) except two schemes like JM Tax Gain Fund (1.1770), Baroda Pioneer ELSS 96 (1.136). So except these schemes the other schemes intended to hold portfolio that were less risky than the market portfolio. It was observed that the schemes namely JM Tax Gain Fund, Baroda Pioneer ELSS 96, Escort Tax Plan, LIC Nomura Tax Plan, BOI Axa Tax Advantage Fund-Eco, BOI Axa Tax Advantage Fund-Reg, Principal Tax Saving Fund, IDFC Tax Advantage (ELSS) Fund, Taurus Tax Shield, Sundaram Tax Saver, Tata Tax Saving Fund were found to be more risky as compared to other scheme. Canara Robecco Equity Tax Saver (0.8566) is the risky scheme.
Table 3 Systematic risk of selected tax saving schemes
Sl. No. Schemes Beta
Sl. No. Schemes Beta
1 Axis Long Term Equity Fund 0.736 16 IDFC Tax Advantage Fund 0.840
2 Baroda Pioneer ELSS 96 0.974 17 ING Tax Saving Fund 0.300
3 Birla Sun Life Tax Plan 0.810 18 JM Tax Gain Fund 0.957
4 BOI Axa Tax Advantage Fund-Eco 0.916 19 JP Morgan India Tax Adv Fund 0.010
5 BOIAxa Tax Advantage Fund-Reg 0.915 20 Kotak Tax Saver 0.852
6 Canara Robecco Equity Tax Saver 0.002 21 LIC Nomura Tax Plan 0.028
7 DSP Blackrock Tax Saver Fund 0.013 22 Principal Personal Tax Saver 0.865
8 DWS Tax Saving Fund 0.010 23 Principal Tax Saving Fund 0.871
9 Edelweiss ELSS Fund 0.736 24 Quantum Tax Saving Fund 0.743
10 Escort Tax Plan 0.118 25 Reliance Tax Saver Fund 0.743
11 Franklin India Taxsheild 0.756 26 Sahara Tax Gain 0.744
12 HDFC Long Term Advantage Fund 0.019 27 Sundaram Tax Saver 0.689
13 HDFC Tax Saver 0.749 28 Tata Tax Saving Fund 0.118
14 HSBC Tax Saver Equity Fund 0.812 29 Taurus Tax Shield 0.873
15 ICICI Prudential Tax Plan -0.007 30 UTI Equity Tax Saving Plan 0.658
The above table represents the systematic risk (beta) of 30 schemes considered for the purpose of the study. Higher the beta greater the volatility and it will be considered to be riskier. All the schemes have beta less than one (i.e. market beta) thereby implying that these schemes tend to hold portfolio that were less risky than the market portfolio. Baroda Pioneer ELSS 96 (0.974) were found to be more risky as compared to the other schemes of this category but less risky than the market portfolio. The schemes which show a higher value in risk premium are perform well in the category. Axis Long Term Equity Fund (0.0302), HDFC Long Term Advantage Fund (0.0146), IDFC Tax Advantage(ELSS) Fund (0.0144), ICICI Prudential Tax Plan (0.0133), Quantum Tax Saving Fund (0.0122), Franklin India Taxsheild (0.0133), Canara Robecco Equity Tax Saver (0.0095), Reliance Tax Saver (ELSS)Fund (0.0084), Edelweiss ELSS Fund (0.0058), DSP Blackrock Tax Saver Fund (0.0056), JP Morgan India Tax Advantage Fund (0.0027), Sahara Tax Gain (0.0015), HDFC Tax Saver (0.0011), Birla Sun Life Tax Plan (0.0007) are shown a positive value in the schemes. Escort Tax Plan (-0.0551) the worst scheme according is to risk premium calculation.

31
Table 4 Risk premium of selected tax saving schemes
Sl. No. Schemes
Risk Premium
Sl. No. Schemes
Risk Premium
1 Axis Long Term Equity Fund 0.0302 16 IDFC Tax Advantage Fund 0.0144
2 Baroda Pioneer ELSS 96 -0.0277 17 ING Tax Saving Fund -0.0058
3 Birla Sun Life Tax Plan 0.0007 18 JM Tax Gain Fund -0.026
4 BOI Axa Tax Advantage Fund-Eco -0.0159 19 JP Morgan India Tax Adv Fund 0.0027
5 BOIAxa Tax Advantage Fund-Reg -0.0173 20 Kotak Tax Saver -0.0136
6 Canara Robecco Equity Tax Saver 0.0095 21 LIC Nomura Tax Plan -0.0167
7 DSP Blackrock Tax Saver Fund 0.0056 22 Principal Personal Tax Saver -0.0111
8 DWS Tax Saving Fund -0.0102 23 Principal Tax Saving Fund -0.0015
9 Edelweiss ELSS Fund 0.0058 24 Quantum Tax Saving Fund 0.0122
10 Escort Tax Plan -0.0551 25 Reliance Tax Saver Fund 0.0084
11 Franklin India Taxsheild 0.0113 26 Sahara Tax Gain 0.0015
12 HDFC Long Term Advantage Fund 0.0146 27 Sundaram Tax Saver -0.0123
13 HDFC Tax Saver 0.0011 28 Tata Tax Saving Fund -0.0265
14 HSBC Tax Saver Equity Fund -0.0008 29 Taurus Tax Shield -0.0077
15 ICICI Prudential Tax Plan 0.0133 30 UTI Equity Tax Saving Plan -0.0056
The tabulated values of ‟diversified risk‟ show that all the schemes have a positive risk value. So it says that the entire schemes are well performed in nature. For a well diversified portfolio the value should be Zero or nearer to zero. In 30 schemes, Principal Personal Tax Saver has a diversifiable risk of (0.041); which is closer to 0. It indicates that Principal Personal Tax Saver is well diversifiable portfolio. It is highest in case of LIC Nomura Tax Plan (0.943) followed by DWS Tax Saving Fund (0.874) and JP Morgan India Tax Advantage Fund (0.857). It shows that LIC Nomura Tax Plan is more risky for diversification in this segment.
Table 5 Diversifiable risk of selected tax saving schemes
Sl. No. Schemes
Diversifiable risk
Sl. No. Schemes
Diversifiable risk
1 Axis Long Term Equity Fund 0.065 16 IDFC Tax Advantage Fund 0.096
2 Baroda Pioneer ELSS 96 0.057 17 ING Tax Saving Fund 0.585
3 Birla Sun Life Tax Plan 0.059 18 JM Tax Gain Fund 0.111
4 BOI Axa Tax Advantage Fund-Eco 0.051 19 JP Morgan India Tax Adv Fund 0.857
5 BOIAxa Tax Advantage Fund-Reg 0.052 20 Kotak Tax Saver 0.047
6 Canara Robecco Equity Tax Saver 0.775 21 LIC Nomura Tax Plan 0.943
7 DSP Blackrock Tax Saver Fund 0.833 22 Principal Personal Tax Saver 0.041
8 DWS Tax Saving Fund 0.874 23 Principal Tax Saving Fund 0.072
9 Edelweiss ELSS Fund 0.080 24 Quantum Tax Saving Fund 0.069

32
10 Escort Tax Plan 0.855 25 Reliance Tax Saver Fund 0.136
11 Franklin India Taxsheild 0.045 26 Sahara Tax Gain 0.099
12 HDFC Long Term Advantage Fund 0.816 27 Sundaram Tax Saver 0.243
13 HDFC Tax Saver 0.075 28 Tata Tax Saving Fund 0.793
14 HSBC Tax Saver Equity Fund 0.063 29 Taurus Tax Shield 0.062
15 ICICI Prudential Tax Plan 0.825 30 UTI Equity Tax Saving Plan 0.193
Table 6 depicts value of Sharpe‟s reward to variability ratio. It is an excess of return earned over risk free return per unit of risk involved.ie per unit of standard deviation. Negative value of index shows poor performance. It is important to note that 16 of the above scheme have shown negative Sharpe‟s ratio. The negative schemes namely Baroda Pioneer ELSS 96 (-0.024), BIO AXA Tax Advantage Regular (-0.016), BIO AXA Tax Advantage Eco (-0.015) , DWS Tax Saving Fund, Escorts Tax Plan, HSBC Tax Saver Equity Fund, ING Tax Saving Fund, JM Tax Gain, Kotak Tax Saver, LIC Nomura Tax Plan, Principal Personal Tax saver, Principal Tax Saving Fund, UTI Equity Tax Saving Plan, Sundaram Tax Saver, Tata Tax Saving Fund, Taurus Tax shield, UTI Equity Tax Saving Plan. Axis Long Term Equity Fund (0.034) is the best scheme according to Sharpe‟s Ratio. HDFC Long Term Advantage Fund (0.016), ICICI Prudential Tax Plan (0.015), IDFC Tax Advantage (ELSS) Fund, IDFC Tax Advantage (ELSS) Fund, Quantum Tax Saving Fund, Franklin India Taxsheild, Canara Robecco Equity Tax Saver, Reliance Tax Saver (ELSS) Fund, DSP Blackrock Tax Saver Fund, Edelweiss ELSS Fund, Sahara Tax Gain, Birla Sun Life Tax Plan are those schemes have outperformed in the market. But the market ratio (-0.006) shows a negative ratio.
Table 6 Sharpe‟s Ratio of selected tax saving schemes
Sl. No. Schemes
Sharpe's Ratio
Sl. No. Schemes
Sharpe's Ratio
1 Axis Long Term Equity Fund 0.034 16 IDFC Tax Advantage Fund 0.014
2 Baroda Pioneer ELSS 96 -0.024 17 ING Tax Saving Fund -0.006
3 Birla Sun Life Tax Plan 0.001 18 JM Tax Gain Fund -0.022
4 BOI Axa Tax Advantage Fund-Eco -0.015 19 JP Morgan India Tax Adv Fund 0.003
5 BOIAxa Tax Advantage Fund-Reg -0.016 20 Kotak Tax Saver -0.014
6 Canara Robecco Equity Tax Saver 0.011 21 LIC Nomura Tax Plan -0.016
7 DSP Blackrock Tax Saver Fund 0.006 22 Principal Personal Tax Saver -0.011
8 DWS Tax Saving Fund -0.010 23 Principal Tax Saving Fund -0.001
9 Edelweiss ELSS Fund 0.006 24 Quantum Tax Saving Fund 0.014
10 Escort Tax Plan -0.051 25 Reliance Tax Saver Fund 0.009
11 Franklin India Taxsheild 0.013 26 Sahara Tax Gain 0.002
12 HDFC Long Term Advantage Fund 0.016 27 Sundaram Tax Saver -0.012
13 HDFC Tax Saver 0.001 28 Tata Tax Saving Fund -0.026
14 HSBC Tax Saver Equity Fund -0.001 29 Taurus Tax Shield -0.007
15 ICICI Prudential Tax Plan 0.015 30 UTI Equity Tax Saving Plan -0.006

33
Table 7 Treynor‟s Ratio of selected tax saving schemes and market portfolio
Sl. No. Schemes
Treynor's Ratio
Sl. No. Schemes and Market Portfolio
Treynor's Ratio
1 Axis Long Term Equity Fund 0.041 16 IDFC Tax Advantage Fund 0.017
2 Baroda Pioneer ELSS 96 -0.028 17 ING Tax Saving Fund -0.019
3 Birla Sun Life Tax Plan 0.001 18 JM Tax Gain Fund -0.027
4 BOI Axa Tax Advantage Fund-Eco -0.017 19 JP Morgan India Tax Adv Fund 0.270
5 BOIAxa Tax Advantage Fund-Reg -0.019 20 Kotak Tax Saver -0.016
6 Canara Robecco Equity Tax Saver 4.750 21 LIC Nomura Tax Plan -0.596
7 DSP Blackrock Tax Saver Fund 0.431 22 Principal Personal Tax Saver -0.013
8 DWS Tax Saving Fund -1.020 23 Principal Tax Saving Fund -0.002
9 Edelweiss ELSS Fund 0.008 24 Quantum Tax Saving Fund 0.016
10 Escort Tax Plan -0.467 25 Reliance Tax Saver Fund 0.011
11 Franklin India Taxsheild 0.015 26 Sahara Tax Gain 0.002
12 HDFC Long Term Advantage Fund 0.768 27 Sundaram Tax Saver -0.018
13 HDFC Tax Saver 0.001 28 Tata Tax Saving Fund -0.225
14 HSBC Tax Saver Equity Fund -0.001 29 Taurus Tax Shield -0.009
15 ICICI Prudential Tax Plan -1.900 30 UTI Equity Tax Saving Plan -0.009
Treynor‟s reward to variability measures the excess return per unit of market (Systematic Risk) i.e. beta. A fund with a higher Treynor‟s ratio implies that the fund has a better risk adjusted return than that of another fund with a lower Treynor‟s ratio. So the top 3 performed schemes are Canara Robecco Equity Tax Saver with a value of (4.750), which is top in class compared to HDFC Long Term Advantage Fund (0.768) and DSP Blackrock Tax Saver Fund (0.431). In this category 17 schemes shown a negative Treynor‟s ratio, it indicate that the scheme failed to provide adequate return as against the level of risk involved in the investment. ICICI Prudential Tax Plan (-1.900) is worst scheme according to Treynor‟s ratio.
Table 8 Jensen‟s alpha of selected tax saving schemes
Sl. No. Schemes
Jensen’s Alpha
Sl. No. Schemes
Jensen’s Alpha
1 Axis Long Term Equity Fund 0.035 16 IDFC Tax Advantage Fund 0.020
2 Baroda Pioneer ELSS 96 -0.022 17 ING Tax Saving Fund -0.004
3 Birla Sun Life Tax Plan 0.006 18 JM Tax Gain Fund -0.020
4 BOI Axa Tax Advantage Fund-Eco -0.010 19 JP Morgan India Tax Adv Fund 0.003
5 BOIAxa Tax Advantage Fund-Reg -0.012 20 Kotak Tax Saver -0.008
6 Canara Robecco Equity Tax Saver 0.010 21 LIC Nomura Tax Plan -0.017
7 DSP Blackrock Tax Saver Fund 0.006 22 Principal Personal Tax Saver -0.006
8 DWS Tax Saving Fund -0.010 23 Principal Tax Saving Fund 0.004
9 Edelweiss ELSS Fund 0.010 24 Quantum Tax Saving Fund 0.017
10 Escort Tax Plan -0.054 25 Reliance Tax Saver Fund 0.013

34
11 Franklin India Taxsheild 0.016 26 Sahara Tax Gain 0.006
12 HDFC Long Term Advantage Fund 0.015 27 Sundaram Tax Saver -0.008
13 HDFC Tax Saver 0.006 28 Tata Tax Saving Fund -0.026
14 HSBC Tax Saver Equity Fund 0.004 29 Taurus Tax Shield -0.002
15 ICICI Prudential Tax Plan 0.013 30 UTI Equity Tax Saving Plan -0.002
Alpha is a measure of differential return earned by the fund which the beta measure is systematic risk. A positive and significant alpha will reflect superior performance. The analysis of the above table reveals that 16 schemes shown positive value. It indicates that these schemes are superiorly performed well in the market. Axis Long Term Equity Fund (0.035) has been recorded with a better alpha in comparison with other schemes. Other 14 schemes have shown negative alpha ratio which reflects that the fund manager inability to forecast future security price in the time.
Conclusions Mutual funds are one of the best investments ever created because they are very cost efficient and very easy to invest in all the selected scheme have allocated majority of corpus to large cap stock and some scheme also have allocation to mid cap. Various external causes affect the fund performance. It is suggested for the investors to choose the night scheme. And it is always suggested to invest in equity scheme for longer tenure. Investors while investing in the mutual fund is very cautious. From the 30 schemes Principal Personal Tax saver has a diversified risk of (0.041), which is closer to 0. It indicates that Principal Personal Tax saver is well diversifiable portfolio. Canara Robecco Equity tax saver, Axis long term equity fund, Franklin India Tax shield schemes are the best schemes to invest with a low value of standard deviation.
Scope for further study A fruitful area of research may relate to the issue of examining the impact of inflation of fund performance. Second, due to the highly volatile nature of Indian stock markets, investors are perplexed with the “discount to NAV factor‟‟. Hence, pricing efficiency of mutual funds is another possible area of research. Third, further studies can consider the effect of fund ratings on mutual fund performance.
References
1. Chandra .P (2010) Investment Analysis and Portfolio Management, Noida: Tata McGraw Hill Education.
2. R. Shanmugham (2010). Financial Services, New Delhi; Wiley India Pvt Ltd. 3. H. Sadhak (2003) Mutual Funds in India, (Marketing Strategies and Investment
Practices), New Delhi; Sage publications. 4. Ali, Rizwan, Naseem, Muhammad Akram and Rehman, Ramiz Ur (2010). Performance
Evaluation of Mutual Funds. Social Science Research Network online Publication 10 May.
5. Afza, Talat and Rauf, Ali (2009). Performance Evaluation of Pakistani Mutual Fund. Pakistani Economic and Social Review, 47(2), 199-214.
6. Dalal Street investment journal (2013) Mutual Fund Data Bank, Vol.27, No.22, P.73 7. Garg, Sanjay (2011). A Study on Performance Evaluation of Selected Indian Mutual
Funds. International Journal of Innovation Creativity and Management. 8. Jayadev, M. (1996). Mutual Fund Performance: An Analysis of Monthly Returns. Finance
India, 10(1), 73-84.

35
9. Prabakaran, G and Jayabal, G (2010). Performance Evaluation of Mutual Fund Schemes in India: An Empirical Study. Finance India.
10. Shanmugham, R and Zabiulla (2011). Stock Selection Strategies of Equity Mutual Fund Schemes in India. Middle Eastern Finance and Economics.
11. Sondhi, H.J and Jain, P.K (2010). Market Risk and Investment Performance of Equity Mutual Funds in India: Some Empirical Evidence. Finance India, XXIV (2), 443-464.
12. Zabiulla (2014). Portfolio Strategies of Fund Managers in the Indian Capital Market, IIMB Management Review, Vol.26, No.1, PP.28-58
13. http//www.amfiindia.com 14. http//www.dsij.com 15. http//www.fundsindia.com 16. http//www.mutualfundindia.com
36
A Comparative Analysis of Performance of
Microfinance Institutions in India, Bangladesh and
Pakistan
SAMSMRITI – The SAMS Journal
Vol. 9(2), July – December 2015
pp. 36-41
Dr. Mihir Dash1
1Professor, Alliance University, Bangalore
Key words
Active borrowers
Average outstanding balance;
Borrowers per staff member;
Gross loan portfolio;
Microfinance institutions;
Abstract: This study examines the performance of microfinance institutions (MFIs) in India
as compared to their counterparts in Bangladesh and Pakistan. The data for the study was
collected for a sample of fifty-seven MFIs in India, thirty in Bangladesh, and fifteen in Pakistan,
for the years 2010-11 and 2011-12, collected from the Microfinance Information eXchange
(MIX).
The results of study suggest that Indian MFIs have been performing better than Bangladeshi
and Pakistani MFIs in terms of Borrowers per Staff Member, and more or less at par with
them in terms of Gross Loan Portfolio, Number of Active Borrowers, and Average Outstanding
Balance. This may be due to the impetus provided by the government and the RBI towards
financial inclusion. Further, the results of the study present a skewed picture of MFI
performance within India, with south Indian MFIs performing better than those in other
regions in terms of Gross Loan Portfolio and Number of Active Borrowers. Indian MFIs need to
support greater communication, coordination, and transparency between themselves to
expand outreach in a sustainable manner, and to prevent crisis in the future.
Introduction
Microfinance institutions (MFIs) focus on providing credit to the poor, who have no access to commercial banks, in order to reduce poverty by helping them to set up their own income-generating businesses. The objective of expanding microfinance outreach is essential for MFIs in order to achieve operational sustainability and help them scale up outreach of financial services to meet the demands and needs of many poor, especially women. Because providing credit to the poor in many cases is a very costly and risky activity, MFIs are often loss-making, i.e. they are not financially sustainable. However, there has been increasing focus on the financial sustainability and efficiency of MFIs. This goal stresses the importance of being able to cover the cost of lending money out of the income generated from the outstanding loan portfolio and to reduce these costs as much as possible, driven particularly by new regulatory policies of the RBI. This has induced microfinance institutions to change their behaviour, and to broaden their services and activities. Balancing between financial performance and non-financial performance has recently been the point of focus among microfinance stakeholders. Most of the empirical evidence in the sector has indicated a trade-off between focusing on financial performance and outreach to the poor among MFIs (Hermes et al, 2011).
Literature Review Several studies have examined the trade-off/conflict between outreach and financial sustainability of MFIs (Gonzalez and Rosenberg, 2005; Olivares-Polanco, 2005; Makame and Murinde, 2006; Hermes et al, 2011). Lending to the poor involves high transaction cost and risks associated with information asymmetries and moral hazards (Stiglitz and Weiss, 1981). Some potential borrowers are extremely poor, have no reliable source of income from which a loan could be repaid, and lack the opportunity (not just the capital) to start a micro-business, so that it cannot be profitable to lend to such people, who are unlikely to repay. Also, some very poor people live in remote and sparsely populated areas where administrative costs of lending are

37
extremely high, and where interest rates would have to be correspondingly high to cover those costs. MFIs outreach is a perceived goal from social and business point of view. However, only a small proportion of MFIs are sustainable to run operation without subsidies (Hulme and Mosley, 1996). In fact, outreach and impact are complementary in nature in achieving microfinance sustainability. However, it is not right to dismiss outreach and sustainability as mutually exclusive goals - deeper outreach need not be a constraint to sustainability, and vice versa. Financial sustainability is vital to serve clients permanently (Helms, 2006). The trade-off arises because MFI transaction costs are high for obtaining information needed to determine the creditworthiness of poor clients. According to the IMF (2005), MFIs that have become self-sustainable tend to be larger and more efficient. Also, they tend not to target the very poor, as targeting the less poor leads to increases in loan size and improved efficiency indicators, whereas MFIs focusing on the poorest tend to remain dependent on donor funds. Welfare impacts of the services of MFIs are also argued to be another indicator to evaluate the performance of the institutions. As indicated at the beginning of this paper, one way or another, the objective of MFIs is reducing poverty. Hence, which imply that we need to access the impact of the microfinance programs on reducing poverty to evaluate their performance? Zeller and Mayer (2002) indicated a "critical microfinance triangle" that needs to be examined to evaluate MFIs based on their objective. The corners of the triangle represent outreach to the poor, financial sustainability and welfare impact, and “… performance criteria are required for each objective and all three must be measured thoroughly to evaluate microfinance performance. The inner circle in the figure represents MFI innovations in technology, policies, organization, and management that affect how well each objective is met. The outer circle represents the environment within which microfinance operates that also affects performance. This environment broadly includes the human and social capital possessed by the poor, the economic policies of the country, and the quality of the financial infrastructure that supports financial transactions. Improvements in the environment make it easier for MFIs to reach the three objectives.” Rosenberg (2002), on the other hand, suggested that MFIs performance measurements involve four core areas, outreach to poor, repayment rates, sustainability and efficiency. Outreach to the poor measures the depth and breadth of poverty impact to the target community. Collection performance measures how well MFIs are collecting loan repayments from their clients. Financial sustainability measures the ability of MFIs to cover operating costs out of the revenues generated from operating activities. Efficiency indicates how well does MFIs allocate and control their resources. The need to balance financial and non-financial performance measurement resulted into the introduction of balanced scorecard as a performance measurement tool in MFIs (MFC, 2007). Unlike the Kaplan scorecard, the balanced scorecard in MFIs has five performance dimensions: financial, social, customer, learning and growth, and internal business process. The addition of the social dimension was necessary to take into account the primary objective of outreach to the poor in MFIs. However, there is no literature which comprehensively integrates both financial and non-financial metrics into a balanced scorecard in the measurement of performance of MFIs.
Methodology The data is obtained from the Microfinance Information eXchange (MIX), which is the most renowned and global web-based microfinance information platform. The database yields information on micro finances institutions around the globe and provides information to sector actors and the public at large on MFIs worldwide, public and private funds that invest in microfinance, MFI networks, raters/external evaluators, advisory firms, and governmental and regulatory agencies.

38
The performance measures1 used in the present study are the Gross Loan Portfolio (viz. all
outstanding principal for all outstanding client loans, including current, delinquent and restructured loans, excluding loans that have been written off and interest receivable), the Number of Active Borrowers (viz. the number of individuals or entities who currently have an outstanding loan balance with the MFI or are primarily responsible for repaying any portion of the loan portfolio), the Average Outstanding Balance (viz. the gross amount of loans or savings outstanding divided by the number of active clients or accounts), and the Borrowers per Staff Member (i.e. the Number of Active Borrowers divided by the Number of Staff Members). The study examines the performance of MFIs in India in terms of these measures, and compares it with that in MFIs in neighbouring Pakistan and Bangladesh. The data for the study was collected on a sample of fifty-seven MFIs in India, thirty MFIs in Bangladesh, and fifteen MFIs in Pakistan, obtained from the Microfinance Information Exchange (MIX), for two years - 2010-11 and 2011-12. The study uses nonparametric Wilcoxon, Mann-Whitney, and Kruskal-Wallis tests for the analysis (cf. Rai, 2012).
Findings The descriptive statistics of the Gross Loan Portfolio, the Number of Active Borrowers, the Average Outstanding Balance, and the Borrowers per Staff Member, region-wise within India and between India, Pakistan, and Bangladesh, for 2010-11 and 2011-12 are presented in Table 1 and Table 2.
Table 1 Descriptive statistics of MFI indicators region-wise within India MFI indicators
Year Statistics North India South India East India West India Overall K-W H-test
Gross Loan Portfolio
2011 Mean 21,209,926.33 100,066,790.78 67,683,790.08 8,037,657.57 67,525,310.88 9.134
Std. Dev 24,466,801.30 142,276,243.20 200,643,529.59 7,411,395.84 139,478,434.90 (0.028*)
2012 Mean 24,773,275.78 121,217,856.56 64,135,401.38 9,289,839.43 74,190,273.95 8.928
Std. Dev 28,161,544.93 163,427,455.14 192,413,992.45 7,465,807.42 148,369,588.22 (0.030*)
Number of Active Borrowers
2011 Mean 134,406.67 698,946.84 363,916.46 41,275.50 426,993.40 10.586
Std. Dev 151,190.72 1,085,209.74 983,164.45 36,744.59 885,714.68 (0.014*)
2012 Mean 159,525.44 727,390.08 400,432.15 56,746.14 454,563.67 8.904
Std. Dev 170,505.96 1,069,104.92 1,133,098.71 46,526.91 916,614.11 (0.031*)
Average Outstanding Balance
2011 Mean 152.92 156.89 214.45 197.73 175.42 2.214
Std. Dev 29.70 59.60 328.63 54.96 166.91 (0.529)
2012 Mean 142.63 172.82 250.19 154.94 184.86 5.822
Std. Dev 25.59 78.60 405.60 58.89 207.51 (0.121)
Borrowers per Staff Member
2011 Mean 234.90 294.76 179.38 402.88 272.73 8.093
Std. Dev 61.43 123.97 122.38 628.23 256.57 (0.044*)
2012 Mean 263.50 349.88 187.69 251.13 282.70 7.968
Std. Dev 80.15 208.91 123.28 133.33 173.41 (0.047*)
First, the performance of MFIs within India was examined. The MFI indicators for different regions in India were compared using the Kruskal-Wallis H-test, presented in Table 1. The results of the Kruskal-Wallis tests show that there were significant differences in Gross Loan Portfolio, Number of Active Borrowers, and Borrowers per Staff Member across different regions in India in both years, but there was no significant difference in Average Outstanding Balance across different regions - south Indian MFIs were found to have performed the best in terms of Gross Loan Portfolio and Number of Active Borrowers, while west Indian MFIs performed worst in terms of Gross Loan Portfolio and Number of Active Borrowers. On the other hand, east Indian MFIs and west Indian MFIs performed best in terms of Average Outstanding Balance.
1 http://www.mixmarket.org/about/faqs/glossary
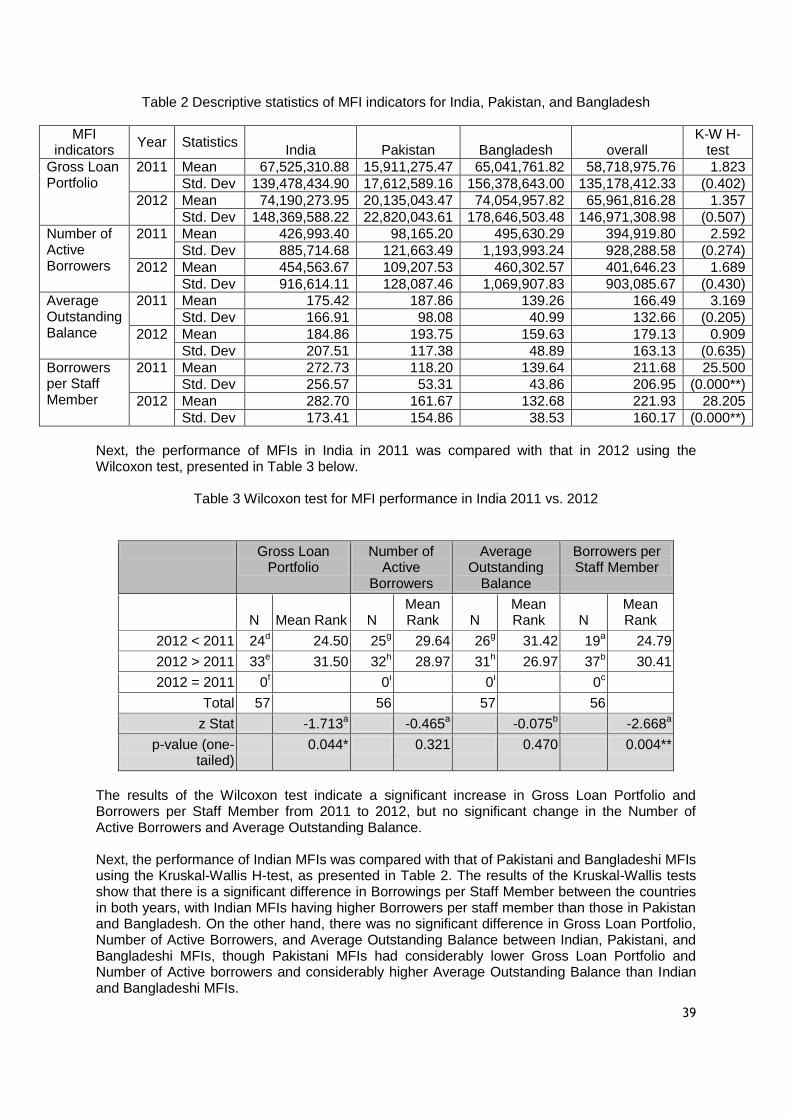
39
Table 2 Descriptive statistics of MFI indicators for India, Pakistan, and Bangladesh
MFI indicators
Year Statistics India Pakistan Bangladesh overall
K-W H-test
Gross Loan Portfolio
2011 Mean 67,525,310.88 15,911,275.47 65,041,761.82 58,718,975.76 1.823
Std. Dev 139,478,434.90 17,612,589.16 156,378,643.00 135,178,412.33 (0.402)
2012 Mean 74,190,273.95 20,135,043.47 74,054,957.82 65,961,816.28 1.357
Std. Dev 148,369,588.22 22,820,043.61 178,646,503.48 146,971,308.98 (0.507)
Number of Active Borrowers
2011 Mean 426,993.40 98,165.20 495,630.29 394,919.80 2.592
Std. Dev 885,714.68 121,663.49 1,193,993.24 928,288.58 (0.274)
2012 Mean 454,563.67 109,207.53 460,302.57 401,646.23 1.689
Std. Dev 916,614.11 128,087.46 1,069,907.83 903,085.67 (0.430)
Average Outstanding Balance
2011 Mean 175.42 187.86 139.26 166.49 3.169
Std. Dev 166.91 98.08 40.99 132.66 (0.205)
2012 Mean 184.86 193.75 159.63 179.13 0.909
Std. Dev 207.51 117.38 48.89 163.13 (0.635)
Borrowers per Staff Member
2011 Mean 272.73 118.20 139.64 211.68 25.500
Std. Dev 256.57 53.31 43.86 206.95 (0.000**)
2012 Mean 282.70 161.67 132.68 221.93 28.205
Std. Dev 173.41 154.86 38.53 160.17 (0.000**)
Next, the performance of MFIs in India in 2011 was compared with that in 2012 using the Wilcoxon test, presented in Table 3 below.
Table 3 Wilcoxon test for MFI performance in India 2011 vs. 2012
Gross Loan Portfolio
Number of Active
Borrowers
Average Outstanding
Balance
Borrowers per Staff Member
N Mean Rank N
Mean Rank N
Mean Rank N
Mean Rank
2012 < 2011 24d 24.50 25
g 29.64 26
g 31.42 19
a 24.79
2012 > 2011 33e 31.50 32
h 28.97 31
h 26.97 37
b 30.41
2012 = 2011 0f 0
i 0
i 0
c
Total 57 56 57 56
z Stat -1.713a -0.465
a -0.075
b -2.668
a
p-value (one-tailed)
0.044* 0.321 0.470 0.004**
The results of the Wilcoxon test indicate a significant increase in Gross Loan Portfolio and Borrowers per Staff Member from 2011 to 2012, but no significant change in the Number of Active Borrowers and Average Outstanding Balance. Next, the performance of Indian MFIs was compared with that of Pakistani and Bangladeshi MFIs using the Kruskal-Wallis H-test, as presented in Table 2. The results of the Kruskal-Wallis tests show that there is a significant difference in Borrowings per Staff Member between the countries in both years, with Indian MFIs having higher Borrowers per staff member than those in Pakistan and Bangladesh. On the other hand, there was no significant difference in Gross Loan Portfolio, Number of Active Borrowers, and Average Outstanding Balance between Indian, Pakistani, and Bangladeshi MFIs, though Pakistani MFIs had considerably lower Gross Loan Portfolio and Number of Active borrowers and considerably higher Average Outstanding Balance than Indian and Bangladeshi MFIs.

40
Next, the performance of MFIs in India, Pakistan, and Bangladesh in 2011 was compared with that in 2012 using the Wilcoxon test, presented in Table 4 below.
Table 4 Wilcoxon test for MFI performance in India, Pakistan, and Bangladesh 2011 vs. 2012
Gross Loan Portfolio
Number of Active
Borrowers
Average Outstanding
Balance
Borrowers per Staff Member
N Mean Rank N
Mean Rank N
Mean Rank N
Mean Rank
2012 < 2011 34d 40.76 41
g 55.33 40
h 49.03 42
a 44.49
2012 > 2011 68e 56.87 61
h 48.93 62
g 53.10 57
b 54.06
2012 = 2011 0f 0
i 0
i 0
c
Total 102 102 102 102
z Stat -4.272a -0.932
a -2.222
a -2.117
a
p-value (one-tailed)
0.000** 0.176 0.013* 0.017*
The results of the Wilcoxon test indicate a significant increase in Gross Loan Portfolio, Borrowers per Staff Member, and Average Outstanding Balance from 2011 to 2012, but no significant change in the Number of Active Borrowers.
Discussion The results of study suggest that Indian MFIs have been performing better than their Pakistani and Bangladeshi counterparts in terms of Borrowers per Staff Member, and more or less at par with them in terms of Gross Loan Portfolio, Number of Active Borrowers, and Average Outstanding Balance. This may be due to the impetus provided by the government and the RBI towards financial inclusion. The results also indicated that the Gross Loan Portfolio, Borrowers per Staff Member, and Average Outstanding Balance were increasing. Thus, there is evidence that microfinance institutions are expanding their outreach. Also, there is evidence that Indian MFIs are more efficient than Pakistani and Bangladeshi MFIs in terms of outreach. However, the results of the study also show a skewed picture of MFI performance within India. The results of the study suggest that south Indian MFIs have been performing better than MFIs in other regions in terms of Gross Loan Portfolio and Number of Active Borrowers. Thus, there is evidence that south Indian MFIs are more efficient than MFIs in other regions in terms of outreach. The north and west Indian MFIs are perhaps weaker than the south and east Indian MFIs, as north India (esp. Punjab) had greatly benefited from the Green Revolution, and west India (esp. Gujarat) had greatly benefited from the White Revolution; Haryana and Rajasthan were the north/west Indian states that had scope for microfinance. There is scope to improve the efficiency of east Indian MFIs, particularly as they show higher levels of Average Outstanding Balance, i.e. greater indebtedness. The serious issues that had occurred in Andhra Pradesh, Kolar, and Ramanagaram in October 2010 have raised concerns about the future of microfinance in India. The Malegam Committee Report (January 2011) alleged that the MFIs were becoming profit-oriented businesses, moving away from their social responsibilities such as meeting credit requirements of poor people, empowerment, and so on. They allegedly provided large amounts in loans in order to make more profit, without considering the repayment ability of the borrower. They also allegedly engaged in some illegal, coercive practices to recover their loan amount. The Malegam Committee recommended that MFIs should follow corporate governance norms, that MFIs should

41
compulsorily participate in credit bureaus, and that there should be standardization in the manner in which MFIs quote their interest rates. The Committee recommended that the 75% of loan amount disbursed by MFIs should be utilized for income-generating activities, and that it is the responsibility of the MFIs to provide training facilities, and they should also ensure that the funds are used in a proper manner. Thus, the apparent efficiency of south Indian MFIs may be illusory. Greater communication, coordination, and transparency between MFIs are needed to reduce the inherent information asymmetry and prevent such a crisis in the future. There are several limitations inherent in the study. The study is based in secondary data, which captures the larger MFI segment, but omits the medium & small MFI segment. The sample used for analysis was also relatively small; and only two years were considered, so the trend may not have been adequately captured. Also, the study considered only a few indicators, based on data availability - particularly, profitability data was not systematically available. The results of the must be complemented with a comparison of profitability across regions within India, and between India, Pakistan, and Bangladesh. Thus, there is vast scope for further research in the area of outreach of microfinance institutions and its drivers.
References
1. Gonzalez, A. and Rosenberg, R. (2006), “The State of Microfinance – Outreach, Profitability, and Poverty Findings from a database of 2600 Microfinance Institutions,” available at SSRN: http://ssrn.com/abstract=1400253.
2. Helms, B. (2006), “Access for all,” Washington, DC: CGAP. 3. Hermes, N., Lensink, R., Meesters, A. (2011), “Outreach and efficiency of microfinance
institutions,” World Development 39(6), 938 - 948. 4. Hulme, D and Mosley, P. (1996), Finance Against Poverty, London, UK. 5. Makame, A.H. and Murinde, V. (2006), “Empirical findings on cognitive dissonance
around microfinance outreach and sustainability,” University of Birmingham Working Paper.
6. Olivares-Polanco, F. (2005) “Commercializing Microfinance and Deepening Outreach: Empirical Evidence from Latin,” Journal of Microfinance 7(8), 47-69.
7. Rai, A.K. (2012), “A comparative analysis on the financial performance of microfinance institutions of India and Bangladesh,”
8. Rosenberg, R. (2002), Core performance indicators for microfinance: CGAP. 9. Stiglitz, E.J., and Weiss, A. (1981), “Credit rationing in markets with imperfect
information,” American Economic Review, 71, 393- 410. 10. Zeller, M., and Meyer, R. (2002), The Triangle of Microfinance - Financial Sustainability,
Outreach and Impact, The International Food Policy and Research Institute. Washington,
USA.

42
Changing Paradigms of Rural Development
SAMSMRITI – The SAMS Journal Vol. 9(2), July – December 2015
pp. 42-48
Ashvin M Gutti1
1 Assistant Professor, Department of MBA, Jyoti Nivas College – Autonomous, Bangalore
Key words
Bottom-up approach ;
Globalisation;
Government schemes;
Rural development;
Abstract: The United Nations defines “Rural Development is a process of change, by which
the efforts of people themselves are united, those of Government authorities to improve
their economic, social and cultural conditions of communities into the life of the nation and to
enable them to contribute fully to national program. Rural Development is a process
of bringing change among rural community from the traditional way of living to progressive
way of living. It is also expressed as a movement for progress”.
Major change in the global economy like, improved transportation, improved communications,
costs reductions, changing trade patterns for goods and commodities, globalization and the
emergence of important non-farm activities in rural regions confront rural regions with some
obvious threats but also with significant opportunities. These being the background, policy
makers recognize the need and demand that conventional sectoral policies need to be
upgraded and at times, need to be phased out and substituted with more appropriate steps.
Introduction Concerns are questioned on the impact that agricultural subsidies have on economic reforms. With rural families depending off-farm employment, the success of rural communities will depend on the development of new economic engines. In the late twentieth century rural economies around the world are in a state of transition. Historically, rural places depended upon one of more of the primary industries for their economic bases. Although there has been an outflow of people from rural to urban places for at least a thousand years, these primary industries required, until the last half of the present century, that large amounts of labour remain available in rural areas.
But the technological change of the last hundred years has drastically reduced the need for labor in primary industries and left more and more rural residents without a source of livelihood. A huge rural-to-urban migration, beginning first in the United States after World War II, but now evident in much of the world, has spawned urban congestion and concomitant socio-political problems. The problems of widespread poverty, growing inequality, rapid population growth and rising unemployment all find their origins in the stagnation of economic life in rural areas. There can be no national development without rural development.
Yet, there is no evidence of a universally accepted procedure for rural development in the literature. The choice of methods and approaches have always been influenced by the individual or collective preferences of the change agent(s), the time of implementation, spatial distribution, cultural orientation and political dispensation. Rural development in India has traditionally been based on monopolistic, state-controlled policies, emphasizing growth. Then came the telecommunications revolution in the 1990s, which really started in the mid-1980s with C-DOT and the proliferation of fax in villages. Telephones and STD facilities entered the rural areas for the first time in a significant way. In conjunction with global trends for open societies and open markets, this fuelled a paradigm shift, where the state was ultimately no longer seen to be the only engine of production, growth and social equity. New ideas could blossom, although hindered by the entrenched government bureaucracy, who wished to maintain status quo and resisted change. Civil society structures became at least theoretically on par with the government behemoth. Microenterprises challenged the monopoly of state-controlled industrialization, which till then was the only way to create jobs, overcome poverty and achieve rural development.

43
Rural development initiatives are mainly and mostly to development aim for the social and economic development of the rural areas. Rural development programs are usually top-down from the local or regional authorities, regional development agencies, NGOs, national governments or international development organizations. But then, local populations can also bring about endogenous initiatives for development.
Dynamics of Rural Development
The term is not limited to the issues for developing countries. In fact many of the developed countries have very active rural development programs. The main aim of the rural government policy is to develop the undeveloped villages. Rural development aims at finding the ways to improve the rural lives with participation of the rural people themselves so as to meet the required need of the rural area. The outsider may not understand the setting, culture, language and other things prevalent in the local area. As such, general people themselves have to participate in their sustainable rural development.
In developing countries like Nepal, India, integrated development approaches are being followed up. In the context of many approaches and ideas have been developed and followed up, for instance, bottom-up approach, PRA- Participatory Rural Appraisal, RRA- Rapid Rural Appraisal etc. The “New Rural Paradigm” requires important changes in how policies are conceived and implemented to include a cross-cutting and multi-level governance approach. Traditional hierarchical administrative structures are likely to be inadequate to administer these policies effectively and adjustments are thus needed along three key governance dimensions: horizontally at both the central and the local levels and vertically across levels of government.
Although it is clear that rural areas are lagging in general in terms of GDP per capita, “rural” is by no means synonymous with decline. According to the most recent data available, in more than one out of three economically developing countries, the region with the highest rate of employment creation were rural regions.
Easier commuting across longer distances has expanded the sphere of influence of major urban areas enabling people to live in rural regions while working in cities contributing to a reversal of the rural out-migration trend, as has been observed in France, England and the Netherlands for example.
Agriculture is no longer the backbone of rural economies. Although it still has an important role in shaping rural landscapes in many economically developing countries, its weight in rural economies is often low and declining.
Notable changes shaping the rural areas
A shift from an approach based on subsidizing declining sectors to one based on strategic investments to develop the area's most productive activities;
A focus on local essentials as a means of generating new competitive advantages, such as amenities environmental or cultural or local products
More attention to quasi public goods or “framework conditions” which support enterprise indirectly;
A shift from a sectoral to a territorial policy approach, including attempts to integrate the various sectoral policies at regional and local levels and to improve co-ordination of sectoral policies at the central government level;
Decentralization of policy administration and, within limits, policy design to those levels;

44
Increased use of partnerships between public, private and voluntary sectors in the development and implementation of local and regional policies;
Some of the economically developed countries have developed a number of policy
initiatives with an integrated approach to meet the needs and opportunities of their rural regions:
International countries and their rural Initiatives are as under:
a) Canada's "Rural Lens" Initiative b) Finland‟s Multi-Year Rural Policy Program c) Germany‟s “REGIONEN AKTIV” Program d) UK‟s Rural Strategy e) Mexico‟s Micro-Regions Strategy f) Netherlands‟ “Agenda for a Vital Countryside” g) EU‟s LEADER Community Initiative
Rural Development Programs
According to the 2011 census, India has 1.21 billion populations. Out of that 833 million 68.84% population lives in India‟s 6, 40,867 villages. Most of these people are agriculturists or depend on agriculture for their livelihood. Since independence many rural development program have been taken by the Govt. of India and various State Govts and implementing it through Five Year Plans. Some of these programs are: Intensive Agricultural District Program (IADP- Package Program) Intensive Agricultural Area Program (IAAP) High Yielding Varieties Program (HYVP - Green Revolution) Drought Prone Areas Program (DPAP) Small Farmers Development Agency (SFDA) Hill Area Development Program Operation Flood I, II and III (White Revolution) Fisheries Development (Blue Revolution) Jawahar Rozgar Yojna (JRY)
The implementation of various Rural Development Schemes especially the wage-employment, self-employment and rural infrastructure/amenities schemes have helped in reduction of poverty in rural areas. The Government has instituted an in-built monitoring mechanism in the guidelines of each of the rural development schemes so as to ensure that the objectives of the schemes are achieved, in full measure.
Schemes of the Departments of Ministry for Rural Development
Pradhan Mantri Gram Sadak Yojana: (PMGSY) was launched on 25th December 2000
as a fully funded Centrally Sponsored Scheme to provide all weather road connectivity in rural areas of the country.
Swarnjayanti Gram Swarozgar Yojana: The objective of the Swarnjayanti Gram Swarozgar Yojana (SGSY) is to bring the assisted poor families (Swarozgaries) above the Poverty Line by ensuring appreciable sustained level of income over a period of time. This objective is to be achieved by inter-aligning rural poor into Self Help Groups (SHGs) through the process of social mobilization, their training and capacity building and provision of income generating assets. The SHG approach helps the poor to build their self-confidence through community action.

45
An interaction in group meetings and collective decision making enables them in identification and prioritization of their needs and resources. This process would ultimately lead to the strengthening and socio-economic empowerment of the rural poor as well as improve their collective bargaining power.
Indira Aawas Yojna: The genesis of the Indira Awaas Yojana (IAY) can be traced to the program of rural employment, which began in the early 1980s. Construction of houses was one of the major activities under the National Rural Employment Program (NREP), which began in 1980, and the Rural Landless Employment Guarantee Program (RLEGP), which began in 1983.
National Social Assistance Program: These are intended to secure for the citizens adequate means of livelihood, raise the standard of living, improve public health, provide free and compulsory education for children etc. In particular, Article 41 of the Constitution of India directs the State to provide public assistance to its citizens in case of unemployment, old age, sickness and disablement and in other cases of undeserved want within the limit of its economic capacity and development. It is in accordance with these noble principles that the Government of India on 15
th August 1995 included the
National Social Assistance Program in the Central Budget for 1995-96.
CAPART: Council for Advancement of People‟s Action & Rural Technology: the main objectives of the CAPART are :- To encourage, promote and assist voluntary action for the implementation of projects
intending enhancement of rural prosperity. To Strengthen and promote voluntary efforts in rural development with focus on
injecting new technological inputs; To act as a catalyst for the development of technology appropriate for rural areas. To promote, plan, undertake, develop, maintain and support projects/schemes aimed
at all-round development, creation of employment opportunities, promotion of self-reliance, generation of awareness, organization and improvement in the quality of life of the people in rural areas through voluntary action.
DRDA Administration: The District Rural Development Agency is visualized as a specialized and a professional agency capable of managing the anti-poverty programs of the Ministry of Rural Development on the one hand and to effectively relate these to the overall effort of poverty eradication in the District. In other words, while the DRDA will continue to watch over the implementation of RD Program to ensure effective utilization of the funds intended for anti-poverty programs, it will need to develop a far greater understanding of the processes necessary for poverty alleviation/eradication.
PURA: The scope of the Scheme would be to develop livelihood opportunities, urban amenities and infrastructure facilities to prescribe service levels and to be responsible for maintenance of the same for a period of ten years. The selected private partner would be required to provide amenities like water supply and sewerage, roads, drainage, solid waste management, street lighting, development of economic activity and skill development in specified cluster as part of the PURA Project. The selected private partner may also provide 'add - on' revenue - earning facilities such as village linked tourism, integrated rural hub, rural market, agri- common services centre and warehousing, any other rural - economy based project, etc in addition to the abovementioned amenities.
National Rural Livelihoods Mission (NRLM) was launched by the Ministry of Rural Development (MoRD), Government of India in June 2011. Aided in part through investment support by the World Bank, the Mission aims at creating efficient and effective institutional platforms of the rural poor enabling them to increase household income through sustainable livelihood enhancements and improved access to financial services.

46
NRLM has set out with an agenda to cover 7 Crore rural poor households, across 600 districts, 6000 blocks, 2.5 lakh Gram Panchayats and 6 lakh villages in the country through self-managed Self Help Groups (SHGs) and federated institutions and support them for livelihoods collectives in a period of 8-10 years. In addition, the poor would be facilitated to achieve increased access to their rights, entitlements and public services, diversified risk and better social indicators of empowerment. NRLM believes in harnessing the innate capabilities of the poor and complements them with capacities (information, knowledge, skills, tools, finance and collectivization) to participate in the growing economy of the country.
Other initiatives by the Government are:
Mahatma Gandhi National Rural Employment Guarantee Act-2005 Monitoring & Evaluation PMRDFs Training Aajeevika
Present Rural Development Paradigm
India implemented the New Economic Policy in 1991 which was deeply associated with Globalization. At this stage, the paradigm of rural development was aimed to accelerate country‟s economic growth, but in doing so it was found that the system generated wider socio-economic inequality amongst the people of rural India. The Govt. has incurred a huge expenditure on the long term policies for other including urban development but very little has been spent on health, education, food, environment which is the basic need of the common people, especially for the rural people in India. The Global Hunger Index, India ranks 66
th amongst 88 countries. As per UNDP, Multi-
dimensional Poverty Index (MPI), 65 cores of Indian people are Poor. They are mostly rural folk. The report of National Commission for Enterprises in the Unorganized Sector says 77 percent of Indian population live on rupees 20/- or less per day. Prof. Utsya Patnaik in her article the republic of hunger showed how 840 million people in India do not get the requisite daily intake of calories. The poverty ratios in rural areas as found by the Prof. Tendulkar Committee set up by the Planning Commission and the Prof. N.C. Saxena Committee set up by the Ministry of Rural Development was to 41.8 percent and 50 percent respectively. The Right to Food Campaign registered more than 5000 starvation deaths in different parts of the countryside between 2001 and 2005. India has adopted the policy of promoting the Special Economic Zones (SEZs) for faster Industrial development. Similarly, mining rights are being granted to the corporations mostly over tribal lands. As a result, a massive land grab by large corporations in various guises, have displaced, deprived and destroyed the livelihoods of these poor tribal and peasants. In India there is a specific law for forest dwellers namely, PESA (Panchyats Extension to Scheduled Act) to protect their lands and lively hoods where it is clearly mentioned that non tribal or outsiders cannot purchase their lands. But the Govt. is ignoring the law consciously to help the multinationals. At present, in India conflicts between peasant sections and the State have become frequent. The Government. is grabbing their lands, forests, water forcibly and curbing their basic rights. Many a times, these conflicts results in a bloody war as seen in Singur, Nandigram in West Bengal, Kashipur in Orissa and Dantewara in Chhattisgarh etc.

47
Impact of Globalization on Farmers
In India, roughly 90 percent of the rural population is engaged in agriculture. In absolute terms they are nearly 600 million or 60 crore. Since 1990, when Globalization was implemented in India then many important changes were made in cultivation (e.g. multi-cropping, the shift from rain-fed to irrigation dependent farming in many areas) and a certain degree of development of productive forces (in inputs like hybrid seeds, machinery, techniques, skills) due to the opening of agriculture sector in multinational companies and big corporations. Consequently, the cost of agricultural production has increased because cost of chemical fertilizers, pesticides, irrigation etc. has increased in manifolds. The capital intensive and import based agricultural activity have naturally started displacing mostly poor, small and marginal peasants from land. Now, the estimated annual business from rural market of agri-inputs including tractors is worth Rs.45,000 crore. Multinational agri-business companies like Cargill, PepsiCo, Monsanto, ITC etc. are already in the field to monopolize this lucrative market. A new class has emerged in rural India during the period of globalization that has been benefited by this globalization process. These are mainly the rich and high middle class farmers. Many of the owners themselves do not till land, they supervise the agricultural activities and such supervising families are basically engaged in services in the government or private sector or business especially related to agribusiness. In some places they also act as moneylenders and lend money to poor peasants at a high interest and control the local political power. Basically, these classes have more purchasing power and are the main customers for durable and other luxurious goods in rural India. The remaining poor and marginal peasants ironically who constitute the substantial portion in rural areas have been subjected to deep trouble in the era of globalization and their purchasing power are too low and has been decreasing over the years. Small farmers in particular are least benefited by this globalization period whereas big farmers with their economic and political influence, are able to reap the benefits of globalization as they can get best technologies, grow cash crops, negotiate agreements, and move their products. On the other hand distressed peasants who are feeding the nation are mostly indebted. According to the National Crime Bureau record, in the ten years period between 1998 and 2008 as many as 2 lakh farmers have committed suicide in India. According to Report of the Comptroller and auditor General of India “Out of 89.35million farmer households, 43.42 million (48.6%) were reported to be indebted. The incidence of indebtedness was highest in Andhra Pradesh (82.0%), to be followed by Tamil Nadu (74.5%), Punjab (65.4%), Kerala (64.4%), Karnataka (61.6%) and Maharashtra (54.8%).
Conclusion India has the potential to become a super power in rural sector provided all the programs
are implemented in a right way.
Private – Public initiatives need to be given a boost as there are many philanthropists willing to donate large sums of money for the betterment of rural development
Awareness is less even amongst educated who want to contribute to the rural development of the country as reaching out to the right authority to further collect additional information becomes very difficult due to various factors and time constraints
Rural development does not come with profits & revenues and even if it does come, sufficient time and patience has to be invested to reap the benefits

48
Multiple initiatives by central and state governments are being born every now and then for the welfare of rural development across India and across the globe too to strength one of the most important engines of growth for a country
Deep sense of respect and commitment exists among many stake holders as they know and realize the importance of rural development.
International community‟s realize the importance of nurturing rural aspirations and have initiated major development programs. International governments are hard bent on training and educating their rural folks by investing and mentoring them for the betterment of their country which would but obviously lead to better GDP.
References
1. http://data.worldbank.org/topic/agriculture-and-rural-development 2. http://rural.nic.in/sites/programmes-schemes.asp 3. http://sankalpacmfs.org/trd/wp/trd_white_paper.pdf 4. http://www.academia.edu/3829303/Rural_development_in_India_since_independence_A
_view_point_of_the_impact_of_Globalization 5. http://www.fao.org/docrep/006/y5061e/y5061e09.htm 6. http://www.indiaspend.com/sectors/rich-poor-gap-widens-in-urban-rural-india-45473 7. http://www.nal.usda.gov/ric/ricpubs/rural_development_conclusion.pdf 8. http://www.ruralmonitor.in/nlm.aspx 9. http://www.youtube.com/results?search_query=rural+development+in+india&sm=1 10. http://www.youtube.com/results?search_query=rural+progress 11. http://www.youtube.com/watch?v=wOJd60JNRLk 12. http://onlinelibrary.wiley.com/doi/10.1111/0017-4815.00091/abstract 13. http://m.ceip.org/2013/02/11/employing-india-guaranteeing-jobs-for-rural-
poor/ff4w&lang=es 14. Forests Rights Act-2006 15. United Nations Development Report-2010 16. www.unwomen.org/en/news/in-focus/rural-women-food-poverty
49
Trends in Mergers and Acquisitions - Indian Perspective SAMSMRITI – The SAMS Journal
Vol. 9(2), July – December 2015
pp. 49-57
Dr. Y Nagaraju1
Samiya Mubeen2
1 Associate Professor, Canara Bank School of Management Studies, Bangalore University, Bangalore. 2 Research Scholar, Canara Bank School of Management Studies, Bangalore University, Bangalore.
Key words
Corporate restructuring;
Technology transfer;
Mergers and acquisitions;
Synergy;
Abstract: The corporate sector all over the world is restructuring its operations through
different types of consolidation strategies like mergers and acquisitions in order to face
challenges posed by the new pattern of globalization, which has led to the greater integration
of national and international markets. The intensity of such operations is increasing with the
de-regulation of various government policies. The reforms process initiated by the Indian
government since 1991, has influenced the functioning and governance of Indian firms which
has resulted in adoption of different growth and expansion strategies by the corporate firms.
These reforms have opened up a whole lot of challenges both in the domestic and
international spheres. In that process, Indian organizations are facing challenges from both,
domestic competitors as well as foreign competitors, who can suddenly appear from
anywhere on the globe. Collaborations, strategic alliances, powerful partnerships will
strengthen the economy. Encouragements from Governments through legislations and tax
concessions will further strengthen mergers and acquisitions. This study focuses on factors for
the failure of mergers and acquisitions globally and more particularly in India and to review
the success mantra for effective implementation of mergers and acquisitions. Mergers and
acquisitions (M&A) in the corporate world are achieving increasing importance and attention
especially in the advent of intense globalization. This is evident from the magnitude and
growth of deal values and resultant „mega-mergers‟ transacted in recent times. As expert
advisory are sought in M&A activities to facilitate the undertaking and maximise the value of
the transaction, advisory firms begin to play a more significant and at the same time lucrative
role in M&A activities, to the extent of determining the outcome of such projects. This study is
conceptual in nature. The studies undertaken guide the management and persons involved not to fail to understand the reasons for pre and post merger failures. Understanding culture,
training of managers to develop change agents, communication to stake holders, building
targets, developing a new culture, leader to lead, careful planning and implementation at each
stage of mergers make merger successful.
Introduction The corporate sector all over the world is restructuring its operations through different types of consolidation strategies like mergers and acquisitions in order to face challenges posed by the new pattern of globalization, which has led to the greater integration of national and international markets. The intensity of such operations is increasing with the de-regulation of various government policies. The reforms process initiated by the Indian government since 1991, has influenced the functioning and governance of Indian firms which has resulted in adoption of different growth and expansion strategies by the corporate firms. These reforms have opened up a whole lot of challenges both in the domestic and international spheres. In that process, Indian organizations are facing challenges from both, domestic competitors as well as foreign competitors, who can suddenly appear from anywhere on the globe. The increased competition in the global market has prompted the Indian companies to go for mergers and acquisitions as an important strategic choice. Merger and acquisition (M&A) activities have increased rapidly since2000. Historically, M&As have shown a cyclical pattern. There have been six waves of M&As for the past 100 years; these are those of the early 1900s, 1920s, 1960s, 1980s, 1990s, and2000s.The trends of mergers and acquisitions in India have changed over the years. The immediate effects of the mergers and acquisitions have also been diverse across the various sectors of the Indian economy. The merger and acquisition business deals in India amounted to $40 billion during the initial 2months in the year 2007. The total estimated value of mergers and acquisitions in India for 2007was greater than $100 billion. It is twice the amount of mergers and acquisitions in 2006.

50
Objectives of the Study a) To analyze the trends, concerns, and issues involved in mergers and acquisitions with
special reference to India. b) To work out the impact of mergers & acquisitions as well as causes of failure of
mergers& acquisitions.
Review of Literature Present Status
Marina Marty nova, SjoerdOosting and Luc Renneboo (2012) studied the long-term profitability of corporate takeovers in Europe, and found that both acquiring and target companies significantly outperformed the median peers in their industry prior to the takeovers, but the profitability of the combined firm decreased significantly following the takeover. However, the decrease became insignificant after controlling for the performance of the control sample of peer companies.
Raymond No (2011) studied that 60-80% of all mergers are financial failures when measured by their ability to outperform the stock market or to deliver profit increases. Anne Freedma (2010). Those findings are further supported in a study by A.T Kearney that shows 58% of mergers failing to achieve their stated goals, and Suh-kyungYoo (2009) studied that a survey of 1,000 companies revealed that more than two-thirds of companies failed. Causes of Failure of M&A
Overpayment: This is very common cause of failure of acquisition & mergers. DePamphilisD (2005) found that overpayment often has destroys consequences. Overpayment leads to expectation of higher profitability which is not possible. Excessive goodwill as a result of overpaying needs to be written off which reduces the profitability of the firm. Integration issues: Strau (2007) studied that business cultures, work ethics, etc. needs to be flexible and adaptable. Inefficiencies or administrative problems are a very common occurrence in a merger which often nullifies the advantages of the mergers. Faulty strategic planning and unskilled execution: Schuler, R.S. Jackson, S. E. Luo, (2004): Faulty Strategic Planning and unskilled execution often leads to problems over expectation of strategic benefits is another area of concern surrounding mergers. These issues lead to failures of mergers. Mike Harriso (2001) found that planning is a crucial exercise that will help determine the success or failure of a merging organization. However, many merging organizations do not have adequate or complete integration and implementation plans in place. Only one out of five companies that have acquired another has developed a clear and satisfactory implementation plan. Corporate Culture Differences: Irene Rodger (1999). Business International states that poor communications and inability to manage cultural differences are the two main causes of failed mergers. Maria Koul Cultural differences that cannot be resolved affect communications, decision-making, productivity and employee turnover at all levels of the organization. All the best laid plans – exhaustive analyses of strategies, marketing tactics, legal issues, etc. can fall apart if the people cannot work together. If the two workforces fail to unite behind the strategic goals underlying the consolidation, even the best financial deals and most rigorous legal contracts fail to guarantee success. Loss of Customers: Wayne R. Pinnel (2001) found that all companies need to remember: it‟s the people who produce profits, represent the company, establish rapport with the customers, and, ultimately, are the ones that will make the combined company succeed.”

51
Power Politics: Randall S. Schuler, Susan E. Jackso (2001) observed that there is a tendency to assume that power disputes are more common in the case of acquisitions than mergers, there is no such thing as “a merger of equals”. Further, it was clear that the distribution of power was not equally spread out. “We felt like we were marrying up, and it was clear that they thought they were marrying down.” M&A and Human Resources
Personnel motives: Kellor R. Dixo(2000) found that managers often enters into mergers to satisfy their own personnel motives like empire building, fame higher managerial compensation, etc. As a result they often lose focus on the fact that they need to look at the strategic benefits of the mergers. As a result, mergers that don‟t necessarily benefit the organization are entered into. These executives enter into these mergers for the purpose of seeking glory and satisfying their executive ego; leading to failure of mergers. Lack of Communication: Peter Dixo(1998), a merger expert at Braxton Associates, found that lack of information, no clear direction and confusing messages, all boil down to uncertainty, which is destructive. It is really very important to be clear and consistent, even if the messages may not always be positive for everyone. The Conference Boar(2000) found that poor communication between people at all levels of the organization, and between the two organizations that are merging, is one of the principal reasons why mergers fail. Middle management and lower level employees in particular are kept in the dark when it comes to merger issues. Loss of Talented Employees: Raymond (2002) found that one out of four top performers leaves the company within 3 months of the announcement of an event involving major change in the organization 24 and 47% of senior managers in the acquired company leave within the first year. Impact of mergers Das(2003) found that many of the merging or acquiring companies state the importance of retaining and acquiring key talent, 47% of senior management in the acquired firm leave within the first year and companies experience on average a 50% drop in productivity in the first 6-8 months of the integration. He compares the pre merge and post merger operating profit margin for a sample of 14 acquiring firms and find a decline in profitability in 8 of these companies after merger. The study of Saple (2000) observed that mergers did not lead to an improvement in performance as measured by profitability (return over net assets) adjusted for the industry average. Beena (1998) also finds no significant difference in the rate of return and profit margin between the periods before and after the mergers. Overall the results point to the possibility of merger driven by managerial self-interest motive of growth maximization. Mantravedi and Reddy (2008) investigated Indian acquiring firms and found that there are minor variations in terms of impact on operating performance following mergers, in different sectors of Indian industries. Marina Martynova, SjoerdOosting and Luc Renneboo (2007) investigated the long-term profitability of corporate takeovers in Europe, and found that both acquiring and target companies significantly outperformed the median peers in their industry prior to the takeovers, but the profitability of the combined firm decreased significantly following the takeover. However, the decrease became insignificant after controlling for the performance of the control sample of peer companies. John C. Bruckman, Scott C. Peter(1987) studied that the amount of time and energy needed to successfully merge two sophisticated organisations is more likely to resemble the planning and execution of the invasion of Normandy, accompanied by the resultant clash of cultures from many elements attempting to work together towards one end. This corporate failure to consider and plan for the long-term consequences can result in financial problems, loss of employee loyalty, lowered employee morale and reduced productivity.”

52
Materials and Methods Tools for data collection: The data required for the study have been collected from various secondary sources such as research articles from journals, working papers, web sites. Research Type: Conceptual in nature
Mergers and Acquisitions in India Mergers and acquisitions imply alliance of two or more companies. Where a merger leads to formation of a new company, acquisition leads to purchase of a company by other and no new company is formed. India in recent past has seen great potential in case of Merger and Acquisition (M&A) deals. It is being played vigorously in many industrial sectors of the economy. Many Indian companies have been growing the inorganic way to gain access to new markets and many foreign companies are targeting Indian companies for their growth and expansion. It has been spreading far and wide through various verticals on all business platforms. The volume of M&A deals has been trending upwards particularly in the fields of pharmaceuticals, FMCG, finance, telecom, automotive and metals. Various factors which lead to this robust growth of mergers and acquisitions in India were liberalization, favourable government policies, economic reforms, need for investment, and dynamic attitude of Indian corporations. Almost all sectors have been opened up for the foreign investors in different degrees which has attracted this market and enabled industries to grow.
The post-world war period was regarded as an era of M&As. Large number of M&A‟s occurred in industries like jute, cotton textiles, sugar, banking insurance, electricity and tea plantation.
However after independence, during the initial years, very few corporations came together and when they did it was a friendly negotiated deal. The reason behind less number of companied involved in mergers and acquisitions were due to the provisions of MRTP Act,1969 wherein such a firm had to follow a pressurized procedure to get approval for the same which acted as a deterrent.

53
Although this doesn‟t mean that mergers and acquisitions in India were uncommon during this controlled system. In fact there were cases where the government encouraged mergers to revive the sick units. Additionally the creation of Life Insurance Corporation (LIC) and nationalization of life insurance business resulted in takeover of 243 insurance companies in the year 1956. The concept of mergers and acquisitions in India was not very popular until the year 1988. This year saw an unfriendly takeover by Swaraj Paul to overtake DCM ltd. which later had turned out to be ineffective. After the economic reforms that took place in the 1991, there were huge challenges in front of Indian industries both nationally as well as internationally. The intense competition compelled the Indian companies to opt for M&A‟s which later on became a vital option for them to expand horizontally and vertically. Indian corporate enterprises started refocusing in the lines of core competence, market share, global competitiveness and consolidation. The early nineties saw M&A transactions led by Indian IT and pharmaceutical firms primarily to place themselves near to their major clients in other developed economies and also break into new markets for expansion. In this backdrop, Indian corporate enterprises undertook restructuring exercises primarily through M&A‟s to create a formidable presence and expand in their core areas of interest. Since then there has been no looking back and India is being considered one of the top countries entering merger and acquisitions. However, the complications involved in the acquisition process has also increased caused by evolving legal frameworks, funding concerns and competition norms which pose a constraint for the deal to be successful.
Drivers of Merger and Acquisitions in India
Right to entry: Acquisitions that take place abroad permit Indian companies to gain access to developed markets across the globe.
Technology transfer: This is one of the main advantages and drivers that urge companies to get into M&A deals. Many times corporations require technologies to manufacture particular product or a service which is not available in India. In such situations by acquiring/collaborating companies abroad they get access to the technologies.
New Product Mix: Many times it is not profitable for companies to manufacture products themselves either due to cost constraints or requirement of huge investments. In such a scenario alliance with another company can give them the right to sell and diversify their product range.
Hedging Country Risks: Merger and Acquisitions are also attempted to reduce the reliance on the Indian markets and escape the local business cycles.
Recent Trends of Mergers and Acquisitions in India There are various factors that facilitate mergers and acquisitions in India. Government policies, resilience in economy, liquidity in the corporate sector, and vigorous attitudes of the Indian businessmen are the key factors behind the fluctuating trends of mergers and acquisitions in India. Considering the trends in previous years, Year 2012 saw a slowdown in mergers and acquisitions in India. It hit a three year low down by almost 61% from its preceding year. This was majorly caused by the tough macro-economic climate created due to euro zone crisis and other domestic reasons such as inflation, fiscal deficit, and currency depreciation. However that year also saw a key trend that emerged and it was the increase in domestic deals compared to cross border M&As. The domestic agreement value stood at USD 9.7 billion, up by almost 50.9% in comparison with 2011.

54
This year 2014, has started off on a positive note for inbound M&A deals in India which has so far seen 15 deals in the first two months. The general elections due in the coming months would have a huge impact on the on the mergers and acquisitions in India. Though the investment sentiments have improved the foreign companies are awaiting the effect of elections before putting in money in India. The country is strong enough in its rudiments which will drive its business and economic growth.
Challenges to Mergers and Acquisitions in India With the increase in number of M&A deals in India, the legal environment is increasingly becoming more and more refined. M&A forms a major part of the economic transactions that take place in the Indian economy. There are a few challenges with mergers and acquisitions in India which have been discussed below: Regulatory Ambiguity: M&A laws and regulations are still developing and trying to catch up with the global M&A scenario. However because of these reasons the interpretation of these laws sometimes goes for a toss since there is ambiguity in understanding them. Several regulators interpreting the same concept differently increase confusion in the minds of foreign investors. This adversely affects the deal certainty which needs to be resolved if the Indian system wants to attract investments from foreign economies. Legal Developments: There have been consistently new legal developments such as the Competition Act, 2002, the restored SEBI Takeover Regulations in 2011 and also the notification of limited sections of the new Companies Act, 2013, has led to issues in India relating to their interpretations and effect on the deals valuations and process.

55
Shareholder Involvement: Institutional investors in the minority position have become active in observing the investee companies. Proxy advisory companies are closely scrutinizing the related party transactions, appointment of several executives and their remuneration. There are cases where the approval of minority shareholders is required. The powers to the minority shareholders have been revamped, one of them includes to sue company against oppression and mismanagement. These are some of the issues that pose a challenge towards the growth of mergers and acquisitions in India which need considerate attention from the government to make our market attractive for foreign investment. On a positive note Confederation of Indian Industry (CII), the Reserve Bank of India (RBI) and the Securities and Exchange Board of India (SEBI) – the three main regulators of the mergers and acquisition activities – have been striving hard to further liberalize the norms that have been one of the biggest contributors to the country‟s industrial expansion.
Major Mergers and Acquisitions in India
BhartiAirtel acquired Kuwait based Zain Telecom‟s African business for USD 10.7 billion which was considered the largest ever cross-border deal in an emerging market.
Considered to be the biggest deal in the Pharmaceutical sector was the acquisition of the generic drug unit of Piramal Health care by USA based Abbot Laboratories (ABT) for USD 3720 million.
In the Banking, Financial Services and Insurance sector, biggest deal was by Hinduja group, when it acquired Luxembourg based KBL European private bankers SA for USD 1.69 billion.
Tata Chemicals took over British salt based in UK with a deal of US $ 13 billion. This is one of the most successful recent mergers and acquisitions 2010 that made Tata even more powerful with a strong access to British Salt‟s facilities that are known to produce about 800,000 tons of pure white salt annually.
Merger of Reliance Power and Reliance Natural Resources in a deal of US $11 billion is another biggest deal in the Indian industry. This merger enabled convenience Reliance power to handle all its power projects as it now enjoys easy accessibility of natural gas.
In domestic mergers ICICI Bank‟s acquisition of Bank of Rajasthan at about Rs 3000 Crore was a great move by ICICI to enhance its market share across the Indian boundaries especially in northern and western regions.
Tata steel‟s takeover on Corus in 2007 is considered to be the largest Indian take over whose deal value was worth $7.6 billion which also made Tata‟s the fifth largest steel company.
Vodafone has acquired a 52% interest in Hutchison Essar from the Hong Kong based Hutchison telecommunications International for about US$10.83 billion.
Imperial energy India‟s biggest exploration company Oil and Natural Gas Corporation (ONGC), bought Imperial Energy Plc for $2.58 billion to tap Siberian deposits and make up for diminishing output at home.
Aditya Birla Group‟s Hindalco Industries, India‟s largest non-ferrous metals company, acquired the Canada based firm Novalis in an all-cash transaction for $6 billion.
In 2008, Tata acquired Britain‟s most famous automobile manufacturers Jaguar and Land Rover, in a $2.3 billion contract with Ford, their American owners.
Subhash Chandra‟s Essel Packaging (EPL) acquired the Swiss tube packaging major Propack, to become the world‟s largest in laminated tubes.
In 2006, Ranbaxy Laboratories (RLL) created news when it announced the acquisition of 3 drug-makers in Europe, all within a week‟s time. Allen S.p.A, a division of GlaxoSmithKline (GSK) in Italy, Romania‟s largest independent generic drug producer Terapia and drug maker Ethimed NV in Belgium.
In 2007, Pharmaceutical and biotechnology major Wockhardt bought the fourth largest independent, integrated pharmaceutical group in France, Negma Laboratories. At a deal

56
of $265 million, Wockhardt became the largest Indian pharmaceutical company in Europe with more than 1500 employees based in the continent.
In 2008 Bennett Coleman & Co, India‟s largest media group and the holding company of the Times of India group, bought Virgin Radio in the UK in a $53.2 million deal with SMG Plc.
Mahindra & Mahindra acquired 90 percent of Schoneweiss, a leading company in the forging sector in Germany. The deal took place in 2007, and consolidated Mahindra‟s position in the global market.
Sterlite Industries, a part of the Vedanta Group in the year 2008 signed an agreement regarding the acquisition of copper mining company Asarco for $ 2.6 billion.
Findings India is becoming a highly sought after destination for M&A deals. This also means that it is now more vulnerable to the impulses and uncertainties of the global economic scenario. Considered to be the lifeblood of Indian business now, it needs the support and constancy to ensure that it remains progressive in the coming years. India must concentrate upon refining the processes, increasing the simplicity in doing business abroad and the legalities involved in them. It is not wrong to say that the mergers and acquisitions in India and the system related to that are in the infant stage but this economy is huge enough to provide opportunities to foreign investments. The key to success keeping fundamentals in place i.e. to bring into line acquisitions to the entire business strategy, plan and execute a vigorous integration process and take adequate awareness of all relevant regulatory norms.
Conclusions M&As have been found to be beneficial in the sense that Indian companies grew in size, and attain better market share which is substantiated by empirical analysis. Throughout the period of study, turnover increased after the companies experienced an M&A. Further, M&As did not have any impact on return on net worth for the period of study. The nature and pattern of M&As strategies adopted by the Indian companies reveal mostly horizontal and vertical types. This gives strength to the argument that Indian companies are focusing on their core areas and expanding mostly in related areas of strength which is helpful in realization of synergistic benefits. Further, it has been observed that M&As in India are strategic in nature that motives range from growth and expansion to high quality of human resources, strong brand presence and global identity and leadership. To remain ahead of competitors, business leaders need to have a global vision, be pro-active, able to take calculated risk and initiate and manage acquisition and consolidation process smoothly.
References
1. Anne Freedman “Assessments Key to Merger Success”, Human Resource Executive Magazine, April 2002
2. Irene Rodg, “Culture Bridging for International Performance”, Personnel ANDCP,April 1999.
3. Mike Harriso�, “HR Has a Major Role to Play in Mergers”, Personnel Today, September 25, 2001
4. Maria Koul“Why Do Mergers and Acquisitions Fail to Create Synergy? Is the Situation Redeemable?”, Interview with Maria Kouli, *Deputy Director of the National Bank of Greece, The Executive Issue, Issue 12, 2001
5. Marina Martynova, SjoerdOosting and Luc Renneboog1, The long-term operatingperformance of European Acquisitions, International Mergers and Acquisitions Activitysince 1990: Quantitative Analysis and Recent Research , G. Gregoriou and L. Renneboog(eds.), ,Massachusetts: Elsevier, 2007, pp 1-40.

57
6. Raymond No�, “Mergers and Acquisitions” MHR 860, Ohio State University Fisher
College of Business, January 17, 2002 7. Randall S. Schuler, Susan E. Jackso�, “HR Issues and Activities in Mergers and
Acquisitions”, Rutgers University, May 2, 2001 8. Suh-kyung Yoon�,,“„People Problems‟ Hinder Post-Merger Success”, Far Eastern
Economic Review, November 15, 2001 Depamphilis, D. (2005),”mergers, acquisitions, and other restructuring activities, 3rd 5. ed.Alseierinc, London
9. Starub, �.,(2007), Reasons for frequent failure in mergers and acquisitions. A comprehensive analysis, DUV, Germany.
10. Schuler, R.S. Jackson, S.E. Luo, (2004), Why Do Mergers and Acquisitions Fail to Create Synergy? Is the Situation Redeemable?”, The Executive Issue, Issue 12, 2004.
11. Wayne R. Pinnel�, “People and Purpose: Tips for a Successful Merger or Acquisition”, Advisor, November 29, 2000.
12. www.nytimes.com 13. www.sciedu.ca/rwe Research in World Economy Vol.1, No., 1 ; November 2010 14. www.scribd.com/doc/39895992/Merger-and-Acquistion-1 15. www.slideshare.net/divinvarghese/mergeracquisition-and... 16. www.slideshare.net/hal9007/merger-implementation-steps... 17. www.slideshare.net/divinvarghese/mergers-and... 18. www.slideshare.net/divinvarghese/mergeracquisition-and-corporate-estructuring

58
Application of Green Marketing in Marketing Mix: A
Case of Large Retail Stores in Bangalore SAMSMRITI – The SAMS Journal
Vol. 9(2), July – December 2015
pp. 58-60
Janardhan Shetty1
Dr. Akhila R Udupa2
1 Research Scholar (Jain University) and Assistant Professor, Seshadripuram Institute of Management Studies, Bangalore 2 Associate Professor, Seshadripuram Institute of Management Studies, Bangalore
Key words
Green consumers;
Green marketing;
Green myopia;
Large retail stores;
Marketing mix;
Social cost
Abstract: Green Marketing is a concept of marketing which has assumed lot of attention
and application across organizations in this decade. Green Marketing refers to holistic
marketing concept where in the production, consumption marketing and disposal are closely
conducted without adding any social cost. There is a need for us to use environment friendly
practices in the context of marketing our products. Large retail store is a retail format where
there is lot of scope for using Green marketing concepts. This paper focuses on some Green
marketing strategies used in the Marketing mix of large retail stores like Reliance Fresh and
Heritage Foods. This is a descriptive paper and the objective is to understand the applications
of green marketing in LRS. Further, the authors have tried to include the effectiveness of
these initiatives in LRS.
Introduction
It is our common experience that whenever we go to a large retail store, we buy many polythene covers also along with vegetables, fruits and other food items. We get the pamphlets of many firms everyday along with the newspapers. As polythene bags are readily available, easy to handle, carry and store they are high in demand. Both the LRS and consumers are slowly turning towards Green strategies. One small example is, if we take the polythene bag at the end, they deduct Rs. 5 out of the final bill.
Green marketing of products that are presumed to be environmentally preferable to others. It is synonymous with the environmental marketing and Ecological marketing. It came into prominence in 1980‟s and 90‟s. The CSR initiatives can be closely linked to green marketing initiatives. When it is mandatory for them to use two percent of their profits for CSR, they can as well use it for promoting their brand with green initiatives.
Reliance Fresh and Heritage Foods with hundreds of outlets all over Bangalore are increasingly recognising the benefits of Green marketing, although there is often a thin line between doing for its own benefit and for social responsibility reasons. The term “Green washing” refers to all industries that adopt outwardly green acts with an underlying purpose to increase profits.
Green marketing in product mix
The products sold by these LRS are made environment friendly. They use green technology for manufacturing the product so that it would not cause hazards for environment. They also look at the conservation of resources of all type in product mix. Some product mix elements used by LRS in green marketing are, Taking the products which are produced originally, using products which are recyclable, reusable and biodegradable. For example many food items are offered in reusable plastics boxes which can be recycled as well. They also use natural ingredients in making the product, using of eco friendly package items, etc. The items used for packaging are made biodegradable. They make product modifications time to time keeping environment in mind. They sell products which are environmentally suitable. These retailers must have relevant, clean and categorized data which will lead to ethical practices. These products are sold with a code, which is captured at the point of sale.

59
Green marketing in Price mix
Although price for green products are little expensive compared to other items green consumers don‟t mind to pay that extra. Reliance Fresh and Heritage discourages the use of polythene bags on a regular basis. Both reward and punishment system is used in price mix. For example, if someone uses big polythene bags given by the LRS they will be charged rs 5 extra. On the other hand, if someone keeps bringing their own carry bags, they are given price concessions. One of the attracting factors for large retailers is their reasonable and competitive pricing strategies.
The value proposition of large retailers is large selection and low price. This in retailers language is called PQ and WP equation(Price Quality and Willingness to Pay).In Indian market, retailers must concentrate on price element mainly because; nearly fifty percent of the earnings of normal consumers is spent on grocery items which are provided by these stores. The retailer needs to clearly understand the minimum threshold level of quality the consumer is at. Below this limit, the consumer will reject the product.
Green marketing in Place mix
Reliance Fresh and Heritage have slowly entered into e-tailing which is the most sought out retail place mix option in the present day world. Their focus is also on ecological packaging. Marketing of products obtained regionally and from local players is easier to be marketed green than products imported. They have their own home brands which use green place mix initiatives. Here most of the links in the place mix are avoided as they add on extra cost and wastage of resources. Sheer convenience to the customers is the most important aspect of place mix. Wider choice of products vis a vis delivering better value by saving time and avoiding strain for the consumers is a green objective of these retailers. Knowing the customer preference and deriving place mix accordingly can result in avoiding lot of additional selling expenses incurred by the retailers.
At present, every single transaction challenges retailers to deliver the goods quickly, cheaply and conveniently. The existing model of home delivery for regular customers can help in convenience for the customers. Further, the supply chain management involving sourcing of the products, setting of warehouses and ensuring timely delivery help in avoiding wastage of products. By proper planning of place mix, larger delivery vehicles can be deployed by the large retail store which will add to their green initiatives.
Green marketing in Promotion mix
Reliance Fresh and Heritage Food have started using green marketing in the context of CSR initiatives. It helps in promoting these brands as socially responsible. Hence, these brands are turned greenish in this situation. These firms distribute nature friendly bags which the green consumers can use time and again on a regular basis. These bags also carry the names of the brand so that it acts as an element of communication mix as well. They don‟t spend too much on other elements of promotion, and that burden is reduced on the consumer.
Green marketing in People mix
Green HR is a system in which all the costs to environment in handling HR is reduced. Here the LRS work towards reducing the consumption of paper, lesser human resources, etc.
Green marketing in Physical evidence mix
Reliance Fresh and Heritage Food try to use as less power as possible. Air conditioners, freezers are regularly monitored to avoid more power consumption. Further use of CFL, LED lights also help them in cutting power bills as well as green initiatives.

60
Green marketing in Process mix
In the entire process of marketing of their products, these firms use more of environmentally friendly resources. They look at reducing the lead time so that products can be produced marketed faster.
Challenges in Green marketing
It is found that only 5 percent of the marketing messages from green campaigns are true and there is a lack of standardization and authentication about these clients. There is a need for establishing a quality control board in such a place for labelling and licensing the products. These days, Bangaloreans are literates and more aware and conscious about green initiatives. Social marketing to educate the urban folk about green products is absolutely essential. They should be made known about healthy living lifestyles and natural food consumption. Creation and communication of many benefits of green products should be taken seriously.
Further the investors and corporates need to weigh environment as a major term involved opportunity, the marketers need to low long term benefits from this new green movement. It will require a lot of immediate results. Since it is a new concept idea, it will have its own acceptance perseverance.
Conclusion
There is a welcome shift among these LRS towards green initiatives. Since it is the case of fast moving consumer goods under LRS there is lot of scope for using it in all the elements of marketing mix. There is relatively more advantages and benefits associated with green initiatives. It is easy to observe and witness the new behaviour. Firms need to consider this with full commitment to get the complete advantage. Although it is difficult to implement some of these marketing mix elements, it brings win-win situation for both consumers and large a retail stores.
References
1. Bucholz, Rogene. A(1998) “The Ethics of Consumption Activities: A Future Paradigm?” Journal of Business Ethics17(8): 871-883
2. Kotler. P & Armstrong G(2004)” Understanding marketing and marketing process”, Principles of Marketing, Prentice- Hall of India, New Delhi, pp3-34
3. Ottman, Jacquelyn (1998), “Greener than ever”. Green-marketing - Opportunity for Innovation, Second Edition, pp. 4-9.
4. ChoudharyAparna, Green Marketing - A means for sustainable development. Journal of Arts, Science and Commerce, Vol-4(3), July 2013.
5. Sharma S C, 2012 (Green Marketing - A gimmick of the real deal). International Journal of Research in Finance and Marketing, 2(2) 404-414.
6. http://www.greenmarkerting.com 7. Chauhan, V (2011) “What is green marketing”, Dec 20, 2011. 8. http://www.pbs.org/kcts/affluenza 9. How Reliance got top position as India‟s Retailer, Authint Mail, 2014-04-21. 10. www.prj.co.in/setup/business/paper18.pdf 11. www.timelesstraveltrailers.com

61
Creating a Sustainable Lens for Higher Education: The
New Urgency SAMSMRITI – The SAMS Journal
Vol. 9(2), July – December 2015 pp. 61-63
Sunder Rajan1
1 HRM Consultant and Mentor, Bangalore
Mr. Sunder Rajan was a Panel Member in the Panel Discussion on “Reforms in Higher Education: Perspectives of
Stakeholders” at AICTE Sponsored International Conference on “Creating a Sustainable Lens for Higher Education: The
New Urgency” held on July 29-30, 2015 at Sambhram School of Management, Bangalore. Views expressed in this article
are his personal.
Introduction
The quantity of education needs to be supported with quality of education in order to make it
effective to create responsible future citizens of any country. Many developing and developed
countries have taken education of its citizens as a mainstream agenda to develop the nation.
Educational institutions generate students who will be the products of development in Academia,
Research Institutions, Industry, Managing Governmental Organizations and various other
Corporations. Unless students are linked to these occupations and understand them better and
develop the right perspectives “education will be just a process than the purpose”. In this
direction several academic institutions in the recent past have been conducting various
Conferences to find ways and means of “purposeful career oriented education for enhancing
employability”. Towards this direction the following factors could be visualized for enriching the
purpose of Education.
Goal Orientation for Employment Oriented Education
There are many chains of Institutions in the country which are being highly commercialized due
to various geo-political reasons. India has taken some advantage of the population to meet
these needs and also supplement to the organizational needs. However, there has been a larger
gap what is taught and what the various sectors in the society wants.
Some academic institutions have also shown growth organically and inorganically like the
corporate growth strategy though many have become pronounced in their Academic Excellence,
some in numbers to show growth, and some on various aspects of personality development to
meet the society needs. But, they have left a large gap to meet the needs of their long-term
career and employability skills. They have been showing much importance to draw attention on
all aspects of organization management with focus on brand building activities through unique
pattern of education or in developing the potential children wherein some of the parents are
globe trotters. Thus, the academic institutions have grown so large that they can no longer
manage them on traditional lines and hence are demanding application of various management
principles and expertise to address effectiveness in academia and total development of children
for their future to address the local and global needs.
The costs of education have also become enormous in India. Parent‟s expectations for the
Institutions to add-value beyond just academic excellence are a reality. This is changing the
Institutions to acquire competencies to add greater value in the educational process that place

62
the demand on the Institutions to be the best locally with global norms and to march towards
efficiency in education and its excellence.
In the recent past there has been grown in traditional method wherein the best of the best teachers who are either inspiring in their personality or relatively best amongst the teachers became the head of the academic institutions. Today‟s parents expect children to become employable much faster. This aspect has also become a main yardstick and brand image for the Institutions. The society is thus expecting them to enhance value of education with variety of expectations to address the attitudinal development of children matching their aptitude. These factors will certainly enhance their employability, various other competencies, and life critical skills to manage diversity to manage local situational needs preferably with a global exposure. These needs are still not addressed by the academic institutions that reduce their scope of employability. Thus, globalization and application of globalized practices have become a necessity to build such Institutions. In substance, they have indicated for the Institution to grow in their competency for facilitating growth of their wards, managing competition and brand building activities to attract more students by showcasing best results as a primary focus to attract and enlarge the scope of the population. Therefore, many academic Institutions have been attracting best of the students and facilitate them to be the best and prepare them for the next phase of best academic Institutions. This certainly leaves behind bulk of students who are average and above average and addressing this large numbers is the real challenge for some institutions which is a weakness in the education system. Some of the Schools have attracted such class of students and have been applying their best teaching aids and have been turning out best results to build their career that has become the hall-mark brand of such Institution. This at times has been either circumstantial or situational with good results.
Knowing the Gap between the Institution and the Industry
The Industry operates in a very dynamic environment due to fast impact of new technology taking the lead; economic compulsive changes, geo-political situations, evolution of new lines of business, and local and global changes taking place continuously. Thus the syllabus, course curriculum, teaching methodology and the Industry connect are very helpful to understand the gap and modify the education methodology accordingly. The Industry and the Institute connect is very important to know this gap and to modify the desired changes consistently and continuously without upsetting the stability of the education. The Institute in collaboration with Industry can identify the organizational problems and find the scope of solving them thus improving the existing educational practices by utilizing the enthusiastic, curious young and energetic minds of student community. This will also take them closer for their proper understanding of the working climate needs, work ethics and work etiquettes which most of them are missing now. This factor is also reflected as a need today when they join their maiden job and at times is faced with failures.
Faculty Development Programs
Due to dynamic changes happening in the Industry what has been learnt become obsolete very
soon. This recalls for a total learning of newer subjects and methodology. Thus it is very
important that the “Faculty Development Programs” are encouraged with a minimum of eight
man days of training for them. This can be organized by collaborating with several organizations.
Faculties attending the Conference felt this need and were impressed on the need for newer and
larger re-learning. They also acquire skills to resolve various Industry issues which otherwise is
devoid of implementation and problem solving skills. This will make the education pattern more
interesting, meaningful with a purpose. Faculties can also have special training methodologies
and work with Industries during their vacations so that their academic knowledge becomes more
practical for implementation.

63
Developing Student to the Employability Needs
This is the very basic purpose of education to make them employable in various sectors of the society. It is very important for them to acquire the various skills their future career would demand. It is very important for them to acquire competencies in various spectrums of careers. Many Institutions do provide “Special Life Skills” to help them to develop their personalities and be useful to the society. But most of them are left on their own to acquire these skills from their kith and kin or go un-addressed which would leave them unguided and they find themselves without any direction. They are also not mentored for their career orientation based on their attitude and aptitude mapping. They need to be guided to develop the right attitude for the job and they need to be informed to upgrade them as their role changes as they grow progressively in their career path. The Institute needs to lay the foundation for them to acquire these basic skills for the career development. They are also to be taught for acquiring self-learning skills to further their development process on their own. They also need to be guided to choose their mentors as they grow in the society which will certainly reduce their mortality in the job and help them grow successfully faster in highly competitive career. They need to undergo various Personality Development Programs on several topics of general importance that can hone their career developments.
Conclusion
In conclusion the need for using a new lens to enhance the right perspective of rightful education to enhance the knowledge factor for a meaningful employability is a must. These alone will be useful to the society and also build the brand image of the education system in India. While India today, is marching towards being a powerful and largest growing and powerful economy in the world in various organizational sectors, can ill-afford to be far behind in the education sector? Hence, the new development needs must be met much faster and standardized across India. The best of India in education is also an important need at present. The Faculty Development Program will certainly be a catalyst for improving the quality of education. The Student Development Program by encouraging them to achieve several vocational training certifications needs to be addressed and encouraged on top priority.
