samuel clark department of sociology, university of washington institute of behavioral science,...
Post on 21-Dec-2015
215 views
TRANSCRIPT

Samuel Clark
Department of Sociology, University of WashingtonInstitute of Behavioral Science, University of Colorado at Boulder
Agincourt Health and Population Unit, University of the Witwatersrand
The Single Decrement Life Table

2
Plan
Demographic Probabilities Single Decrement Life Table

3
Demographic Probabilities
Probability: Number of events occurring in a given number of trials
Number of successes cannot exceed number of trials P between 0 and 1: 0.0 <= P <= 1.0 Events of interest must be related to the trials undertaken Demographic probabilities must be related to a cohort:
– Surviving members of a cohort at time T or age A are the “trials” or the at risk population to which events may occur over the next period of time
– All members of a cohort are exposed to the risk of an event for the same duration of time between T+n or A+n, unless they experience an event that removes them from the cohort
Number of Successes(Success)
Number of TrialsP

4
Birth Cohort of 1995
2
1
0
1995.00 1996.00 1997.00
61
51
41
3?

5
Symbols Used to Represent Event Counts
B0(95)= 6
SD0(95)= 1
PD0(96)= 1
B1(96)= 4
PD0(95)= ?
B1(95)= ?
0 01995 1 0
0
95 96 20.3333
95 6S PC D D
qB
2
1
0
1995.00 1996.00 1997.00
B1(95) B1(96)
B0(95)
PD0(95)
SD0(95)
PD0(96)

6
Notation - Definitions
n xq
xD Y
Probability of dying in the age interval x to x+n for those who survive to age x
S x S xx
x S x P x
D Y D YSF Y
D Y D Y D Y
Total deaths at age x (last birthday) in year Y
Separation factor for age x in year Y; deaths at age x to individuals attaining age x in year Y over all deaths age x in year Y

7
Period & Cohort Rates & Probabilities
Cohort Deaths to Cohort C between ages x and x+nPerson-years lived by Cohort C between ages x and x+n
Cn xM
Year Deaths between ages x and x+n in Year tPerson-years lived between ages x and x+n in Year t
tn xM
Cohort th
Deaths to Cohort C between ages x and x+nNumber of persons in Cohort C who reached their x birthday
Cn xq

8
nqx Examples
0 0 1 11995 2 0
0
95 96 96 97
95S P S PC D D D D
qB
1 11994 1 1
0 0 0
95 96
94 94 95S PC
S P
D Dq
B D D

9
Diagram of Synthetic nqx
2
1
0
1995.00 1996.00 1997.00
B1(95) B1(96)
B0(95)
PD0(95)
SD0(95)
PD0(96)

10
Synthetic Calendar Year Probabilities
nqx is
probability that person dies during calendar year of attaining age x
PLUS
probability that person survives the year when they attain their xth birthday
TIMES
probability that if person survives the year of their xth birthday, they die during the subsequent year

11
Synthetic Calendar Year Probabilities
0 0 0 0Y 1 0
0 0 0 0
0 0
0
1
1
S S PC
S
S P
D Y B Y D Y D Yq
B Y B Y B Y D Y
D Y D Y
B Y
0 0 0 0Y 1 0
0 0 0 01 1S S PC
S
D Y B Y D Y D Yq
B Y B Y B Y D Y
Rearrange to only use deaths from one calendar year to create synthetic nqx:

12
Infant Mortality Rate
Take deaths from year Y cohort and year Y-1 cohort divided by births in year Y
Not a true probability because events in the numerator are not all associated with trials in the denominator
However, is a reasonable approximation, is easy to calculate with available data, and is very standard …
0 0 0
0 0
S PD Y D Y D YIMR Y
B Y B Y

13
The Life Table
One of the most important demographic techniques Describes the dying out of a cohort Age or more generally “duration” is the most important
dimension along which a life table is organized Contains a number of columns
– Age (age groups),– Numbers of deaths in each age group– Probability of dying in each age group– Number of survivors to the beginning of each age group – Number of person years lived in each age group– Average additional years to live for those who survive to
beginning of each age group, etc.

14
Life Table Columns: lx
xl Number left alive at age x
15
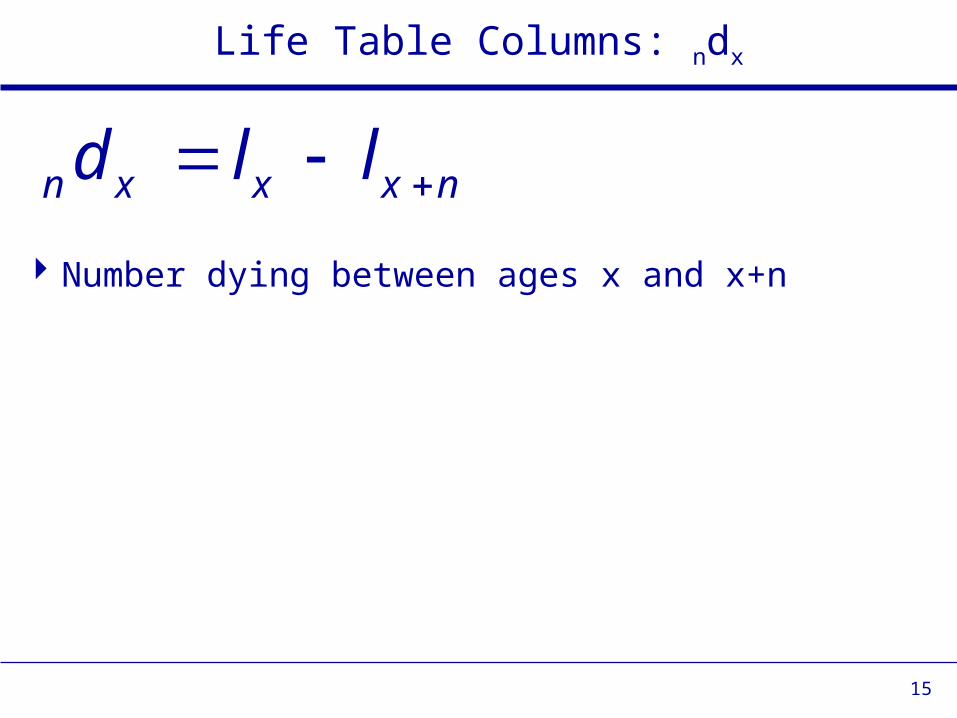
Life Table Columns: ndx
Number dying between ages x and x+n
n x x x nd l l

16
Life Table Columns: nqx
n xn x
x
dq
l
Probability of dying between ages x and x+n

17
Life Table Columns: npx
Probability of surviving from ages x to x+n
1x n x n xn x n x
x x
l l dp q
l l

18
Life Table Columns: nLx
Person-years lived between ages x and x+n
n x x n n x n xL n l a d

19
Life Table Columns: Tx
Person-years lived at ages older than x
x n aa x
T L

20
Life Table Columns: ex
Expectation of life at age x; average additional years of life that someone who survives to age x can expect to live
0 xx
x
Te
l

21
Life Table Columns: nmx
Death rate in the cohort between ages x and x+n
n xn x
n x
dm
L

22
Life Table Columns: nax
Average number of years lived in the age interval by those dying in the age interval
n xa

23
Example Life Table

24

25
Period Life Table
Cohort data not very common Need ability to use “period” data that describe age-
specific mortality in a given year or period A “period life table” is exactly the same as a cohort life
table except it describes the dying out of a “synthetic cohort” that experiences at each age the age-specific mortality associated with a given period
A hypothetical group of people survives through the age-specific risk of dying associated with a period

26
Creating a Period Life Table
The key to this is the fact that the hypothetical cohort experiences the age-specific probabilities of dying associated with the period
The data available are usually observed age-specific mortality rates, nMx
The trick then is to convert these observed age-specific mortality rates into one of the columns of a life table
The most convenient choice is to convert to nqx
nMx to nqx conversion
Critical assumption is that nMx~ nmx

27
nmx nqx
rearrange
1
using this in the expression for
1
rearranging and dividing by
n x x n n x n x
x n x n x n x
x n x n x n x n x
x n x n x n x
n x
n x n xn x
xn x n x n x
n x
n x
n xn x
n xn x
n x
L n l a d
n l d a d
n l L n d a d
l L n a dn
q
d dq
l L n a dn
L
dn
Lq
Ln a
L
1
n x
n x
n xn x
n x n x
dL
n mq
n a m

28
Strategies for Choosing nax
nmx nqx requires nax … where do we get nax ?
From calculating it directly From smoothing (graduating) the death distribution within
each age interval Borrowing values from another population Making one of two assumptions:
– nax is half the length of the age interval (n/2), or
– nmx is constant in the interval which negates the necessity of using nax because there is a direct formula to calculate
npx:n xn m
n xp e

29
nax in Practice
Usually use n/2 for all age groups except the first Mortality rate between ages 0 and 5 changes very
rapidly, falling very quickly at first and then flattening out Consequently most deaths early in life occur closer to 0
than to 5 and hence nax is significantly less than n/2 in the first two age groups (0, 1-4)
In general in other age groups where mortality is changing less rapidly, the overall life table is very insensitive to the exact choice of nax

30
nax for Very Young Ages
Males Females
Value of 1a0
I f 1m0 >= 0.107 0.330 0.350I f 1m0 < 0.107 0.045+2.684(1m0) 0.053+2.800(1m0)
Value of 4a1
I f 1m0 >= 0.107 1.352 1.361I f 1m0 < 0.107 1.651-2.816(1m0) 1.522-1.518(1m0)

31
The Open-ended Age Interval
Because n is effectively infinite for the open (last) age interval, we cannot calculate nLx given the formulas we have
rearranging
and for the open interval
so:
n xn x
n x
xx
x
xx
x
x x
xx
x
dm
L
dm
L
dL
m
l d
lL
m

32
Review
Construct life tables from real data in Excel