san diego illustrated: 2015 edition
TRANSCRIPT

SAN DIEGOI l l u s t r at e d 2 0 1 5 E d i t i o n
A V I S U A L G U I D E T O T A X E S & T H E E C O N O M Y

1
IntroductionEach city has a multifaceted tax code with many moving parts, and San Diego is no exception. This chart book aims to help readers understand San Diego’s overall economy and tax system from a broad perspective. To do this, we view San Diego in the context of four other California cities: Fresno, Los Angeles, San Francisco, and San Jose. Through a series of charts and maps, this book illustrates San Diego’s tax climate and economy, in an effort to depict the challenges faced by individuals, businesses, and policymakers. Each piece of San Diego’s economic climate tells a story, and we know how important it is to put that story into the larger context. We hope that this book will help put those dynamic pieces together to provide an in-depth picture of San Diego’s economy.
Joseph Henchman Vice President Legal & State Projects Tax Foundation
These charts were created and compiled by Tax Foundation Economist Liz Malm in collaboration with the San Diego Regional Chamber of Commerce and Tax Foundation staff. The San Diego Regional Chamber of Commerce would like to thank the County of San Diego for its investment in this resource for San Diego taxpayers.
Jerry Sanders President & CEO San Diego Regional Chamber of Commerce
2 | SAN DIEGO ILLUSTRATED
Chapter 1: An Overview of San Diego’s EconomySan Diego and Select California Competitor Cities 4San Diego Is Home to a Younger Population 5San Diego’s Economy Relies More on Government, Real Estate, and Professional Services than Most Metro Areas 674 Percent of San Diego Employers Have Fewer than Ten Employees 7San Diego Has a 60 Percent Employment-to-Population Ratio 8Wages in San Diego Have Risen above the U.S. Metro Average 9Compared to Other California Cities, San Diego’s Electricity Prices Are High 10
Chapter 2: San Diego’s Tax and Budget ClimateCities Don’t Just Obtain Revenue from Taxes 12San Diego Depends on Taxes for the Largest Share of Its Total Revenue 13Tax Collections in San Diego over Time 14San Diego’s Tax Collections Are Mostly from Taxes on Property and Retail Sales 15San Diego Has One of the Lower Combined Sales Tax Rates in California 16San Diego Spends the Largest Share of Expenditures on Public Safety, like Other Cities 17
Chapter 3: California’s Tax Code: The BasicsCalifornia Taxes at a Glance 19How Does California Score? 20California Has One of the Worst Business Tax Climates 21California’s Business Tax Climate Falls behind Regionally 22State Tax Collections Have Grown Faster than Local Collections 23California’s Tax Burden Is Higher than the U.S. Average 24Effective Business Tax Rates in California Vary Widely by Industry 25California’s Top Income Tax Rate Is near Historic Highs 26
Table of Contents
3
An Overview of San Diego’s Economy
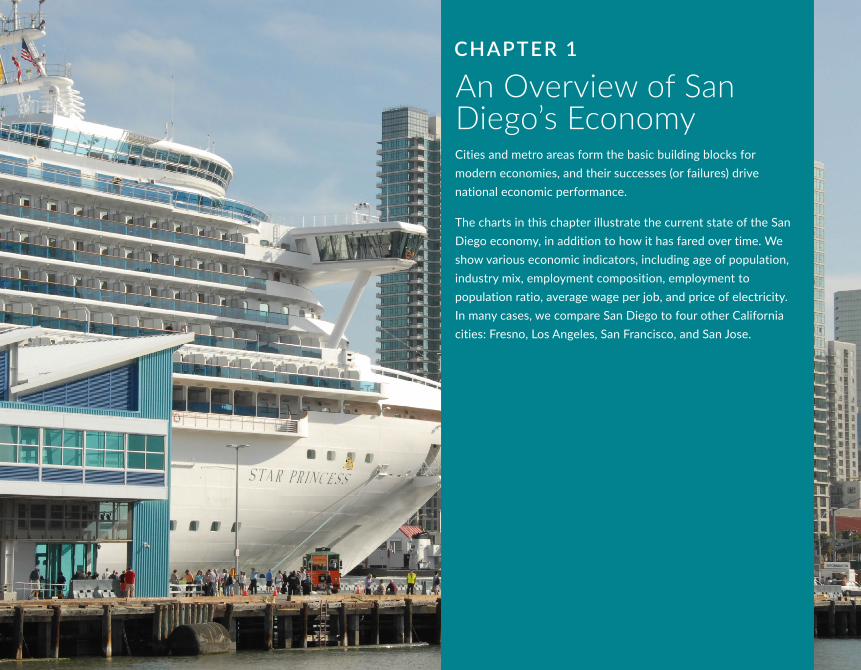
CHAPTER 1
Cities and metro areas form the basic building blocks for modern economies, and their successes (or failures) drive national economic performance.
The charts in this chapter illustrate the current state of the San Diego economy, in addition to how it has fared over time. We show various economic indicators, including age of population, industry mix, employment composition, employment to population ratio, average wage per job, and price of electricity. In many cases, we compare San Diego to four other California cities: Fresno, Los Angeles, San Francisco, and San Jose.
4 | SAN DIEGO ILLUSTRATED
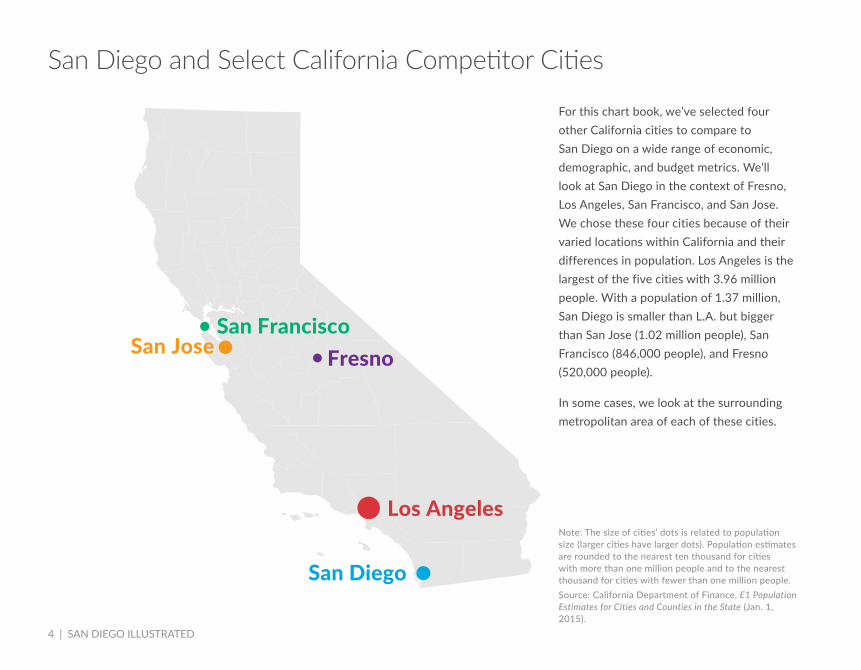
San Diego and Select California Competitor Cities
For this chart book, we’ve selected four other California cities to compare to San Diego on a wide range of economic, demographic, and budget metrics. We’ll look at San Diego in the context of Fresno, Los Angeles, San Francisco, and San Jose. We chose these four cities because of their varied locations within California and their differences in population. Los Angeles is the largest of the five cities with 3.96 million people. With a population of 1.37 million, San Diego is smaller than L.A. but bigger than San Jose (1.02 million people), San Francisco (846,000 people), and Fresno (520,000 people).
In some cases, we look at the surrounding metropolitan area of each of these cities.
Note: The size of cities’ dots is related to population size (larger cities have larger dots). Population estimates are rounded to the nearest ten thousand for cities with more than one million people and to the nearest thousand for cities with fewer than one million people.Source: California Department of Finance, E1 Population Estimates for Cities and Counties in the State (Jan. 1, 2015).
Fresno
Los Angeles
San Jose
San Diego
San Francisco
CHAPTER 1 | 5
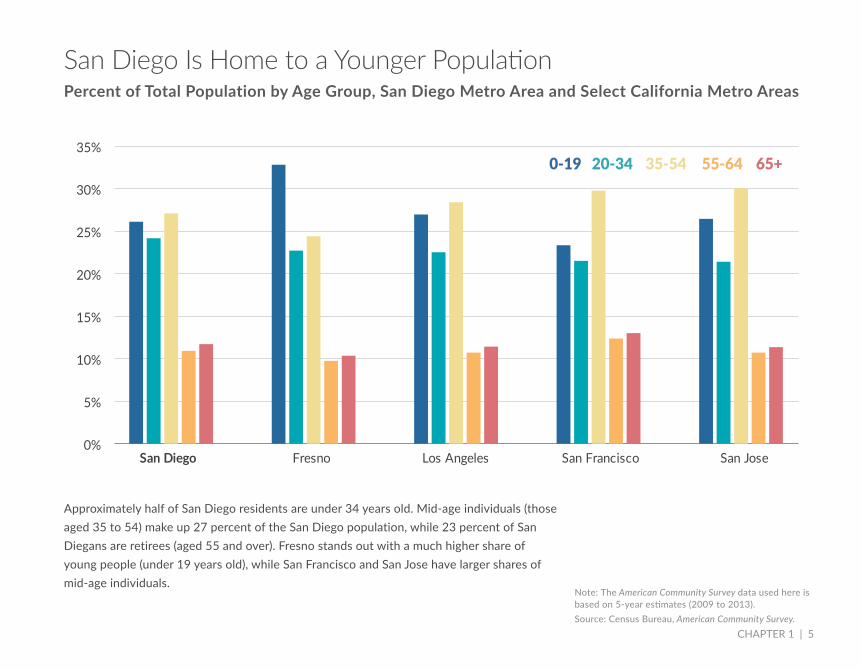
San Diego Is Home to a Younger PopulationPercent of Total Population by Age Group, San Diego Metro Area and Select California Metro Areas
Approximately half of San Diego residents are under 34 years old. Mid-age individuals (those aged 35 to 54) make up 27 percent of the San Diego population, while 23 percent of San Diegans are retirees (aged 55 and over). Fresno stands out with a much higher share of young people (under 19 years old), while San Francisco and San Jose have larger shares of mid-age individuals.
Note: The American Community Survey data used here is based on 5-year estimates (2009 to 2013).Source: Census Bureau, American Community Survey.
0-19 20-34 35-54 55-64 65+
0%
5%
10%
15%
20%
25%
30%
35%
San Diego Fresno Los Angeles San Francisco San Jose

6 | SAN DIEGO ILLUSTRATED
San Diego’s Economy Relies More on Government, Real Estate, and Professional Services than Most Metro AreasPercent of Total Area Gross Domestic Product by Sector, San Diego Metro Area and U.S. Metro Average (2013)
The San Diego metropolitan area economy relies much more on government, real estate, and professional, scientific, and technical services than the U.S. metro average. At 21 percent of San Diego’s economy, government is far more prominent than in most metro areas. This is largely a reflection of sizable military and other federal employment. San Diego, like many California cities, also has a large real estate sector.
Source: Bureau of Economic Analysis, Regional Economic Accounts, Gross Domestic Product (GDP) by Metropolitan Area.
0% 5% 10% 15% 20% 25%
Mining
Agriculture & Related Industries
Transportation & Warehousing
Arts, Entertainment, & Recreation
Educational Services
Management
Utilities
Other Private Sector Services
Administration & Support Services
Accommodation & Food Services
Construction
Information
Finance & Insurance
Wholesale Trade
Retail Trade
Healthcare & Social Assistance
Manufacturing
Professional, Scientific,& Tech. Services
Real Estate
Government (incl. Military)
San Diego Metro AreaU.S. Metro Average
2.2%
0.8%
2.9%
1.0%
1.2%
2.1%
1.6%
2.1%
3.1%
2.7%
3.6%
5.1%
7.1%
6.2%
5.6%
7.2%
11.9%
7.5%
13.8%
12.2%
0.2%
0.5%
1.0%
1.0%
1.0%
1.8%
1.9%
2.0%
2.9%
3.0%
3.2%
3.5%
4.0%
4.8%
5.1%
5.3%
8.7%
10.7%
18.9%
20.6%

CHAPTER 1 | 7
74 Percent of San Diego Employers Have Fewer than Ten EmployeesPercent of Total San Diego Metro-Area Employers by Number of Employees (2013)
San Diego employers tend to be on the smaller side, which is true for most areas. 74 percent of San Diego employers have fewer than 10 employees. Although only 5 percent of employers have more than 50 employees, these large firms employ a significant portion of San Diego’s workforce.
Even though firms employing hundreds of people are very prominent, such as major manufacturers, they often rely on many smaller suppliers in the local economy to provide intermediate goods and services.
74%
12%
8% 5%
1 to 9 employees
10 to 19 employees
20 to 49 employees
50 or more employees
Note: This does not include non-employer (self-employed) firms. Source: Census Bureau, County Business Patterns (Geographic Area Series).
8 | SAN DIEGO ILLUSTRATED
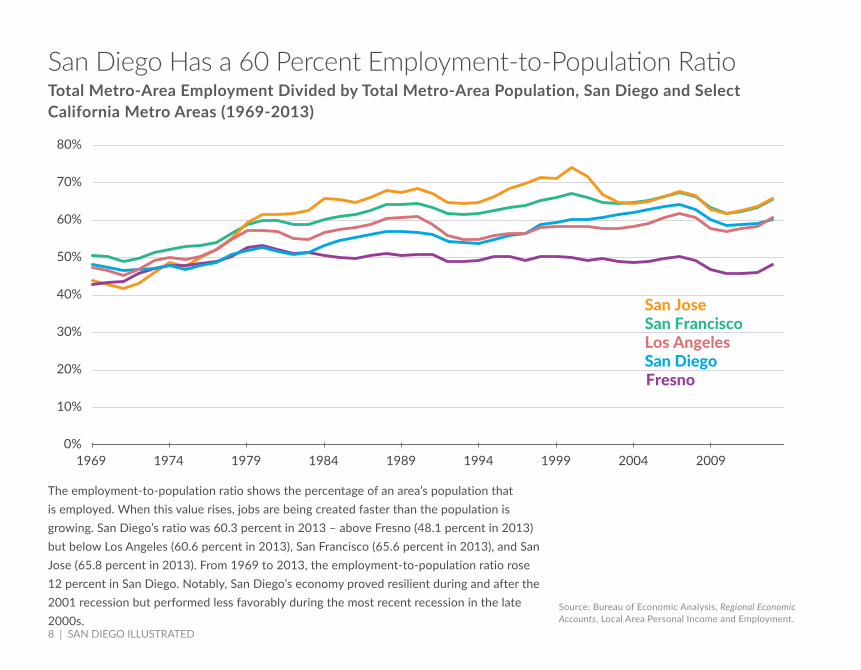
San Diego Has a 60 Percent Employment-to-Population RatioTotal Metro-Area Employment Divided by Total Metro-Area Population, San Diego and Select California Metro Areas (1969-2013)
The employment-to-population ratio shows the percentage of an area’s population that is employed. When this value rises, jobs are being created faster than the population is growing. San Diego’s ratio was 60.3 percent in 2013 – above Fresno (48.1 percent in 2013) but below Los Angeles (60.6 percent in 2013), San Francisco (65.6 percent in 2013), and San Jose (65.8 percent in 2013). From 1969 to 2013, the employment-to-population ratio rose 12 percent in San Diego. Notably, San Diego’s economy proved resilient during and after the 2001 recession but performed less favorably during the most recent recession in the late 2000s.
Source: Bureau of Economic Analysis, Regional Economic Accounts, Local Area Personal Income and Employment.
1969 1974 1979 1984 1989 1994 1999 2004 2009 0%
10%
20%
30%
40%
50%
60%
70%
80%
San Diego
San FranciscoSan Jose
Los Angeles
Fresno

CHAPTER 1 | 9
Wages in San Diego Have Risen above the U.S. Metro AverageAverage Wage per Job, San Diego Metro Area and U.S. Metro Average (1969-2013, in 2013 Dollars)
Note: “Wage per job” is defined as total wages and salaries divided by wage and salary employment. Dollar amounts are inflation adjusted based on the annual average Consumer Price Index for All Urban Consumers (CPI-U) with a 2013 base year.Source: Bureau of Economic Analysis, Regional Economic Accounts (Local Area Personal Income and Employment); Bureau of Labor Statistics, Consumer Price Indexes.
When compared to other metropolitan areas in the country, San Diego is a high-wage city. From 1969 to 1999, wages in San Diego were typically about 3 percent lower than the U.S. metro average. In 2000, San Diego’s wages surpassed the U.S. metro average and are now over 8 percent higher.
San Diego
Thou
sand
s
U.S. Metro Average
$0
$10
$20
$30
$40
$50
$60
1969 1974 1979 1984 1989 1994 1999 2004 2009

10 | SAN DIEGO ILLUSTRATED
Compared to Other California Cities, San Diego’s Electricity Prices Are HighAverage Retail Price of Electricity Sold to Ultimate Consumer per Kilowatt Hour, San Diego and Select California Cities (2013)
San Diego has the highest residential and industrial average electricity prices when compared to peer cities in California. Average commercial rates in San Diego also exceed those of Los Angeles and San Francisco. Rates are driven by many key factors, including the amount of energy within each utility’s portfolio that comes from various sources, such as renewable energy.
Note: Prices are cited for the largest electricity provider in each city according to the Energy Information Administration. Source: Energy Information Administration, 861 Survey Database (2013 Retail Sales).
0¢
2¢
4¢
6¢
8¢
10¢
12¢
14¢
16¢
18¢
20¢
San DiegoSan Diego Gas &
Electric Co.
San FranciscoCity & County of
San Francisco
Fresno& Pacific Gas
Electric Co.
Los AngelesLos Angeles
Department of Water & Power
San JosePacific Gas & Electric Co.
Residential IndustrialCommercial

San Diego has a moderately-sized city government compared to other California cities and obtains the greatest share of total revenue from taxes. Tax collections in San Diego have risen over time and appear to be returning to the historic high levels seen in the late 2000s. These tax collections mostly come from taxes on property and retail sales, but San Diego also levies taxes on hotel rooms and has business franchise fees. Local sales taxes in the city tend to be lower than most other California cities.
On the expenditure side, San Diego spends the largest share of its total government revenue on public safety, just like many of the other California cities examined here. Total debt per person in San Diego is low.
San Diego’s Tax and Budget Climate
CHAPTER 2
12 | SAN DIEGO ILLUSTRATED
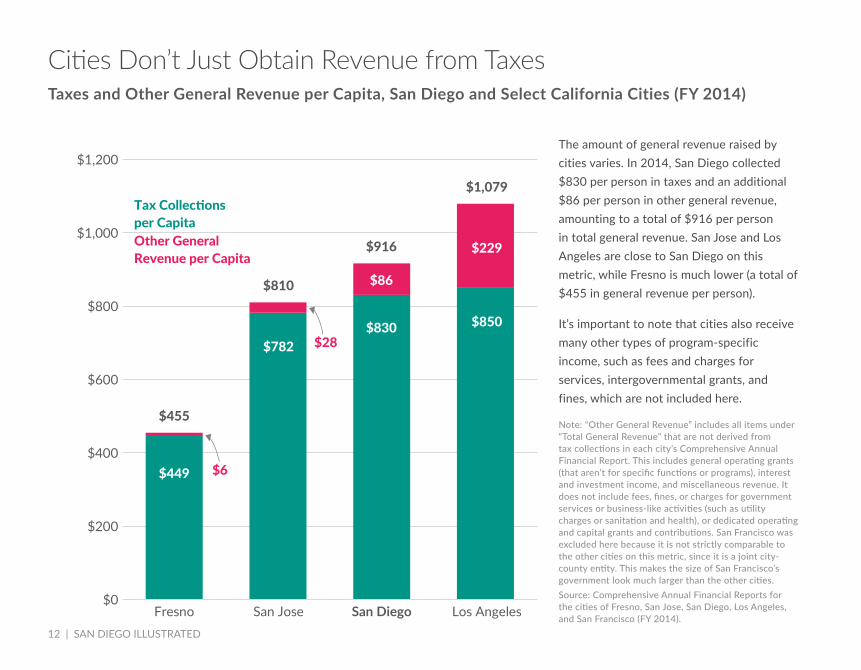
Cities Don’t Just Obtain Revenue from TaxesTaxes and Other General Revenue per Capita, San Diego and Select California Cities (FY 2014)
The amount of general revenue raised by cities varies. In 2014, San Diego collected $830 per person in taxes and an additional $86 per person in other general revenue, amounting to a total of $916 per person in total general revenue. San Jose and Los Angeles are close to San Diego on this metric, while Fresno is much lower (a total of $455 in general revenue per person).
It’s important to note that cities also receive many other types of program-specific income, such as fees and charges for services, intergovernmental grants, and fines, which are not included here.
Note: “Other General Revenue” includes all items under “Total General Revenue” that are not derived from tax collections in each city’s Comprehensive Annual Financial Report. This includes general operating grants (that aren’t for specific functions or programs), interest and investment income, and miscellaneous revenue. It does not include fees, fines, or charges for government services or business-like activities (such as utility charges or sanitation and health), or dedicated operating and capital grants and contributions. San Francisco was excluded here because it is not strictly comparable to the other cities on this metric, since it is a joint city-county entity. This makes the size of San Francisco’s government look much larger than the other cities.Source: Comprehensive Annual Financial Reports for the cities of Fresno, San Jose, San Diego, Los Angeles, and San Francisco (FY 2014).
$455
$810
$916
$1,079
$0
$200
$400
$600
$800
$1,000
$1,200
Fresno San Jose San Diego Los Angeles
Tax Collections per CapitaOther General Revenue per Capita
$6$449
$28
$86
$850$830$782
$229

CHAPTER 2 | 13
San Diego Depends on Taxes for the Largest Share of Its Total RevenuePercent of City Government Total Revenue by Source, San Diego and Select California Cities (FY 2014)
Cities have five major tools in their revenue toolkits: taxes, intergovernmental revenue, revenue from city-owned activities (such as utilities), other program charges (such as service charges, fines, or fees), and miscellaneous general revenue. San Diego depended on taxes for 39 percent of its total revenue in the 2014 fiscal year.
39%
32%
24%
35%
45%
9%
22%
10%
21%
9%
33%
34%
47%
35%
23%
15%
11%
13%
6%
21%
4%
0%
6%
2%
2%
San Diego
Fresno
Los Angeles
San Francisco
San Jose
TaxesMisc. General Revenue
Intergovernmental Revenue
Other Program Charges City-Owned Enterprises
Note: “Intergovernmental Revenue” includes dedicated operating and capital grants and contributions for specific programs and functions. “City-Owned Enterprises” include charges for services rendered by city-owned business-type activities, such as utilities, airports, development services, environmental services, golf courses, and recycling. “Other Program Charges” include charges for government services rendered (such as those related to transportation or sanitation and health, among others). “Misc. General Revenue” includes non-restricted grants and contributions, investment and interest income, and other miscellaneous revenue sources. For specific details about what is included in each category, see city Comprehensive Annual Financial Reports. Source: Comprehensive Annual Financial Reports for the cities of Fresno, San Jose, San Diego, Los Angeles, and San Francisco (FY 2014).

14 | SAN DIEGO ILLUSTRATED
Tax Collections in San Diego over TimeSan Diego Tax Collections per Capita by Tax Type (1990-2014, in 2014 Dollars)
Note: Dollar amounts are inflation adjusted based on the annual average Consumer Price Index for All Urban Consumers (CPI-U) with a 2014 base year. “Property Taxes” include special assessments. Prior to 2004, hotel taxes were reported as a component of “Other Taxes.” Note that “Other Taxes” include franchise fees (this is the largest share of the “Other Taxes” category).Source: San Diego Comprehensive Annual Financial Reports, 1990-2014; Bureau of Labor Statistics, Consumer Price Indexes; California Department of Finance, E-4 Historical Population Estimates for Cities, Counties, and the State.
From 1990 until 2000, San Diego’s tax collections rose very slowly in real terms to $646 per capita. But during the 2000s, rising property values led to a dramatic increase in property tax collections. Since a peak in 2009 of $1,034 per capita, collections have fallen to $859 per capita in 2014. This shift is almost entirely due to property tax collections falling after the real estate bubble burst.
$0
$200
$400
$600
$800
$1,000
$1,200
1990 1995 2000 2005 2010
Other Taxes
Hotel Taxes Sales Taxes
Property Taxes
CHAPTER 2 | 15
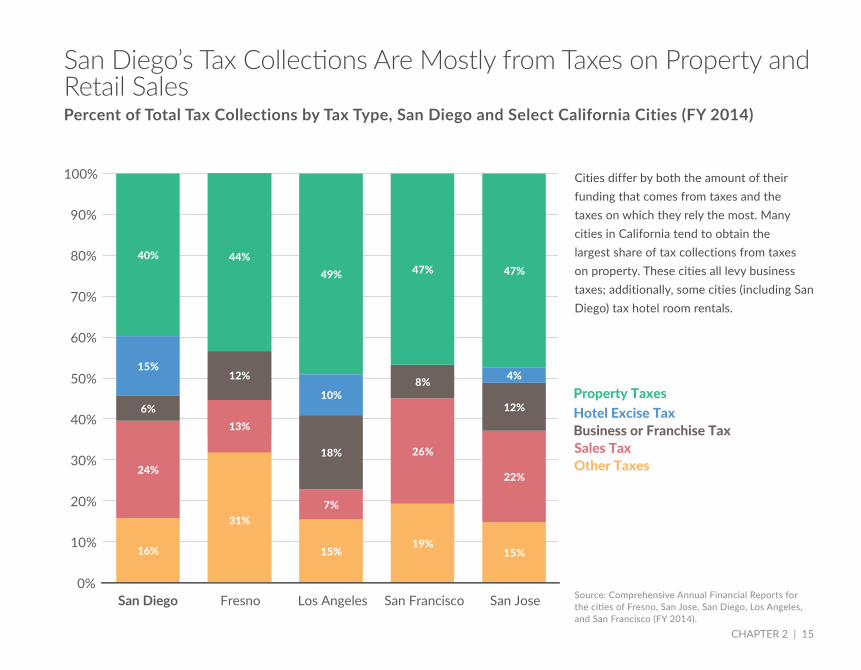
San Diego’s Tax Collections Are Mostly from Taxes on Property and Retail SalesPercent of Total Tax Collections by Tax Type, San Diego and Select California Cities (FY 2014)
Cities differ by both the amount of their funding that comes from taxes and the taxes on which they rely the most. Many cities in California tend to obtain the largest share of tax collections from taxes on property. These cities all levy business taxes; additionally, some cities (including San Diego) tax hotel room rentals.
Source: Comprehensive Annual Financial Reports for the cities of Fresno, San Jose, San Diego, Los Angeles, and San Francisco (FY 2014).
16%
36%
15%19%
15%
24%
7%
26%
22%
6% 14%
18%
8%
12%
15%
10%
4%
40%
50% 49% 47% 47%
0%
10%
20%
30%
40%
50%
60%
70%
80%
90%
100%
San Diego Fresno Los Angeles San Francisco San Jose
Property Taxes Other TaxesHotel Excise Tax Sales Tax
Business or Franchise Tax
44%
13%
12%
31%
Property Taxes
Other Taxes
Hotel Excise Tax
Sales TaxBusiness or Franchise Tax

16 | SAN DIEGO ILLUSTRATED
San Diego Has One of the Lower Combined Sales Tax Rates in CaliforniaState and Local Sales Tax Rates, San Diego and Select California Cities (effective July 1, 2015)
The state of California has a 6.5 percent sales tax, but it’s important to remember that local sales taxes are collected in addition to this. A mandatory local-level tax of one percent is levied throughout the state, however many counties and cities collect additional local sales taxes on top of this. In San Diego, the combined rate is 8 percent – not the lowest in the state, but lowest among our selected cities.
Note: The mandatory statewide local add-on sales tax of 1 percent is included as part of the local average sales tax rate here. Source: California State Board of Equalization, California City & County Sales & Use Tax Rates (effective July 1, 2015); California State Board of Equalization, Detailed Description of the Sales & Use Tax Rate.
0% 1% 2% 3% 4% 5% 6% 7% 8% 9% 10%
1.5%San Diego
1.725%Fresno
2.5%San Francisco
2.25%San Jose
2.5%Los Angeles
State RateLocal Rate
CHAPTER 2 | 17
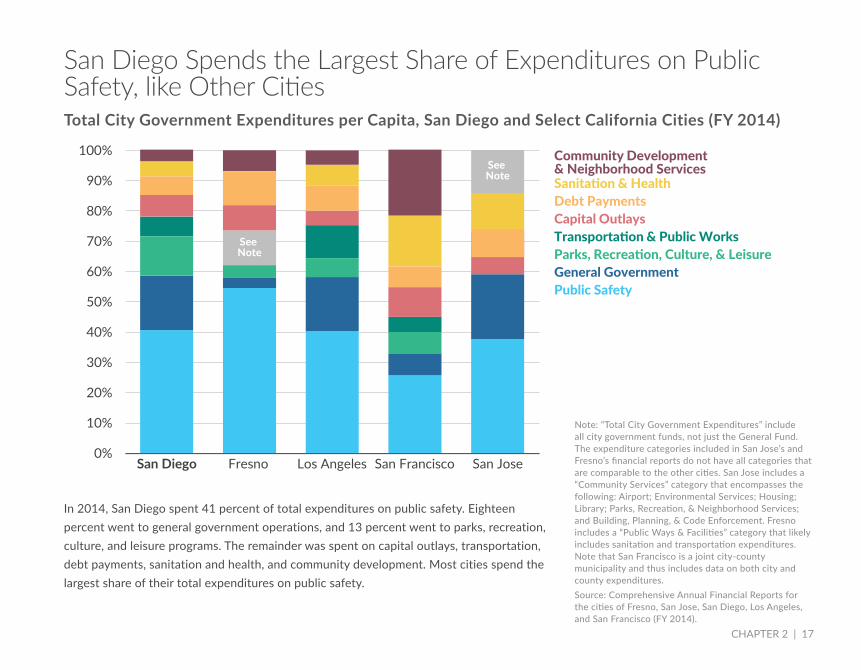
San Diego Spends the Largest Share of Expenditures on Public Safety, like Other CitiesTotal City Government Expenditures per Capita, San Diego and Select California Cities (FY 2014)
In 2014, San Diego spent 41 percent of total expenditures on public safety. Eighteen percent went to general government operations, and 13 percent went to parks, recreation, culture, and leisure programs. The remainder was spent on capital outlays, transportation, debt payments, sanitation and health, and community development. Most cities spend the largest share of their total expenditures on public safety.
Note: “Total City Government Expenditures” include all city government funds, not just the General Fund. The expenditure categories included in San Jose’s and Fresno’s financial reports do not have all categories that are comparable to the other cities. San Jose includes a “Community Services” category that encompasses the following: Airport; Environmental Services; Housing; Library; Parks, Recreation, & Neighborhood Services; and Building, Planning, & Code Enforcement. Fresno includes a “Public Ways & Facilities” category that likely includes sanitation and transportation expenditures. Note that San Francisco is a joint city-county municipality and thus includes data on both city and county expenditures.Source: Comprehensive Annual Financial Reports for the cities of Fresno, San Jose, San Diego, Los Angeles, and San Francisco (FY 2014).
0%
10%
20%
30%
40%
50%
60%
70%
80%
90%
100%
San Diego Fresno Los Angeles San Francisco San Jose
General GovernmentPublic Safety
Transportation & Public WorksParks, Recreation, Culture, & Leisure
Sanitation & Health
Community Development & Neighborhood Services
Capital OutlaysDebt Payments
See Note
See Note

18 | SAN DIEGO ILLUSTRATED
California relies on several types of taxes to raise revenue, including individual income, corporate income, sales, and excise taxes. Tax burdens and collections alike are high compared to other states. The taxes are poorly structured and generally serve as a deterrent to business.
Despite San Diego’s comparatively healthy economy, California’s overall burdensome tax climate makes it difficult for San Diego to compete. Because of these growing state tax burdens, San Diego is left with relatively little space to pursue its own priorities.
California’s Tax Code: The Basics
CHAPTER 3

CHAPTER 3 | 19
California Taxes at a Glance
This page provides a brief, broad overview of tax rates, tax collections, and other basic structural features of the California system.
Note: All collections listed on this page are combined state and local per capita collections for the 2012 fiscal year. Income, federal aid, and state debt are for 2013. Individual and corporate income tax rates are ranked according to the top rate if a state has a graduated-rate individual or corporate income tax. “State debt” is the total outstanding debt at the end of the fiscal year, as defined by the Census Bureau. The mandatory statewide local add-on sales tax of 1 percent is included as part of the local average sales tax rate here.Source: Tax Foundation, Facts & Figures 2015: How Does Your State Compare?
Individual Income TaxNumber of brackets 10Top bracket tax rate 13.3%Top bracket kick-in $1 milBottom bracket tax rate 1%Bottom bracket kick-in $0 Collections per capita $1,454 Collections rank 7
Property TaxCollections per capita $1,363 Collections rank 21Effective residential property tax rate
0.81%
Effective rate rank 39
Sales TaxState rate 6.5%State + average local rate 8.44%State + average local rank 8Collections per capita $1,082 Collections rank 17
Corporate Income TaxNumber of brackets 1Tax rate 8.84%Tax rate rank 8Collections per capita $210 Collections rank 9
Excise Taxes Rate Rank
Gasoline taxes and fees 45.39¢ per gallon
2
Cigarette taxes $0.87 per pack
32
Spirits taxes $3.30 per gallon
39
Wine taxes $0.20 per gallon
28
Beer taxes $0.20per gallon
28
Cell phone taxes 10.21% 29
General Info Rank Nat. Avg.
Income per capita $48,434 11 $44,765Federal aid as % of gen. revenue
25% 42 30%
State debt per capita
$3,987 18 $3,611
Other TaxesGross receipts tax NoneCapital stock tax NoneInheritance tax None Estate tax None
For all rankings on this page, 1 indicates the highest rank among the 50 states.

20 | SAN DIEGO ILLUSTRATED
How Does California Score?High, Poorly-Structured Taxes Burden Californians
Tax Freedom Day is the day when taxpayers have earned enough to pay their total combined federal, state, and local tax bill for the year. In 2015, California taxpayers worked 122 days into the year (until May 3) to pay their total tax bill. Forty-six states celebrated Tax Freedom Day before California.
Tax Freedom Day® 2015
In 2015, California ranks 48th out of the 50 states on the Tax Foundation’s State Business Tax Climate Index, which annually compares the states’ tax systems on over 100 variables that impact business. In other words, California has the 3rd worst business tax climate when compared to other states.
California ranks 4th highest on the Annual State-Local Tax Burden Rankings, which estimates state and local taxes paid by taxpayers to their states of residence and other states. An estimated 11.4 percent of California’s collective income goes toward state and local taxes (above the national average of 9.8 percent).
48thState Business Tax
Climate Index
best
State-Local Tax Burden Rank
4th 47thhighest
Note: The Annual State-Local Tax Burden Rankings is calculated annually using the most recently available data. For a full list of definitional terms and methodology, see Tax Foundation Working Paper No. 10.Source: Tax Foundation, 2015 State Business Tax Climate Index; Tax Foundation, Annual State-Local Tax Burden Rankings FY 2011 (Apr. 2014); Tax Foundation, Tax Freedom Day ® 2015.

CHAPTER 3 | 21
California Has One of the Worst Business Tax ClimatesCalifornia Ranks 48th out of 50 in the State Business Tax Climate Index (2015)
The State Business Tax Climate Index gauges how well structured each state’s tax code is for business. States that score well in the Index have broad bases and low rates, but California scores 48th for its narrow bases and high rates. California is the only bottom-ten state on the West Coast, facing stiff competition from better-ranked states like Nevada, Utah, Washington, and Oregon.
Note: A rank of 1 indicates the state’s tax system is more favorable for business; a rank of 50 indicates the state’s tax system is less favorable for business. Snapshot date is July 1, 2014. DC’s rank does not affect states’ rankings, but the figure in parentheses indicates where it would rank if included. Source: Tax Foundation, 2015 State Business Tax Climate Index.
VA#27
NC #16
SC#37
GA#36
FL#5
AL#28MS
#18
TN #15
KY #26
OH#44IN
#8IL
#31
MO#17
AR#39
LA #35
IA#41
MN#47
WI#43 MI
#13PA#34
NY#49
ME#33
TX#10
OK#32
KS#22
NE#29
SD#2
ND#25
MT#6
WY#1
CO#20
NM#38
AZ#23
UT#9
NV#3
ID#19
OR#12
WA#11
CA#48
AK#4
HI#30
WV#21
#24
#45
#42
#50
#14
#40
(#45)
MA
RI
CT
NJ
DE
MD
DC
#46VT
#7NH
10 Best Business Tax Climates10 Worst Business Tax Climates

22 | SAN DIEGO ILLUSTRATED
Overall Rank
Corporate Tax Rank
Individual Income Tax Rank
Sales Tax Rank
Unemployment Insurance Tax Rank
Property Tax Rank
Nevada 3 1 1 39 43 9Utah 9 5 12 19 22 4Texas 10 39 6 36 15 36Washington 11 28 6 46 19 23Oregon 12 36 31 4 30 15Idaho 19 21 24 22 46 3Arizona 23 24 19 49 4 6California 48 34 50 42 14 14
California’s Business Tax Climate Falls behind RegionallyState Business Tax Climate Index Rankings, California and Select States in the Region (2015)
Breaking the State Business Tax Climate Index into its subcomponents allows us to compare the structure of each major tax type. California’s neighboring states offer more competitive tax climates in nearly all categories. Property taxes are California’s strength, though deficiencies in the individual income tax and sales tax make the state score among the worst overall.
Note: A rank of 1 indicates the state’s tax system is more favorable for business; a rank of 50 indicates the state’s tax system is less favorable for business. Snapshot date is July 1, 2014. Component rankings do not average to the overall rank. States without a given tax rank equally as number 1 in that component. Source: Tax Foundation, 2015 State Business Tax Climate Index.

CHAPTER 3 | 23
State Tax Collections Have Grown Faster than Local CollectionsCalifornia’s Combined State and Local Tax Collections (1961-2012, in 2012 Dollars)
California’s inflation-adjusted combined state-local tax collections have risen from approximately $37.5 billion in 1961 to $183.7 billion in 2012. Since 1961, state tax collections have grown from 46 percent of the combined total to 63 percent. Local tax collections have shrunk from 54 percent of the total to 37 percent.
Note: Dollar amounts are inflation adjusted based on the annual average Consumer Price Index for All Urban Consumers (CPI-U) with a 2012 base year. Because local data is unavailable for 2001 and 2003, those points were excluded here, and that area of the chart is filled in with a lighter shade to denote the difference.Source: Census Bureau, State and Local Government Finances; Bureau of Labor Statistics, Consumer Price Indexes.
$0
$20
$40
$60
$80
$100
$120
$140
$160
$180
$200
1961 1966 1971 1976 1981 1986 1991 1996 2001 2006 2011
Billi
ons
State Tax Collections
Local Tax Collections

24 | SAN DIEGO ILLUSTRATED
Historically, California taxpayers have paid a larger share of their collective income to state and local taxes than the U.S. average. Currently, Californians pay 11.4 percent of their income to state and local taxes, while the total U.S. on average only pays 9.8 percent.
Note: For a full list of definitional terms and methodology, see Tax Foundation Working Paper No. 10.Source: Tax Foundation, Annual State-Local Tax Burden Ranking FY 2011 (Apr. 2014).
Three things can change a state’s tax burden as a share of income: changes in taxes paid to other states, changes in taxes paid to the home state, and changes in state income.
8.0%
8.5%
9.0%
9.5%
10.0%
10.5%
11.0%
11.5%
12.0%
12.5%
U.S. Average
California
1977 1981 1985 1989 1993 1997 2001 2005 2009
California’s Tax Burden Is Higher than the U.S. AverageTotal State-Local Tax Burden as a Percent of State Income, California and U.S. Average (1977-2011)
CHAPTER 3 | 25
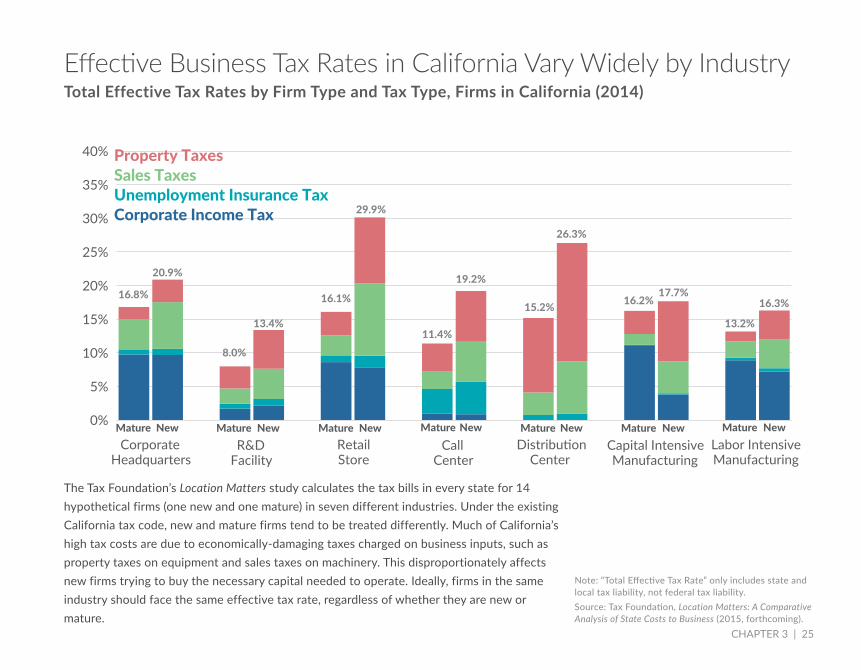
Effective Business Tax Rates in California Vary Widely by IndustryTotal Effective Tax Rates by Firm Type and Tax Type, Firms in California (2014)
The Tax Foundation’s Location Matters study calculates the tax bills in every state for 14 hypothetical firms (one new and one mature) in seven different industries. Under the existing California tax code, new and mature firms tend to be treated differently. Much of California’s high tax costs are due to economically-damaging taxes charged on business inputs, such as property taxes on equipment and sales taxes on machinery. This disproportionately affects new firms trying to buy the necessary capital needed to operate. Ideally, firms in the same industry should face the same effective tax rate, regardless of whether they are new or mature.
Note: “Total Effective Tax Rate” only includes state and local tax liability, not federal tax liability. Source: Tax Foundation, Location Matters: A Comparative Analysis of State Costs to Business (2015, forthcoming).
16.8%
20.9%
8.0%
13.4%
16.1%
29.9%
11.4%
19.2%
15.2%
26.3%
16.2%17.7%
13.2%
16.3%
0%
5%
10%
15%
20%
25%
30%
35%
40% Property TaxesSales TaxesUnemployment Insurance TaxCorporate Income Tax
Corporate Headquarters
Capital Intensive Manufacturing
DistributionCenter
Call Center
RetailStore
R&D Facility
Labor Intensive Manufacturing
Mature MatureMatureMatureMatureMatureMatureNew NewNewNewNewNewNew

26 | SAN DIEGO ILLUSTRATED
At 13.3 percent, California’s top income tax rate is currently the highest in the country and the second highest it has ever been in the state’s history. As recently as the early 2000s, income tax rates were substantially lower than current rates (though still above most other states).
Income tax increases that went into effect in 2013 gave California the highest top state income tax rate in the nation by a wide margin (the second highest is Hawaii’s at 11 percent).
0%
2%
4%
6%
8%
10%
12%
14%
16%
1935 1940 1945 1950 1955 1960 1965 1970 1975 1980 1985 1990 1995 2000 2005 2010 2015
In 1943, Governor Earl Warren cut the top marginal tax rate from 15 percent to 6 percent.
California’s Top Income Tax Rate Is near Historic HighsTop Marginal Individual Income Tax Rate, California (1935-2015)
Source: State of California Franchise Tax Board.

Attributions
Center for State Tax Policy
Joseph HenchmanVice President, Legal & State Projects
Scott DrenkardEconomist & Manager of State Projects
Liz MalmEconomist
Jared WalczakPolicy Analyst
Publications
Melodie BowlerEditor
Dan CarvajalDesigner
Jerry SandersPresident & CEO
Sean KarafinExecutive Director, Policy & Economic Research
Alison PhillipsCommunications Manager
The Tax Foundation is the nation’s leading independent tax policy research organization. Since 1937, our principled research, insightful analysis, and engaged experts have informed smarter tax policy at the federal, state, and local levels. Our Center for State Tax Policy is routinely relied upon for presentations, testimony, and media appearances on state tax and fiscal policy, and our website is a comprehensive resource for information on tax and spending policy in each U.S. state.
Serving the San Diego business community for more than 140 years, the Chamber is the largest nonprofit advocate for the San Diego regional business community. Representing approximately 2,500 businesses and an estimated 300,000 jobs, the Chamber is actively involved in local government, regional economic development, and providing valuable resources to its members.
Cover, San Diego, photo: San Diego Regional Chamber of CommercePage 1, Balboa Park Botanical Building, photo: Bernard GagnonPage 3, Cruise Ships, photo: Port of San DiegoPage 11, Sailboats, photo: San Diego Regional Chamber of CommercePage 18, UCSD Campus, photo: Leandro Neumann CiuffoBack Cover, Coronado Pier, photo: Chad McDonald
San Diego Regional Chamber of Commerce
Tax Foundation

Each city has a multifaceted tax code with many moving parts, and San Diego is no exception. This chart books aims to help readers understand San Diego’s overall economy and tax system from a broad perspective.