san francisco market focus october 2015
TRANSCRIPT
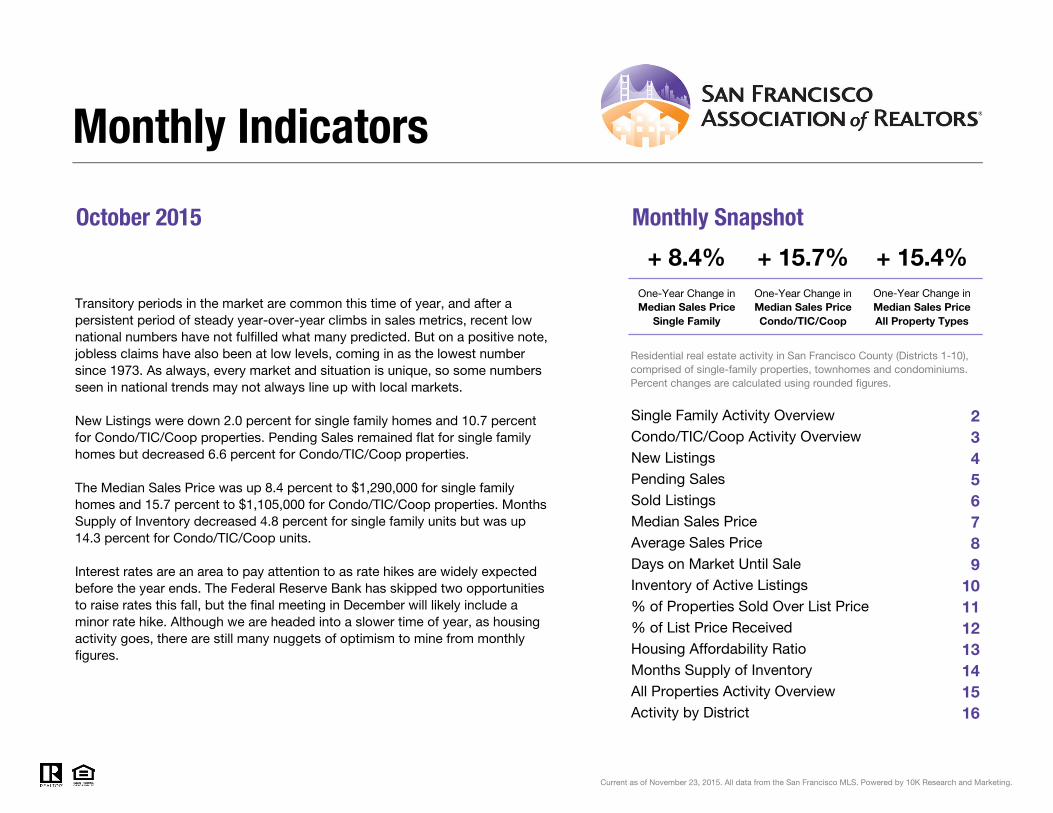
October 2015 Monthly Snapshot
One-Year Change in One-Year Change inMedian Sales Price
Single FamilyMedian Sales Price Condo/TIC/Coop
23456789
10111213141516
Monthly Indicators
+ 8.4% + 15.7% + 15.4%One-Year Change in
Transitory periods in the market are common this time of year, and after a persistent period of steady year-over-year climbs in sales metrics, recent low national numbers have not fulfilled what many predicted. But on a positive note, jobless claims have also been at low levels, coming in as the lowest number since 1973. As always, every market and situation is unique, so some numbers seen in national trends may not always line up with local markets.
New Listings were down 2.0 percent for single family homes and 10.7 percent for Condo/TIC/Coop properties. Pending Sales remained flat for single family homes but decreased 6.6 percent for Condo/TIC/Coop properties.
The Median Sales Price was up 8.4 percent to $1,290,000 for single family homes and 15.7 percent to $1,105,000 for Condo/TIC/Coop properties. Months Supply of Inventory decreased 4.8 percent for single family units but was up 14.3 percent for Condo/TIC/Coop units.
Interest rates are an area to pay attention to as rate hikes are widely expected before the year ends. The Federal Reserve Bank has skipped two opportunities to raise rates this fall, but the final meeting in December will likely include a minor rate hike. Although we are headed into a slower time of year, as housing activity goes, there are still many nuggets of optimism to mine from monthly figures.
Median Sales Price All Property Types
Residential real estate activity in San Francisco County (Districts 1-10), comprised of single-family properties, townhomes and condominiums. Percent changes are calculated using rounded figures.
Single Family Activity Overview
Months Supply of Inventory
Current as of November 23, 2015. All data from the San Francisco MLS. Powered by 10K Research and Marketing.
Condo/TIC/Coop Activity Overview
Inventory of Active Listings% of Properties Sold Over List Price% of List Price ReceivedHousing Affordability Ratio
All Properties Activity Overview
New ListingsPending SalesSold ListingsMedian Sales PriceAverage Sales PriceDays on Market Until Sale
Activity by District

Single Family Activity OverviewKey metrics by report month and for year-to-date (YTD) starting from the first of the year.
Key Metrics Historical Sparkbars 10-2014 10-2015 Percent Change YTD 2014 YTD 2015 Percent Change
Current as of November 23, 2015. All data from the San Francisco MLS. Powered by 10K Research and Marketing. | 2
Months Supply 2.1 2.0 - 4.8% -- -- --
Affordability Ratio 39 38 - 2.6%
% of List Price Received 113.0% 114.5% + 1.3% 112.7%
43
83.1% + 3.1%
+ 2.9%
39 - 9.3%
116.0%
% of Properties Sold Over List Price 82.4% 82.6% + 0.2% 80.6%
Active Listings 427 388 - 9.1% --
Avg. Sales Price $1,670,076 $1,633,088 - 2.2% $1,452,878
Days on Market 30 25 - 16.7% 30 26 - 13.3%
$1,642,226
-- --
Median Sales Price $1,190,000 $1,290,000 + 8.4% $1,060,000
Sold Listings 278 241 - 13.3% 2,009
New Listings 250 245 - 2.0% 2,517
Pending Sales 267 267 0.0% - 1.7%2,046 2,011
- 0.8%2,496
1,903 - 5.3%
$1,250,000 + 17.9%
+ 13.0%
10-2012 10-2013 10-2014 10-2015
10-2012 10-2013 10-2014 10-2015
10-2012 10-2013 10-2014 10-2015
10-2012 10-2013 10-2014 10-2015
10-2012 10-2013 10-2014 10-2015
10-2012 10-2013 10-2014 10-2015
10-2012 10-2013 10-2014 10-2015
10-2012 10-2013 10-2014 10-2015
10-2012 10-2013 10-2014 10-2015
10-2012 10-2013 10-2014 10-2015
10-2012 10-2013 10-2014 10-2015
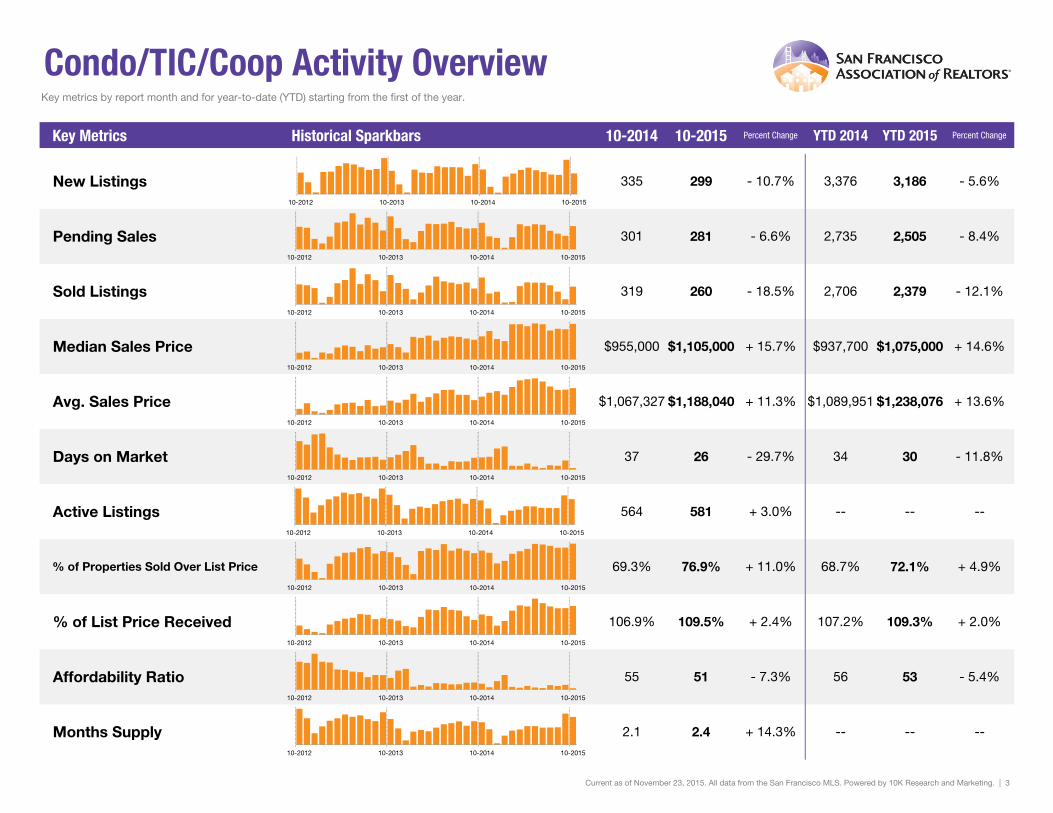
Condo/TIC/Coop Activity OverviewKey metrics by report month and for year-to-date (YTD) starting from the first of the year.
Key Metrics Historical Sparkbars 10-2014 10-2015 Percent Change YTD 2014 YTD 2015 Percent Change
Current as of November 23, 2015. All data from the San Francisco MLS. Powered by 10K Research and Marketing. | 3
Months Supply 2.1 2.4 + 14.3% -- -- --
Affordability Ratio 55 51 - 7.3%
% of List Price Received 106.9% 109.5% + 2.4% 107.2%
56
72.1% + 4.9%
+ 2.0%
53 - 5.4%
109.3%
% of Properties Sold Over List Price 69.3% 76.9% + 11.0% 68.7%
Active Listings 564 581 + 3.0% --
Avg. Sales Price $1,067,327 $1,188,040 + 11.3% $1,089,951
Days on Market 37 26 - 29.7% 34
$1,075,000 + 14.6%
+ 13.6%
30 - 11.8%
$1,238,076
-- --
Sold Listings 319 260 - 18.5% 2,706 2,379 - 12.1%
Median Sales Price $955,000 $1,105,000 + 15.7% $937,700
- 5.6%
Pending Sales 301 281 - 6.6% 2,735 2,505 - 8.4%
New Listings 335 299 - 10.7% 3,376 3,18610-2012 10-2013 10-2014 10-2015
10-2012 10-2013 10-2014 10-2015
10-2012 10-2013 10-2014 10-2015
10-2012 10-2013 10-2014 10-2015
10-2012 10-2013 10-2014 10-2015
10-2012 10-2013 10-2014 10-2015
10-2012 10-2013 10-2014 10-2015
10-2012 10-2013 10-2014 10-2015
10-2012 10-2013 10-2014 10-2015
10-2012 10-2013 10-2014 10-2015
10-2012 10-2013 10-2014 10-2015
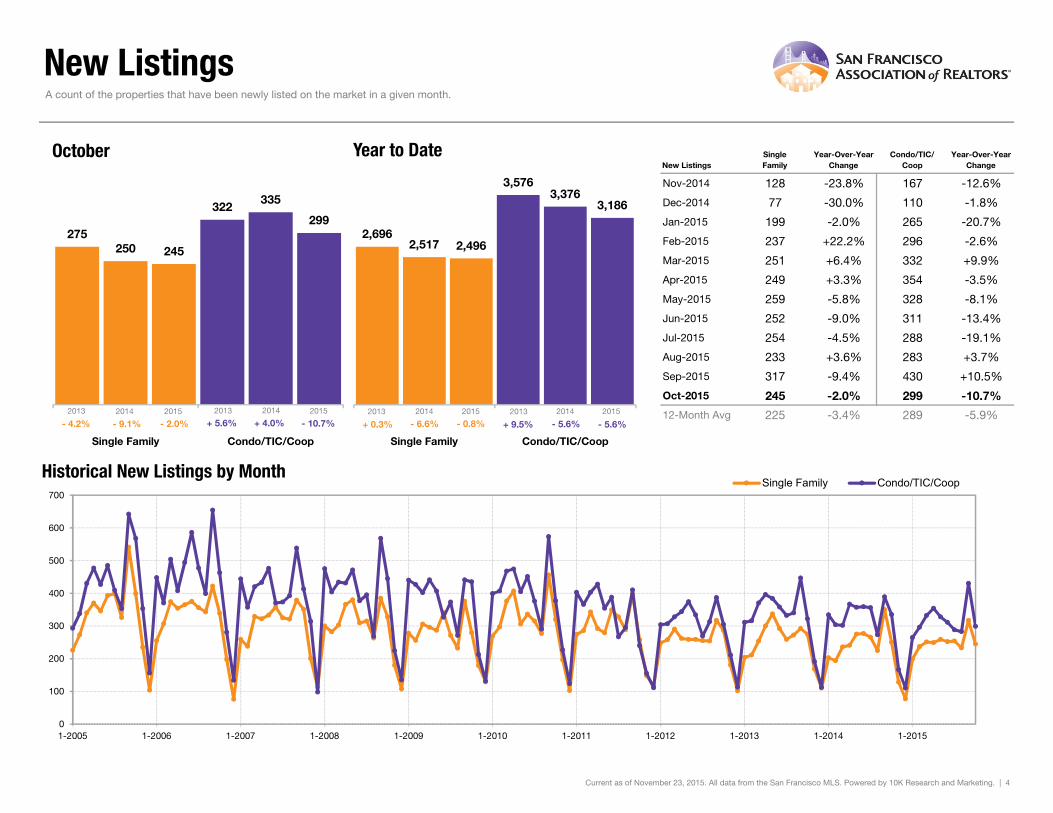
New Listings
New ListingsSingleFamily
Year-Over-YearChange
Condo/TIC/Coop
Year-Over-YearChange
Nov-2014 128 -23.8% 167 -12.6%
Dec-2014 77 -30.0% 110 -1.8%
Jan-2015 199 -2.0% 265 -20.7%
Feb-2015 237 +22.2% 296 -2.6%
Mar-2015 251 +6.4% 332 +9.9%
Apr-2015 249 +3.3% 354 -3.5%
May-2015 259 -5.8% 328 -8.1%
Jun-2015 252 -9.0% 311 -13.4%
Jul-2015 254 -4.5% 288 -19.1%
Aug-2015 233 +3.6% 283 +3.7%
Sep-2015 317 -9.4% 430 +10.5%
Oct-2015 245 -2.0% 299 -10.7%
12-Month Avg 225 -3.4% 289 -5.9%
Historical New Listings by Month
Current as of November 23, 2015. All data from the San Francisco MLS. Powered by 10K Research and Marketing. | 4
A count of the properties that have been newly listed on the market in a given month.
275
322
250
335
245
299
Single Family Condo/TIC/Coop
October
0
100
200
300
400
500
600
700
1-2005 1-2006 1-2007 1-2008 1-2009 1-2010 1-2011 1-2012 1-2013 1-2014 1-2015
Single Family Condo/TIC/Coop
2,696
3,576
2,517
3,376
2,496
3,186
Single Family Condo/TIC/Coop
Year to Date
2013 2014 2015
- 10.7%+ 4.0%- 2.0%- 9.1% - 5.6%- 0.8%- 6.6% - 5.6%
2013 2014 2015 2013 2014 2015 2013 2014 2015
- 4.2% + 0.3% + 9.5%+ 5.6%
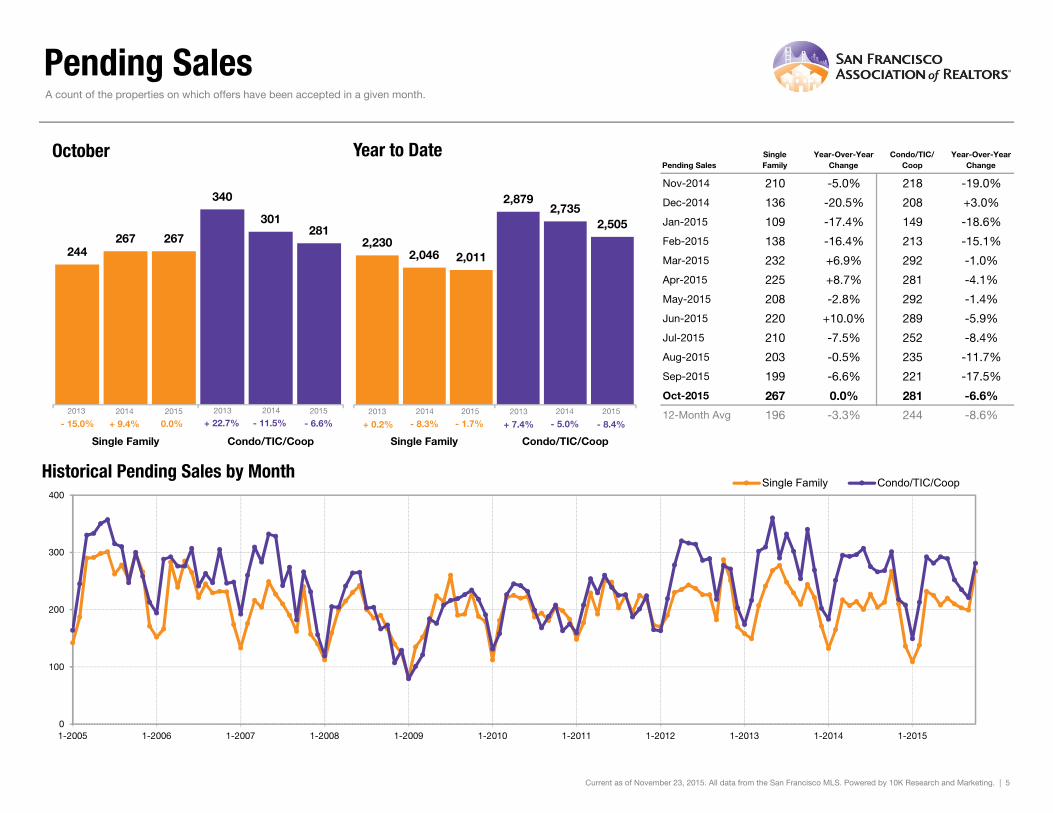
Pending Sales
Pending SalesSingleFamily
Year-Over-YearChange
Condo/TIC/Coop
Year-Over-YearChange
Nov-2014 210 -5.0% 218 -19.0%
Dec-2014 136 -20.5% 208 +3.0%
Jan-2015 109 -17.4% 149 -18.6%
Feb-2015 138 -16.4% 213 -15.1%
Mar-2015 232 +6.9% 292 -1.0%
Apr-2015 225 +8.7% 281 -4.1%
May-2015 208 -2.8% 292 -1.4%
Jun-2015 220 +10.0% 289 -5.9%
Jul-2015 210 -7.5% 252 -8.4%
Aug-2015 203 -0.5% 235 -11.7%
Sep-2015 199 -6.6% 221 -17.5%
Oct-2015 267 0.0% 281 -6.6%
12-Month Avg 196 -3.3% 244 -8.6%
Historical Pending Sales by Month
A count of the properties on which offers have been accepted in a given month.
Current as of November 23, 2015. All data from the San Francisco MLS. Powered by 10K Research and Marketing. | 5
244
340
267
301
267281
Single Family Condo/TIC/Coop
October
0
100
200
300
400
1-2005 1-2006 1-2007 1-2008 1-2009 1-2010 1-2011 1-2012 1-2013 1-2014 1-2015
Single Family Condo/TIC/Coop
2,230
2,879
2,046
2,735
2,011
2,505
Single Family Condo/TIC/Coop
Year to Date
2013 2014 2015
- 6.6%- 11.5%0.0%+ 9.4% - 5.0%- 1.7%- 8.3% - 8.4%
2013 2014 2015 2013 2014 2015 2013 2014 2015
- 15.0% + 0.2% + 7.4%+ 22.7%
Sold Listings
Sold ListingsSingleFamily
Year-Over-YearChange
Condo/TIC/Coop
Year-Over-YearChange
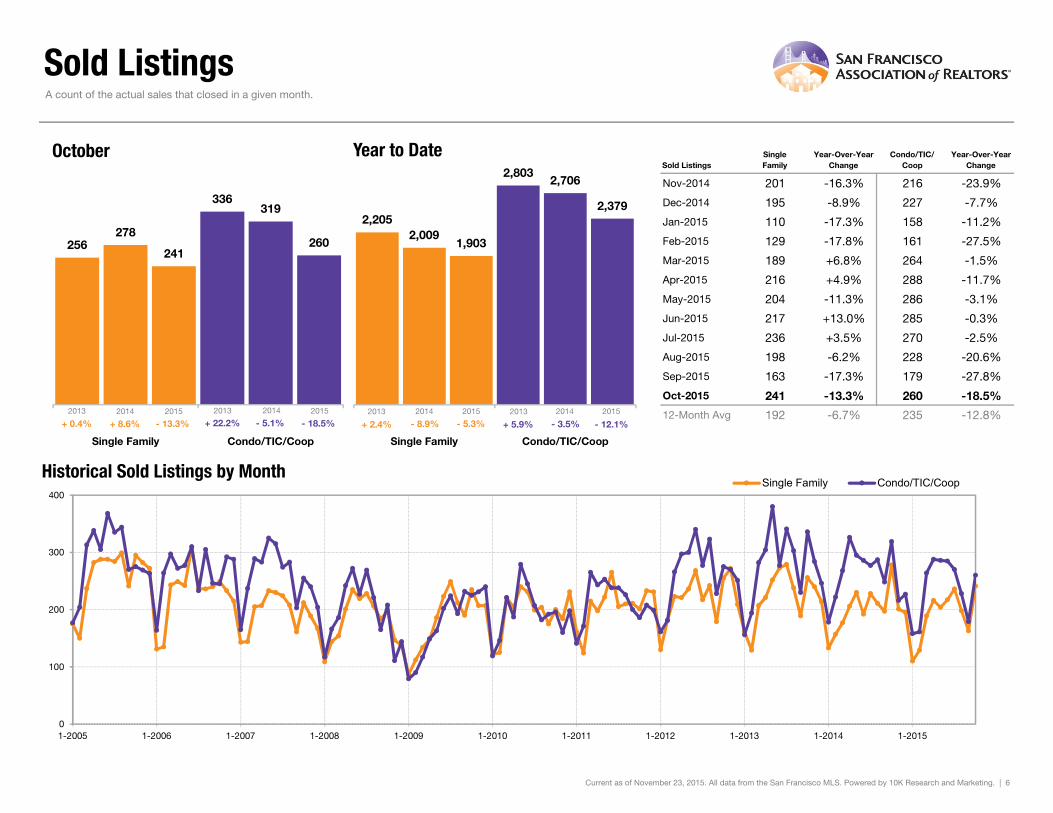
Nov-2014 201 -16.3% 216 -23.9%
Dec-2014 195 -8.9% 227 -7.7%
Jan-2015 110 -17.3% 158 -11.2%
Feb-2015 129 -17.8% 161 -27.5%
Mar-2015 189 +6.8% 264 -1.5%
Apr-2015 216 +4.9% 288 -11.7%
May-2015 204 -11.3% 286 -3.1%
Jun-2015 217 +13.0% 285 -0.3%
Jul-2015 236 +3.5% 270 -2.5%
Aug-2015 198 -6.2% 228 -20.6%
Sep-2015 163 -17.3% 179 -27.8%
Oct-2015 241 -13.3% 260 -18.5%
12-Month Avg 192 -6.7% 235 -12.8%
Historical Sold Listings by Month
A count of the actual sales that closed in a given month.
Current as of November 23, 2015. All data from the San Francisco MLS. Powered by 10K Research and Marketing. | 6
256
336
278
319
241260
Single Family Condo/TIC/Coop
October
0
100
200
300
400
1-2005 1-2006 1-2007 1-2008 1-2009 1-2010 1-2011 1-2012 1-2013 1-2014 1-2015
Single Family Condo/TIC/Coop
2,205
2,803
2,009
2,706
1,903
2,379
Single Family Condo/TIC/Coop
Year to Date
2013 2014 2015
- 18.5%- 5.1%- 13.3%+ 8.6% - 3.5%- 5.3%- 8.9% - 12.1%
2013 2014 2015 2013 2014 2015 2013 2014 2015
+ 0.4% + 2.4% + 5.9%+ 22.2%
Median Sales Price
Median Sales PriceSingleFamily
Year-Over-YearChange
Condo/TIC/Coop
Year-Over-YearChange
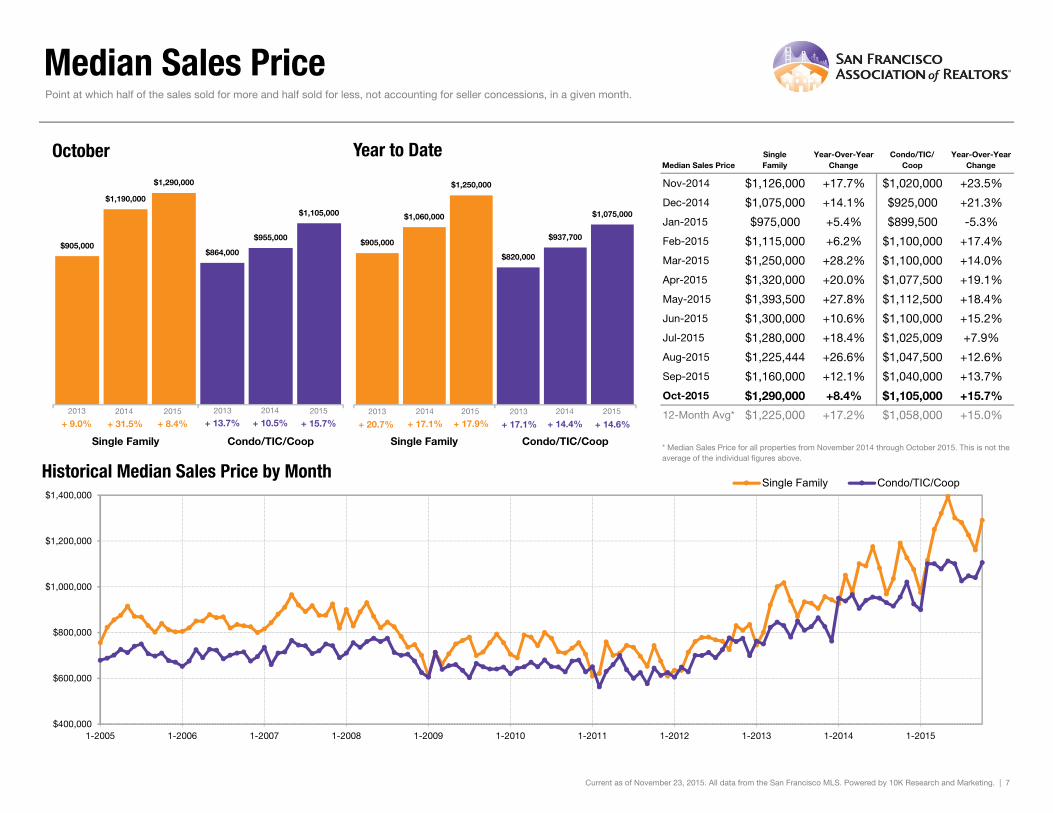
Nov-2014 $1,126,000 +17.7% $1,020,000 +23.5%
Dec-2014 $1,075,000 +14.1% $925,000 +21.3%
Jan-2015 $975,000 +5.4% $899,500 -5.3%
Feb-2015 $1,115,000 +6.2% $1,100,000 +17.4%
Mar-2015 $1,250,000 +28.2% $1,100,000 +14.0%
Apr-2015 $1,320,000 +20.0% $1,077,500 +19.1%
May-2015 $1,393,500 +27.8% $1,112,500 +18.4%
Jun-2015 $1,300,000 +10.6% $1,100,000 +15.2%
Jul-2015 $1,280,000 +18.4% $1,025,009 +7.9%
Aug-2015 $1,225,444 +26.6% $1,047,500 +12.6%
Sep-2015 $1,160,000 +12.1% $1,040,000 +13.7%
Oct-2015 $1,290,000 +8.4% $1,105,000 +15.7%
12-Month Avg* $1,225,000 +17.2% $1,058,000 +15.0%
Historical Median Sales Price by Month
Point at which half of the sales sold for more and half sold for less, not accounting for seller concessions, in a given month.
* Median Sales Price for all properties from November 2014 through October 2015. This is not the average of the individual figures above.
Current as of November 23, 2015. All data from the San Francisco MLS. Powered by 10K Research and Marketing. | 7
$905,000$864,000
$1,190,000
$955,000
$1,290,000
$1,105,000
Single Family Condo/TIC/Coop
October
$400,000
$600,000
$800,000
$1,000,000
$1,200,000
$1,400,000
1-2005 1-2006 1-2007 1-2008 1-2009 1-2010 1-2011 1-2012 1-2013 1-2014 1-2015
Single Family Condo/TIC/Coop
$905,000
$820,000
$1,060,000
$937,700
$1,250,000
$1,075,000
Single Family Condo/TIC/Coop
Year to Date
2013 2014 2015
+ 15.7%+ 10.5%+ 8.4%+ 31.5% + 14.4%+ 17.9%+ 17.1% + 14.6%
2013 2014 2015 2013 2014 2015 2013 2014 2015
+ 9.0% + 20.7% + 17.1%+ 13.7%
Average Sales Price
Avg. Sales PriceSingleFamily
Year-Over-YearChange
Condo/TIC/Coop
Year-Over-YearChange
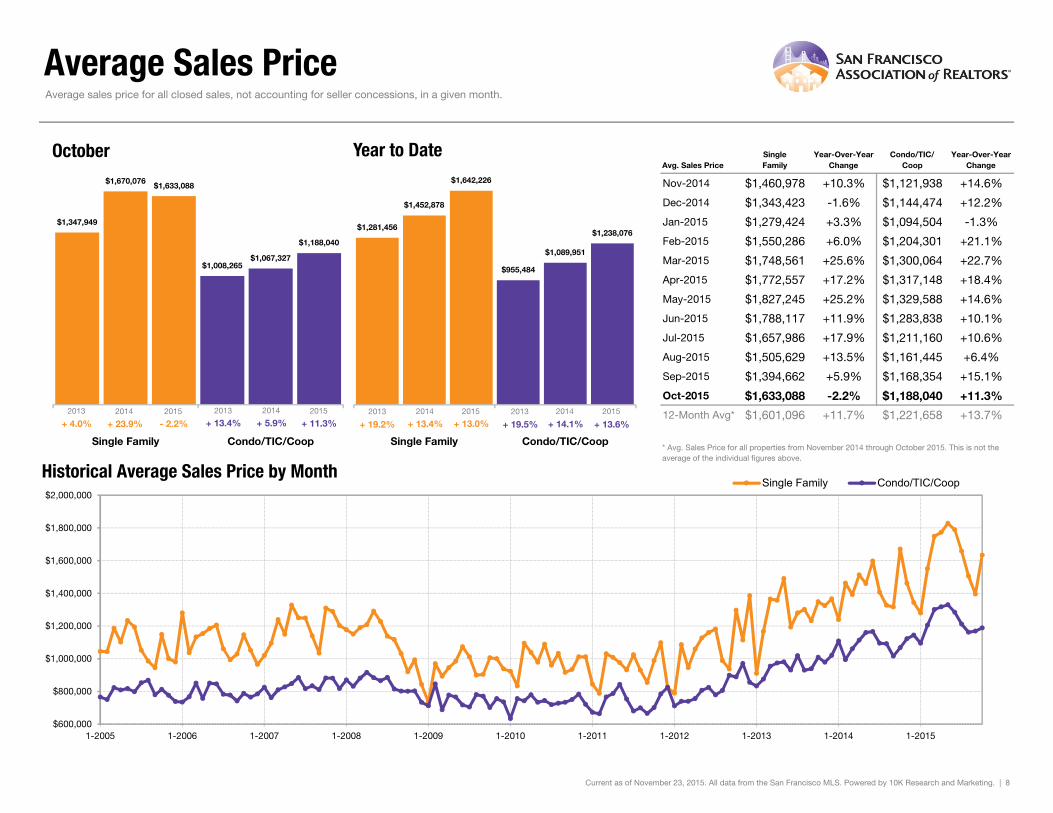
Nov-2014 $1,460,978 +10.3% $1,121,938 +14.6%
Dec-2014 $1,343,423 -1.6% $1,144,474 +12.2%
Jan-2015 $1,279,424 +3.3% $1,094,504 -1.3%
Feb-2015 $1,550,286 +6.0% $1,204,301 +21.1%
Mar-2015 $1,748,561 +25.6% $1,300,064 +22.7%
Apr-2015 $1,772,557 +17.2% $1,317,148 +18.4%
May-2015 $1,827,245 +25.2% $1,329,588 +14.6%
Jun-2015 $1,788,117 +11.9% $1,283,838 +10.1%
Jul-2015 $1,657,986 +17.9% $1,211,160 +10.6%
Aug-2015 $1,505,629 +13.5% $1,161,445 +6.4%
Sep-2015 $1,394,662 +5.9% $1,168,354 +15.1%
Oct-2015 $1,633,088 -2.2% $1,188,040 +11.3%
12-Month Avg* $1,601,096 +11.7% $1,221,658 +13.7%
Historical Average Sales Price by Month
Average sales price for all closed sales, not accounting for seller concessions, in a given month.
* Avg. Sales Price for all properties from November 2014 through October 2015. This is not the average of the individual figures above.
Current as of November 23, 2015. All data from the San Francisco MLS. Powered by 10K Research and Marketing. | 8
$1,347,949
$1,008,265
$1,670,076
$1,067,327
$1,633,088
$1,188,040
Single Family Condo/TIC/Coop
October
$600,000
$800,000
$1,000,000
$1,200,000
$1,400,000
$1,600,000
$1,800,000
$2,000,000
1-2005 1-2006 1-2007 1-2008 1-2009 1-2010 1-2011 1-2012 1-2013 1-2014 1-2015
Single Family Condo/TIC/Coop
$1,281,456
$955,484
$1,452,878
$1,089,951
$1,642,226
$1,238,076
Single Family Condo/TIC/Coop
Year to Date
2013 2014 2015
+ 11.3%+ 5.9%- 2.2%+ 23.9% + 14.1%+ 13.0%+ 13.4% + 13.6%
2013 2014 2015 2013 2014 2015 2013 2014 2015
+ 4.0% + 19.2% + 19.5%+ 13.4%
Days on Market Until Sale
Days on MarketSingleFamily
Year-Over-YearChange
Condo/TIC/Coop
Year-Over-YearChange
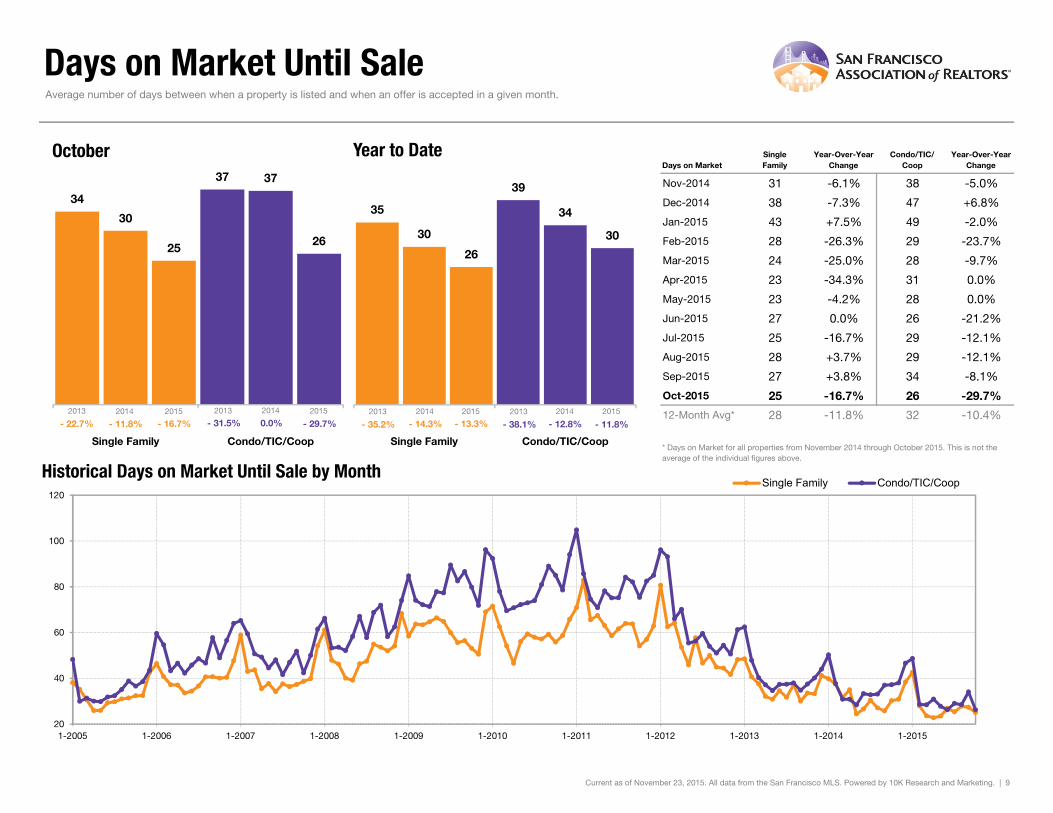
Nov-2014 31 -6.1% 38 -5.0%
Dec-2014 38 -7.3% 47 +6.8%
Jan-2015 43 +7.5% 49 -2.0%
Feb-2015 28 -26.3% 29 -23.7%
Mar-2015 24 -25.0% 28 -9.7%
Apr-2015 23 -34.3% 31 0.0%
May-2015 23 -4.2% 28 0.0%
Jun-2015 27 0.0% 26 -21.2%
Jul-2015 25 -16.7% 29 -12.1%
Aug-2015 28 +3.7% 29 -12.1%
Sep-2015 27 +3.8% 34 -8.1%
Oct-2015 25 -16.7% 26 -29.7%
12-Month Avg* 28 -11.8% 32 -10.4%
Historical Days on Market Until Sale by Month
Average number of days between when a property is listed and when an offer is accepted in a given month.
* Days on Market for all properties from November 2014 through October 2015. This is not the average of the individual figures above.
Current as of November 23, 2015. All data from the San Francisco MLS. Powered by 10K Research and Marketing. | 9
34
37
30
37
25 26
Single Family Condo/TIC/Coop
October
20
40
60
80
100
120
1-2005 1-2006 1-2007 1-2008 1-2009 1-2010 1-2011 1-2012 1-2013 1-2014 1-2015
Single Family Condo/TIC/Coop
35
39
30
34
26
30
Single Family Condo/TIC/Coop
Year to Date
2013 2014 2015
- 29.7%0.0%- 16.7%- 11.8% - 12.8%- 13.3%- 14.3% - 11.8%
2013 2014 2015 2013 2014 2015 2013 2014 2015
- 22.7% - 35.2% - 38.1%- 31.5%
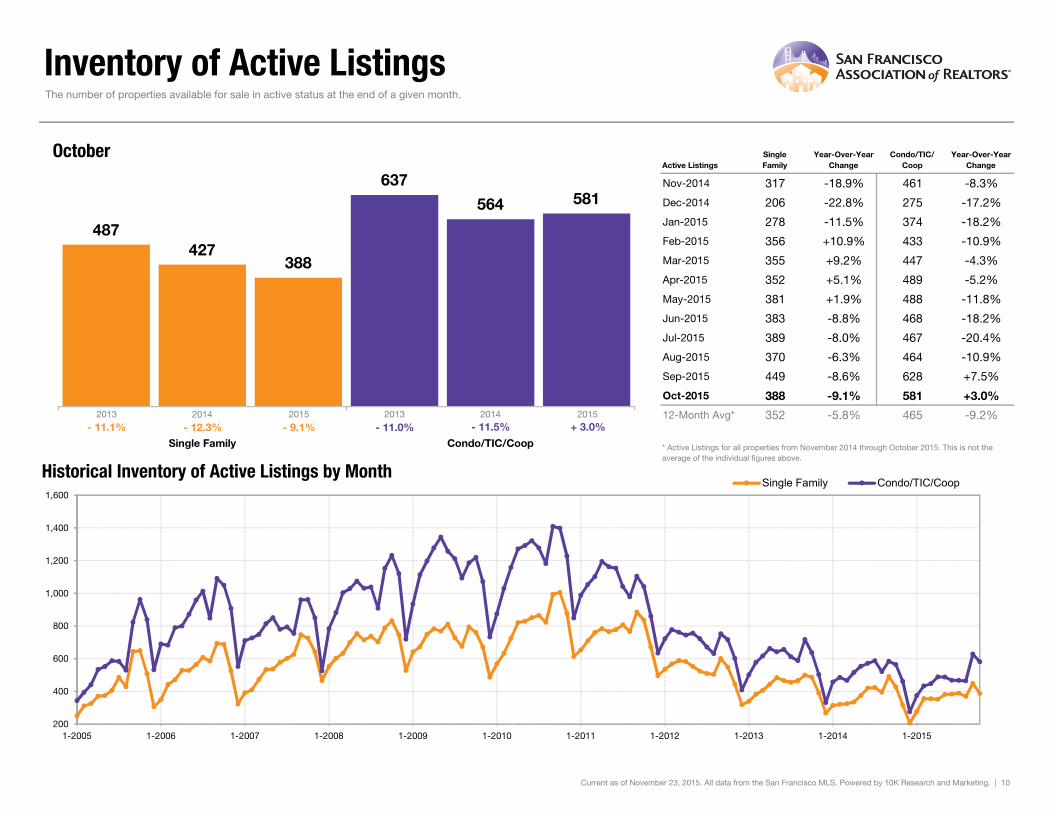
Inventory of Active Listings
Active ListingsSingleFamily
Year-Over-YearChange
Condo/TIC/Coop
Year-Over-YearChange
Nov-2014 317 -18.9% 461 -8.3%
Dec-2014 206 -22.8% 275 -17.2%
Jan-2015 278 -11.5% 374 -18.2%
Feb-2015 356 +10.9% 433 -10.9%
Mar-2015 355 +9.2% 447 -4.3%
Apr-2015 352 +5.1% 489 -5.2%
May-2015 381 +1.9% 488 -11.8%
Jun-2015 383 -8.8% 468 -18.2%
Jul-2015 389 -8.0% 467 -20.4%
Aug-2015 370 -6.3% 464 -10.9%
Sep-2015 449 -8.6% 628 +7.5%
Oct-2015 388 -9.1% 581 +3.0%
12-Month Avg* 352 -5.8% 465 -9.2%
Historical Inventory of Active Listings by Month
The number of properties available for sale in active status at the end of a given month.
* Active Listings for all properties from November 2014 through October 2015. This is not the average of the individual figures above.
Current as of November 23, 2015. All data from the San Francisco MLS. Powered by 10K Research and Marketing. | 10
487
637
427
564
388
581
Single Family Condo/TIC/Coop
October
200
400
600
800
1,000
1,200
1,400
1,600
1-2005 1-2006 1-2007 1-2008 1-2009 1-2010 1-2011 1-2012 1-2013 1-2014 1-2015
Single Family Condo/TIC/Coop
2013 2014 2015+ 3.0%- 11.5%- 9.1%- 12.3%
2013 2014 2015
- 11.1% - 11.0%
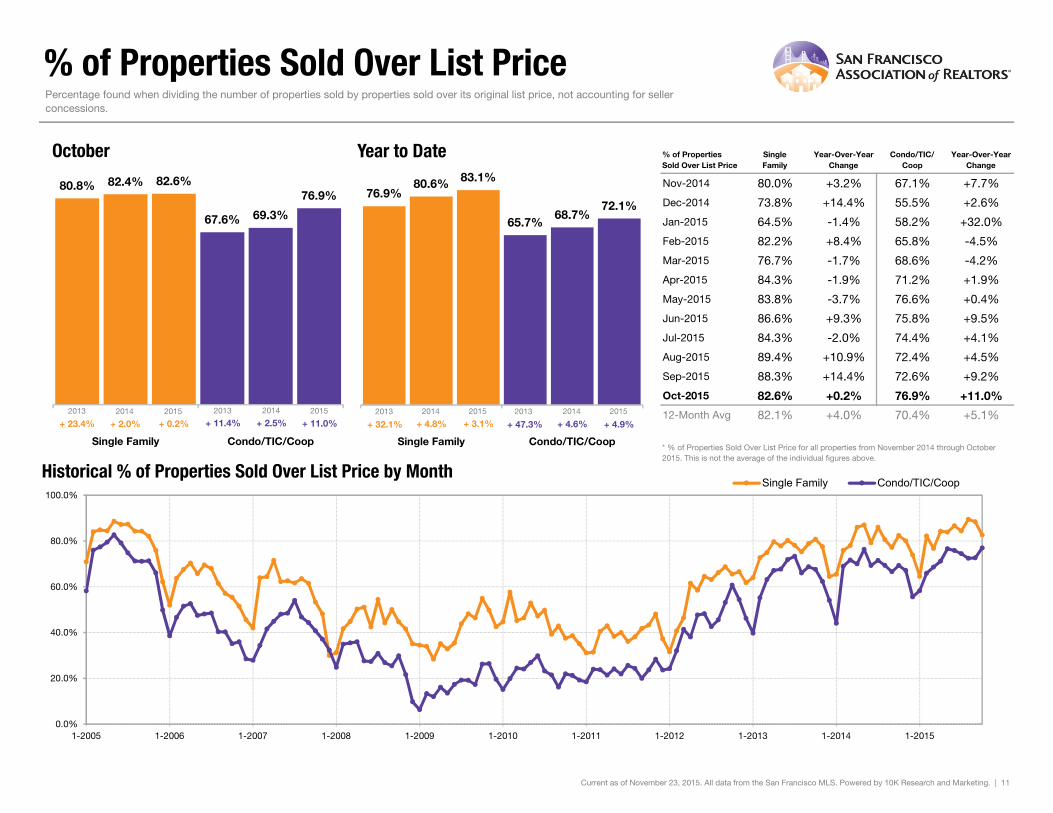
% of Properties Sold Over List Price
% of Properties Sold Over List Price
SingleFamily
Year-Over-YearChange
Condo/TIC/Coop
Year-Over-YearChange
Nov-2014 80.0% +3.2% 67.1% +7.7%
Dec-2014 73.8% +14.4% 55.5% +2.6%
Jan-2015 64.5% -1.4% 58.2% +32.0%
Feb-2015 82.2% +8.4% 65.8% -4.5%
Mar-2015 76.7% -1.7% 68.6% -4.2%
Apr-2015 84.3% -1.9% 71.2% +1.9%
May-2015 83.8% -3.7% 76.6% +0.4%
Jun-2015 86.6% +9.3% 75.8% +9.5%
Jul-2015 84.3% -2.0% 74.4% +4.1%
Aug-2015 89.4% +10.9% 72.4% +4.5%
Sep-2015 88.3% +14.4% 72.6% +9.2%
Oct-2015 82.6% +0.2% 76.9% +11.0%
12-Month Avg 82.1% +4.0% 70.4% +5.1%
Historical % of Properties Sold Over List Price by Month
Percentage found when dividing the number of properties sold by properties sold over its original list price, not accounting for seller concessions.
* % of Properties Sold Over List Price for all properties from November 2014 through October 2015. This is not the average of the individual figures above.
Current as of November 23, 2015. All data from the San Francisco MLS. Powered by 10K Research and Marketing. | 11
80.8%
67.6%
82.4%
69.3%
82.6%76.9%
Single Family Condo/TIC/Coop
October
0.0%
20.0%
40.0%
60.0%
80.0%
100.0%
1-2005 1-2006 1-2007 1-2008 1-2009 1-2010 1-2011 1-2012 1-2013 1-2014 1-2015
Single Family Condo/TIC/Coop
76.9%
65.7%
80.6%
68.7%
83.1%
72.1%
Single Family Condo/TIC/Coop
Year to Date
2013 2014 2015
+ 11.0%+ 2.5%+ 0.2%+ 2.0% + 4.6%+ 3.1%+ 4.8% + 4.9%
2013 2014 2015 2013 2014 2015 2013 2014 2015
+ 23.4% + 32.1% + 47.3%+ 11.4%
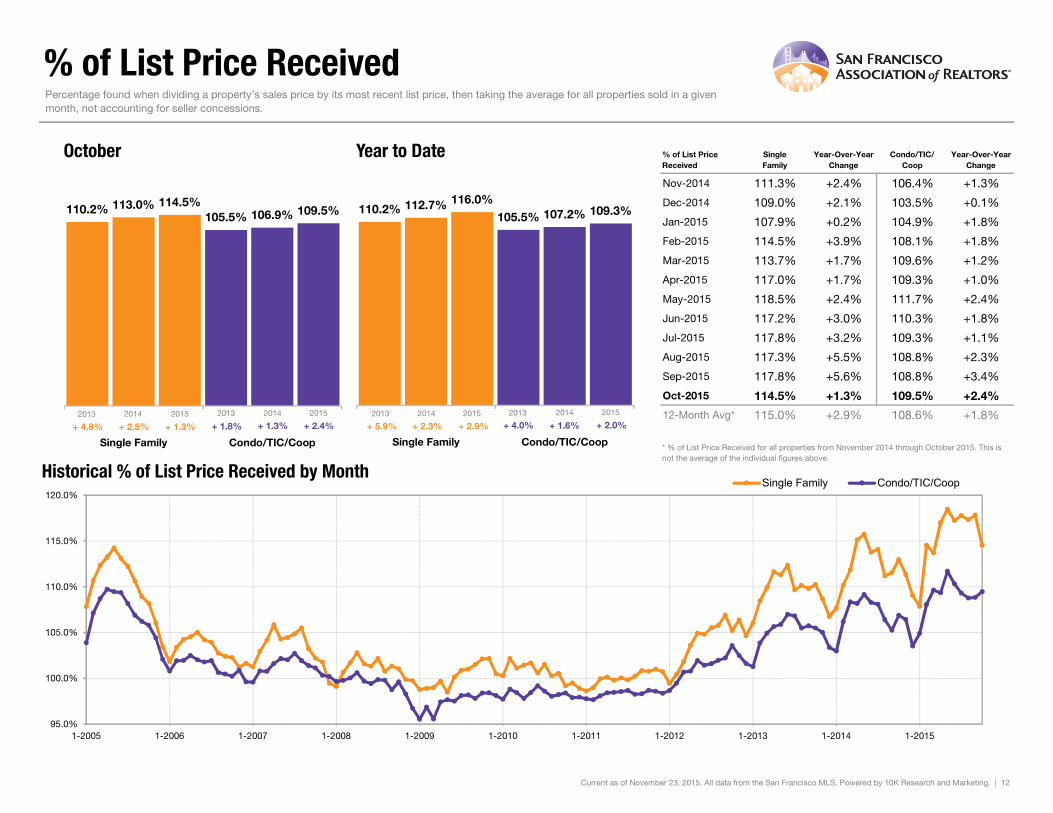
% of List Price Received
% of List Price Received
SingleFamily
Year-Over-YearChange
Condo/TIC/Coop
Year-Over-YearChange
Nov-2014 111.3% +2.4% 106.4% +1.3%
Dec-2014 109.0% +2.1% 103.5% +0.1%
Jan-2015 107.9% +0.2% 104.9% +1.8%
Feb-2015 114.5% +3.9% 108.1% +1.8%
Mar-2015 113.7% +1.7% 109.6% +1.2%
Apr-2015 117.0% +1.7% 109.3% +1.0%
May-2015 118.5% +2.4% 111.7% +2.4%
Jun-2015 117.2% +3.0% 110.3% +1.8%
Jul-2015 117.8% +3.2% 109.3% +1.1%
Aug-2015 117.3% +5.5% 108.8% +2.3%
Sep-2015 117.8% +5.6% 108.8% +3.4%
Oct-2015 114.5% +1.3% 109.5% +2.4%
12-Month Avg* 115.0% +2.9% 108.6% +1.8%
Historical % of List Price Received by Month
Percentage found when dividing a property’s sales price by its most recent list price, then taking the average for all properties sold in a given month, not accounting for seller concessions.
* % of List Price Received for all properties from November 2014 through October 2015. This is not the average of the individual figures above.
Current as of November 23, 2015. All data from the San Francisco MLS. Powered by 10K Research and Marketing. | 12
110.2%105.5%
113.0%106.9%
114.5%109.5%
Single Family Condo/TIC/Coop
October
110.2%105.5%
112.7%107.2%
116.0%109.3%
Single Family Condo/TIC/Coop
Year to Date
95.0%
100.0%
105.0%
110.0%
115.0%
120.0%
1-2005 1-2006 1-2007 1-2008 1-2009 1-2010 1-2011 1-2012 1-2013 1-2014 1-2015
Single Family Condo/TIC/Coop
2013 2014 2015
+ 2.4%+ 1.3%+ 1.3%+ 2.5%
2013 2014 2015
+ 4.8% + 1.8%2013 2014 2015
+ 2.0%+ 1.6%+ 2.9%+ 2.3%
2013 2014 2015
+ 5.9% + 4.0%
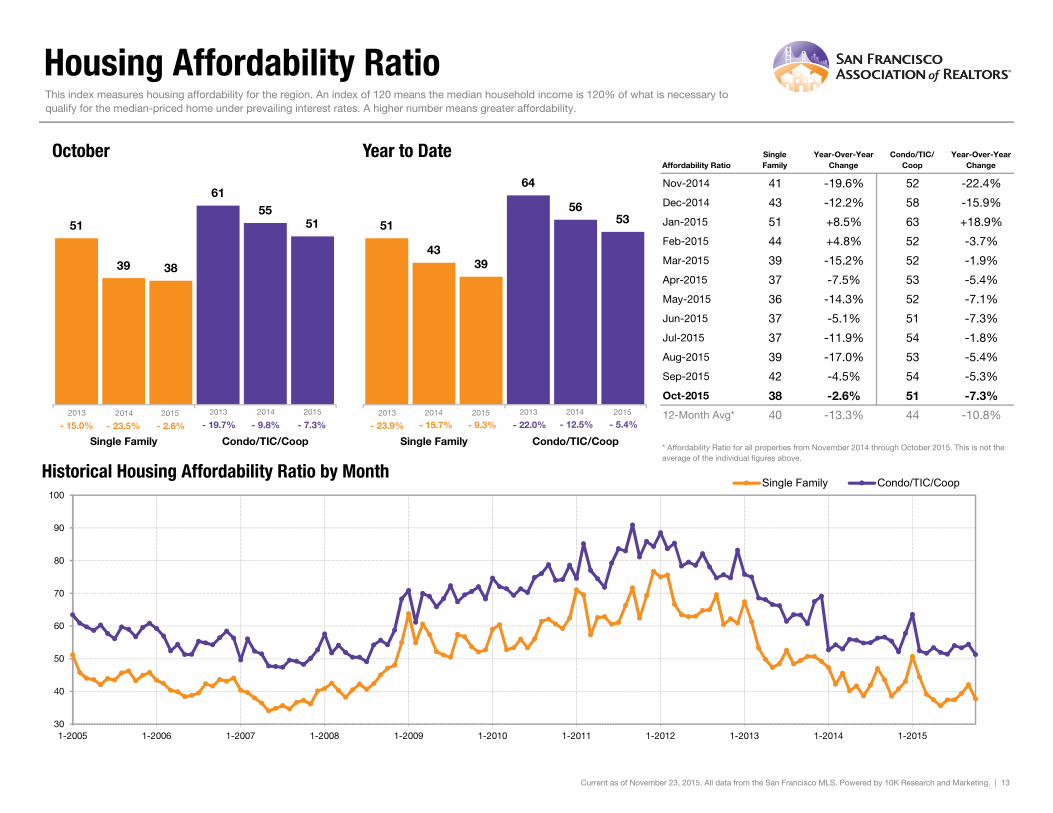
Housing Affordability Ratio
Affordability RatioSingleFamily
Year-Over-YearChange
Condo/TIC/Coop
Year-Over-YearChange
Nov-2014 41 -19.6% 52 -22.4%
Dec-2014 43 -12.2% 58 -15.9%
Jan-2015 51 +8.5% 63 +18.9%
Feb-2015 44 +4.8% 52 -3.7%
Mar-2015 39 -15.2% 52 -1.9%
Apr-2015 37 -7.5% 53 -5.4%
May-2015 36 -14.3% 52 -7.1%
Jun-2015 37 -5.1% 51 -7.3%
Jul-2015 37 -11.9% 54 -1.8%
Aug-2015 39 -17.0% 53 -5.4%
Sep-2015 42 -4.5% 54 -5.3%
Oct-2015 38 -2.6% 51 -7.3%
12-Month Avg* 40 -13.3% 44 -10.8%
Historical Housing Affordability Ratio by Month
This index measures housing affordability for the region. An index of 120 means the median household income is 120% of what is necessary to qualify for the median-priced home under prevailing interest rates. A higher number means greater affordability.
* Affordability Ratio for all properties from November 2014 through October 2015. This is not the average of the individual figures above.
Current as of November 23, 2015. All data from the San Francisco MLS. Powered by 10K Research and Marketing. | 13
51
61
39
55
38
51
Single Family Condo/TIC/Coop
October
30
40
50
60
70
80
90
100
1-2005 1-2006 1-2007 1-2008 1-2009 1-2010 1-2011 1-2012 1-2013 1-2014 1-2015
Single Family Condo/TIC/Coop
2013 2014 2015
- 7.3%- 9.8%- 2.6%- 23.5%
2013 2014 2015
- 15.0% - 19.7%
51
64
43
56
39
53
Single Family Condo/TIC/Coop
Year to Date
2013 2014 2015
- 5.4%- 12.5%- 9.3%- 15.7%2013 2014 2015
- 23.9% - 22.0%
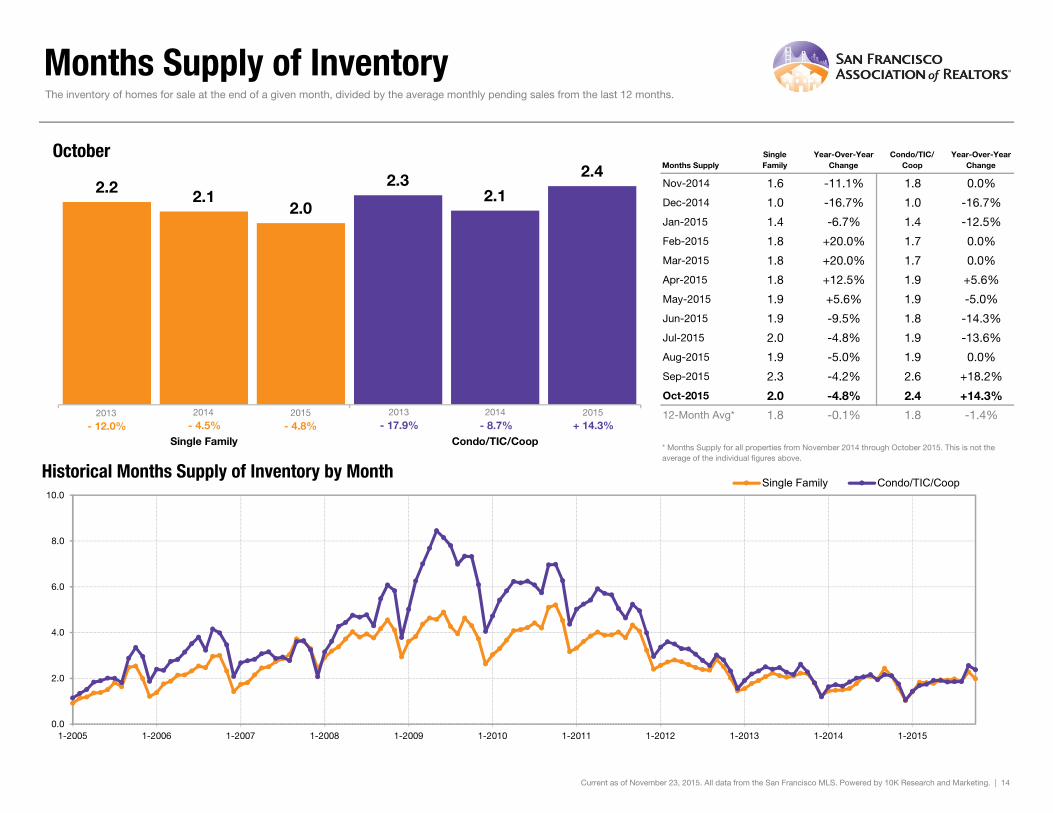
Months Supply of Inventory
Months SupplySingleFamily
Year-Over-YearChange
Condo/TIC/Coop
Year-Over-YearChange
Nov-2014 1.6 -11.1% 1.8 0.0%
Dec-2014 1.0 -16.7% 1.0 -16.7%
Jan-2015 1.4 -6.7% 1.4 -12.5%
Feb-2015 1.8 +20.0% 1.7 0.0%
Mar-2015 1.8 +20.0% 1.7 0.0%
Apr-2015 1.8 +12.5% 1.9 +5.6%
May-2015 1.9 +5.6% 1.9 -5.0%
Jun-2015 1.9 -9.5% 1.8 -14.3%
Jul-2015 2.0 -4.8% 1.9 -13.6%
Aug-2015 1.9 -5.0% 1.9 0.0%
Sep-2015 2.3 -4.2% 2.6 +18.2%
Oct-2015 2.0 -4.8% 2.4 +14.3%
12-Month Avg* 1.8 -0.1% 1.8 -1.4%
Historical Months Supply of Inventory by Month
The inventory of homes for sale at the end of a given month, divided by the average monthly pending sales from the last 12 months.
* Months Supply for all properties from November 2014 through October 2015. This is not the average of the individual figures above.
Current as of November 23, 2015. All data from the San Francisco MLS. Powered by 10K Research and Marketing. | 14
2.2 2.32.1 2.1
2.0
2.4
Single Family Condo/TIC/Coop
October
0.0
2.0
4.0
6.0
8.0
10.0
1-2005 1-2006 1-2007 1-2008 1-2009 1-2010 1-2011 1-2012 1-2013 1-2014 1-2015
Single Family Condo/TIC/Coop
2013 2014 2015+ 14.3%- 8.7%- 4.8%- 4.5%
2013 2014 2015
- 12.0% - 17.9%
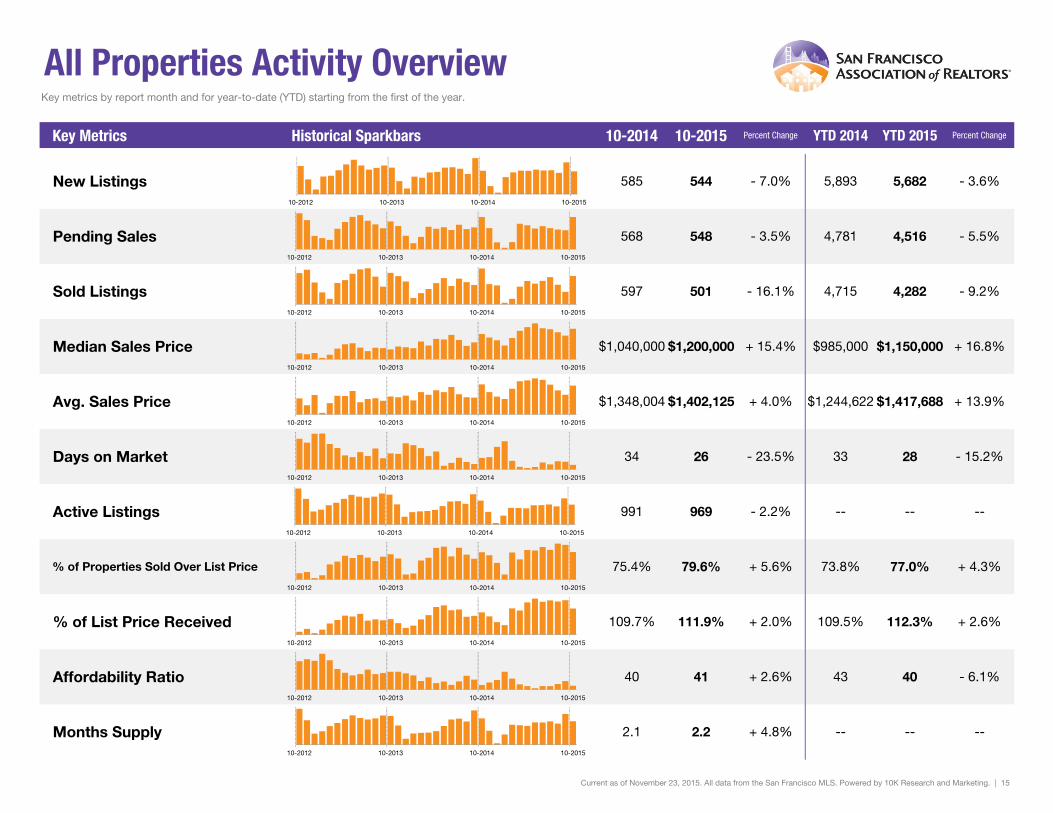
All Properties Activity OverviewKey metrics by report month and for year-to-date (YTD) starting from the first of the year.
Key Metrics Historical Sparkbars 10-2014 10-2015 Percent Change YTD 2014 YTD 2015 Percent Change
Current as of November 23, 2015. All data from the San Francisco MLS. Powered by 10K Research and Marketing. | 15
Months Supply 2.1 2.2 + 4.8% -- -- --
Affordability Ratio 40 41 + 2.6%
% of List Price Received 109.7% 111.9% + 2.0% 109.5%
43
77.0% + 4.3%
+ 2.6%
40 - 6.1%
112.3%
% of Properties Sold Over List Price 75.4% 79.6% + 5.6% 73.8%
Active Listings 991 969 - 2.2% --
Avg. Sales Price $1,348,004 $1,402,125 + 4.0% $1,244,622
Days on Market 34 26 - 23.5% 33
$1,150,000 + 16.8%
+ 13.9%
28 - 15.2%
$1,417,688
-- --
Sold Listings 597 501 - 16.1% 4,715 4,282 - 9.2%
Median Sales Price $1,040,000 $1,200,000 + 15.4% $985,000
- 3.6%
Pending Sales 568 548 - 3.5% 4,781 4,516 - 5.5%
New Listings 585 544 - 7.0% 5,893 5,68210-2012 10-2013 10-2014 10-2015
10-2012 10-2013 10-2014 10-2015
10-2012 10-2013 10-2014 10-2015
10-2012 10-2013 10-2014 10-2015
10-2012 10-2013 10-2014 10-2015
10-2012 10-2013 10-2014 10-2015
10-2012 10-2013 10-2014 10-2015
10-2012 10-2013 10-2014 10-2015
10-2012 10-2013 10-2014 10-2015
10-2012 10-2013 10-2014 10-2015
10-2012 10-2013 10-2014 10-2015
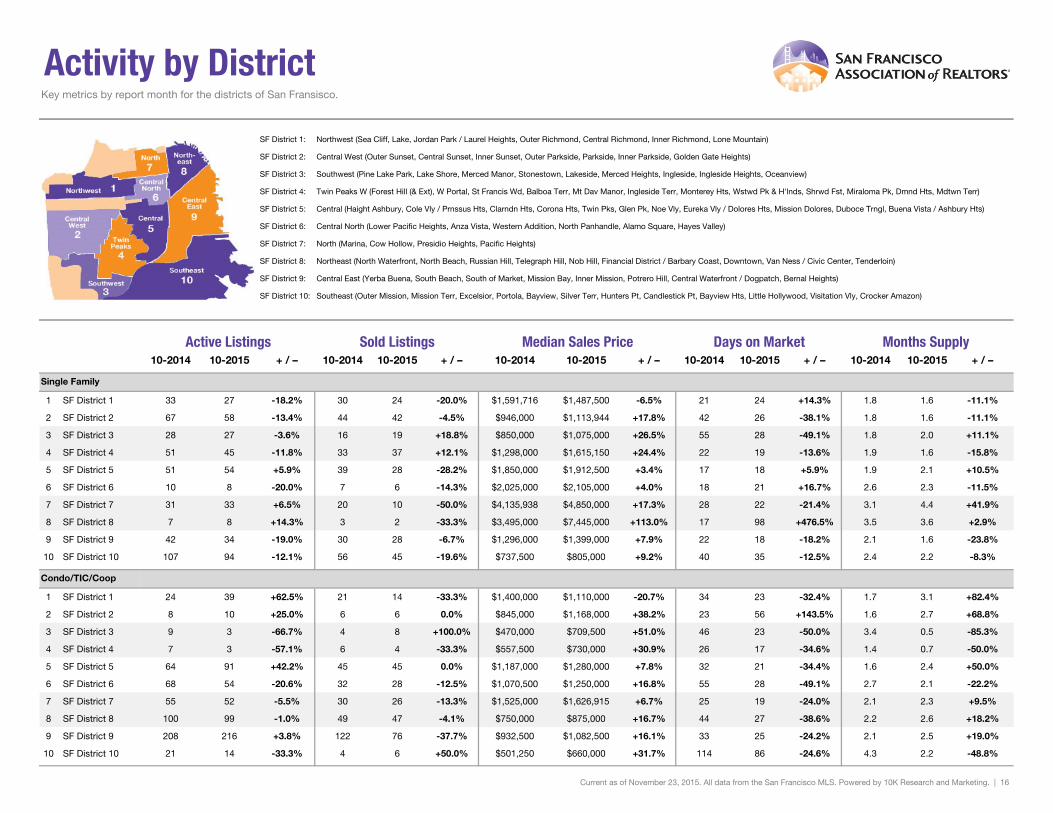
Activity by District
SF District 1: Northwest (Sea Cliff, Lake, Jordan Park / Laurel Heights, Outer Richmond, Central Richmond, Inner Richmond, Lone Mountain)
SF District 2: Central West (Outer Sunset, Central Sunset, Inner Sunset, Outer Parkside, Parkside, Inner Parkside, Golden Gate Heights)
SF District 3: Southwest (Pine Lake Park, Lake Shore, Merced Manor, Stonestown, Lakeside, Merced Heights, Ingleside, Ingleside Heights, Oceanview)
SF District 4: Twin Peaks W (Forest Hill (& Ext), W Portal, St Francis Wd, Balboa Terr, Mt Dav Manor, Ingleside Terr, Monterey Hts, Wstwd Pk & H'lnds, Shrwd Fst, Miraloma Pk, Dmnd Hts, Mdtwn Terr)
SF District 5: Central (Haight Ashbury, Cole Vly / Prnssus Hts, Clarndn Hts, Corona Hts, Twin Pks, Glen Pk, Noe Vly, Eureka Vly / Dolores Hts, Mission Dolores, Duboce Trngl, Buena Vista / Ashbury Hts)
SF District 6: Central North (Lower Pacific Heights, Anza Vista, Western Addition, North Panhandle, Alamo Square, Hayes Valley)
SF District 7: North (Marina, Cow Hollow, Presidio Heights, Pacific Heights)
SF District 8: Northeast (North Waterfront, North Beach, Russian Hill, Telegraph Hill, Nob Hill, Financial District / Barbary Coast, Downtown, Van Ness / Civic Center, Tenderloin)
SF District 9: Central East (Yerba Buena, South Beach, South of Market, Mission Bay, Inner Mission, Potrero Hill, Central Waterfront / Dogpatch, Bernal Heights)
SF District 10: Southeast (Outer Mission, Mission Terr, Excelsior, Portola, Bayview, Silver Terr, Hunters Pt, Candlestick Pt, Bayview Hts, Little Hollywood, Visitation Vly, Crocker Amazon)
10-2014 10-2015 + / – 10-2014 10-2015 + / – 10-2014 10-2015 + / – 10-2014 10-2015 + / – 10-2014 10-2015 + / –
Single Family
1 SF District 1 33 27 -18.2% 30 24 -20.0% $1,591,716 $1,487,500 -6.5% 21 24 +14.3% 1.8 1.6 -11.1%
2 SF District 2 67 58 -13.4% 44 42 -4.5% $946,000 $1,113,944 +17.8% 42 26 -38.1% 1.8 1.6 -11.1%
3 SF District 3 28 27 -3.6% 16 19 +18.8% $850,000 $1,075,000 +26.5% 55 28 -49.1% 1.8 2.0 +11.1%
4 SF District 4 51 45 -11.8% 33 37 +12.1% $1,298,000 $1,615,150 +24.4% 22 19 -13.6% 1.9 1.6 -15.8%
5 SF District 5 51 54 +5.9% 39 28 -28.2% $1,850,000 $1,912,500 +3.4% 17 18 +5.9% 1.9 2.1 +10.5%
6 SF District 6 10 8 -20.0% 7 6 -14.3% $2,025,000 $2,105,000 +4.0% 18 21 +16.7% 2.6 2.3 -11.5%
7 SF District 7 31 33 +6.5% 20 10 -50.0% $4,135,938 $4,850,000 +17.3% 28 22 -21.4% 3.1 4.4 +41.9%
8 SF District 8 7 8 +14.3% 3 2 -33.3% $3,495,000 $7,445,000 +113.0% 17 98 +476.5% 3.5 3.6 +2.9%
9 SF District 9 42 34 -19.0% 30 28 -6.7% $1,296,000 $1,399,000 +7.9% 22 18 -18.2% 2.1 1.6 -23.8%
10 SF District 10 107 94 -12.1% 56 45 -19.6% $737,500 $805,000 +9.2% 40 35 -12.5% 2.4 2.2 -8.3%
Condo/TIC/Coop
1 SF District 1 24 39 +62.5% 21 14 -33.3% $1,400,000 $1,110,000 -20.7% 34 23 -32.4% 1.7 3.1 +82.4%
2 SF District 2 8 10 +25.0% 6 6 0.0% $845,000 $1,168,000 +38.2% 23 56 +143.5% 1.6 2.7 +68.8%
3 SF District 3 9 3 -66.7% 4 8 +100.0% $470,000 $709,500 +51.0% 46 23 -50.0% 3.4 0.5 -85.3%
4 SF District 4 7 3 -57.1% 6 4 -33.3% $557,500 $730,000 +30.9% 26 17 -34.6% 1.4 0.7 -50.0%
5 SF District 5 64 91 +42.2% 45 45 0.0% $1,187,000 $1,280,000 +7.8% 32 21 -34.4% 1.6 2.4 +50.0%
6 SF District 6 68 54 -20.6% 32 28 -12.5% $1,070,500 $1,250,000 +16.8% 55 28 -49.1% 2.7 2.1 -22.2%
7 SF District 7 55 52 -5.5% 30 26 -13.3% $1,525,000 $1,626,915 +6.7% 25 19 -24.0% 2.1 2.3 +9.5%
8 SF District 8 100 99 -1.0% 49 47 -4.1% $750,000 $875,000 +16.7% 44 27 -38.6% 2.2 2.6 +18.2%
9 SF District 9 208 216 +3.8% 122 76 -37.7% $932,500 $1,082,500 +16.1% 33 25 -24.2% 2.1 2.5 +19.0%
10 SF District 10 21 14 -33.3% 4 6 +50.0% $501,250 $660,000 +31.7% 114 86 -24.6% 4.3 2.2 -48.8%
Key metrics by report month for the districts of San Fransisco.
Current as of November 23, 2015. All data from the San Francisco MLS. Powered by 10K Research and Marketing. | 16
Active Listings Sold Listings Median Sales Price Days on Market Months Supply