san francisco market update | q1 2014
DESCRIPTION
ÂTRANSCRIPT

All data within this document is pulled from the San Francisco MLS.
San Francisco Market UpdateFirst Quarter 2014
San FranciSco Brokerage
117 greenwich Street
San Francisco, ca 94111
t. 415.901.1700
sothebyshomes.com
San Francisco, ca | web: 0086132Photography by Jacob elliott
Source: SFARMLS - January 1-March 31 each year.
Source: SFARMLS - January 1-March 31 each year.
2010 2011 2012 2013 2014
San FranciSco (ToTal) 467 500 535 497 442
DiSTricT 4 58 52 55 64 62
DiSTricT 5 63 66 72 72 69
DiSTricT 6 9 5 10 6 12
DiSTricTS 7 anD 8 25 25 28 23 22
DiSTricT 9 41 43 46 54 37
2010 2011 2012 2013 2014
San FranciSco (ToTal) 486 577 608 633 639
DiSTricT 4 7 12 14 12 15
DiSTricT 5 75 91 84 93 106
DiSTricT 6 42 46 56 65 67
DiSTricTS 7 anD 8 141 160 197 179 178
DiSTricT 9 155 189 174 211 230
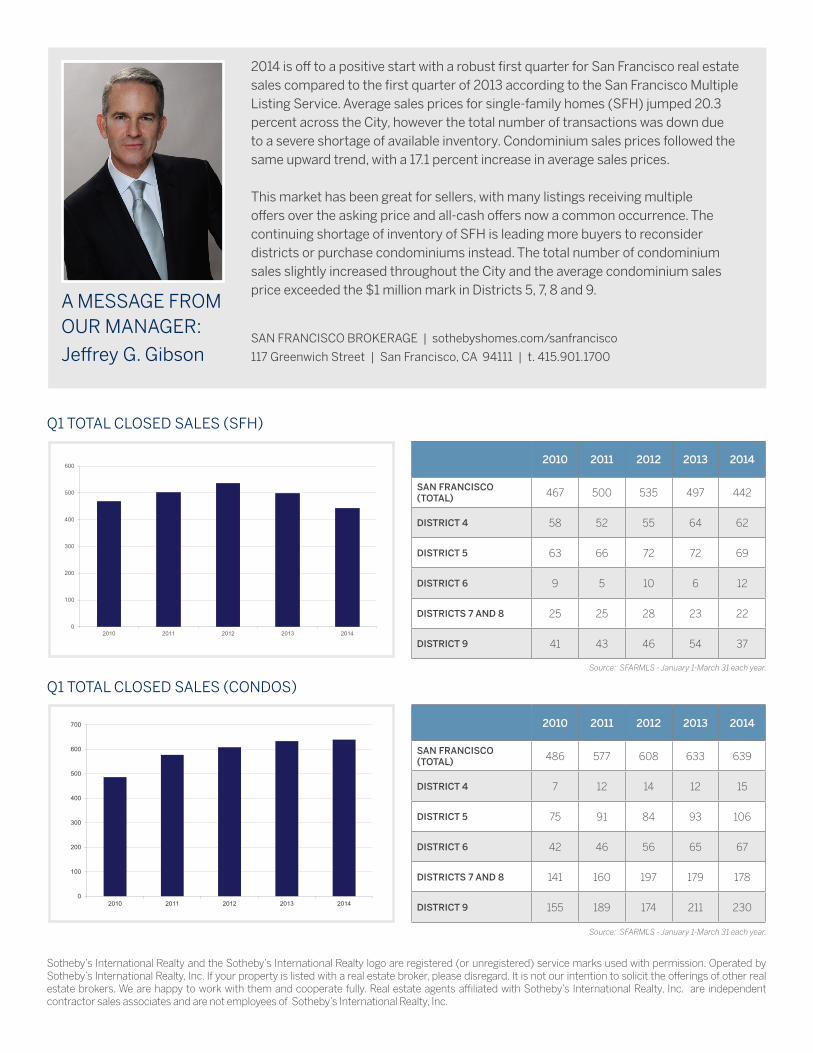
2014 is off to a positive start with a robust first quarter for San Francisco real estate sales compared to the first quarter of 2013 according to the San Francisco Multiple Listing Service. Average sales prices for single-family homes (SFH) jumped 20.3 percent across the City, however the total number of transactions was down due to a severe shortage of available inventory. Condominium sales prices followed the same upward trend, with a 17.1 percent increase in average sales prices.
This market has been great for sellers, with many listings receiving multiple offers over the asking price and all-cash offers now a common occurrence. The continuing shortage of inventory of SFH is leading more buyers to reconsider districts or purchase condominiums instead. The total number of condominium sales slightly increased throughout the City and the average condominium sales price exceeded the $1 million mark in Districts 5, 7, 8 and 9.
SAn FrAnCiSCo BrokerAge | sothebyshomes.com/sanfrancisco
117 greenwich Street | San Francisco, CA 94111 | t. 415.901.1700
q1 ToTAL CLoSeD SALeS (SFH)
q1 ToTAL CLoSeD SALeS (ConDoS)
A MeSSAge FroM oUr MAnAger:
Jeffrey g. gibson
0
100
200
300
400
500
600
2010 2011 2012 2013 2014
0
100
200
300
400
500
600
700
2010 2011 2012 2013 2014
Sotheby’s international realty and the Sotheby’s international realty logo are registered (or unregistered) service marks used with permission. operated by Sotheby’s international realty, inc. if your property is listed with a real estate broker, please disregard. it is not our intention to solicit the offerings of other real estate brokers. We are happy to work with them and cooperate fully. real estate agents affiliated with Sotheby’s international realty, inc. are independent contractor sales associates and are not employees of Sotheby’s international realty, inc.

Telegraph hillWeb iD: 0086505 | $6,250,000
This bespoke, Bay view penthouse
features rare finishes, 3bd/3.5ba
and seven terraces.
gregg Lynn | 415.901.1780
Twin peakSWeb iD: 0086657 | $2,195,000
Sleek and sophisticated designer view
flats. 2bd/2ba each, plus view. 1bd
bonus apartment. Decks and 2 car garage.
Thomas Biss | 415.901.1776
pine lake parkWeb iD: 0086605 | $1,350,000
grand scale 4bd/2.5ba home
with sauna, deck and garden.
Approximately 2,933 sq.ft.
grazia Bennett | 415.294.4244
featured properties
4
SINGLE FAMILY HOME SALES
Serving San FranciSco, Marin, the PeninSUla and eaSt Bay sothebyshomes.com/sanfrancisco
average sales price average days on market
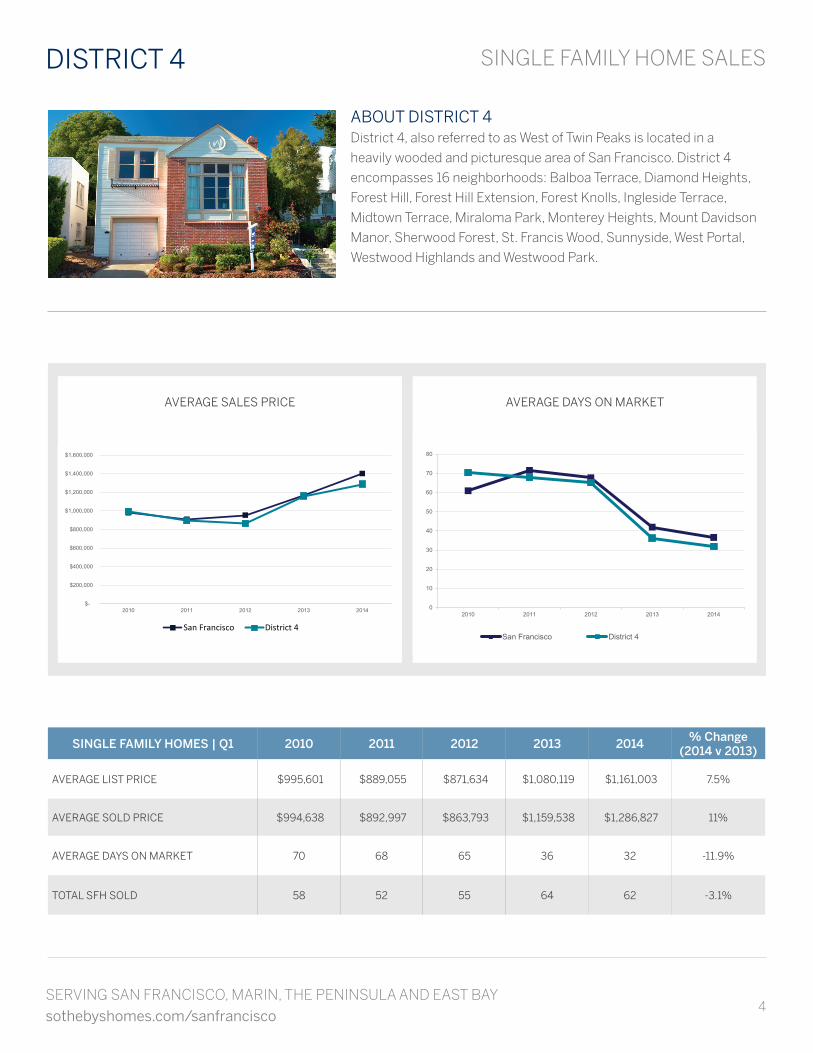
ABoUT DiSTriCT 4 district 4, also referred to as West of twin Peaks is located in a
heavily wooded and picturesque area of San Francisco. district 4
encompasses 16 neighborhoods: Balboa terrace, diamond heights,
Forest hill, Forest hill extension, Forest knolls, ingleside terrace,
Midtown terrace, Miraloma Park, Monterey heights, Mount davidson
Manor, Sherwood Forest, St. Francis Wood, Sunnyside, West Portal,
Westwood highlands and Westwood Park.
Single Family homeS | Q1 2010 2011 2012 2013 2014 % change(2014 v 2013)
AverAge LiST PriCe $995,601 $889,055 $871,634 $1,080,119 $1,161,003 7.5%
AverAge SoLD PriCe $994,638 $892,997 $863,793 $1,159,538 $1,286,827 11%
AverAge DAyS on MArkeT 70 68 65 36 32 -11.9%
ToTAL SFH SoLD 58 52 55 64 62 -3.1%
DiSTriCT 4
$-
$200,000
$400,000
$600,000
$800,000
$1,000,000
$1,200,000
$1,400,000
$1,600,000
2010 2011 2012 2013 2014
San Francisco District 4
0
10
20
30
40
50
60
70
80
2010 2011 2012 2013 2014
San Francisco District 4

5
CONDOMINIUM SALES
average sales price average days on market
q1 MArkeT overvieW average sales prices in district 4 continued to climb in the first quarter of 2014, compared to first quarter of 2013.
the average sales price of SFh increased by 11 percent, from $1,159,538 to $1,286,827. condominium sales prices
increased by 22.4 percent and the average price per square foot jumped 25.4 percent, from $458.30 to $574.87. the
total number of closed SFh sales declined by three percent, from 64 sold units in 2013 to 62 units in 2014. the total
number of closed condominium sales increased from 12 sold units in 2013 to 15 units in 2014. the average days on
market dropped markedly for both SFh and condominiums - SFh saw a 11.9 percent decline and condominiums saw a
56.2 percent decrease.
conDominiumS | Q1 2010 2011 2012 2013 2014 % change(2014 v 2013)
AverAge LiST PriCe $505,979 $385,862 $419,236 $485,490 $595,733 22.7%
AverAge SoLD PriCe $490,000 $376,587 $408,539 $509,606 $623,933 22.4%
AverAge DAyS on MArkeT 80 75 104 69 30 -56.2%
ToTAL ConDoS SoLD 7 12 14 12 15 25%
DiSTriCT 4
$-
$200,000
$400,000
$600,000
$800,000
$1,000,000
$1,200,000
2010 2011 2012 2013 2014
San Francisco District 4
0
20
40
60
80
100
120
2010 2011 2012 2013 2014
San Francisco District 4

6
SINGLE FAMILY HOME SALES
Serving San FranciSco, Marin, the PeninSUla and eaSt Bay sothebyshomes.com/sanfrancisco
average sales price average days on market
DiSTriCT 5
ABoUT DiSTriCT 5 district 5, commonly known as the central district, is in the
geographic center of San Francisco. the sunny region, with its charm
and vitality, is popular with both tourists and residents. the district
is home to the neighborhoods of ashbury heights, Buena vista Park,
clarendon heights, corona heights, cole valley, castro, dolores
heights, duboce triangle, glen Park, haight ashbury, noe valley, twin
Peaks and Mission dolores.
Single Family homeS | Q1 2010 2011 2012 2013 2014 % change(2014 v 2013)
AverAge LiST PriCe $1,432,318 $1,481,464 $1,560,067 $1,735,429 $2,074,696 19.6%
AverAge SoLD PriCe $1,429,519 $1,445,359 $1,572,205 $1,807,085 $2,278,874 26.1%
AverAge DAyS on MArkeT 60 66 64 39 27 -31.9%
ToTAL SFH SoLD 63 66 72 72 69 -4.2%
$-
$500,000
$1,000,000
$1,500,000
$2,000,000
$2,500,000
2010 2011 2012 2013 2014
San Francisco District 5
0
10
20
30
40
50
60
70
80
2010 2011 2012 2013 2014
San Francisco District 5
7
CONDOMINIUM SALES
average sales price average days on market
DiSTriCT 5
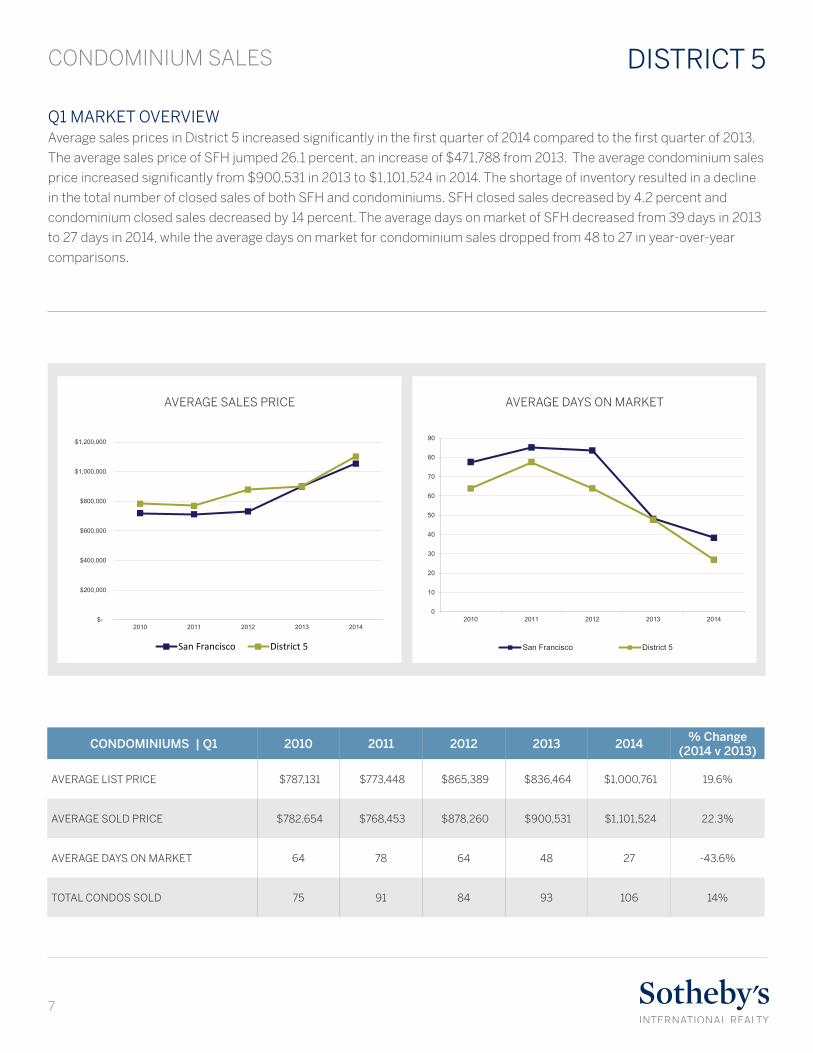
q1 MArkeT overvieW average sales prices in district 5 increased significantly in the first quarter of 2014 compared to the first quarter of 2013.
the average sales price of SFh jumped 26.1 percent, an increase of $471,788 from 2013. the average condominium sales
price increased significantly from $900,531 in 2013 to $1,101,524 in 2014. the shortage of inventory resulted in a decline
in the total number of closed sales of both SFh and condominiums. SFh closed sales decreased by 4.2 percent and
condominium closed sales decreased by 14 percent. the average days on market of SFh decreased from 39 days in 2013
to 27 days in 2014, while the average days on market for condominium sales dropped from 48 to 27 in year-over-year
comparisons.
conDominiumS | Q1 2010 2011 2012 2013 2014 % change(2014 v 2013)
AverAge LiST PriCe $787,131 $773,448 $865,389 $836,464 $1,000,761 19.6%
AverAge SoLD PriCe $782,654 $768,453 $878,260 $900,531 $1,101,524 22.3%
AverAge DAyS on MArkeT 64 78 64 48 27 -43.6%
ToTAL ConDoS SoLD 75 91 84 93 106 14%
$-
$200,000
$400,000
$600,000
$800,000
$1,000,000
$1,200,000
2010 2011 2012 2013 2014
San Francisco District 5
0
10
20
30
40
50
60
70
80
90
2010 2011 2012 2013 2014
San Francisco District 5
8
SINGLE FAMILY HOME SALES
Serving San FranciSco, Marin, the PeninSUla and eaSt Bay sothebyshomes.com/sanfrancisco
average sales price average days on market
DiSTriCT 6
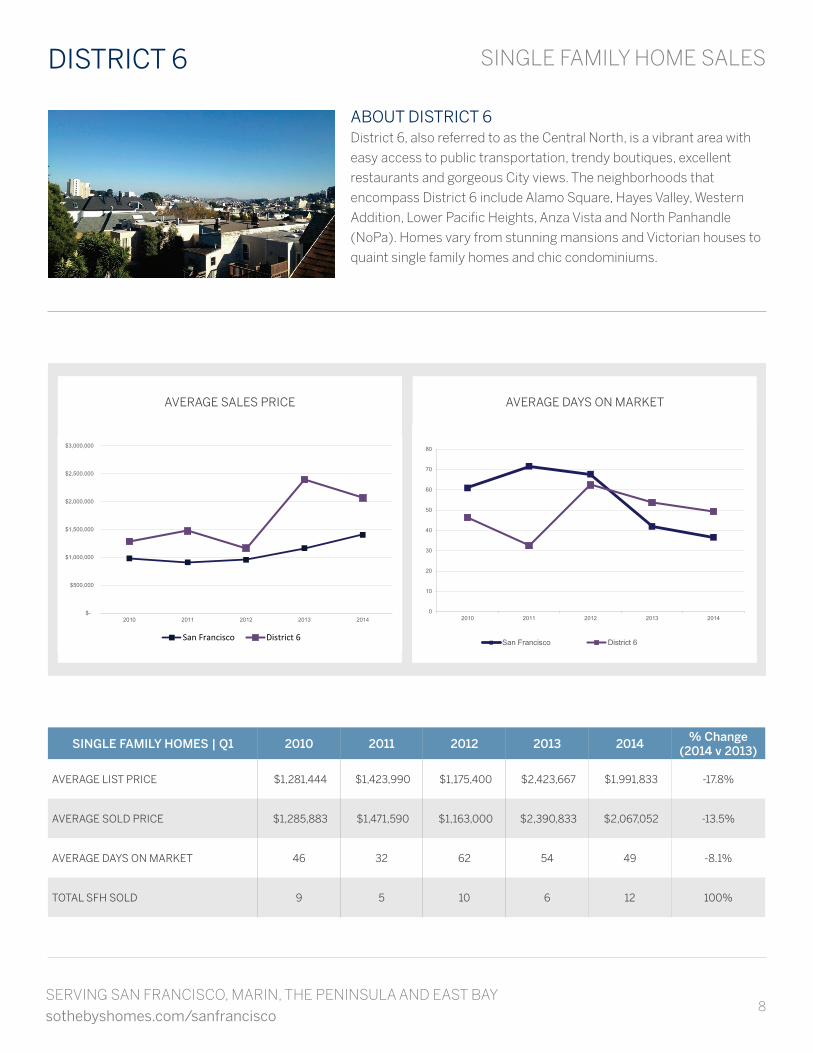
ABoUT DiSTriCT 6 district 6, also referred to as the central north, is a vibrant area with
easy access to public transportation, trendy boutiques, excellent
restaurants and gorgeous city views. the neighborhoods that
encompass district 6 include alamo Square, hayes valley, Western
addition, lower Pacific heights, anza vista and north Panhandle
(noPa). homes vary from stunning mansions and victorian houses to
quaint single family homes and chic condominiums.
Single Family homeS | Q1 2010 2011 2012 2013 2014 % change(2014 v 2013)
AverAge LiST PriCe $1,281,444 $1,423,990 $1,175,400 $2,423,667 $1,991,833 -17.8%
AverAge SoLD PriCe $1,285,883 $1,471,590 $1,163,000 $2,390,833 $2,067,052 -13.5%
AverAge DAyS on MArkeT 46 32 62 54 49 -8.1%
ToTAL SFH SoLD 9 5 10 6 12 100%
$-
$500,000
$1,000,000
$1,500,000
$2,000,000
$2,500,000
$3,000,000
2010 2011 2012 2013 2014
San Francisco District 6
0
10
20
30
40
50
60
70
80
2010 2011 2012 2013 2014
San Francisco District 6

9
CONDOMINIUM SALES
average sales price average days on market
DiSTriCT 6
q1 MArkeT overvieW SFh in district 6 saw a drop in the average sales price, while condominiums continued to see an increase in average sales
prices in the first quarter of 2014. the average sales price of SFh decreased by 13.5 percent, from $2,390,833 in 2013 to
$2,067,052 in 2014. average sales prices of condominiums increased by 16.6 percent, from $735,851 in 2013 to $858,047
in 2014. SFh closed sales increased from 6 sales in 2013 to 12 in 2014, while the number of condominium closed sales
increased from 65 sales in 2013 to 67 in 2014. the average days on market of SFh declined 8.1 percent, from 54 days in
2013 to 49 days in 2014. the average days on market of condominium sales increased from 43 days in 2013 to 51 days in
2014.
conDominiumS | Q1 2010 2011 2012 2013 2014 % change(2014 v 2013)
AverAge LiST PriCe $650,927 $629,539 $669,533 $704,877 $790,714 12.2%
AverAge SoLD PriCe $639,183 $621,228 $667,729 $735,851 $858,047 16.6%
AverAge DAyS on MArkeT 72 95 80 43 51 19.2%
ToTAL ConDoS SoLD 42 46 56 65 67 3.1%
$-
$200,000
$400,000
$600,000
$800,000
$1,000,000
$1,200,000
2010 2011 2012 2013 2014
San Francisco District 6
0
10
20
30
40
50
60
70
80
90
100
2010 2011 2012 2013 2014
San Francisco District 6
10
SINGLE FAMILY HOME SALES
Serving San FranciSco, Marin, the PeninSUla and eaSt Bay sothebyshomes.com/sanfrancisco
average sales price average days on market
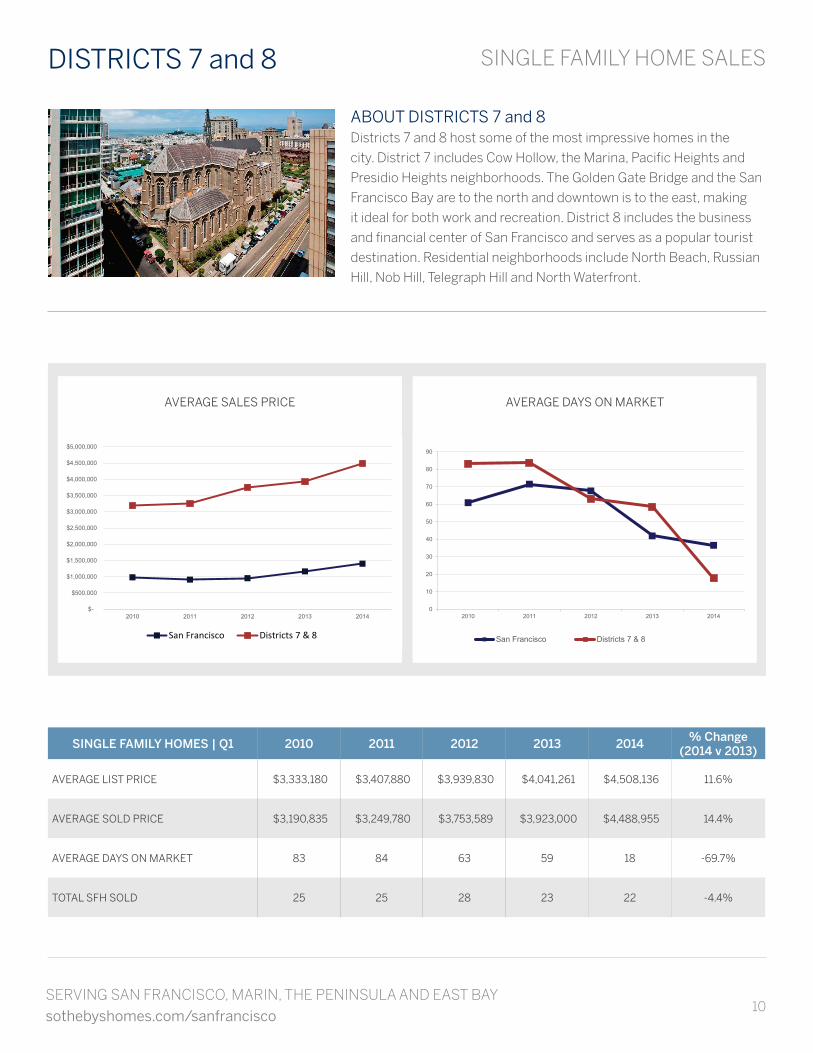
DiSTriCTS 7 and 8
ABoUT DiSTriCTS 7 and 8 districts 7 and 8 host some of the most impressive homes in the
city. district 7 includes cow hollow, the Marina, Pacific heights and
Presidio heights neighborhoods. the golden gate Bridge and the San
Francisco Bay are to the north and downtown is to the east, making
it ideal for both work and recreation. district 8 includes the business
and financial center of San Francisco and serves as a popular tourist
destination. residential neighborhoods include north Beach, russian
hill, nob hill, telegraph hill and north Waterfront.
Single Family homeS | Q1 2010 2011 2012 2013 2014 % change(2014 v 2013)
AverAge LiST PriCe $3,333,180 $3,407,880 $3,939,830 $4,041,261 $4,508,136 11.6%
AverAge SoLD PriCe $3,190,835 $3,249,780 $3,753,589 $3,923,000 $4,488,955 14.4%
AverAge DAyS on MArkeT 83 84 63 59 18 -69.7%
ToTAL SFH SoLD 25 25 28 23 22 -4.4%
$-
$500,000
$1,000,000
$1,500,000
$2,000,000
$2,500,000
$3,000,000
$3,500,000
$4,000,000
$4,500,000
$5,000,000
2010 2011 2012 2013 2014
San Francisco Districts 7 & 8
0
10
20
30
40
50
60
70
80
90
2010 2011 2012 2013 2014
San Francisco Districts 7 & 8

11
CONDOMINIUM SALES
average sales price average days on market
DiSTriCTS 7 and 8
q1 MArkeT overvieW SFh and condominiums in districts 7 and 8 continued to see an increase in average sales prices in the first quarter of
2014. the average sales price of SFh increased by 14.4 percent and average condominium sales prices increased by 17.5
percent. the number of closed sales of SFh decreased by 4.3 percent, while the number of closed sales of condominiums
was flat. the average days on market dropped significantly for both single-family homes and condominiums. SFh saw a
69.7 percent drop in days on market in 2014, from 59 days in 2013 to 18 in 2014. the average days on market decreased
by 19 percent for condominiums, from 52 days in 2013 to 43 days in 2014.
conDominiumS | Q1 2010 2011 2012 2013 2014 % change(2014 v 2013)
AverAge LiST PriCe $911,263 $905,495 $868,097 $1,059,758 $1,228,917 16%
AverAge SoLD PriCe $891,328 $869,126 $860,665 $1,075,525 $1,264,086 17.5%
AverAge DAyS on MArkeT 81 92 87 52 43 -19%
ToTAL ConDoS SoLD 141 160 197 179 178 -0.6%
$-
$200,000
$400,000
$600,000
$800,000
$1,000,000
$1,200,000
$1,400,000
2010 2011 2012 2013 2014
San Francisco Districts 7 & 8
0
10
20
30
40
50
60
70
80
90
100
2010 2011 2012 2013 2014
San Francisco Districts 7 & 8
12
SINGLE FAMILY HOME SALES
Serving San FranciSco, Marin, the PeninSUla and eaSt Bay sothebyshomes.com/sanfrancisco
average sales price average days on market
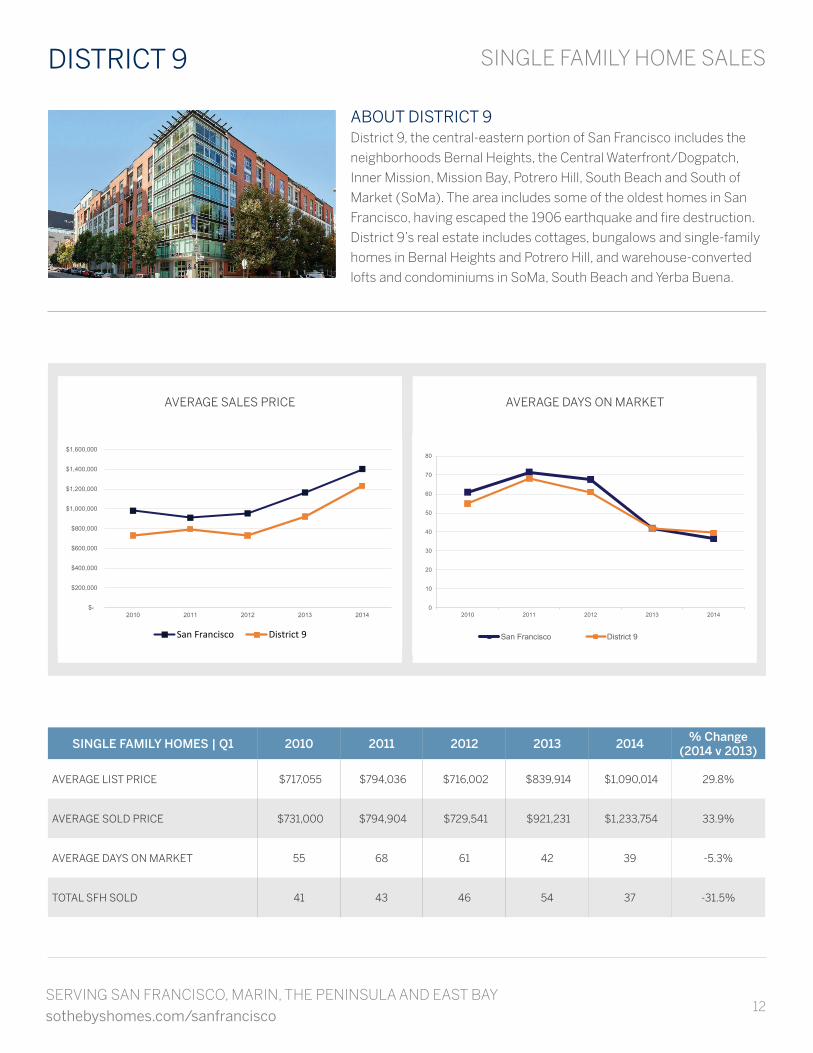
DiSTriCT 9
ABoUT DiSTriCT 9 district 9, the central-eastern portion of San Francisco includes the
neighborhoods Bernal heights, the central Waterfront/dogpatch,
inner Mission, Mission Bay, Potrero hill, South Beach and South of
Market (SoMa). the area includes some of the oldest homes in San
Francisco, having escaped the 1906 earthquake and fire destruction.
district 9’s real estate includes cottages, bungalows and single-family
homes in Bernal heights and Potrero hill, and warehouse-converted
lofts and condominiums in SoMa, South Beach and yerba Buena.
Single Family homeS | Q1 2010 2011 2012 2013 2014 % change(2014 v 2013)
AverAge LiST PriCe $717,055 $794,036 $716,002 $839,914 $1,090,014 29.8%
AverAge SoLD PriCe $731,000 $794,904 $729,541 $921,231 $1,233,754 33.9%
AverAge DAyS on MArkeT 55 68 61 42 39 -5.3%
ToTAL SFH SoLD 41 43 46 54 37 -31.5%
0
10
20
30
40
50
60
70
80
2010 2011 2012 2013 2014
San Francisco District 9
$-
$200,000
$400,000
$600,000
$800,000
$1,000,000
$1,200,000
$1,400,000
$1,600,000
2010 2011 2012 2013 2014
San Francisco District 9

13
CONDOMINIUM SALES
average sales price average days on market
DiSTriCT 9
q1 MArkeT overvieW condominiums in district 9 experienced positive market trends in the first quarter of 2014, with increases in both sales
prices and closed sales. SFh in district 9 saw a 33.9 percent jump in the average sales price, from $921,231 in 2013
to $1,233,754 in 2014. the average sales price of condominiums increased by 9.6 percent, from $912,895 in 2013 to
$1,000,487 in 2014. the number of SFh closed sales decreased by 31.5 percent and the number of condominium closed
sales increased by nine percent. the average days on market of SFh dropped 5.3 percent - from 42 days in 2013 to 39 in
2014. the average days on market of condominiums declined by 22 percent in year-over-year comparisons- from 43 days
in 2013 to 34 in 2014.
conDominiumS | Q1 2010 2011 2012 2013 2014 % change(2014 v 2013)
AverAge LiST PriCe $656,688 $724,349 $669,966 $897,367 $958,438 6.8%
AverAge SoLD PriCe $635,711 $697,434 $663,727 $912,895 $1,000,487 9.6%
AverAge DAyS on MArkeT 87 83 82 43 34 -22%
ToTAL ConDoS SoLD 155 189 174 211 230 9%
$-
$200,000
$400,000
$600,000
$800,000
$1,000,000
$1,200,000
2010 2011 2012 2013 2014
San Francisco District 9
0
10
20
30
40
50
60
70
80
90
100
2010 2011 2012 2013 2014
San Francisco District 9
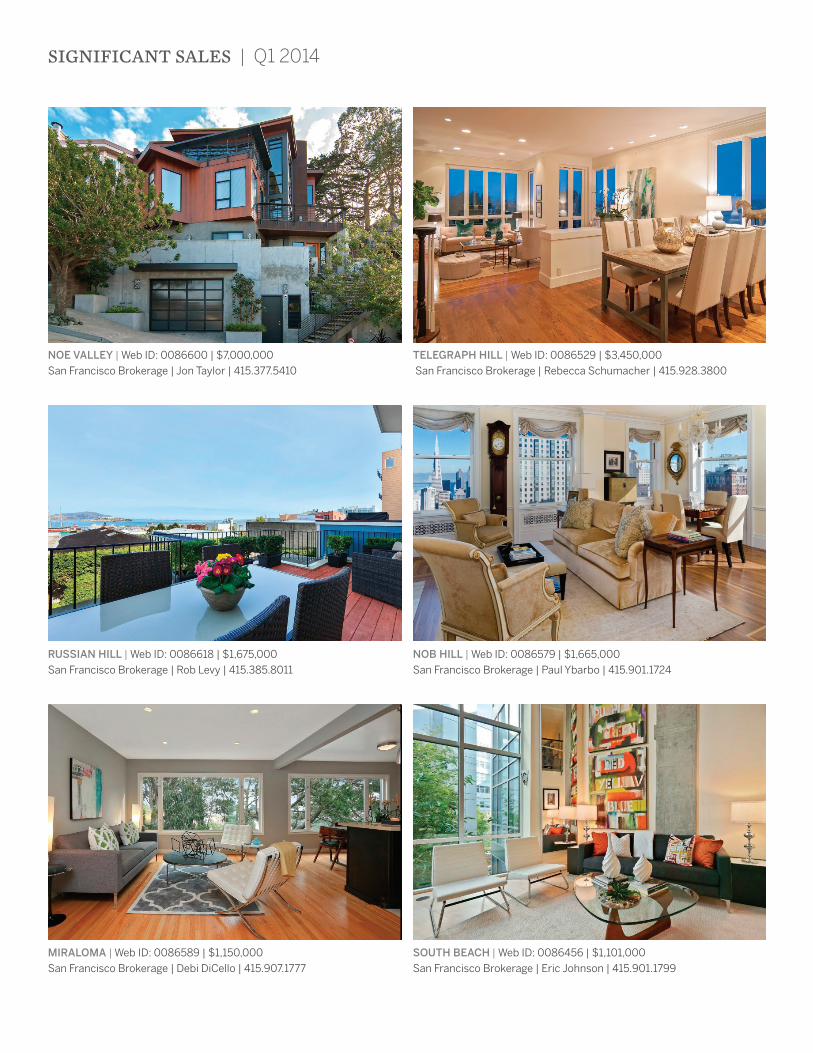
siGNifiCaNt saLes | Q1 2014
noe valley | Web iD: 0086600 | $7,000,000San Francisco Brokerage | Jon Taylor | 415.377.5410
Telegraph hill | Web iD: 0086529 | $3,450,000 San Francisco Brokerage | rebecca Schumacher | 415.928.3800
ruSSian hill | Web iD: 0086618 | $1,675,000San Francisco Brokerage | rob Levy | 415.385.8011
nob hill | Web iD: 0086579 | $1,665,000San Francisco Brokerage | Paul ybarbo | 415.901.1724
miraloma | Web iD: 0086589 | $1,150,000San Francisco Brokerage | Debi DiCello | 415.907.1777
SouTh beach | Web iD: 0086456 | $1,101,000San Francisco Brokerage | eric Johnson | 415.901.1799

Auction & Exhibition Calendar 2014
© M
MX
IV S
OT
HE
BY
’S IN
TE
RN
ATIO
NA
L R
EA
LTY
AFF
ILIA
TES
LLC
. ALL
RIG
HTS
RES
ER
VE
D. S
OT
HE
BY
’S IN
TE
RN
ATIO
NA
L R
EA
LTY
® IS
A R
EGIS
TE
RE
D T
RA
DE
MA
RK
LIC
EN
SE
D T
O
SO
TH
EB
Y’S
INT
ER
NAT
ION
AL
RE
ALT
Y A
FFIL
IAT
ES L
LC. A
N E
QU
AL
OP
PO
RT
UN
ITY
CO
MPA
NY.
EQ
UA
L H
OU
SIN
G O
PP
OR
TU
NIT
Y. E
AC
H O
FFIC
E IS
IND
EP
EN
DE
NT
LY O
WN
ED
AN
D O
PE
RAT
ED
.
Shown Above Left: WILLARD LEROY METCALF (1858 – 1925)A SEASIDE PASTURESIGNED W L METCALF (LOWER LEFT)OIL ON CANVASPAINTED IN 1910.26 BY 29 INCHES (66 BY 73.7 CM) AMERICAN PAINTINGS, DRAWINGS & SCULPTURE NEW YORK 16 APRIL 2014
NEW YORK APRIL 1 A Modern Library: The Gordon Waldorf
Collection 1 John James Audubon: The Birds of America,
The Viviparous Quadrupeds of North America 1 The Inventive Eye: Photographs from a
Private Collection 2 Photographs 8 Important Russian Works of Art, European
Silver, and Vertu 16 American Paintings, Drawings & Sculpture29 Magnificent Jewels
LONDON APRIL 1 Made in Britain 8 The Orientalist Sale 9 Arts of the Islamic World 16 Finest and Rarest Wines 29 Furniture Collections 29 Travel, Atlases, Maps & Natural History 30 Old Master & British Paintings
PARIS APRIL 1 Picasso and the Nude: Fifty Drawings from
the Marina Picasso Collection
We invite you to explore our real estate listings at sothebyshomes.com
and view the worldwide auction schedule at sothebys.com.