sand county foundation
DESCRIPTION
When land does well for its owner, and the owner does well by his land; when both end up better by reason of their partnership, we have conservation. When one or the other grows poorer, we do not. - Aldo Leopold. Sand County Foundation. Agricultural Causes of Nitrogen Runoff. - PowerPoint PPT PresentationTRANSCRIPT

www.sandcounty.net
Sand County FoundationWhen land does well for its owner,
and the owner does well by his land; when both end up better by reason of their partnership, we have conservation.
When one or the other grows poorer, we do not.
- Aldo Leopold

www.sandcounty.net
3 Key Functions Altered Nitrogen Discharge
Shift CropsFrom Forage and Small Grains To Expanded Large Grand Production
Increase Use of Synthetic Nitrogen
Move Water Off Landscape Very Efficiently
Agricultural Causes of Nitrogen Runoff

www.sandcounty.net

www.sandcounty.net

www.sandcounty.net
Nitrogen Application Mississippi Basin

www.sandcounty.net
Wetlands Loss

www.sandcounty.net
Subsurface Agricultural Drainage

www.sandcounty.net
Disconnect Riparian Functions

www.sandcounty.net
Top 10% Nitrogen Contribution
www.sandcounty.net
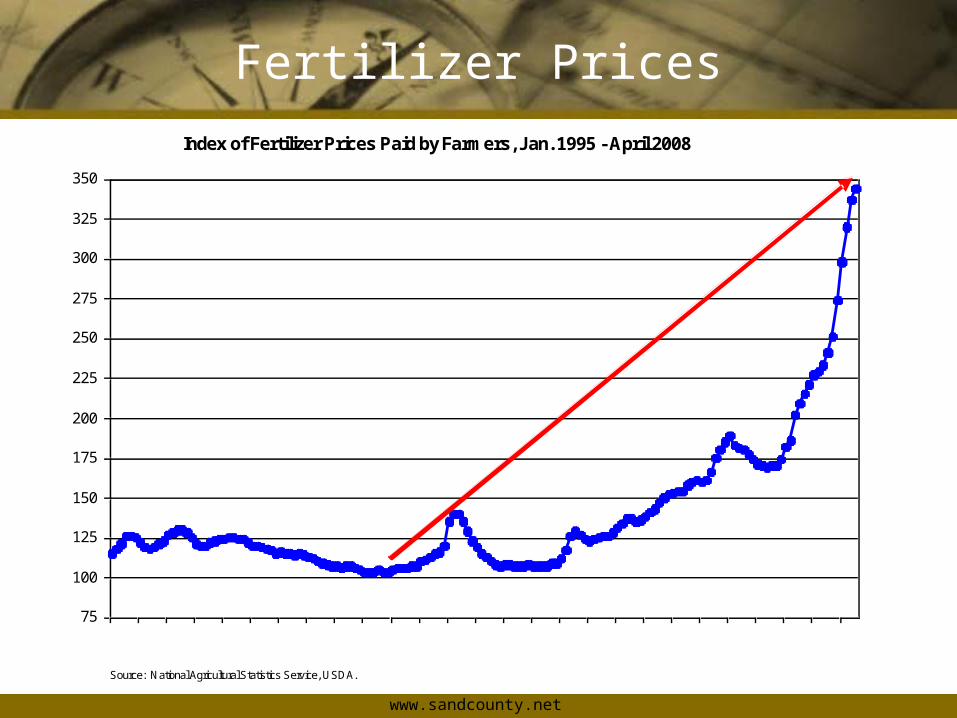
Fertilizer Prices
Index of Fertilizer Prices Paid by Farmers, Jan. 1995 - April 2008
75
100
125
150
175
200
225
250
275
300
325
350
1995July 1996July 1997July 1998July 1999July 2000July 2001July 2002July 2003July 2004July 2005July 2006July 2007July 2008
1990-1992 = 100
Source: National Agricultural Statistics Service, USDA.

www.sandcounty.net
Price of Ag Commodities
Commodity Price Change Corn + 170 % Soybeans + 155 %
Fertilizer + 228 %
April 2008 VS January 2000National Agricultural Statistics Service, USDA

www.sandcounty.net
Overcoming ImpedimentsCreates Performance Data
A Comparative Analysis of the Environmental And Economic Performance of Management Alternatives
In other words• Which practices are most effective at environmental improvement (recognizing location variations)
• What are the costs of various practices• What is the return on investment

www.sandcounty.net
Nitrogen Management PotentialDischarge Reductions
• Agronomic Practices 20 - 30%• Cover Crops 10 - 40%• Drainage Management 20 - 50%• Bioreactors 20 - 40%• Bioreactors w/ Drainage Mgt. 50 - 80%• Wetlands 5 - 60%• Minimize drainage intensity 5 - 35%
(for replacement systems)