sandia national laboratories waste isolation pilot plant ... · summary report of the 2009...
TRANSCRIPT

Information Only
Summary Report of the 2009 Compliance Recertification Application Performance Assessment
Sandia National Laboratories Waste Isolation Pilot Plant
Summary Report of the 2009 Compliance Recertification Application Performance Assessment
Author: __ ~~!!E!~.'!l.!~~~u_ _ _____,:...:.l<:_,.;L.__ _ _-=:h!!t-------::....t...:_-1-;__Print
Author:::c--:-----"'""""-""'-"""""""'-'""'-'-'-"L--"".a.,~....J.I.!:-""''=7-.....,.=---------=-'--:!:...u."'-''--Print
Author:::-:----"'"""-""-""-"'"-...."-'-'~---74--"'-'"--"'C::::P::::._o...:..:==-__:;::::._--;-___ -=-____:=----Print
Author: Ahmed Ismail Print
Author: Tom Kirchner Print
Author:::-:--~~c.!SJ@~fJ_J__,W __ --II:::..Q:>iik::::::;!':::J~~~~----· ~.s~-u.~O~L__ Print Daly /c
Author: MartinNemer(6711) Sjl.:;y'! Print Signature Date I
Technical Review: __ ~urr~~~~~j__!~~~~~~~~~~~---;__~~Lt~~
Print Management Review: Moo Lee (6711)
Print QA Review Mario Chavez (6710)
/----~f'~ ' 1 Signature
ro~c~ ~gnature
WIPP: 1.2.5.:PA:QA-L:547488
1 of76

Information Only
Summary Report of the 2009 CompHance Recertification Application Perfonnance Assessment
CONTENTS
EXECUTIVE SUMMARY ............................................................................................................. 9
1. INTRODUCTION ................................................................................................................. 11 1.1 BACKGROUND ......................................................................................................... 11 1.2 COMPLIANCE CERTIFICATION APPLICATION ................................................. 11 1.3 2004 COMPLIANCE RECERTIFICATION APPLICATION ................................... 11 1.4 OBJECTIVES FOR THE CRA-2009 PA .................................................................... 12
2. UPDATES FROM CRA-2004 PABC TO CRA-2009 PA .................................................... 13 2.1 DURATION OF DIRECT BRINE RELEASES ......................................................... 13 2.2 CPR DEGRADATION RATE .................................................................................... 14 2.3 BRAGFLO CODE IMPROVEMENTS ...................................................................... 14 2.4 ADDITIONAL CHEMISTRY MODELING IN BRAGFLO ..................................... 15 2.5 CAPILLARY PRESSURE AND RELATIVE PERMEABILITY MODEL.. ............. 16 2.6 DBR INPUT PARAMETER CALCULATION .......................................................... 16 2.7 DRILLING RATE ....................................................................................................... 16 2.8 EMPLACEMENT INVENTORY ............................................................................... 17 2.9 HALITE/DISTURBED ROCK ZONE POROSITY .................................................. .18 2.10 FRACTION OF REPOSITORY VOLUME OCCUPIED BY WASTE .................... .19 2.11 INPUT FILE CORRECTIONS .................................................................................... 19
3. CALCULATION METHODOLOGY ................................................................................... 20 3.1 LHS SAMPLING ......................................................................................................... 22 3.2 ACTINIDE MOBILIZATION ..................................................................................... 22 3.3 SALADO FLOW ......................................................................................................... 22 3.4 SALADO TRANSPORT ............................................................................................. 22 3.5 SINGLE INTRUSION DIRECT SOLIDS RELEASE VIA CUTTINGS
AND CA VINGS .......................................................................................................... 23 3.6 SINGLE INTRUSION DIRECT SOLIDS RELEASE (SPALLINGS) ....................... 23 3.7 SINGLE INTRUSION DIRECT BRINE RELEASE .................................................. 24 3.8 CULEBRA FLOW AND TRANSPORT.. ................................................................... 24 3.9 NORMALIZED RELEASES ...................................................................................... 24 3.10 SENSITIVITY ANALYSIS ........................................................................................ 25 3.11 RUN CONTROL ......................................................................................................... 25
4. RESULTS FOR THE UNDISTURBED REPOSITORY ...................................................... 26 4.1 SALADO FLOW ......................................................................................................... 26
4.1.1 Pressure in the Repository .............................................................................. 26 4.1.2 Brine Saturation in the Waste ......................................................................... 29 4.1.3 Brine Flow Out of the Repository .................................................................. 31
4.2 RADIONUCLIDE TRANSPORT ............................................................................... 33 4.2.1 Radionuclide Transport to the Culebra .......................................................... 34 4.2.2 Radionuclide Transport to the LWB .............................................................. 34
2 of76

Information Only
Summary Report of the 2009 Compliance Recertification Application Performance Assessment
5. RESULTS FOR A DISTURBED REPOSITORY ................................................................ 35 5.1 DRILLING SCENARIOS ........................................................................................... 35 5.2 MINING SCENARIOS ............................................................................................... 36 5.3 SALADO FLOW ......................................................................................................... 36
5.3 .1 Pressure in the Repository .............................................................................. 36 5.3 .2 Brine Saturation .............................................................................................. 39 5.3.3 Brine Flow Out of the Repository .................................................................. 42
5.4 RADIO NUCLIDE TRANSPORT .............................................................................. .47 5.4.1 Radionuclide Source Term ............................................................................. 47 5.4.2 Transport through Marker Beds and Shaft ..................................................... 48 5 .4.3 Transport to the Culebra ................................................................................. 49 5 .4.4 Transport through the Culebra ....................................................................... 52
5.5 DIRECT RELEASES .................................................................................................. 54 5 .5.1 Cuttings and Cavings ...................................................................................... 54 5 .5.2 Spallings ......................................................................................................... 55 5 .5.3 Direct Brine .................................................................................................... 58
6. NORMALIZED RELEASES ................................................................................................ 61 6.1 CUTTINGS AND CA VINGS ..................................................................................... 61 6.2 SP ALLINGS ................................................................................................................ 62 6.3 DIRECT BRINE .......................................................................................................... 63 6.4 GROUNDWATER TRANSPORT .............................................................................. 64 6.5 TOTAL ........................................................................................................................ 66
REFEERENCES ............................................................................................................................ 71
3 of76

Information Only
Summary Report of the 2009 Compliance Recertification Application Performance Assessment
TABLES
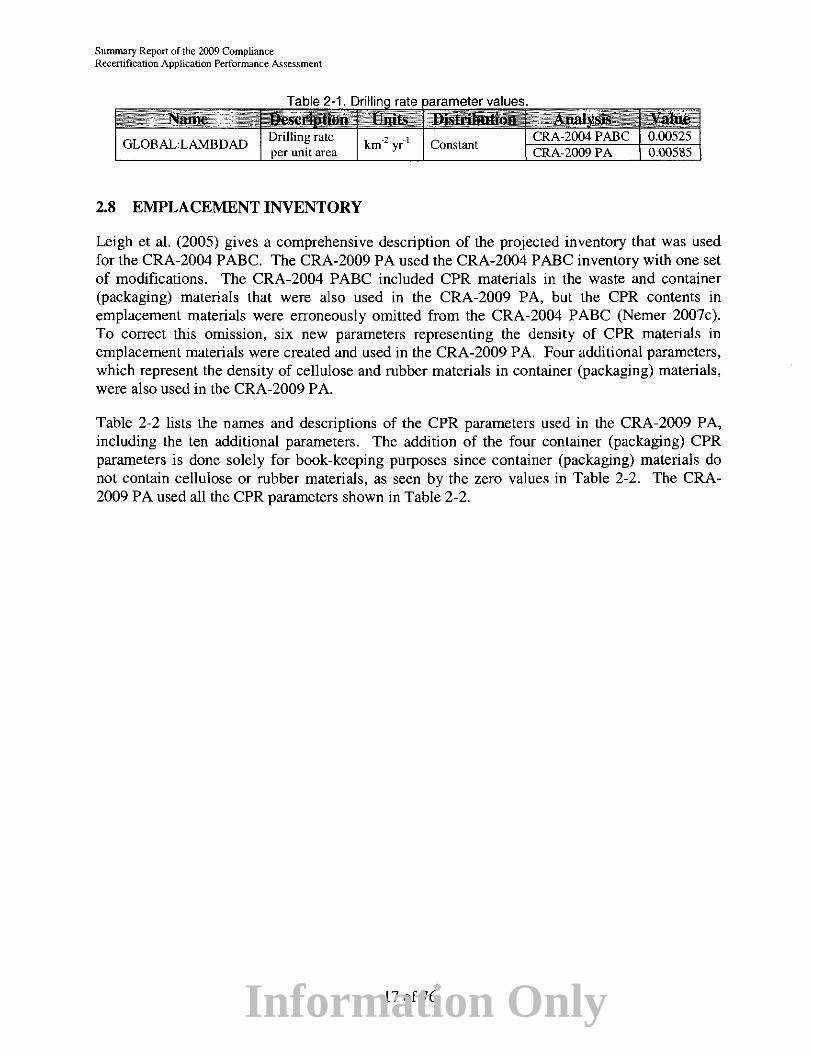
Table 2-l. Drilling rate parameter values ..................................................................................... 17
Table 2-2. Cellulose, plastic and rubber parameters used in the CRA-2009 PA. ......................... 18
Table 2-3. Fraction of repository volume occupied by waste parameter values .......................... 19
Table 5-l. WIPP PA modeling scenarios .................................................................................... 36
Table 5-2. Radionuclide transport to the LWB under partial mining conditions1•2 ................•.... 53
Table 5-3. Radionuclide transport to the LWB under full mining conditions1.2 ......................... 54
Table 5-4. CRA-2009 PA cuttings and cavings area statistics .................................................... 54
Table 5-5. CRA-2009 PA spallings volume statistics ................................................................. 58
Table 5-6. CRA-2009 PA DBR volume statistics ....................................................................... 59
Table 6-1. CRA-2009 PA and CRA-2004 PABC1 statistics on the overall mean for total normalized releases in EPA units at probabilities of 0.1 and 0.001.. ...................... 69
4 of76

Information Only
Sununary Report of the 2009 Compliance Recertification Application Perfonnance Assessment
FIGURES
Figure 3-1. Primary computational models used in the CRA-2009 PA ...................................... 21
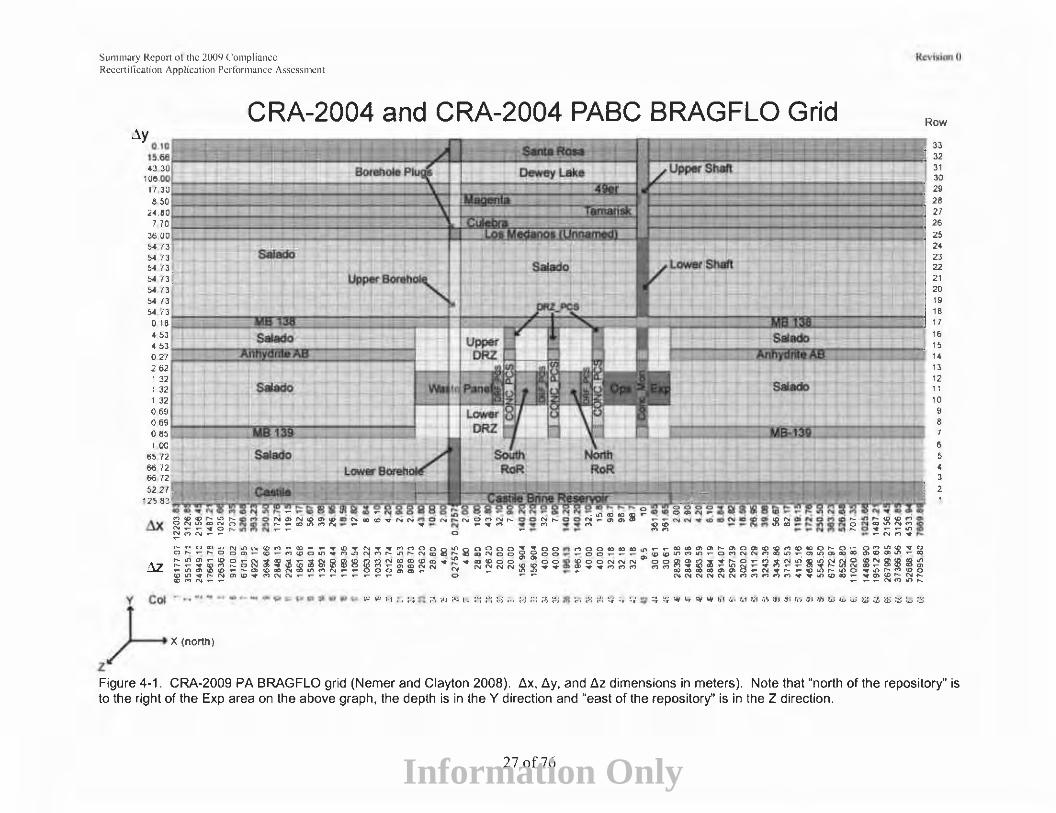
Figure 4-1. CRA-2009 PA BRAGFLO grid (Nemer and Clayton 2008). Llx, fly, and Llz dimensions in meters). Note that "north of the repository" is to the right of the Exp area on the above graph, the depth is in theY direction and "east of the repository" is in the Z direction ......................................................................... 27
Figure 4-2. Pressure in the Waste Panel region, replicate Rl, scenario Sl, CRA-2009 PA ................................................................................................................................ 28
Figure 4-3. Primary Correlations of pressure in the Waste Panel region with uncertain parameters, replicate Rl, scenario Sl, CRA-2009 PA .......................................... 29
Figure 4-4. Brine saturation in the Waste Panel region, replicate Rl, scenario Sl, CRA-2009 PA. ...................................................................................................................... 30
Figure 4-5. Primary correlations of brine saturation in the Waste Panel region with uncertain parameters, replicate Rl, scenario Sl, CRA-2009 PA ................................. 31
Figure 4-6. Brine flow away from the repository, replicate Rl, scenario Sl, CRA-2009PA ................................................................................................................................ 32
Figure 4-7. Brine flow via all MBs across the LWB, replicate Rl, scenario Sl, CRA-2009 PA ....................................................................................................................... 32
Figure 4-8. Primary correlations of total cumulative brine flow away from the repository with uncertain parameters, replicate Rl, scenario S l, CRA-2009 PA ......................................................................................................................................... 33
Figure 5-l. Pressure in the Waste Panel region for replicate Rl, scenario S2, CRA-2009 PA ....................................................................................................................... 37
Figure 5-2. Pressure in the Waste Panel region for replicate Rl, scenario S4, CRA-2009 PA ....................................................................................................................... 37
Figure 5-3. Primary correlations for pressure in the Waste Panel region with uncertain parameters, replicate Rl, scenario S2, CRA-2009 PA .......................................... 38
Figure 5-4. Primary correlations for pressure in the Waste Panel region with uncertain parameters, replicate Rl, scenario S4, CRA-2009 PA .......................................... 39
Figure 5-5. Brine saturation in the Waste Panel region for replicate Rl, scenario S2, CRA-2009 PA ................................................................................................................. 40
5of76

Information Only
Summary Report of the 2009 Compliance Recertification Application Performance Assessment
Figure 5-6. Brine saturation in the Waste Panel region for replicate R1, scenario S4, CRA-2009 PA ................................................................................................................. 40
Figure 5-7. Primary correlations of brine saturation in the Waste Panel region with uncertain parameters, replicate R1, scenario S2, CRA-2009 PA ................................. 41
Figure 5-8. Primary correlations of brine saturation in the Waste Panel region with uncertain parameters, replicate R1, scenario S4, CRA-2009 P A. ................................ 42
Figure 5-9. Total cumulative brine outflow in replicate R1, scenario S2, CRA-2009 PA ................................................................................................................................ 43
Figure 5-10. Brine flow via all MBs across the LWB in replicate R1, scenario S2, CRA-2009 PA ....................................................................................................................... 44
Figure 5-11. Total cumulative brine outflow in replicate R1, scenario S4, CRA-2009 PA ................................................................................................................................ 45
Figure 5-12. Brine flow via all MBs across the LWB in replicate R1, scenario S4, CRA-2009 PA ....................................................................................................................... 45
Figure 5-13. Primary correlations for cumulative brine flow away from repository with uncertain parameters, replicate R1, scenario S2, CRA-2009 PA ................................. 46
Figure 5-14. Primary correlations for cumulative brine flow away from repository with uncertain parameters, replicate Rl, scenario S4, CRA-2009 PA ................................. 46
Figure 5-15. Total mobilized concentrations in Salado brine, replicate R1, CRA-2009 PA. ............................................................................................................................... 48
Figure 5-16. Total mobilized concentrations in Castile brine, replicate R1, CRA-2009 PA ................................................................................................................................ 48
Figure 5-17. Cumulative normalized release to the Culebra, scenario S2, CRA-2009 p A. '' ......... ' .... " ........ ' .......... ' ..... '' ""'' '"''' ""'' '"' '"' ""' ''"'' ""' ..... '' ..... ' ..................... ' ..... 49
Figure 5-18. Cumulative normalized release to the Culebra, scenario S3, CRA-2009 P A ................................................................................................................................ 50
Figure 5-19. Cumulative normalized release to the Culebra, scenario S4, CRA-2009 P A ................................................................................................................................ 50
Figure 5-20. Cumulative normalized release to the Culebra, scenario SS, CRA-2009 P A ................................................................................................................................ 51
Figure 5-21. Cumulative normalized release to the Culebra, replicate R1, scenario S6, CRA-2009 P A ................................................................................................................. 52
6 of76

Information Only
Sununary Report of the 2009 Compliance Recertification Application Performance Assessment
Figure 5-22. Scatter plot of cuttings and cavings areas versus shear strength, CRA-2009 PA ....................................................................................................................... 55
Figure 5-23. Scatter plot of drill string angular velocity versus shear strength, CRA-2009 PA ....................................................................................................................... 56
Figure 5-24. Scatter plot of waste permeability versus spallings volume, CRA-2009 PA ................................................................................................................................ 57
Figure 5-25. Scatter plot of waste particle diameter versus spallings volume, CRA-2009 PA ....................................................................................................................... 57
Figure 5-26. Sensitivity ofDBR volumes to pressure and mobile brine saturation, replicate Rl, scenario S2, Lower panel, CRA-2009 PA. Symbols indicate the range of mobile brine saturation given in the legend ...................................................... 60
Figure 6-1. Overall mean CCDFs for cuttings and cavings releases: CRA-2009 PA and CRA-2004 PABC ..................................................................................................... 62
Figure 6-2. Overall mean CCDFs for spallings releases: CRA-2009 PA and CRA-2004 P ABC. .......................................................................................................................... 63
Figure 6-3. Overall mean CCDFs for DBRs: CRA-2009 PA and CRA-2004 MBC .................................................................................................................................... M
Figure 6-4. Mean CCDF for releases from the Culebra for replicate R2: CRA-2009 PA and CRA-2004 PABC ............................................................................................ 65
Figure 6-5. The preponderance and distribution of zeros can control the regression .............................................................................................................................. 66
Figure 6-6. Total normalized releases, replicates Rl, R2 and R3, CRA-2009 PA. ..................... 67
Figure 6-7. Confidence interval on overall mean CCDF for total normalized releases, CRA-2009 PA ........................................................................................................ 67
Figure 6-8. Mean CCDFs for components of total normalized releases, replicate Rl, CRA-2009 PA ................................................................................................................ 68
Figure 6-9. Mean CCDFs for components of total normalized releases, replicate R2, CRA-2009 PA ................................................................................................................ 68
Figure 6-10. Mean CCDFs for components of total normalized releases, replicate R3, CRA-2009 PA ................................................................................................................ 69
Figure 6-11. Overall mean CCDFs for total normalized releases: CRA-2009 PA and CRA-2004 PABC ........................................................................................................... 70
7 of76

Information Only
Summary Report of the 2009 Compliance Recertification Application Performance Assessment
AP
Am
CAMDAT
CCA
CCDF
CFR
CH
CMS
CPR
CRA
DBR
DCL
DOE
DRZ
EPA
FEP LWA
LWB
MB
MgO
MPa
PA
PABC
PAVT
PRCC
Pu
RH
RoR
SNL TRU
Th
u WIPP
ACRONYMS
Analysis Plan
Americium
Compliance Assessment Methodology Database
Compliance Certification Application
Complementary Cumulative Distribution Function
Code of Federal Regulations
Contact Handled
Code Management System
Cellulose, Plastic, and Rubber
Compliance Recertification Application
Direct Brine Release
Digital Command Language
U.S. Department of Energy
Disturbed Rock Zone
U.S. Environmental Protection Agency
Features, Events, and Processes
Land Withdrawal Act
Land Withdrawal Boundary
Marker Bed
Magnesium Oxide
Megapascal
Performance Assessment
Performance Assessment Baseline Calculation
Performance Assessment Verification Test
Partial Rank Correlation Coefficient
Plutonium
Remote Handled
Rest of Repository
Sandia National Laboratories
Transuranic Waste
Thorium
Uranium
Waste Isolation Pilot Plant
8 of76

Information Only
Summary Report of the 2009 Compliance Recertification Application Performance Assessment
EXECUTIVE SUMMARY
The U.S. Environmental Protection Agency (EPA) determined in 1998 that the Waste Isolation Pilot Plant (WIPP) was in compliance with the Containment Requirements of Title 40 Code of Federal Regulations (CPR) 191.13 (U.S. EPA, 1998). The WIPP Land Withdrawal Act (LWA), Public Law 02-579 as amended by Public Law No. 104-201, requires the U.S. Department of Energy (DOE) to provide the EPA with documentation of continued compliance with the disposal standards within five years of first waste receipt and every five years thereafter. Therefore, the DOE conducted a new performance assessment (PA) for the WIPP which is called the CRA-2004 PA and is documented in U.S. DOE (2004).
During review of U.S. DOE (2004), the EPA required several changes to the PA. These changes were included in a PA, the CRA-2004 Performance Assessment Baseline Calculation (PABC). With the EPA's recertification decision in 2006, the CRA-2004 PABC was established as the PA baseline. Continued review of the CRA-2004 PABC has shown that a number of technical changes and corrections are necessary. Furthermore, updates to parameters and improvements to the PA computer codes have been developed since the recertification decision. To incorporate the changes and updates, a new PA, the 2009 Compliance Recertification Application Performance Assessment (CRA-2009 PA) has been conducted.
The CRA-2009 PA demonstrates that the WIPP continues to comply with the Containment Requirements of 40 CPR § 191.13. Containment Requirements are stringent and state that the DOE must demonstrate a reasonable expectation that the probabilities of cumulative radionuclide releases from the disposal system during the 10,000 years following closure will fall below specified limits. The PA analyses supporting this determination must be quantitative and consider uncertainties caused by all significant processes and events that may affect the disposal system, including future inadvertent human intrusion into the repository. A quantitative PAis conducted using a series of linked computer models in which uncertainties are addressed by a Monte Carlo procedure for sampling selected input parameters.
As required by regulation, results of the PA are displayed as complementary cumulative distribution functions (CCDFs) that display the probability of exceeding various levels of cumulative releases from the disposal system. These CCDFs are calculated using reasonable and, in many cases, conservative conceptual models based on the scientific understanding of the disposal system's behavior. Parameters used in these models are derived from experimental data, field observations, and relevant technical literature.
The overall mean CCDF continues to lie entirely below the specified limits and the WIPP therefore continues to be in compliance with the containment requirements of 40 CPR § Part 191, Subpart B. No releases are predicted to occur at the ground surface in the absence of human intrusion. Sensitivity analysis of results shows that the location of the mean CCDF is dominated by radionuclide releases that could occur on the surface during an inadvertent penetration of the repository by a future drilling operation. Cuttings and cavings still dominate this release. However, the contributions from both spallings and direct brine release have increased compared to the results of the CRA-2004 PABC (Dunagan 2008), with direct brine release the second largest contributor to surface releases. Direct brine releases even surpass cuttings and cavings at
9 of76

Information Only
Summary Report of the 2009 Compliance Recertification Application Performance Assessment
low probabilities. Both spallings and direct brine releases have increased due to the increased pressure in the repository as a result of the increase in the sampled halite porosity. Releases of radionuclides to the accessible environment resulting from transport in groundwater through the shaft seal systems and the subsurface geology are negligible, with or without human intrusion, and make no contribution to the location of the mean CCDF. The natural and engineered barrier systems of the WIPP provide robust and effective containment of transuranic (TRU) waste even if the repository is penetrated by multiple boreholes.
10 of76
Information Only
Summary Report of the 2009 Compliance Recertification Application Performance Assessment
1. INTRODUCTION
1.1 BACKGROUND
The Waste Isolation Pilot Plant (WIPP) is located in southeastern New Mexico and has been developed by the U.S. Department of Energy (DOE) for the geologic (deep underground) disposal of transuranic (TRU) waste (U.S. DOE 1980; 1990; 1993). In 1992, Congress designated the U.S. Environmental Protection Agency (EPA) as the regulator for the WIPP site, and mandated that once DOE demonstrated to EPA's satisfaction that WIPP complied with Title 40 of the Code of Federal Regulations (CFR), Part 191 (U.S. DOE 1996; U.S. EPA 1996), EPA would certify the repository. To show compliance with the containment regulations, the DOE had their scientific advisor, Sandia National Laboratories (SNL), develop a computational modeling system to estimate the future performance of the repository for 10,000 years after closure. SNL has developed a system, called WIPP Performance Assessment (PA), which examines potential release scenarios, quantifies their likelihoods, and estimates potential releases to the surface or the site boundary. The regulation also requires that these models be maintained and updated with new information as part of a recertification process that occurs at five-year intervals after the first waste is received at the site.
1.2 COMPLIANCE CERTIFICATION APPLICATION
To demonstrate compliance with the disposal regulation, the DOE submitted the Compliance Certification Application (CCA) to the EPA, in October 1996, which included the results of the WIPP PA system. During the review of the CCA, the EPA requested an additional Performance Assessment Verification Test (PAVT), which revised selected CCA inputs to the PA (SNL 1997). The PAVT analysis ran the full suite of WIPP PA codes and confirmed the conclusions of the CCA analysis that the repository design met the regulations. Following the receipt of the PA VT analysis, EPA ruled in May 1998 that WIPP had met the regulations for permanent disposal of transuranic waste. The first shipment of radioactive waste from the nation's nuclear weapons complex arrived at the WIPP site in late March 1999, starting the five-year clock for the site's required recertification. The results of CCA PA analyses were subsequently summarized in a SNL report (Helton et al. 1998).
1.3 2004 COMPLIANCE RECERTIFICATION APPLICATION
The 2004 Compliance Recertification Application (CRA-2004) was submitted to the EPA by the DOE in March 2004 (U.S. DOE 2004). During its review of the CRA-2004, the EPA requested additional information (Cotsworth 2004a; 2004b; 2004c; 2004d; Gitlin 2005). The DOE and SNL responded to the EPA in writing (Detwiler 2004a; 2004b; 2004c; 2004d; 2004e; Piper 2004; Triay 2005; Patterson 2005) and by engaging in technical meetings with the EPA staff. As a result of these technical interactions, the EPA instructed the DOE to revise the CRA-2004 PA and run another PA. This PAis referred to as the CRA-2004 Performance Assessment Baseline Calculation (CRA-2004 PABC). With the EPA's recertification decision in 2006, the CRA-2004 PABC was established as the PA baseline.
11 of 76
Information Only
Summary Report of the 2009 Compliance Recertification Application Performance Assessment
1.4 OBJECTIVES FOR THE CRA-2009 PA
Continued review of the CRA-2004 PABC has shown that a number of technical changes and corrections are necessary. Furthermore, updates to parameters and improvements to the PA computer codes have been developed since the recertification decision. To incorporate the changes and updates, a new PA has been conducted, which is called the 2009 Compliance Recertification Application Performance Assessment (CRA-2009 PA). The changes implemented in the CRA-2009 PA are discussed below in Section 2.0 and the results are discussed in Sections 4, 5 and 6. The objective of this report is to summarize the CRA-2009 PA results and how they were obtained. The CRA-2009 PA was directed by Analysis Plan for the Performance Assessment for the 2009 Compliance Recertification Application, Revision 1, AP-137 (Clayton 2008b ).
12 of76

Information Only
Sununary Report of the 2009 Compliance Recertification Application Performance Assessment
2. UPDATES FROM CRA-2004 PABC TO CRA-2009 PA
The CRA-2009 PA is very similar to the CRA-2004 PABC. PA includes an analysis of the features, events, and processes (FEPs) that may have bearing on the performance of the repository. The FEPs are screened to determine which FEPs are retained in PA; these screenedin FEPs are combined into scenarios for the PA calculations.
A FEPs impact assessment was conducted according to SP 9-4 (Kirkes 2005b) in support of the CRA-2009 PA to determine if the changes associated with the CRA-2009 PA created any inconsistencies or conflicts with the current FEPs baseline. The FEPs impact assessment did not identify any inconsistencies, omissions, or other problems with the current baseline in consideration of the proposed changes for the CRA-2009 PA (Kirkes 2008). The assessment concluded that no revision to the baseline FEPs list (Kirkes 2005a) or the baseline FEPs screening document (U.S. DOE 2004, Appendix PA, Attachment SCR) was warranted due to the changes associated with the CRA-2009 PA (Kirkes 2008).
Scenarios are formulated from FEPs. The scenarios are modeled using conceptual models that represent the physical and chemical processes of the repository. The scenarios for the CRA-2009 PA and the CRA-2004 PABC are identical. The conceptual models are implemented through a series of computer simulations and associated parameters that describe the natural and engineered components of the disposal system (e.g., site characteristics, waste forms, waste quantities, and engineered features). In general, the modeling and the parameters in the CRA-2009 PA are the same as the CRA-2004 PABC, except for the following changes:
1. Modification and improvements to: a. the parameter representing the maximum flow duration for DBRs; b. the sampling method applied to the humid and inundated cellulose, plastic and
rubber (CPR) degradation rates; c. the BRAGFLO computer code used in the PA; d. include additional chemistry modeling in BRAGFLO; e. capillary pressure and relative permeability models; and f. the DBR parameter calculations for the well productivity index and material
permeabilities. 2. Update of the drilling rate (GLOBAL:LAMBDAD) as required by 40 CFR § 194.15. 3. Error corrections to:
a. account for CPR contents in emplacement materials in the inventory; b. halite/disturbed rock zone porosity parameters; c. the fraction of repository volume occupied by waste; and d. the input files for the direct brine release (DBR) calculations and the NUTS code.
None of these changes are expected to significantly impact releases. These changes are being incorporated for completeness and correctness, and are discussed below in further detail.
2.1 DURATION OF DIRECT BRINE RELEASES
In the WIPP PA intrusion scenarios, it is hypothesized that brine containing radionuclides could be expelled from repository to the land surface during or directly following the drilling intrusion if repository pressures and brine saturations are sufficiently high (Stoelzel and O'Brien 1996).
13 of76

Information Only
Summary Report of the 2009 Compliance Recertification Application Performance Assessment
The expelled brine volumes are termed DBRs. The duration of a DBR event is constrained by the parameters BLOWOUT:MINFLOW and BLOWOUT:MAXFLOW. The parameter BLOWOUT:MINFLOW represents the minimum DBR duration time, and the parameter BLOWOUT:MAXFLOW represents the maximum DBR duration time. For the CRA-2004 PABC the minimum and maximum DBR durations were set to 3 days and 11 days, respectively.
Analysis Plan for the Modification of the Waste Shear Strength Parameter and Direct Brine Release Parameters, AP-131 (Kirkes and Herrick 2006) describes an analysis that was conducted to reexamine the values of the minimum and maximum DBR duration parameters (BLOWOUT:MINFLOW and BLOWOUT:MAXFLOW). The results of the AP-131 analysis showed that the value for BLOWOUT:MAXFLOW should be decreased from 11 days to 4.5 days, while the value for BLOWOUT:MINFLOW should remain at 3 days (Kirkes 2007). The updated maximum DBR duration was used in the CRA-2009 PA
2.2 CPR DEGRADATION RATE
The WIPP PA brine and gas flow model includes gas generation from the microbial degradation of CPR materials. The model assumes that the gas generation occurs at a given rate, whose possible range was determined from laboratory experiments. Although the inundated and humid microbial degradation rates for cellulose are nominally independent, there is a physical connection between the two distributions, as the humid rate can not be faster than the inundated rate, and therefore should have a lower value than inundated rate.
In general, no correlation was imposed between the inundated and humid microbial cellulose degradation rate, and so it is possible that the Latin Hypercube Sampling code, LHS, may sample a humid rate that is higher that the inundated rate for a single vector. For the CRA-2004 PABC, a conditional relationship was enforced in the preprocessing step for the BRAGFLO calculations. This relationship was implemented by setting the humid rate equal to the inundated rate if the sampled humid rate was higher than the inundated rate for a single vector. Changing these values this way introduced a small error into the sensitivity analysis because the regression analysis was based on the sampled value rather than the conditional values.
For the CRA-2009 PA, a conditional relationship was applied such that the sampled inundated rate is used as the maximum, in the sampling for the humid rate if the sampled humid rate was higher than the inundated rate for a single vector. This conditional relationship results in a correlation of 0.74 between the humid and inundated rates (Kirchner 2008a). The conditional relationship was applied during the LHS process. The LHSEDIT utility was developed to account for this conditional relationship. The implementation and verification of the LHSEDIT utility is discussed in Kirchner (2008a).
2.3 BRAG FLO CODE IMPROVEMENTS
BRAGFLO version 5.0 was used for the CRA-2004 PABC. BRAGFLO version 6.0 was developed to incorporate additional capabilities and flexibility (Nemer 2007a). This code also includes a few additional modifications, such as rate smoothing algorithms and use of effective saturations, to improve code stability. These changes are detailed in Nemer (2007b, 2007e, 2007f). Many of the changes added to improve code robustness were included in the CRA-2009
14 of76

Information Only
Sununary Report of the 2009 Compliance Recertification Application Performance Assessment
PA, which were not part of the CRA-2004 PABC. These changes are not expected to affect releases, but are expected to increase code robustness. The effects of the changes are addressed in the BRAGFLO analysis report (Nemer and Clayton 2008). A brief discussion of the changes included in the CRA-2009 PAis given below.
One addition to improve code robustness is the use of a numerical parameter called the cut off saturation (Nemer 2007b, 2007f). Brine consuming reactions such as anoxic iron corrosion and MgO hydration tend to dry out the repository. As BRAGFLO is a two-phase code, numerical difficulties can be encountered when one phase completely disappears. The cut off saturation is introduced as the lower bound in saturation that is considered numerically dry.
An additional rate smoothing step based on the concentration available was added to BRAGFLO version 6.0. This was added to smooth the derivative near reaction completion to increase code robustness (Nemer 2007b, 2007f).
The capability to control initial conditions was modified for BRAGFLO version 6.0. Additional flexibility was added to the "Reset" material, which controls the initial condition for materials (Nemer 2007b, 2007f). The "Reset" material options were expanded to increase the transparency. The change also allowed the "Reset" materials to be applied to areas that are not specifically waste areas. For the CRA-2004 PABC, since the "Reset" materials were coupled with the areas that contain waste, the initial saturation of excavated area that did not include waste (shaft, panel closure materials, etc.) were set to be fully saturated during the excavation time.
Furthermore, BRAGFLO version 6.0 has the added capability to change the pressure, saturation and concentrations in a material at the time of a material change. For the CRA-2009 PA this capability was used to reset the concentrations (not the pressure or saturation) of the borehole material, when an intrusion into the repository occurs. This is done for consistency, as the iron, CPR, etc. would be removed from the borehole by the intrusion.
2.4 ADDITIONAL CHEMISTRY MODELING IN BRAGFLO
BRAGFLO version 6.0 was developed to incorporate additional capabilities and improve code robustness. One of the added capabilities incorporated into BRAGFLO version 6.0 (that was not used for the CRA-2009 PA) is to be able to model the magnesium oxide (MgO) hydration reaction. Furthermore, additional flexibility was added to the CPR degradation, iron corrosion, iron sulfidation and MgO carbonation reactions that were already present [BRAGFLO version 6.0 has all the same functionality as version 5.0 (Nemer 2007g)]. Another capability included into BRAGFLO version 6.0 is the calculation of the volume of solids generated due to the chemical reactions.
The additional capabilities may be used in future calculations if deemed appropriate, but are mentioned here only to comprehensively describe the changes implemented in BRAGFLO version 6.0. Supplementary chemistry parameters were introduced as part of the additional capabilities and flexibilities (Clayton and Vugrin 2007). Many of the additional parameters were not used in the calculation. A discussion of the additional parameters and their effect on the PA is given in Nemer and Clayton (2008).
15 of76

Information Only
Summary Report of the 2009 Compliance Recertification Application Performance Assessment
2.5 CAPILLARY PRESSURE AND RELATIVE PERMEABILITY MODEL
Nemer (2007b, 2007f) recommends using a modified capillary pressure and relative permeability model for open cavities. The open cavities modeled in BRAGFLO include the operational and experimental areas of the repository. The modified model uses zero capillary pressure and removes the capillary pressure effects from the relative permeability model for the open cavities. The previous model used in the CRA-2004 PABC had zero capillary pressure, but still included capillary pressure effects on the relative permeability model. The modified model is more appropriate because capillary pressure effects are not present in an open cavity. The effects of using the modified model for the open cavities is minimal (Nemer and Clayton 2008), but was included for consistency.
In BRAGFLO version 6.0, a cut off saturation (see Section 2.3) is used to determine when the computational cell is effectively dry and no chemical reactions are taking place. A modified capillary pressure and relative permeability model was developed such that the model would be independent of the cut off saturation value (Nemer 2007b, 2007f). Only the capillary pressure part of the capillary pressure and relative permeability model was modified as the relative permeability model is unchanged from the previous model.
The modified capillary pressure and relative permeability models were used in the CRA-2009 PA. Because of numerical difficulties, capillary pressure has been turned off in the waste-filled areas since the CCA. Thus the modified models have no impact on the results of the CRA-2009 PA (Nemer and Clayton 2008), but were included for completeness.
2.6 DBR INPUT PARAMETER CALCULATION
Modifications to the calculation procedure were made for the CRA-2009 PA DBR calculations to maintain consistency in the well productivity index and permeability parameters. The impact of the modifications on the DBR calculations was minimal (Clayton 2008a), but the modifications are included here to comprehensively describe the changes in the CRA-2009 PA. The implementation and validation for the modified calculation procedure is discussed in Clayton (2008a).
2.7 DRILLING RATE
WIPP regulations require that current drilling practices should be assumed for future inadvertent intrusions. The DOE continues to survey drilling activity in the Delaware Basin in accordance with the criteria established in 40 CFR § 194.33. Local well operators are surveyed annually to provide the WIPP project with information on drilling practices, Castile brine encounters, etc. and the results are documented in a summary report (U.S. DOE 2007). The 2007 summary report shows that drilling practices have not changed from the CRA-2004 PABC with the only difference being an increase in the drilling rate (GLOBAL:LAMBDAD) to 58.5 boreholes per km2 over 10,000 years or 0.00585 boreholes per km2 per year versus 0.00525 boreholes per km2
per year which was used in the CRA-2004 PABC. The updated value for the parameter GLOBAL:LAMBDAD was included into the CRA-2009 PA as an input in the CCDF construction code, CCDFGF. A comparison of the values of the parameter GLOBAL:LAMBDAD for the CRA-2009 PA and the CRA-2004 PABC is shown in Table 2-l.
16 of 76
Information Only
Summary Report of the 2009 Compliance Recertification Application Performance Assessment
2.8 EMPLACEMENT INVENTORY
Leigh et a!. (2005) gives a comprehensive description of the projected inventory that was used for the CRA-2004 PABC. The CRA-2009 PAused the CRA-2004 PABC inventory with one set of modifications. The CRA-2004 PABC included CPR materials in the waste and container (packaging) materials that were also used in the CRA-2009 PA, but the CPR contents in emplacement materials were erroneously omitted from the CRA-2004 PABC (Nemer 2007c). To correct this omission, six new parameters representing the density of CPR materials in emplacement materials were created and used in the CRA-2009 P A. Four additional parameters, which represent the density of cellulose and rubber materials in container (packaging) materials, were also used in the CRA-2009 PA.
Table 2-2 lists the names and descriptions of the CPR parameters used in the CRA-2009 PA, including the ten additional parameters. The addition of the four container (packaging) CPR parameters is done solely for book-keeping purposes since container (packaging) materials do not contain cellulose or rubber materials, as seen by the zero values in Table 2-2. The CRA-2009 PAused all the CPR parameters shown in Table 2-2.
17 of76

Information Only
Summary Report of the 2009 Compliance Recertification Application Performance Assessment
WAS_AREA: DCELLRHW
WAS_AREA: DCELCCHW*
WAS_AREA: DCELCRHW*
W AS_AREA: DCELECHW*
WAS_AREA: DCELERHW*
WAS_AREA: DPLASCHW
W AS_AREA: DPLASRHW
W AS_AREA: DPLSCCHW
W AS_AREA: DPLSCRHW
W AS_AREA: DPLSECHW*
W AS_AREA: DPLSERHW*
W AS_AREA: DRUBBCHW
W AS_AREA: DRUBBRHW
W AS_AREA: DRUBCCHW*
W AS_AREA: DRUBCRHW*
W AS_AREA: DRUBECHW*
WAS_AREA: DRUBERHW*
*Newly created for the CRA-2009 PA.
Average density of plastic in RH waste materials Average density
waste Average waste materials
2.9 HALITE/DISTURBED ROCK ZONE POROSITY
60.0
9.3
0.0
0.0
1.22
0.0
43.0
8.0
17.0
3.1
8.76
0.0
13.0
6.7
0.0
0.0
0.0
0.0
An error in the determination of the intact halite porosity was discovered and reported in Parameter Problem Report 2007-002 (Ismail 2007b ). The maximum of the range was taken from data reported in weight fraction without the conversion to volume fraction. Converting the maximum value from a weight fraction to a volume fraction changed the value from 0.03 to 0.0519 (Ismail 2007c ). The minimum and mode values of the distribution were not affected. Furthermore, current WIPP PA practice for determining the disturbed rock zone (DRZ) porosity is to increase the intact halite porosity value by 0.0029. Therefore, the maximum value of the range for the DRZ porosity increased from 0.0329 to 0.0548. The corrected porosity was used in the CRA-2009 PA.
18 of76

Information Only
Summary Report of the 2009 Compliance Recertification Application Performance Assessment
2.10 FRACTION OF REPOSITORY VOLUME OCCUPIED BY WASTE
The CRA-2009 PA used a different value for the parameter REFCON:FVW as that parameter was modified after the CRA-2004 PABC to correct an error in its calculation. Parameter Problem Report 2007-001 (Dunagan 2007) discusses the error and shows it had only a minor impact on spallings, cuttings and cavings releases. A comparison of the REFCON:FVW values for the CRA-2009 PA and the CRA-2004 PABC is shown in Table 2-3.
2.11 INPUT FILE CORRECTIONS
Two inconsistencies were discovered in the input files used by the ALGEBRACDB code as part of the DBR calculations (Clayton 2007). The first inconsistency involved the input file used to set up the boundary conditions for the S3 scenario calculations. The S3 scenario consists of an intrusion through the repository and a brine pocket, 1,000 years after closure. The intrusion time in the input file was incorrectly assigned the value of 350 years instead of 1,000 years. The second inconsistency entailed the limits of integration used to calculate the DBR volume. The integration limit was determined by a logic command of "if less than zero" when it should have used "if less than or equal to zero". The CRA-2009 PA included the corrections to the DBR calculation input files.
Two discrepancies were noted in the input files for both the NUTS and ALGEBRACDB codes as part of the Salado transport calculations (Ismail 2007a). The first discrepancy comprised the incorrect definition of grid coordinates for the "North Rest of Repository", which referenced column 35 instead of column 36. The second discrepancy related to incorrect cell number designations (1297, 1298 and 1299 instead of 1197, 1198 and 1199) used in the radionuclide transport flux calculation. The CRA-2009 PA included the corrections to the Salado transport calculation input files.
19 of76

Information Only
Summary Report of the 2009 Compliance Recertification Application Performance Assessment
3. CALCULATION METHODOLOGY
The WIPP PA quantifies the potential releases of radioactive materials from the disposal system to the accessible environment over the 10,000-year regulatory period using a suite of numerical models. These numerical models are implemented in various computer codes as shown in Figure 3-l. There is a significant amount of uncertainty associated with characterizing the physical properties of geologic materials that influence potential releases. WIPP PA considers both subjective (epistemic) uncertainty and stochastic (aleatory) uncertainty. Properties such as permeability and porosity are usually measured indirectly and can vary significantly depending upon location. This uncertainty in the appropriate value to assign to certain physical properties is termed subjective uncertainty. Subjective uncertainty can, in theory, be reduced by further study of the system. Subjective uncertainty is dealt with in WIPP PA by running multiple realizations in which the values of uncertain parameters are varied. To ensure that parameters are sampled across their full ranges of uncertainty, Latin Hypercube Sampling (LHS) is used to create the realizations. For the WIPP PA, the LHS code (Vugrin 2005b) is used to create a "replicate" of 100 distinct parameter sets ("vectors") that span a wide range of parameter uncertainty. Three replicates are run for a total of 300 separate vectors to ensure that the Latin hypercube replicates are representative. This is the start of the WIPP PA calculation.
For each of the 300 vectors, the other codes are run. The PANEL (Garner 2006) code quantifies the mobilization of actinides by brine. BRAGFLO (Nemer 2007d) is used to calculate Salado brine and gas flow. NUTS (Gilkey 2006) is used to calculate Salado radionuclide transport. The CUTTINGS_S (Gilkey and Vugrin 2005) code is used to calculate single intrusion direct solids releases via cuttings and cavings. The DRS PALL (Lord 2004) code is used to calculate single intrusion direct solids releases via spallings, and the BRAGFLO code is used to calculate single intrusion direct brine release. MODFLOW 2000 (McKenna 2005) and SECOTP2D (Gilkey 2003) are used to calculate Culebra flow and radionuclide transport, respectively. All of these calculations address the subjective uncertainty by producing results for the 300 separate vectors.
WIPP P A also addresses stochastic uncertainty or the uncertainty in future events. Unlike subjective uncertainty, stochastic uncertainty cannot be reduced by further study. To deal with this type of uncertainty, WIPP PA employs a standard Monte Carlo method of sampling on random "futures." A future is defined as one possible sequence of events. The CCDFGF code (Vugrin 2004) uses the results from the other codes to construct individual futures and ultimately, CCDFs.
This section provides a summary of the PA calculations for the CRA-2009 PA. For each of the processes discussed above, an individual analysis package has been produced. The analysis package gives details of the calculation, describes the changes that were made to produce the CRA-2009 PA, and gives a comparison between CRA-2009 PA and CRA-2004 PABC. A description of each analysis and references to the analysis packages are provided in the following sections.
20 of76

Information Only
Summary Report of the 2009 Compliance Recertification Application Performance Assessment
DIRECT RELEASES
Primary Codes: PANEL CUTTINGS_$ DRSPALL BRAGFLO (DBR)
Radioisotop releases due to d.lrect bri e release, cuttings, ca ings, & solid spallings
Provides sets of sampled values for uncertain parameters
LHS SAMPLING
Primary Code: LHS
Brine & gas flow throughout land-withdrawal region from Castile to the surface
SALADO FLOW & TRANSPORT
Primary Codes: PANEL BRAGFLO NUTS
Radioisotope ansport through Sala o to Land Withdrawal oundary and to Culcbra
COMPLIANCE CALCULATION
Primary Code: CCDFGF
Combmes data reqmred to simulate release scenarios and construct CCDFs
CULEBRA T-FIELDS
Primary Codes: PEST MODFLOW
CULEBRA FLOW
Primary Code: MODFLOW
Groundwate flow in Culebra dolo :nite, including sampled effe ts of mining-induced subs dence
CULEBRA TRANSPORT
Primary Code: SECOTP2D
Radioisoto e transport through Cu ebra to Land Withdrawa Boundary
Figure 3-1. Primary computational models used in the CRA-2009 PA.
21 of 76
,----
I--
Information Only
Summary Report of the 2009 Compliance Recertification Application Performance Assessment
3.1 LHS SAMPLING
The primary role of the code LHS is to use Latin hypercube sampling to sample the subjectively uncertain parameters used in WIPP PA. Additionally, LHS uses these sampled parameters to create the 100 vectors per replicate that are input into the suite of codes used in WIPP P A. LHS was one of the first codes run for the CRA-2009 PA, and an analysis of CRA-2009 PA LHS calculations and a comparison of the CRA-2004 PABC LHS calculations is provided in the LHS analysis package (Kirchner 2008a).
LHS version 2.42 was used for both the CRA-2009 PA and the CRA-2004 PABC calculations.
3.2 ACTINIDE MOBILIZATION
The code PANEL has four roles in the WIPP PA system. The first is to compute the potential for actinide mobilization due to dissolution and colloid mobilization, which is the amount of radionuclides mobilized for removal via a brine pathway. The second purpose is to calculate radionuclide decay, and the third is to calculate the amounts of radionuclides mobilized in a panel that contains a given volume of brine. The fourth is to compute the amounts of radionuclides removed by a volume of brine moving up the borehole to the Culebra. As the CRA-2009 PA used the same inventory as used in the CRA-2004 PABC, the actinide mobilization calculations are identical to the CRA-2004 PABC. Analysis of the CRA-2004 PABC PANEL calculations is provided in the PANEL analysis package (Garner and Leigh 2005).
PANEL version 4.03 was used for the CRA-2004 PABC calculations.
3.3 SALADO FLOW
The code BRAGFLO simulates brine and gas flow in and around the repository. BRAGFLO includes the effects of processes such as gas generation and creep closure. Outputs from the BRAGFLO simulations describe the conditions (pressure, brine saturation, porosity) and flow patterns (brine flow up an intrusion borehole and out anhydrite marker beds to the accessible environment) that are used by other software to predict radionuclide releases. Analysis of the CRA-2009 PA BRAGFLO calculations including a comparison to the CRA-2004 PABC IS
provided in the BRAGFLO analysis package (Nemer and Clayton 2008).
BRAGFLO version 5.0 was run for the CRA-2004 PABC. BRAGFLO version 6.0 was developed to incorporate additional capabilities and flexibility (Nemer 2007a). BRAGFLO version 6.0 was used for the CRA-2009 PA.
3.4 SALADO TRANSPORT
The WIPP PA radioisotope mobilization and decay code NUTS simulates the transport of radionuclides through the Salado Formation for scenarios S 1 through SS. Two types of NUTS runs are made for PA calculations. "Screening" runs use a conservative tracer to determine which vector/scenario combinations have potential for radionuclides to reach the accessible environment. These vector/scenario combinations are included in "isotope" and "time intrusion" runs which calculate the transport of actual radionuclides. Analysis of the CRA-2009 PA NUTS
22 of76

Information Only
Summary Report of the 2009 Compliance Recertification Application Perforrrumce Assessment
calculations including a comparison to the CRA-2004 PABC is provided in the NUTS analysis package (Ismail and Gamer 2008).
NUTS version 2.05a was used for CRA-2004 PABC Salado transport calculations. Following the CRA-2004 PABC, the WIPP PA Alpha Computing Cluster was upgraded, and this upgrade included migrating the operating system from Open VMS version 7.3 to Open VMS version 8.2. The version of NUTS that was used for the CRA-2004 PABC, version 2.0Sa, had a time and date incompatibility with the new operating system (Gilkey 2006), so it was modified to version 2.05c. The only difference between version 2.05a and 2.05c is the change made to correct the time and date incompatibility. NUTS version 2.05c was used for the CRA-2009 PA.
Radionuclide transport to the Culebra for scenario S6 is calculated by running the PANEL code in "intrusion mode" (PANEL_INT). Analysis of the CRA-2009 PA PANEL_INT calculations including a comparison to the CRA-2004 PABC is provided in the NUTS analysis package (Ismail and Gamer 2008).
PANEL version 4.03 was used for both the CRA-2009 PA and the CRA-2004 PABC calculations.
3.5 SINGLE INTRUSION DIRECT SOLIDS RELEASE VIA CUTTINGS AND CAVINGS
Cuttings and cavings are the solid material removed from the repository and carried to the surface by the drilling fluid during the process of drilling a borehole. Cuttings are the materials removed directly by the drill bit, and cavings are the material eroded from the walls of the borehole by shear stresses from the circulating drill fluid. The CUTTINGS_$ code calculates the quantity of material brought to the surface from a radioactive waste disposal repository as a consequence of an inadvertent human intrusion through drilling. WIPP PA utilizes the code CUTTINGS_$ to calculate the amount of material removed from the repository by cuttings and cavings (Vugrin and Fox 2005). Analysis of the CRA-2009 PA CUTTINGS_S calculations including a comparison to the CRA-2004 PABC is provided in the CUTTINGS_$ analysis package (Ismail 2008).
CUTTINGS_S version 6.02 was used for both the CRA-2009 PA and the CRA-2004 PABC calculations.
3.6 SINGLE INTRUSION DIRECT SOLIDS RELEASE (SPALLINGS)
A WIPP spalhngs event is a special case of drilling intrusion in which the repository contains gas at high pressure. This highly pressurized gas can cause localized mechanical failure and entrainment of solid WIPP waste into and up the borehole, resulting in transport to the land surface. The computer code DRSPALL was developed to calculate the spallings volume from a single borehole intrusion (Lord 2004). None of the changes incorporated in the CRA-2009 PA affected the DRSPALL calculations, so the DRSPALL calculations are identical to the CRA-2004 PABC. Analysis of the CRA-2004 PABC DRSPALL calculations is provided in the DRSPALL analysis package (Vugrin 2005a).
23 of76

Information Only
Summary Report of the 2009 Compliance Recertification Application Performan<::e Assessment
CUTIINGS_S uses the repository pressures calculated by BRAGFLO to interpolate spallings volumes from DRSPALL and calculate spallings volumes from an individual intrusion for the various drilling scenarios). Analysis of the CRA-2009 PA CUTIINGS_S calculations including a comparison to the CRA-2004 PABC is provided in the CUTIINGS_S analysis package (Ismail 2008).
DRSPALL version 1.10 was used in the CRA-2004 PABC. CUTIINGS_S version 6.02 was used for both the CRA-2009 PA and the CRA-2004 PABC calculations.
3.7 SINGLE INTRUSION DIRECT BRINE RELEASE
Direct brine releases (DBRs) are releases of contaminated brine originating in the repository and flowing up an intrusion borehole during the period of drilling. In order to have a significant DBR release, two criteria must be met (Stoelzel and O'Brien, 1996):
1. Volume averaged pressure in the vicinity of the repository encountered by drilling must exceed drilling fluid hydrostatic pressure (assumed to be 8 MPa).
2. Brine saturation in the repository must exceed the residual saturation of the waste material (sampled from a uniform distribution ranging from 0.0 to 0.552).
DBRs are calculated using the code BRAGFLO with a two-dimensional, oriented grid, which represents the vicinity of the waste panels. Analysis of the CRA-2009 PA DBR calculations including a comparison to the CRA-2004 PABC is provided in the DBR analysis package (Clayton 2008a).
BRAGFLO version 5.0 was run for the CRA-2004 PABC. BRAGFLO version 6.0 was developed to incorporate additional capabilities and flexibility (Nemer 2007a). BRAGFLO version 6.0 was used for the CRA-2009 P A
3.8 CULEBRA FLOW AND TRANSPORT
None of the changes incorporated in the CRA-2009 PA affected the Culebra flow and radionuclide transport calculations, so they are identical to the CRA-2004 PABC. Culebra flow is calculated by the code MODFLOW. The code SECOTP2D computes the transport of radionuclides released into the Culebra at closure. The calculation of time-dependent releases is calculated in the CCDFGF code. Analysis of the CRA-2004 PABC Culebra flow and transport calculations is provided in Lowry and Kanney (2005).
MODFLOW 2000 version 1.6 was used for the CRA-2004 PABC. SECOTP2D version 1.4la was used for the CRA-2004 PABC.
3.9 NORMALIZED RELEASES
WIPP PA uses the code CCDFGF to address stochastic uncertainty. CCDFGF employs a standard Monte Carlo method of sampling on random "futures". A future is defined as one possible sequence of events, and each future is based on sampled stochastic variables such as the time and location of a drilling event, plugging pattern used for a drilling event, and whether or not waste was encountered. The CCDFGF code (Vugrin 2004) combines the sampled stochastic
24 of76
Information Only
Summary Report of the 2009 Compliance Recertification Application Performance Assessment
parameters with the release data calculated by the process model codes to calculate the cumulative normalized release for each future. Using these futures and ordered statistics, CCDFs are created, and these CCDFs are compared to regulatory limits to determine compliance with the EPA regulations. Analysis of the CRA-2009 PA CCDFGF calculations, including a comparison to the CRA-2004 PABC is provided in the CCDFGF analysis package (Dunagan 2008).
In order for CCDFGF to calculate the CCDFs, the release data from the various process model codes must be assembled. This is a multi-step process. Most of the release data from the process model codes is output in the form of binary CAMDAT files. In general, the code SUMMARIZE is run multiple times to extract and collate the release data from individual codes into text files. These files are then input into the code PRECCDFGF in order to assemble all of the release data for a single replicate into one release table (RELT AB) file. This file is input into CCDFGF.
PRECCDFGF version 1.01, CCDFGF version 5.02 and SUMMARIZE version 3.00 were used for both the CRA-2009 PA and the CRA-2004 PABC calculations.
3.10 SENSITIVITY ANALYSIS
Rank regression analysis was used to evaluate the sensitivity of the output variables to the sampled parameters. The rank regression analyses were conducted using the computer code STEPWISE. STEPWISE relates the sampled input parameter values to the calculated release data by performing a multiple regression analysis and reporting the results in tabular form. Analysis of the CRA-2009 PA STEPWISE calculations is provided in Kirchner (2008b).
STEPWISE version 2.21 was used for both the CRA-2009 PA and the CRA-2004 PABC calculations.
3.11 RUN CONTROL
Digital Command Language (DCL) scripts, referred to here as EV AL run scripts, are used to implement and document the running of all software. These scripts, which are the basis for the WIPP PA run control system, are stored in the LffiCRA09_EVAL Code Management System (CMS) library. All inputs are fetched at run time by the scripts, and outputs and run logs are automatically stored by the scripts in class CRA09-0 of the CMS libraries. Run control for the CRA-2009 PA calculations is documented in Long (2008).
25 of76
Information Only
Summary Report of the 2009 Compliance Recertification Application Performance Assessment
4. RESULTS FOR THE UNDISTURBED REPOSITORY
The PA tabulates releases from the repository for undisturbed conditions. Releases to the accessible environment from the undisturbed repository fall under two sets of protection requirements. The first, as set forth 40 CFR § 191.15, protects individuals from radiological exposure; the second, in 40 CFR § Part 191, Subpatt C, protects groundwater resources from contamination. This section shows how WIPP complies with these two requirements by presenting flow (BRAGFLO) and radionuclide transport (NUTS) results from modeling the undisturbed repository.
4.1 SALADO FLOW
Brine and gas flow in the Salado is computed by BRAGFLO (Nemer 2007d). This section summarizes the Salado flow calculation results for the undisturbed (S1) scenario. Pressure in the repository, brine saturation in the waste, and brine flow out of the repository are presented, along with sensitivity analyses that identify the uncertain parameters to which these results are most sensitive. The Salado flow model represents the repository as five regions in the numerical grid: three waste-filled regions (the Waste Panel, South Rest of Repository (RoR), and North RoR in Figure 4-1) and two excavated regions with no waste (operations area and experimental area in Figure 4-1). The analysis package for Salado flow contains a detailed presentation on the BRAGFLO model, calculation results, and further sensitivity analyses (Nemer and Clayton 2008).
4.1.1 Pressure in the Repository
In undisturbed conditions, pressure strongly influences the extent to which contaminated brine might migrate from the repository to the accessible environment. In addition, pressure developed under undisturbed conditions is an initial condition for the models for spallings and DBR (Sections 5.5.2 and Section 5.5.3 respectively).
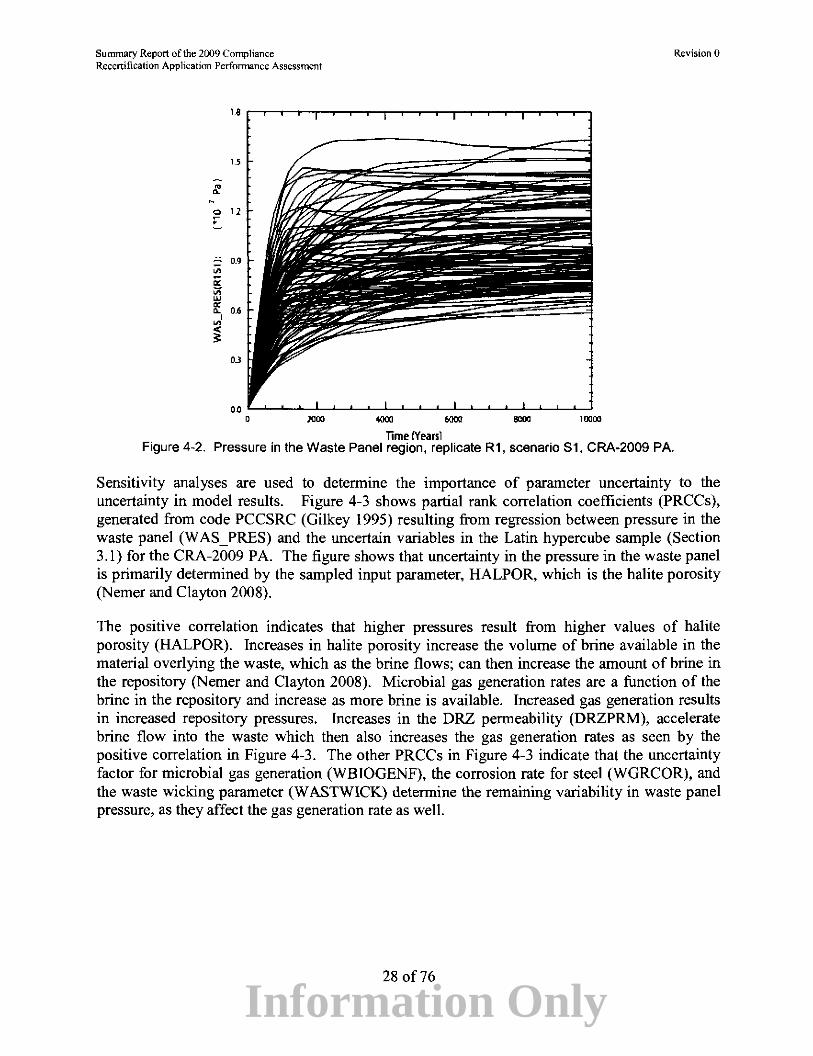
Figure 4-2 shows the pressure in the Waste Panel region for 100 vectors in replicate R1 for the CRA-2009 PA. During the first 1,000 years, repository pressure may increase rapidly due to several factors: rapid initial creep closure of rooms, initial inflow of brine causing gas generation due to corrosion; and availability of CPR material to produce gas by microbial degradation. Pressure generally approaches a steady-state value after 2,000 years as room closure ceases, brine inflow slows (thereby reducing gas generation by corrosion) and CPR materials are consumed.
In general pressure increased for the CRA-2009 PA compared with the CRA-2004 PABC [see Table 6-10 in Nemer and Clayton (2008)]. The increase was mainly caused by the correction of the halite porosity. The upper bound of the halite porosity distribution was increased while the lower bound and the mean remained the same. The halite porosity is positively correlated with pressure, and so the increase in porosity resulted in an increase in pressure (Nemer and Clayton 2008).
26 of76
Information Only
Summary Report o t" the 2009 Compliance Reeertillcation Application Performance Assessment
CRA-2004 and CRA-2004 PABC BRAGFLO Grid Row
JJ
~------------~--------------------~~~----_.~~------------~ ~~~--~~~--~~--~~~----------~ 32 31 30
2 8 S:::~Dii1E====~~ 29 2~ .~0 t------------...... -----------"--~ 27
l70 ~::::::::::::::~;:::~::::~::::::::~:J~~~~~~iiiUBJiiiDiit::l ~--------------~------------~--------~ 26 ~00~ ~ ~/3 ~
~ /3 2 3 ~ 13' 22 54 13 ! 2 1
4 5J 4 5l
02/!::::::::::!!!~~!2Q!::::::::::::~::l 262 1 32 1 32 1 32 0 69 069 ~--~------~~Mn~----------------i 085 --------~~·~K-----------~ 10C
65_'/2
66 12
20 19
~----------------~~Na~--------------~ 1B --~----------------~~~--------------~ 17 16
15 14 13 12 11
10 9 8 1
6 5 4 3
2
y Cal - •" .,.~ • .... "" 9 -.., <l!l- \It ~ ~ D -,.: to' ,. ~ ~ \L' H ~. :-~ r: ;:•, ~q i'".; l ~ :·~ ~·~ ~·~ ; •• :--! :;: ;J~ ~; ~ ~-; ~=·; ~~~ "::.I .:T '- t ~ :::;. ~ "..i \.i Ui '-\1 lj I .:.. 1..1 '~i ;:; 'J, :t i ttl r, ·~ :_i- ~ 'J/1 hl u.. W ~ ~ lli :t: :...., :.0
)-X(north)
z Figure 4-1. CRA-2009 PA BRAGFLO grid (Nemer and Clayton 2008). f).x , f).y, and f).z dimensions in meters). Note that "north of the repository" is to the right of the Exp area on the above graph, the depth is in theY direction and "east of the repository'' is in the Z direction.
27 of76
Information Only
Summary Report of the 2009 Compliance Recertification Application Performance Assessment
15
~ 0.
0 11
•
- • •• "' "' Vi w 0:
·~ 0.
1
"' < ;;:
03
Time CYearsl Figure 4-2. Pressure in the Waste Panel region, replicate R1, scenario S1, CRA-2009 PA.
Revision 0
Sensitivity analyses are used to determine the importance of parameter uncertainty to the uncertainty in model results. Figure 4-3 shows partial rank correlation coefficients (PRCCs ), generated from code PCCSRC (Gilkey 1995) resulting from regression between pressure in the waste panel (WAS_ PRES) and the uncertain variables in the Latin hypercube sample (Section 3.1) for the CRA-2009 PA. The figure shows that uncertainty in the pressure in the waste panel is primarily determined by the sampled input parameter, HALPOR, which is the halite porosity (Nemer and Clayton 2008).
The positive correlation indicates that higher pressures result from higher values of halite porosity (HALPOR). Increases in halite porosity increase the volume of brine available in the material overlying the waste, which as the brine flows; can then increase the amount of brine in the repository (Nemer and Clayton 2008). Microbial gas generation rates are a function of the brine in the repository and increase as more brine is available. Increased gas generation results in increased repository pressures. Increases in the DRZ permeability (DRZPRM), accelerate brine flow into the waste which then also increases the gas generation rates as seen by the positive correlation in Figure 4-3. The other PRCCs in Figure 4-3 indicate that the uncertainty factor for microbial gas generation (WBIOGENF), the corrosion rate for steel (WGRCOR), and the waste wicking parameter (W ASTWICK) determine the remaining variability in waste panel pressure, as they affect the gas generation rate as well.
28 of76

Information Only
Summary Report of the 2009 Compliance Recertification Application Performance Assessment
l.OO rr----,---,------'10.:_0VEi-=CT-'-O"-RC:CRAC::O"r9"-BRA.:_G.:_F.:_LO'-'R"-UNTS-'-FO;cRc..:S.:_1 -r----,
.......................................... ..........
0.75
0.50
~ 0.25 z ~ it 0 u IS 0.00
~ ~ ~
-------------------0 -0.25 u ~ z ;:;
" " -0.50 < ~
-o.75
-1.00 0.0 15 3.0 4.5 6.0 7.5 9.0
TIME (*10 3 Years)
Dependent Variable WAS_PRES
--WGRCOR ••··••·••• HALPOR --WASIWICK ------- DRZPRM --- WBIOGENF
Revision 0
Figure 4-3. Primary Correlations of pressure in the Waste Panel region with uncertain parameters, replicate R1, scenario 81, CRA-2009 PA.
4.1.2 Brine Saturation in the Waste
Brine saturation is an important result of the model for Salado flow because gas generation processes, which tend to increase pressure, require brine. Brine saturation is also an initial condition in the model for DBR (Section 5.5.3).
Figure 4-4 shows brine saturation in the Waste Panel region of the repository for 100 vectors of replicate R1, scenario S1 for the CRA-2009 PA. Brine saturation in the waste-filled areas is set initially to 0.015. Saturation increases very rapidly (in the first 100 years) in all excavated areas as brine flows toward the excavations, primarily from the DRZ above the excavation. Initially there is a large pressure differential between the DRZ and the excavated regions, and the relatively high permeability of the DRZ, compared to undisturbed halite, permits the rapid influx of brine. Brine inflow slows as the pressures equalize and as brine saturation in the DRZ decreases. Brine saturation in the waste areas decreases over time as brine is consumed by corrosion. Brine may also be driven out of the repository by high pressure.
The brine saturation patterns are similar, but the CRA-2009 PA is higher on average than the CRA-2004 PABC [see Table 6-6 and Figure 6-8 in Nemer and Clayton (2008)]. There are more vectors with saturation greater than 60%. The increase in brine saturation is due to the increased halite porosity (Nemer and Clayton 2008).
29 of76

Information Only
Summary Report of the 2009 Compliance Recertification Application Performance Assessment
~
~ 0.8 c 0 ·v; c .. E '5
0.6
V>
a: ;a 0.4
!;( V>
I V> <(
:; 0.2
2000 4000 6000 8000 10000
Time (Years)
Revision 0
Figure 4-4. Brine saturation in the Waste Panel region, replicate R1, scenario S1, CRA-2009 PA.
Computing PRCC' s between the brine saturation in the waste panel (W AS_SA TB) and the uncertain parameters in the Latin hypercube sample identifies a number of parameters that contribute to the uncertainty in brine saturation. The relative importance of these parameters varies over the 10,000-year modeling period, and none of the parameters are clearly dominant. Figure 4-5 shows positive correlations with anhydrite permeability (ANHPRM), DRZ permeability (DRZPRM), and halite porosity (HALPOR). Increases in halite porosity increase the volume of brine available in the material overlying the waste; increases in DRZ and anhydrite permeability accelerate brine flow into the waste. Negative correlations are found between brine saturation and the corrosion rate (WGRCOR) and the wicking factor (W ASTWICK) because increases in these two variables, increase the rate at which brine is consumed by corrosion, thus decreasing saturation.
30 of76

Information Only
Summary Report of the 2009 Compliance Recertification Application Performance Assessment
1_00 ,-,-----,---,---,,--~100~-:e;:::::cr~OR:::C~RA~09:;:,'~RA::G~FL~O_::RU:::;~::_:Sf~O~R 5CC1-,-----,
-075 ~
o so ~I ~"=:::::~-,....---==-=-::-:...-...:-_-~---_-_-_-_-_-_----~-- ----~/
,../ ------..__ Dependent Variable
----------- WAS_SATB ~ 0
·25
-- -- DRZPRM 0 -········· WGRCOR ;;: --HALPOR ~ ------- WASlWICK
z O.OO e+-----------------------1 --- ANHPRM
I ~ I::\ _//--:-:~~:~'. '::::.-~-·~-----~-· . ____ ... -··
...... __ _ .. -· -o.75 ~ .... - -
' ·1.00 u_ __ _J_ __ _jl_ __ L_ __ _[_ __ _t_ __ __L _ __J
0.0 1.5 3.0 4.5 6.0 7.5 9.0
TIME ( "1 0 3 Years)
Revision 0
Figure 4-5. Primary correlations of brine saturation in the Waste Panel region with uncertain parameters, replicate R1, scenario S1, CRA-2009 PA.
4.1.3 Brine Flow Out of the Repository
The anhydrite marker beds (MBs) and the shafts provide possible pathways for brine flow away from the repository in the undisturbed (Sl) scenario. The Salado flow model only tabulates the volume of brine crossing boundaries within the model grid; it does not identify whether the brine contains radionuclides from the waste. Radionuclide transport is calculated separately from the flow and is discussed in Section 4.2.
Figure 4-6 shows cumulative brine outflow from the waste-filled regions of the repository (BRNREPOC), while Figure 4-7 shows the volumes of brine that cross the Land Withdrawal Boundary (LWB) through the MBs (BRAALLWC). The largest outflow across the LWB is -1,600 m3 Brine crossing the LWB or moving up the shaft does not necessarily indicate releases from the repository, since the brine may not have been in contact with the waste; the brine may have been present in the MBs at the start of the regulatory period. Section 4.2 presents the results of the radionuclide transport calculations that determine the amount of radionuclides that may be released by transport in brine.
Compared with the CRA-2004 PABC, an increase in the average and maximum cumulative brine flow away from the repository was observed for the CRA-2009 PA [see Table 6-11 in Nemer and Clayton (2008)]. This is due to the increase in the repository pressure (see Section 4.1.1). The cumulative brine flow to the LWB through the MBs also increased for the CRA-2009 PA compared with the CRA-2004 PABC because of the pressure increase.
31 of76

Information Only
Summary Report of the 2009 Compliance Recertification Application Performance Assessment
4.0 I I I I
--E 3.0 ~
0
• v; 2.0
"' v r/ --~
0 "-w
"' z "' 1.0 "' :,/-__ L. /
/ .• . ..
.-----:::::::::7 / I iii . .
. 0.0
0 .2000 4000 6000 8000 1 0000
Time (Years) Figure 4-6. Brine flow away from the repository, replicate R1, scenario 81, CRA-2009 PA.
1.5
~
E
0 • 1.2
0.9
"' a: ~ -' 0.6 -' :::: 0: .,
0,3
o.o L.,__,__.__L_...L...<;:L__l__,__.__,__L_,_____..=~~.;;;:;3 0 2000 4000 6000 8000 10000
Time (Years)
Revision 0
Figure 4-7. Brine flow via all MBs across the LWB, replicate R1, scenario 81, CRA-2009 PA.
Regression analyses between total cumulative brine flow out of the waste-filled regions (BRNREPOC) and the uncertain parameters are shown in Figure 4-8. The permeability of the DRZ (DRZPRM) has the largest positive correlation, followed by the permeability of the concrete panel seal (CONPRM), and the porosity of undisturbed halite (HALPOR). Increases in the permeability of the DRZ and the concrete panel seal allow more brine to flow out of the
32 of76

Information Only
Summary Report of the 2009 Compliance Recertification Application Performance Assessment
Revision 0
repository, as well as into the repository, which increases the gas generation and therefore the pressure. The increase in the halite porosity also increases the pressure, and an increase in pressure increases the amount of brine flow out of the repository. The largest negative correlation is with the waste residual brine saturation (WRBRNSAT), which determines the immobile portion of the brine in the waste-filled regions, which then limits the amount of brine that can flow out.
100 VECTOR CRA09 BRAGFLO RUNS FOR 51 1.00 ,---,------,--:..:;r:-==;.===:.r-=-'----,------,
' '
=- -;c::.·· . ············· ............ ·········· 0.50 ------------------------------
t:; 0.25 ,.....---....... ~ I ..... ...._
E ~( -----------------------~---------- ~~~~~~Variable 8 z ooor+--------------------_,-.... -... -... 5~~~ g l -- WRBRNSAT ~ I ------- HALPOR :::: · --- WBIOGENF
8 -<>.2> r-\1 ! i -<>501-\ , ____________________ ---
-0.75 r- -
-1.00 '::'::----,:':--'--:-':----:':----:-':---:':---:-'':--...J M 15 il U U U U
TIME (""10 3 Year.;)
Figure 4-8. Primary correlations of total cumulative brine flow away from the repository with uncertain parameters, replicate R 1, scenario 81, CRA-2009 PA.
4.2 RADIONUCLIDE TRANSPORT
This section summarizes the radionuclide transport results for the undisturbed repository, both up the shaft to the Culebra, and through the Salado to the LWB. Ismail and Garner (2008) present a detailed analysis of the NUTS results for the CRA-2009 P A.
Radionuclide transport in the undisturbed (Sl) scenario is calculated by the code NUTS. Screening runs using a conservative tracer are conducted to determine which vectors have the potential to transport radionuclides to the accessible environment. Full transport simulations are then performed for all vectors that are screened in (have the potential to transport radionuclides to the accessible environment). Based upon results of the screening exercise, full radionuclide transport simulations were performed for only one vector in the undisturbed case, replicate Rl, vector 53. Radionuclide transport simulations were performed for other vectors in the undisturbed case to determine fluid flow conditions used in the disturbed scenario calculations.
33 of 76

Information Only
Summary Report of the 2009 Compliance Recertification Application Performance Assessment
4.2.1 Radionuclide Transport to the Culebra
Revision 0
For the undisturbed repository, no vectors showed radionuclide transport through the shafts to the Culebra. Consequently, no radionuclides could be transported through the Culebra to the accessible environment under undisturbed conditions (Ismail and Gamer 2008).
4.2.2 Radionuclide Transport to the L WB
Radionuclides can potentially also be transported through the Salado marker beds to the LWB. For the undisturbed case, only one vector was screened in. The maximum total integrated activity across the LWB at the Salado marker beds for replicate Rl, scenario Sl, vector 53 was 2.6xl0·10 EPA units (Ismail and Garner 2008). This is comparable to the CRA-2004 PABC results for replicate Rl, scenario Sl, vector 53 (the only screened-in vector) which had 1.3xl0-12
EPA units at the boundary (Lowry 2005). One should note that these magnitudes are smaller than the effective numerical precision of the transport calculations. As explained in Lowry (2005), this value is most likely due to numerical dispersion as a result of the NUTS finitedifference solution method. The magnitude of the non-zero release is indicative of numerical dispersion resulting from the coarse grid spacing between the repository and the LWB, rather than a probable transport of radionuclides.
Regardless of the significance attached to the numerical values reported above, the releases from the undisturbed scenario are insignificant when compared to releases from drilling intrusions (see Section 5.4). Consequently, releases in the undisturbed (Sl) scenario are omitted from the calculation of total releases from the repository.
34 of76

Information Only
Summary Report of the 2009 Compliance Recertification Application Performance Assessment
5. RESULTS FOR A DISTURBED REPOSITORY
Revision 0
The WIPP repository might be disturbed by exploratory drilling for natural resources during the 10,000-year regulatory period. Drilling could create additional pathways for radionuclide transport, especially in the Culebra, and could release material directly to the surface. In addition, mining for potash within the LWB might alter flow in the overlying geologic units and may locally accelerate transport through the Culebra. The disturbed scenarios used in PA modeling capture the range of possible releases resulting from drilling and mining.
Total releases are computed by the code CCDFGF. Total releases comprise transport releases and direct releases. Transport releases generally involve movement of radionuclides up an abandoned borehole into the Culebra, then through the Culebra to the L WB. Transport of radionuclides to the Culebra is computed using the codes NUTS and PANEL (see Section 3.4) using the brine flows computed by BRAGFLO (see Section 3.3). Radionuclide transport through the Culebra is computed by the code SECOTP2D (see Section 3.8) using flow fields calculated by MOD FLOW (see Section 3.8).
Direct releases occur at the time of a drilling intrusion and include releases of solids (cuttings, cavings, and spallings) computed using the code CUTTINGS_S (see Section 3.5 and Section 3.6) and direct releases of brine computed using BRAGFLO (see Section 3.7). Pressure and brine saturation within the waste areas are used as initial conditions to the models for direct releases. Results from the undisturbed repository (see Section 4) are used as the initial conditions for the first intrusion. To calculate initial conditions for subsequent intrusions, and to compute the source of radionuclides for transport in the Culebra, a set of drilling scenarios are used to calculate conditions within the repository after an intrusion, using BRAGFLO (see Section 3.3).
This section first summarizes the scenarios used to represent drilling intrusions and the resulting repository conditions calculated by BRAGFLO. Next, transport releases are presented, followed by cuttings, cavings, spallings, and DBRs.
5.1 DRILLING SCENARIOS
As shown in Table 5-1, the PA considers two types of drilling intrusions, E1 and E2. The E1 intrusion scenario represents the possibility that a borehole creates a pathway between the repository and a pressurized brine reservoir located within the underlying Castile formation. The E2 intrusion scenario represents a borehole that does not connect the repository with an underlying brine reservoir, but does intrude into the repository. Repository conditions are calculated for the El intrusion scenario at 350 and 1,000 years, and are referred to as the BRAGFLO S2 and S3 scenarios, respectively. The BRAGFLO Scenarios S4 and S5 represent E2 intrusions that occur at 350 and 1,000 years, respectively. An additional BRAGFLO scenario, S6, simulates the effects of an E2 intrusion at 1,000 years followed by an El intrusion 1 ,000 years later into the same panel.
35 of76

Information Only
Summary Report of the 2009 Compliance Recertification Application Performance Assessment
E2: Borehole penetrates the repository, but does not encounter brine in the Castile.
5.2 MINING SCENARIOS
Revision 0
Castile Formation.
Long-term releases within the Culebra could be influenced by future mining activities that remove all the known potash reserves within the LWB and cause the transmissivity within the overlying Culebra to change. The occurrence of the full mining of known potash reserves within the LWB in the absence of active and passive controls is modeled as a Poisson process, with a rate of 10-4 yr· 1
. For any particular future, this rate is used to determine a time at which full mining has occurred. Flow fields are calculated for the Culebra for two conditions: partial mining, which assumes that all potash as been mined from reserves outside the LWB; and full mining, which assumes all reserves have been mined both inside and outside the LWB. Radionuclide transport through the Culebra uses the partial mining flow fields prior to the time at which full mining has occurred and the full mining flow fields after that time.
5.3 SALADO FLOW
This section summarizes the results of the Salado flow calculations for the disturbed scenarios. Nemer and Clayton (2008) provide a detailed presentation on the BRAGFLO model, calculation results, and further sensitivity analyses.
5.3.1 Pressure in the Repository
Figure 5-1 and Figure 5-2 show pressure in the waste panel (WAS_PRES for area of Waste Panel in Figure 4-1) for the 100 vectors of replicate R1 for BRAGFLO scenarios S2 and S4, respectively. The pressure exhibits patterns that vary depending on the type of intrusion.
Scenario S2 represents an E1 intrusion at 350 years. At the time of the intrusion, brine flow from the Castile brine reservoir leads to an increase in pressure (Figure 5-l). However, pressure drops sharply 200 years after the intrusion when the borehole plugs above the repository are assumed to fail and the permeability of the borehole generally increases. In vectors with low borehole permeability, pressure does not change noticeably as a result of the borehole plug failure (Nemer and Clayton 2008).
Scenario S4 represents an E2 intrusion at 350 years. The borehole plugs effectively prevent any change in repository pressure from the time of the intrusion until the borehole plugs fail (Figure 5-2). As in the scenarios for E1 intrusions, pressure generally drops sharply when the plugs fail, except for vectors with low borehole permeability after plug failure. The pressure is generally lower in the E2 intrusion scenarios compared with the undisturbed and E1 intrusion scenarios (Nemer and Clayton 2008).
36 of76

Information Only
Summary Report of the 2009 Compliance Recertification Application Performance Assessment
1.5
m 0.
' 0
1.2 •
@ 0.9 V>
« VI UJ
" 0.6 0. .,' <(
:: 0.3
0.0 L_J.._J.._L._I-L,......JL,......Jc......J'--'---'---'----'----"----'-----'-_._----'-----'--'--' 0 2000 4000 6000 8000 10000
Time (Years)
Revision 0
Figure 5-1. Pressure in the Waste Panel region for replicate R1, scenario S2, CRA-2009 PA.
1.2
~ '
0
* 0.9
~ "' « VI 0.6 UJ 0: 0.
I V> <( ;;:
0.3
2000 4000 6000 8000 1 0000
Time (Years) Figure 5-2. Pressure in the Waste Panel region for replicate R1, scenario S4, CRA-2009 PA.
The pressure trends in the disturbed scenarios for the CRA-2009 PA are similar to the results obtained for the CRA-2004 PABC. The average and maximum pressures are comparable between the two analyses as well [see Table 6-16 in Nemer and Clayton (2008)]. As the intrusion creates a pathway for brine and gas to flow into and away from the repository, the effect of the increased halite porosity is minimized (Nemer and Clayton 2008).
37 of76

Information Only
Summary Report of the 2009 Compliance Recertification Application Performance Assessment
Revision 0
Computing PRCC's between the pressure in the waste panel (WAS_PRES) and the uncertain parameters in the Latin hypercube sample identifies a number of parameters that contribute to the uncertainty in pressure for the disturbed scenarios. The relative importance of these parameters varies over the 10,000-year modeling period. Figure 5-3 and Figure 5-4 show the regression analysis results for pressure in the Waste Panel with uncertain parameters versus time for scenarios S2 and S4, replicate Rl from the CRA-2009 PA, respectively.
~ u
" ~ z 0
~ ~ 0 u ~
:l " !;; ::'
1.00 I 100 VECTOR CRA09 BRAGFLO RUNS FOR 52
:-:
075 ~N -
I 050 ~,
' 0.25 ..... --......................... , '-
~IJ --~~ ..... __________ _......--------------
0.00
-<1.25 1-
·0.50 ~
('--- _ ....... .....__
~I ~
I -------i · .......... ..--······ ....................................................................... -
1\.// -0.75 ~ \ . ____ ..... \ ___________________________________________ _
-1.00 ' ' ' I u 15 u u u g u
TIME (~10 3 Years}
Dependent Variable WAS_PRES
--BPII'ITPRS .......... WGRCOR --WASTWICK ------· BHPERM --- BPCOMP
Figure 5-3. Primary correlations for pressure in the Waste Panel region with uncertain parameters, replicate R1, scenario S2, CRA-2009 PA.
For both scenarios, the borehole permeability (BHPERM) has the largest negative correlation with pressure after the intrusion, as this is the primary means by which pressure may escape the repository in the disturbed scenarios. For scenario S2 (Figure 5-3), the initial Castile brine pocket pressure (BPINTPRS) has the largest positive correlation after the intrusion, while for scenario S4 (Figure 5-4), the largest positive correlation for the majority of the time after the intrusion, results from the halite porosity (HALPOR). The negative correlation of the borehole permeability is larger than the positive correlation of the initial Castile brine pocket pressure and halite porosity for either scenario.
The larger initial Castile brine pocket pressure causes more brine at a higher pressure to flow into the repository, while increasing the halite porosity increases the volume of brine available in the material overlying the waste, which, as the brine flows into the waste panel, can then increases the amount of brine in the repository. Microbial gas generation rates are a function of the brine in the repository and increase as more brine is available. Increased gas generation results in increased repository pressures.
38 of76
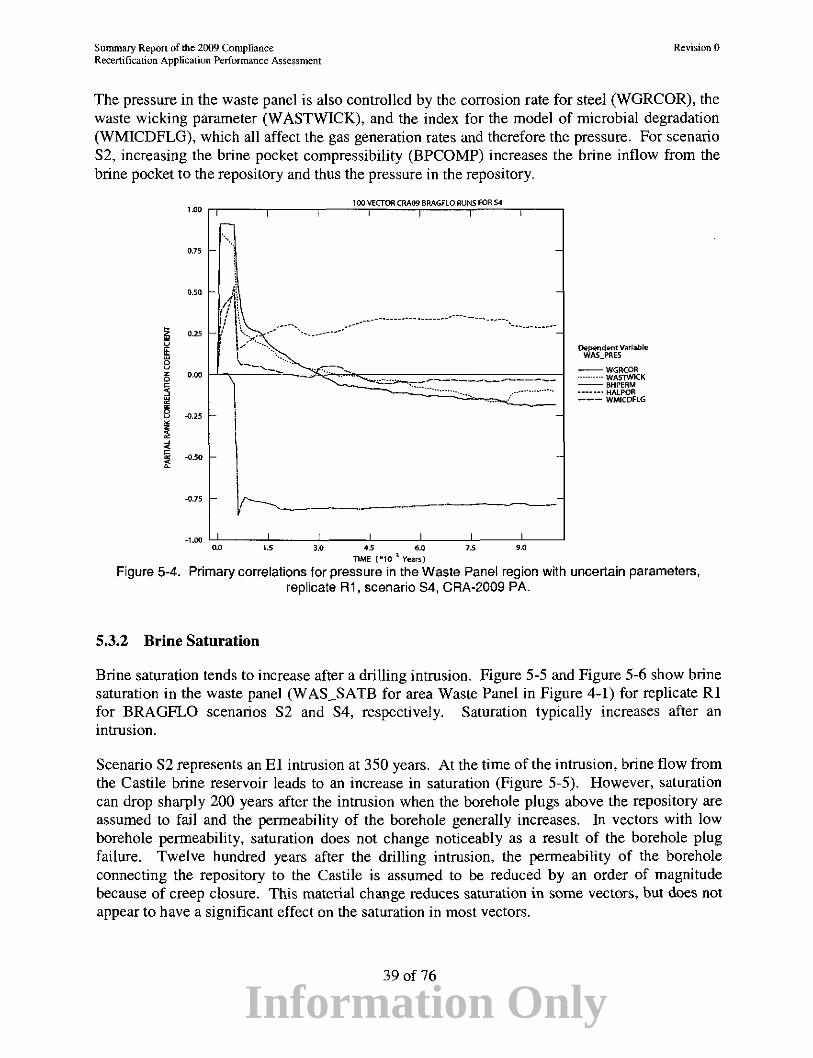
Information Only
Sununary Report of the 2009 Compliance Recertification Application Performance Assessment
Revision 0
The pressure in the waste panel is also controlled by the corrosion rate for steel (WGRCOR), the waste wicking parameter (W ASTWICK), and the index for the model of microbial degradation (WMICDFLG), which all affect the gas generation rates and therefore the pressure. For scenario S2, increasing the brine pocket compressibility (BPCOMP) increases the brine inflow from the brine pocket to the repository and thus the pressure in the repository.
I u z 0
5 ~ t5 u ~
~ <I
"' 0'
100 VECTOR CRA09 BRAGFLO RUNS FOR S4 1<orr----~----~----~~~~r=~~~~~~.---,
r. ···· ...
0.75
0.50
0.25
0.00
~:
1S::---~- ,_ I - --....... -.....'"'"",.....,'"'·<::: ... - ... ~-- -;
.0.25
-o.so I -
-
.0.75' l~--·-·-------~--·1.00 '::':c------:":------,L-----:'=-----:-':----:.L.----::'::---_J
M 15 U U M U U
TIME (*10 3 Years)
DeP*!ndent variable WAS_PRES
---WGRCOR ··•·•····· WASTWICK --- BHPERM ------· HALPOR --- WMICDFLG
Figure 5-4. Primary correlations for pressure in the Waste Panel region with uncertain parameters, replicate R1, scenario S4, CRA-2009 PA.
5.3.2 Brine Saturation
Brine saturation tends to increase after a drilling intrusion. Figure 5-5 and Figure 5-6 show brine saturation in the waste panel (WAS_SATB for area Waste Panel in Figure 4-1) for replicate Rl for BRAGFLO scenarios S2 and S4, respectively. Saturation typically increases after an intrusion.
Scenario S2 represents an El intrusion at 350 years. At the time of the intrusion, brine flow from the Castile brine reservoir leads to an increase in saturation (Figure 5-5). However, saturation can drop sharply 200 years after the intrusion when the borehole plugs above the repository are assumed to fail and the permeability of the borehole generally increases. In vectors with low borehole permeability, saturation does not change noticeably as a result of the borehole plug failure. Twelve hundred years after the drilling intrusion, the permeability of the borehole connecting the repository to the Castile is assumed to be reduced by an order of magnitude because of creep closure. This material change reduces saturation in some vectors, but does not appear to have a significant effect on the saturation in most vectors.
39 of76

Information Only
SuiJllllJTy Report of the 2009 Compliance Recertification Application Performance Assessment
Revision 0
Scenario S4 represents an E2 intrusion at 350 years. The borehole plugs effectively prevent any change in repository saturation from the time of the intrusion until the borehole plugs fail (Figure 5-6). Unlike the El intrusions scenarios, saturation generally increases sharply when the plugs fail, except for vectors with low borehole permeability after plug failure. The saturation 1s generally lower in the E2 intrusion scenarios compared with the El intrusion scenarios.
~ 0.8 .. " .SI " 0 .. E '5
0.6
~ V>
a: 0.4 ;;;
1-
"' "', "' ~
0.2
Time (Years) Figure 5·5. Brine saturation in the Waste Panel region for replicate R1, scenario S2, CRA-2009 PA
1.0
" " .. 0~ c
0 ·;;; c .. E '0
0.6
~ a:
0.4 ;;; !;( ~I ~
02
2000 4000 6000 8000 1 0000
Time (Years) Figure 5-6. Brine saturation in the Waste Panel region for replicate R1, scenario S4, CRA-2009 PA.
40 of76

Information Only
Summary Report of the 2009 Compliance Recertification Application Performance Assessment
Revision 0
The brine saturation trends in the disturbed scenarios for the CRA-2009 PA are similar to the results obtained for the CRA-2004 PABC. The average and maximum brine saturations are comparable between the two analyses as well (see Table 6-15 in Nemer and Clayton (2008)]. As the intrusion creates a pathway for brine and gas to flow into and away from the repository, the effect of the increased porosity is minimized (Nemer and Clayton 2008).
Comparing PRCC' s between the saturation in the waste panel (W AS_SATB) and the uncertain parameters in the Latin hypercube sample identifies a number of parameters that contribute to the uncertainty in pressure for the disturbed scenarios. The relative importance of these parameters varies over the 10,000-year modeling period. Figure 5-7 and Figure 5-8 show the regression analysis results for saturation in the Waste Panel with uncertain parameters versus time for scenarios S2 and S4, replicate R1 from the CRA-2009 PA, respectively.
100 VECTOR CRA09 BRAG FLO RUNS FOR 52 1.00 ,,--,---,,---.,..-,--=;-::::==;===;::=:=--,--,-...,
0.75
r-~..r----0'7'"~-::-·•;__"_ .. _--_--_--_--_------------~------~------------------ Dependent Variable
\V --.. ---------------- - _w_AS __ s:;PRM 0.50
I .. ,-,•' .../'-.. ·········· WGRCOR --HALPOR
I ., / ------· BHPERM
~ 0.25 ,.,Ill ·--· - --- WA51WJCK
8 'i -:········ ...... . z 0.00 1++----------;or-==~~=::=.? .. --"'---~=-l ~ ~---- .. -··
.......
I -0.25 f- ~ ,.... ...... _..... ,..-----................ __ ....!-·:·:: __ ····~-~~----------------·_ l; 1\ I _. - --1> n I ....... ...-$ \: , .... -· .. _ ..... ~ -o.so r- \!! \... . .......
\ f
-
-0.75 f- ~ -
·l.OO I I I I I 0.0 1.5 3.0 4.5 6.0 7.5 9.0
TlME ( 9 10 3 Years)
Figure 5-7. Primary correlations of brine saturation in the Waste Panel region with uncertain parameters, replicate R1, scenario S2, CRA-2009 PA.
For scenario S2 (Figure 5-7), the DRZ permeability (DRZPRM) and the borehole permeability (BHPERM) have positive correlations. Increases in DRZ and borehole permeability accelerate brine flow into the waste. The corrosion rate for steel (WGRCOR) and the waste wicking parameter (W ASTWICK) are negatively correlated with the saturation, as these control the brine consuming reactions. The halite porosity (HALPOR) has a high positive correlation before the intrusion, which then decreases.
For scenario S4 (Figure 5-8), the largest positive correlation results from borehole permeability (BHPERM), with the DRZ permeability (DRZPRM), anhydrite permeability (ANHPRM) and the halite porosity (HALPOR) also showing high positive correlations. Increases in DRZ,
41 of 76

Information Only
Summary Report of the 2009 Compliance Recertification Application Perfonnance Assessment
Revision 0
borehole and anhydrite permeability accelerate brine flow into the waste, while increases in halite porosity increase the volume of brine available in the material overlying the waste, all of which control the amount of brine flow into and out of the repository. The corrosion rate for steel (WGRCOR) is negatively correlated with the saturation as this is a brine consuming reaction.
lOOVECTOR CRA09 BRAG FLO RUNS FOR 54 l.oo rr---,----,--co:.;===,===r-:='-,----, ' '
-·······················-- ---- ....
~--- ~ =~=-~-----1. /-~ '-'C.-.,__~-
_./ ..J -------- --
!'--_, --·- ---· I [ -
0.75
0.50
0.25
-o.so
.-(1.75 -
·l.OO I I I 0.0 1.5 3.0 4.5 6.0 7.5 9.0
TIME. (•10 3 Years)
Dependent Variable WAS_SATB
--DRZPRM -········· BHPfRM --HALPOR ------- WGRCOR --- ANHPRM
Figure 5-8. Primary correlations of brine saturation in the Waste Panel region with uncertain parameters, replicate R1, scenario S4, CRA-2009 PA.
5.3.3 Brine Flow Out of the Repository
This section describes the flow of brine up a borehole to the Culebra. Brine flow to the Culebra is important in calculating long-term releases to the Culebra. Direct brine flow up the borehole to the surface at the time of drilling is modeled separately in the DBR calculations, presented in Section 5.5.3.
Figure 5-9 shows cumulative brine flow out of the repository (BRNREPOC) for scenario S2. Scenario S2 represents an El intrusion at 350 years. At the time of the intrusion, brine flow from the Castile brine reservoir fills the repository. At 200 years after the intrusion when the borehole plugs above the repository are assumed to fail and the permeability of the borehole generally increases, most of the brine leaving the repository flows up the borehole to the Culebra. In vectors with low borehole permeability, the brine flow out of the repository does not change noticeably as a result of the borehole plug failure. Twelve hundred years after the drilling intrusion, the permeability of the borehole between the repository and the Castile is reduced by an order of magnitude because of creep closure, reducing brine flow into the repository and causing a corresponding decrease in brine out of the repository. This material change reduces
42 of76

Information Only
Summary Report of the 2009 Compliance Recertification Application Performance Assessment
Revision 0
brine flow out of the repository in some vectors, but does not appear to have a significant effect on the brine flow out of the repository in most vectors.
Figure 5-10 shows the volumes of brine that cross the LWB through the MBs for scenario S2. The largest outflow across the LWB is-127m3, which is significantly less than the undisturbed scenario results (see Section 4.1.3). As the intrusion creates a pathway to the Culebra, flow to the LWB is reduced. Brine crossing the LWB or moving up the shaft does not necessarily indicate releases from the repository, since the brine may not have been in contact with the waste; the brine may have been present in the MBs at the start of the regulatory period. Section 5.4 presents the results of the radionuclide transport calculations that determine the amount of radionuclides that may be released by transport in brine for the disturbed scenarios.
1.6
"'"' E
0
• 1.2
;:;; "' e;
0.8 u 0 "-w a: z a: "' 0.4
2000 4000 6000 8000 10000
Time (Years)
Figure 5-9. Total cumulative brine outflow in replicate R1, scenario S2, CRA-2009 PA.
The total cumulative brine flow away from the repository and the brine flow across the LWB in the disturbed scenarios for the CRA-2009 PA are similar to the results obtained for the CRA-2004 PABC. The average and maximum brine flows are comparable between the two analyses as well [see Table 6-18 in Nemer and Clayton (2008)]. As the intrusion creates a pathway for brine and gas to flow into and away from the repository, the effect of the increased porosity is minimized (Nemer and Clayton 2008).
Figure 5-11 shows cumulative brine flow out of the repository (BRNREPOC) for the BRAGFLO scenarios S4. Scenario S4 represents an E2 intrusion at 350 years. The results for the S4 scenario are very similar to the results for the undisturbed scenario, S 1 (see Section 4.1.3).
Figure 5-12 shows the volumes of brine that cross the LWB through the MBs for the BRAGFLO scenario S4. The largest outflow across the L WB is -1,200 m3, which is smaller than the undisturbed scenario results (see Section 4.1.3). As the intrusion creates a pathway to the
43 of76

Information Only
Summary Report of the 2009 Compliance Recertification Application Performance Assessment
Revision 0
Culebra, flow to the LWB is reduced. Brine crossing the LWB or moving up the shaft does not necessarily indicate releases from the repository, since the brine may not have been in contact with the waste; the brine may have been present in the MBs at the start of the regulatory period. Section 5.4 presents the results of the radionuclide transport calculations that determine the amount of radionuclides that may be released by transport in brine for the disturbed scenarios.
12 ,.... E
N
0 ;-
0.9
"N "' 0: u 0.6
::5 ...J <( <( 0:
"' 03
0.0 L_..._..._..._.J__,_L._.._.L._..__.__.__L_.__-'==...L...L-...1--'-...l 0 2()00 4000 6000 8000 1 0000
Time (Years) Figure 5-10. Brine flow via all MBs across the LWB in replicate R1, scenario S2, CRA-2009 PA.
Regression between total cumulative brine flow out of the waste-filled regions (BRNREPOC) and the uncertain parameters are shown in Figure 5-13 and Figure 5-14 for the BRAGFLO scenarios S2 and S4, respectively. For the S2 and S4 scenarios, the permeability of the DRZ (DRZPRM) the borehole permeability (BHPERM) and the porosity of undisturbed halite (HALPOR) have positive correlations. Increases in the DRZ and borehole permeability allow more brine to flow out of the repository. The increase in the halite porosity is correlated with the increase in pressure, and an increase in pressure increases the amount of brine flow out of the repository.
A negative correlation with the waste residual brine saturation (WRBRN5AT) is shown for both the 52 and 54 scenarios, which determines the immobile portion of the waste brine saturation, which then limits the amount of brine that can flow out of the waste-filled regions. The permeability of the concrete panel seal (CONPRM) is negatively correlated for the S2 scenario and positively correlated for the 54 scenario. The increased permeability of the concrete panel seal allows more brine to flow from the intruded panel to the remainder of the repository (flow into another panel is not considered out of the repository), reducing the higher pressure conditions in the intruded panel in the S2 scenario and therefore the flow out of the repository through the borehole, while for the S4 scenario, the increased permeability allows the brine from the remainder of the repository to flow into the depressurized intruded panel, increase the pressure and flow out of the repository up the borehole.
44 of76

Information Only
Summary Report of the 2009 Compliance Recertification Application Performance Assessment
~
E 3.0 •
0
•
;; 20 V>
g u 0 0-
"' "' z "' 1.0 "'
0 2000 4000 6000 8000 1 0000
Time(Years)
Figure 5-11. Total cumulative brine outflow in replicate R1, scenario 84, CRA-2009 PA.
1.0
,.,.... E
0 0.8 •
~ 0.6 V>
c;:
~ -' OA -' < < "' "'
0.2
Time (Years)
Revision 0
Figure 5-12. Brine flow via all MBs across the LWB in replicate R1, scenario 84, CRA-2009 PA
45 of76

Information Only
Summary Report of the 2009 Compliance Recertification Application Performance Assessment
r~----~------~----~1~00~V~E~a~O~R~CM~W~B~M~G~F~LO~RU~N~S~FO~R~S~2--,-----, l.OO I I
0.75 f-. --·································-
050
_ .. ··· \f\ / ~~--. , I f ·-------------------
'--------._ ___ J -----------------------------------------------------, '
0.25
i i
I' li -
J~
"I 0.00 l-+-+-------------------------------------------------1
I I ...-------~~ hi~~~~~~-------- ~/---------_
-o.25 I I ------=---===--· I I II II
-o.5o 1- \J -
v
-0.75 I- -
·LOO Ll_ __ _L_ __ L_ _ __jO ___ l__ O _ __jO ___ l__ 1 _ _]
0.0 1.5 3.0 4.5 ~.0 7.5 9.0
TIME (•to l Years)
Dependent Variable BRNREPOC
-- DRZPRM ••··•···•· BHPERM --CONPRM ------· HAlPOR --- WRBRNSAT
Revision 0
Figure 5-13. Primary correlations for cumulative brine flow away from repository with uncertain parameters, replicate R1, scenario 82, CRA-2009 PA.
100 VECTOR CRA09 BRAG FlO RUNS FOR S4 1.00 r~1 --~--~-.=;-,;.::::::==;-,==.=;==-~ ~-~
075 "--. r il ~-
050 ·;rr.r=:::::-:.~-----------------------------_ I .. --- -- - ·---- .
,_, I -._ ·-------- --·- -·--- ------ ----- ------'V
0.00 1-+---------------------------------------------------l
'
~25 ~\
\
-o.so I- \
.. __________ ----------0.75 ~
-
-
-
I' ' -1.00 l_L ___ L_ __ ..L __ _J. ___ L_ __ ..L __ _J. __ _
M 15 ~ U U U U
TIME ( *10 1
YE!ars)
-- DRZPRM .......... CONPRM -- BHPERM ------- WRBRNSAT --- HALPOR
Figure 5-14. Primary correlations for cumulative brine flow away from repository with uncertain parameters, replicate R1, scenario 84, CRA-2009 PA.
46 of76

Information Only
Summary Report of the 2009 Compliance Recertification Application Performance Assessment
5.4 RADIONUCLIDE TRANSPORT
Revision 0
In the disturbed scenarios, radionuclide transport in the Salado is calculated by the code NUTS (see Section 3.4). Radionuclide transport from the Salado to the Culebra is calculated by NUTS and PANEL (see Section 3.4). Radionuclide transport within the Culebra is calculated by SECOTP2D (see Section 3.8). For all radionuclide transport calculations, mobilized concentrations of radionuclides in Salado and Castile brines are computed by the code PANEL (see Section 3.2).
This section summarizes the radionuclide transport results for the disturbed scenarios. Nemer and Clayton (2008) describe the brine and gas flow in the Salado. Detailed analysis of the radionuclide transport in the Salado is presented in Ismail and Gamer (2008). Gamer and Leigh (2005) provide an analysis of the mobilized concentrations of radionuclides in Salado and Castile brines; Lowry and Kanney (2005) present an analysis of the flow and radionuclide transport within the Culebra.
5.4.1 Radionuclide Source Term
The code PANEL calculates the time-varying concentration of radionuclides mobilized in brine, either as dissolved isotopes or as isotopes sorbed to mobile colloids. Two different brines are considered: the interstitial brine present in the Salado Formation called GWB, which is magnesium rich; and the brine in the Castile Formation called ERDA-6, which is sodium rich. Radionuclide solubility in the two brines can be considerably different. Before an E1 intrusion, performance assessment assumes that the brine in the repository is GWB. After an El intrusion, brine in the repository is assumed to be ERDA-6 brine.
Figure 5-15 and Figure 5-16 show the concentration of radioactivity mobilized in Salado and Castile brines, respectively, as a function of time for all vectors in replicate Rl for the CRA-2009 P A. The results are identical to the CRA-2004 PABC results. Concentrations are expressed as EPA unitsfm3 to combine the radioactivity in different isotopes. Short-lived radionuclides, such as 238Pu, decay rapidly in the first few years. After this initial decay, the mobilized concentration is dominated by Am (Gamer and Leigh 2005); the concentration of Am is limited by its solubility until all the inventory of Am is in solution. After all Am is in solution, the total radionuclide concentration generally decreases as the Am decays, until the mobilized concentration becomes dominated by Pu (Gamer and Leigh 2005). The horizontal lines in the figures indicate periods of time when the total radionuclide concentration is limited by the solubility of Am (before about 3,000 years) or Pu (after about 6,000 years). Thus, the uncertainty in total radionuclide concentration is determined by the uncertainty factors used in the calculation of solubilities for Am and Pu.
47 of76

Information Only
Summary Report of the 2009 Compliance Recertification Application Performance Assessment
'o'
0.0 3.0 4.5 ().0 '·' 0.0
TIME- Years(' 1 0~
Figure 5-15. Total mobilized concentrations in Salado brine, replicate R1, CRA-2009 PA.
'""
0.0 3.0 4.5 6.0 ,_, 9.0
TIME·Years(~IO ~
Figure 5-16. Total mobilized concentrations in Castile brine, replicate R1, CRA-2009 PA.
5.4.2 Transport through Marker Beds and Shaft
Revision 0
In the disturbed scenarios, of the 300 realizations, only vectors 53 and 59 in replicate Rl resulted in transport of radionuclides through the MBs and across the LWB, with a maximum total
48 of76

Information Only
Summary Report of the 2009 Compliance Recertification Application Performance Assessment
Revision 0
integrated activity of 3.6xl0-10 EPA units (Ismail and Garner 2008). This is comparable to the CRA-2004 PABC results for maximum integrated activity which had 2.4x10⁻¹² EPA units at the boundary (Lowry 2005). The releases through the MBs and across the LWB are insignificant when compared to releases from drilling intrusions. In addition, no realization showed transport of radionuclides through the shaft to the Culebra.
5.4.3 Transport to the Culebra
Radionuclide transport to the Culebra via a single intrusion borehole (disturbed scenarios S2, S3, S4, and S5) is modeled with the code NUTS. Transport to the Culebra in the multiple intrusion scenario (S6), is modeled with the code PANEL. Detailed discussion of the radionuclide transport to the Culebra calculations can be found in Ismail and Garner (2008).
5.4.3.1 Single Intrusion Scenarios
Figure 5-17 through Figure 5-20 show cumulative radioactivity transported up the borehole to the Culebra in the single intrusion scenarios. Transport to the Culebra is larger and occurs for more vectors in the S2 and S3 scenarios (El intrusions) than in the S4 or S5 scenarios (E2 intrusions). For most vectors that show significant transport, most of the transport occurs over a relatively short period of time, immediately after the borehole plugs fail.
102
101
~ 10°
c
"' 1Q·1 <( n. w 10·2 ~
fJ)
ill 1()-3 (1l Q)
Q) ~
(1l 104
0 f- 10·5
10·6
10·7
0 2000 4000 6000 8000 10000
Time (years) Figure 5-17. Cumulative normalized release to the Culebra, scenario S2, CRA-2009 PA.
49 of76

Information Only
Summary Report of the 2009 Compliance Recertification Application Performance Assessment
102
101
Vi' 10° .-t= c :::J 1Q·1
<( ()_ w 11]-2 ~
lfJ (I) lfJ 1D-' ro (I)
(I) ~
1Q4 ro ~
0 1- 1D-'
1D-'
1D-' 0 2000 4000 6000 8000 10000
Time (years) Figure 5-18. Cumulative normalized release to the Culebra, scenario 83, CRA-2009 PA.
102
101
Vi' 10°
"" c ::J 1D-'
<( ()_ w 1D-' ~
lfJ (I) lfJ 1D-' ro (I)
(I) ~
10-" ro ~
0 1- 1()-5
1D-'
1Q-7
0 2000 4000 6000 8000 10000
Time (years) Figure 5-19. Cumulative normalized release to the Culebra, scenario 84, CRA-2009 PA.
50 of76
Revision 0
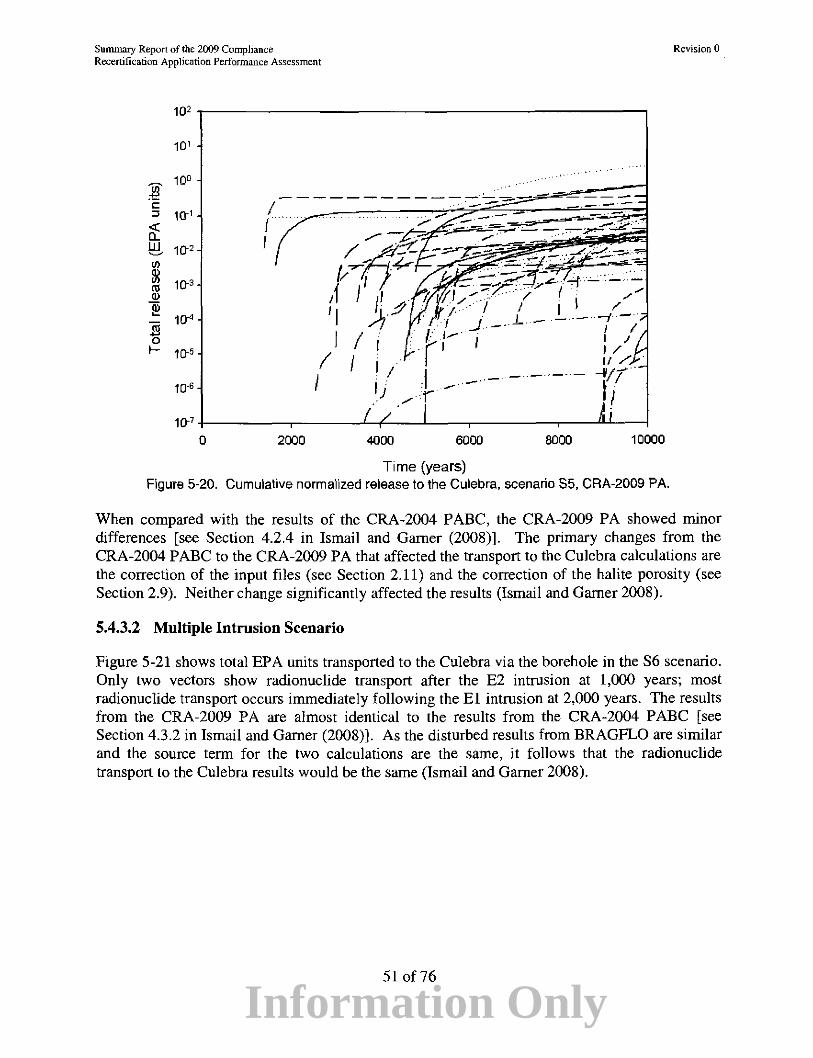
Information Only
Summary Report of the 2009 Compliance Recertification Application Performance Assessment
102
101
00' 10°
"" <::: ::::J 1D-' <( Q_ w 1D-' ~
"' 3l 1D-' (I) Q)
~
.lY 10""
0 f-- 1D-'
10-6
1D-'
0 2000
' ............ .
4000 6000 8000 10000
Time (years) Figure 5-20. Cumulative normalized release to the Culebra, scenario S5, CRA-2009 PA.
Revision 0
When compared with the results of the CRA-2004 PABC, the CRA-2009 PA showed minor differences [see Section 4.2.4 in Ismail and Gamer (2008)]. The primary changes from the CRA-2004 PABC to the CRA-2009 PA that affected the transport to the Culebra calculations are the correction of the input files (see Section 2.11) and the correction of the halite porosity (see Section 2.9). Neither change significantly affected the results (Ismail and Gamer 2008).
5.4.3.2 Multiple Intrusion Scenario
Figure 5-21 shows total EPA units transported to the Culebra via the borehole in the S6 scenario. Only two vectors show radionuclide transport after the E2 intrusion at 1,000 years; most radionuclide transport occurs immediately following the El intrusion at 2,000 years. The results from the CRA-2009 PA are almost identical to the results from the CRA-2004 PABC [see Section 4.3.2 in Ismail and Gamer (2008)]. As the disturbed results from BRAGFLO are similar and the source term for the two calculations are the same, it follows that the radionuclide transport to the Culebra results would be the same (Ismail and Gamer 2008).
51 of76

Information Only
Summary Report of the 2009 Compliance Recertification Application Perfonnance Assessment
10'
102
10'
Cil ·"' c: 100 ::l <( 0.. !:!:!. 10-1
"' '" "' (tJ 10.2 Q)
~ ~ 10-3 0 f-
10.4
10"5 ! .
10 .. 0.0 2.0
Revision 0
4.0 6.0 8.0 10.0
Time (Years in thousands)
Figure 5-21. Cumulative normalized release to the Culebra, replicate R1, scenario S6, CRA-2009 PA.
5.4.4 Transport through the Culebra
Radionuclide transport through the Culebra for a given set of uncertain parameters is calculated with the code SECOTP2D (see Section 3.8). Note that the total release of radionuclides across the LWB at the Culebra for given futures is calculated with the code CCDFGF by convolving the SECOTP2D results with the radionuclide transport to the Culebra calculated by NUTS and PANEL. This section discusses the SECOTP2D results; total releases through the Culebra are presented in Section 6.4.
Culebra radionuclide transport calculations were performed for three replicates of 100 vectors each for both partial-mining and full-mining scenarios (600 total simulations). Each of the 600 radionuclide transport simulations used a unique flow field computed separately with the code MODFLOW [see Section 3.8 and Lowry and Kanney (2005)]. The partial-mining scenario assumes the extraction of all potash reserves outside the LWB while full mining assumes that all potash reserves both inside and outside the LWB are exploited.
In each radionuclide transport simulation, I kg of each of four radionuclides (241Am, 234U, 23D'fh, and 239Pu) are released in the Culebra above the center of the waste panel area. Radionuclide transport of the 23D'fh daughter product of 234U decay is calculated and tracked as a separate species. In the following discussion, 230'fh will refer to the 234U daughter product and 230ThA will refer to that released at the waste panel area.
All SECOTP2D results, regardless of magnitude, are included in the calculation of releases through the Culebra. In practice, most non-zero releases computed by SECOTP2D are
52 of76

Information Only
Summary Report of the 2009 Compliance Recertification Application Pctiormance Assessment
Revision 0
vanishingly small and result from numerical error (Lowry and Kanney 2005). Consequently, the analysis of SECOTP2D results focused on realizations in which at least one billionth ( 1 0-9) of the 1 kg source was transported to the LWB.
More detailed information on the results of the Culebra radionuclide transport calculations can be found in the Analysis Package for the Culebra Flow and Transport Calculations: Compliance Recertification Application Performance Assessment Baseline Calculations (Lowry and Kanney 2005).
5.4.4.1 Partial Mining Results
Under partial-mining conditions, only the 234U species and its 230Th decay product were transported to the LWB in any significant amount during the course of the 10,000-year simulation (Lowry and Kanney 2005). Table 5-2 shows that no releases greater than one billionth of the 1 kg source were calculated for replicates Rl and R3. For replicate R2, three vectors produced 23"U releases greater than 10·9 kg. One of the three vectors also resulted in a 23~h release greater than 10-9 kg. The results are identical to the CRA-2004 PABC results.
Table
R3 0 0 0 0 0 1. Number vectors have releases (transport to LWB) greater than
one billionth of the 1 kg source released at center of waste panel. 2. 23D-rhA refers to thorium released at the waste panel area. 23~ refers
to thorium resulting from 234U decay.
Sensitivity analysis indicates that releases of 234U in the partial mining condition is associated with the +VI oxidation state. This result is reasonable because the matrix distribution coefficients for uranium in the +IV state are much lower than for the +VI state.
5.4.4.2 Full Mining Results
Under full-mining conditions, only the 234u species and its 23~h decay product were transported to the LWB in any significant amount during the course of the 10,000-year simulation. More vectors resulted in releases greater than 10-9 kg for the full-mining scenario than were seen under partial mining conditions. In addition, releases greater than 10-9 kg were calculated for all three replicates. Table 5-3 shows that three vectors in replicate Rl, six vectors in replicate R2, and three vectors in replicate R3 had 234U releases greater than 10·9 kg. None of the three vectors in replicate Rl, three of the six in replicate R2 and one of the three in replicate R3 showed a 234U release greater than 10-9 kg showed a release of 230Th daughter product greater than 10-9 kg. The results are identical to the CRA-2004 PABC results.
53 of76
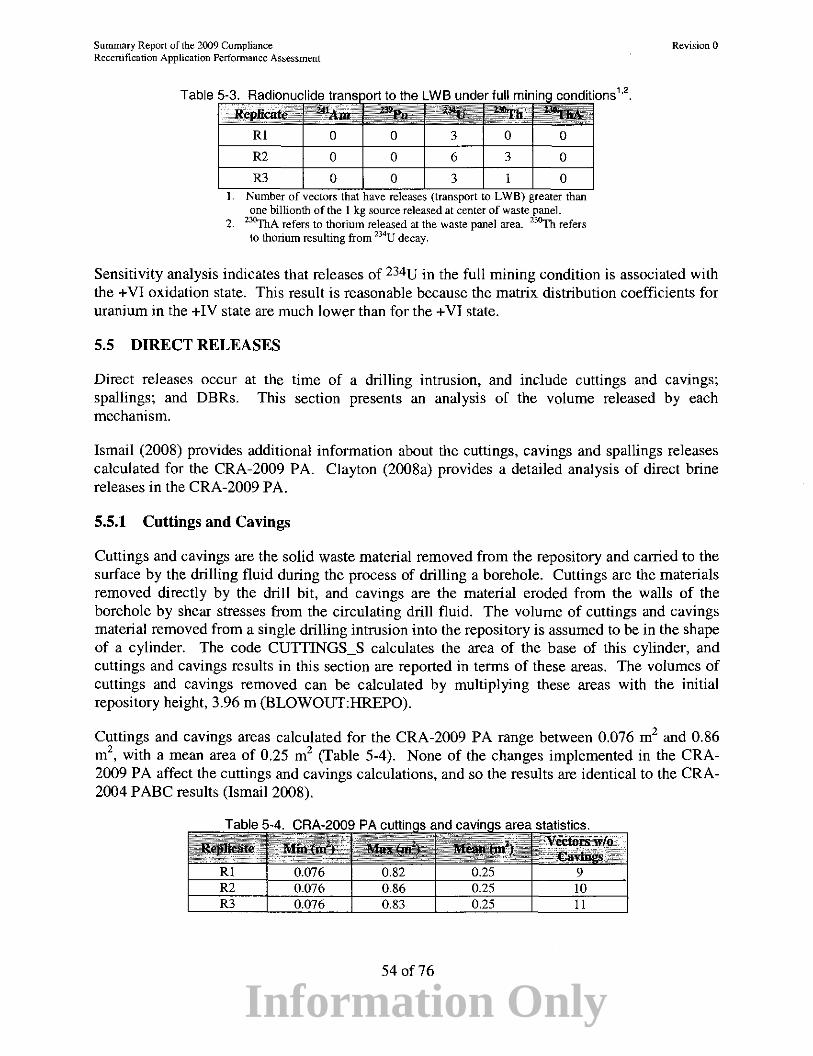
Information Only
Summary Report of the 2009 Compliance Recertification Application Performance Assessment
Rl R2 R3
3 0
3 1 0 1. Number of vectors (transport to LWB) greater
one billionth of the 1 kg source released at center of waste panel. 2. ~A refers to thorium released at the waste panel area_ 2~ refers
to thorium resulting from 234U decay.
Revision 0
1,2
Sensitivity analysis indicates that releases of 234U in the full mining condition is associated with the +VI oxidation state. This result is reasonable because the matrix distribution coefficients for uranium in the +IV state are much lower than for the +VI state.
5.5 DIRECT RELEASES
Direct releases occur at the time of a drilling intrusion, and include cuttings and cavings; spallings; and DBRs. This section presents an analysis of the volume released by each mechanism.
Ismail (2008) provides additional information about the cuttings, cavings and spallings releases calculated for the CRA-2009 P A. Clayton (2008a) provides a detailed analysis of direct brine releases in the CRA-2009 PA.
5.5.1 Cuttings and Cavings
Cuttings and cavings are the solid waste material removed from the repository and carried to the surface by the drilling fluid during the process of drilling a borehole. Cuttings are the materials removed directly by the drill bit, and cavings are the material eroded from the walls of the borehole by shear stresses from the circulating drill fluid. The volume of cuttings and cavings material removed from a single drilling intrusion into the repository is assumed to be in the shape of a cylinder. The code CUTTINGS_S calculates the area of the base of this cylinder, and cuttings and cavings results in this section are reported in terms of these areas. The volumes of cuttings and cavings removed can be calculated by multiplying these areas with the initial repository height, 3.96 m (BLOWOUT:HREPO).
Cuttings and cavings areas calculated for the CRA-2009 PA range between 0.076 m2 and 0.86 m2
, with a mean area of 0.25 m2 (Table S-4). None of the changes implemented in the CRA-2009 PA affect the cuttings and cavings calculations, and so the results are identical to the CRA-2004 PABC results (Ismail 2008).
54 of76

Information Only
Summary Report of the 2009 Compliance Recertification Application Performance Assessment
Revision 0
Two uncertain sampled parameters affect the cavings calculations. The uncertainty in cavings areas arises primarily from the uncertainty in the shear strength of the waste (Ismail 2008). Lower shear strengths tend to result in larger cavings (Figure 5-22). The uncertainty in the drill string angular velocity has a smaller impact on the cavings results, but the combination of a low angular velocity and high shear strength can prohibit cavings from occurring (Figure 5-23). In fact, cavings did not occur in ten percent of all vectors (Table 5-4).
1
• Replicate 1 ~ • Replicate 2
N [] Replicate 3 E
~
(1! Q)
< UJ en c ·:; (1!
u ""0 c (1!
en c E ::I u
0.1
0.01 0.1 10 100
Waste Shear Strength (Pa) Figure 5-22. Scatter plot of cuttings and cavings areas versus shear strength, CRA-2009 PA.
5.5.2 Spallings
Calculation of the volume of solid waste material released to the surface from a single drilling intrusion into the repository due to spallings is a two-part procedure. The code DRSPALL calculates the spallings volumes from a single drilling intrusion at four values of repository pressure (10, 12, 14, and 14.8 MPa). The second step in calculating spallings volumes from a single intrusion consists of using the code CUTTINGS S to interpolate the DRSPALL volumes. The spallings volume for a vector is then determined in CUTTINGS_S by linearly interpolating the volume calculated by DRSPALL based on the pressure calculated by BRAGFLO. Results from both of these calculations are documented in this section.
55 of76

Information Only
Summary Report of the 2009 Compliance Recertification Application Performance Assessment
100.-------------------------------------------~
10
0.1
• • • •r-------------~
• •
e No cavings
• Area< 0.1 m2
8 0.1 m2 <Area< 0.25 m2
+ 0.25 m2 <Area< 0.5 m2
..t. 0.5 m2 <Area c_ _______ _,
0.01 +-+-+-+--+-+--+--+--+--+--1---+---+--+--+--+-+--+--+--+--+--+-_,_J
2.5 7.5 12.5 17.5 22.5
Drill String Angular Velocity (dimensionless units)
Revision 0
Figure 5-23. Scatter plot of drill string angular velocity versus shear strength, CRA-2009 PA. Symbols indicate the range of cuttings and cavings areas in square meters.
5.5.2.1 DRSPALL Results
The code DRSPALL was run for each of 100 vectors in three replicates and for four values of repository pressure (10, 12, 14, and 14.8 MPa). No spallings occurred at 10 MPa for any vector. None of the changes implemented in the CRA-2009 PA affect the DRSPALL calculations, and so the results from the CRA-2004 PABC were used in the CRA-2009 PA.
The uncertainty in the spallings volumes arises from four variables that are uncertain in the DRSP ALL calculations: waste permeability, waste porosity, waste tensile strength, and waste particle diameter after tensile failure. Figure 5-24 indicates that the largest spallings volumes occur when waste permeability is less than l.Oxl0-13 m2
, but larger permeability values result in a higher frequency of nonzero spallings volumes. This observation can be explained as follows: the higher permeability values that were sampled result in smaller tensile stresses and less tensile failure, but promote fluidization. Lower permeability leads to greater tensile stresses and tensile failure, but failed material may not be able to fluidize at this low permeability.
Smaller particle diameter values (see Figure 5-25) tend to result in larger spallings volumes and a higher frequency of nonzero spallings volumes. The uncertainty in the spallings volumes from a single intrusion is largely determined by the uncertainty in these two parameters. Obvious correlations between spallings volumes and the two other parameters could not be established.
56 of76
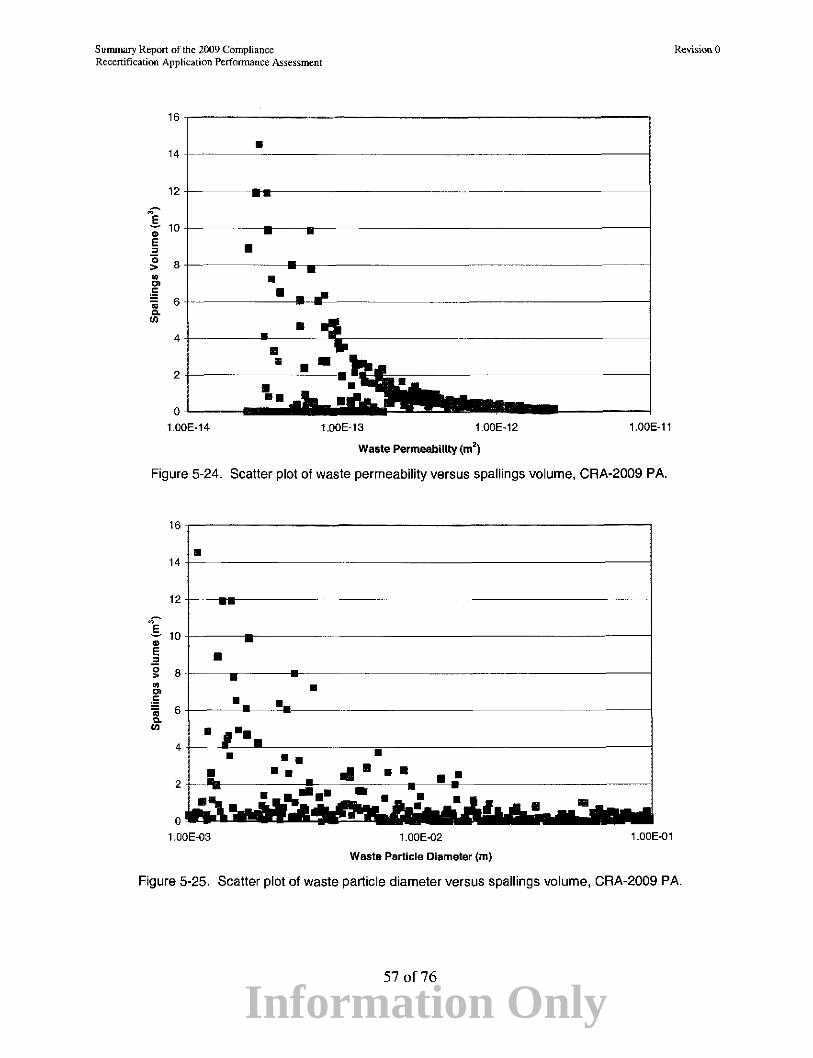
Information Only
Summary Report of the 2:009 Compliance Recertification Application Performance Assessment
16
14
12
l 10 " E ::J
0 8 > .. "' :§
6 o; Q.
<I)
4
2
0
•
•
• •
• •• 1.00E-14 1.00E-13 1.00E-12
Waste Permeability (m2)
1.00E-11
Figure 5-24. Scatter plot of waste permeability versus spallings volume, CRA-2009 PA.
16
• 14
12
.,. s 10 " E • ::J
0 8 >
"' • "' :§ • o; 6 Q.
<I) • 4 • 2
0
1.00E-Q3 1.00E-02 1.00E-01
Waste Particle Diameter (m)
Revision 0
Figure 5-25. Scatter plot of waste particle diameter versus spallings volume, CRA-2009 PA.
57 of76
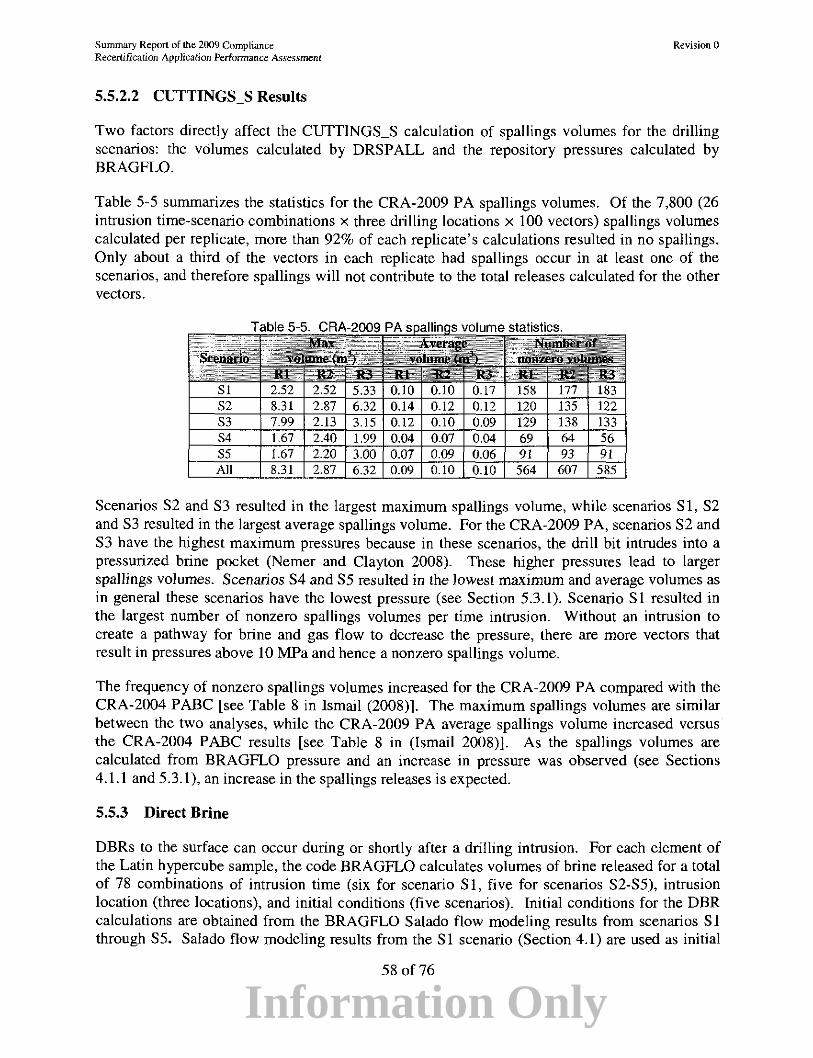
Information Only
Summary Report of the 2009 Compliance Recertification Application Perforrrumce Assessment
5.5.2.2 CUTTINGS_S Results
Revision 0
Two factors directly affect the CUTTINGS_S calculation of spallings volumes for the drilling scenarios: the volumes calculated by DRSPALL and the repository pressures calculated by BRAGFLO.
Table 5-5 summarizes the statistics for the CRA-2009 PA spallings volumes. Of the 7,800 (26 intrusion time-scenario combinations x three drilling locations x 100 vectors) spallings volumes calculated per replicate, more than 92% of each replicate's calculations resulted in no spallings. Only about a third of the vectors in each replicate had spallings occur in at least one of the scenarios, and therefore spallings will not contribute to the total releases calculated for the other vectors.
Scenarios 82 and S3 resulted in the largest maximum spallings volume, while scenarios S 1, S2 and S3 resulted in the largest average spallings volume. For the CRA-2009 PA, scenarios S2 and S3 have the highest maximum pressures because in these scenarios, the drill bit intrudes into a pressurized brine pocket (Nemer and Clayton 2008). These higher pressures lead to larger spallings volumes. Scenarios S4 and 85 resulted in the lowest maximum and average volumes as in general these scenarios have the lowest pressure (see Section 5.3.1). Scenario S1 resulted in the largest number of nonzero spallings volumes per time intrusion. Without an intrusion to create a pathway for brine and gas flow to decrease the pressure, there are more vectors that result in pressures above I 0 MPa and hence a nonzero spal!ings volume.
The frequency of nonzero spallings volumes increased for the CRA-2009 PA compared with the CRA-2004 PABC [see Table 8 in Ismail (2008)]. The maximum spallings volumes are similar between the two analyses, while the CRA-2009 PA average spallings volume increased versus the CRA-2004 PABC results [see Table 8 in (Ismail 2008)]. As the spallings volumes are calculated from BRAGFLO pressure and an increase in pressure was observed (see Sections 4.1.1 and 5.3.1 ), an increase in the spallings releases is expected.
5.5.3 Direct Brine
DBRs to the surface can occur during or shortly after a drilling intrusion. For each element of the Latin hypercube sample, the code BRAGFLO calculates volumes of brine released for a total of 78 combinations of intrusion time (six for scenario S 1, five for scenarios S2-S5), intrusion location (three locations), and initial conditions (five scenarios). Initial conditions for the DBR calculations are obtained from the BRAG FLO Salado flow modeling results from scenarios S 1 through S5. Salado flow modeling results from the Sl scenario (Section 4.1) are used as initial
58 of76

Information Only
Summary Report of the 2009 Compliance Recertifkati.oo Application Performance Assessment
Revision 0
conditions for DBR for a first intrusion into the repository which may have a DBR. Salado flow modeling results from the S2 through S5 scenarios (Section 5.3) are used as initial conditions for DBR for second or subsequent drilling intrusions that may have a DBR.
Summary statistics of the calculated DBR volumes for replicate Rl of the CRA-2009 PA are shown in Table 5-6. As seen in Table 5-6, 1,001 of the 7,800 DBR calculations (100 vectors x 78 combinations) resulted in a nonzero DBR volume to the surface, the majority of which resulted from scenarios S2 and S3. The maximum DBR volume is approximately 59m3
, with an average volume of 0.9 m3
. Only intrusions into a Lower panel [see Section 6.2 of Clayton (2008a)] resulted in significant DBR volumes. In the Sl scenario, the Lower panel represents an undisturbed panel at the south end of the repository. In the S2 and S3 scenarios, the Lower panel represents any panel that has had a previous E 1 intrusion; in the S4 and S5 scenarios, the Lower panel represents any panel that has had a previous E2 intrusion. DBR volumes are larger and occur more frequently in the S2 and S3 scenarios, because the Lower panel has a much higher saturation after an E 1 intrusion.
Table 5~ CRA 2009 PA DBR volume statistics -Max Average Number of
Scenario vol:~e vol:~ nonzero lm lm volumes
SI 19 0.1 122 S2 59 2.9 385 S3 44 1.5 317 S4 19 0.1 70 S5 21 0.1 107 All 59 0.9 1,001
The frequency of nonzero DBR volumes increased for the CRA-2009 PA compared with the CRA-2004 PABC [see Table 6-1 in Clayton (2008a)]. The maximum DBR volume is lower for the CRA-2009 PA [see Table 6-1 in Clayton (2008a)]. The CRA-2009 PA average DBR volume increased versus the CRA-2004 PABC results [see Tables 6-2 through 6-5 in Clayton (2008a)]. The increase in the frequency of nonzero and average DBR volume is due to the porosity correction, while the decrease in the maximum DBR volume is because of the reduction in the maximum DBR duration parameter (Clayton 2008a).
Previous sensitivity analyses have determined that a DBR volume from a single intrusion is most sensitive to the initial pressure and brine saturation in the intruded panel. This analysis is repeated below for scenario S2, for the CRA-2009 PA. The initial pressure and brine saturation in the DBR calculations are transferred from the Salado flow calculations as described above. Thus, the uncertain parameters that are most influential to the uncertainty in pressure and brine saturation in the Salado flow calculations (see Section 4.1 and 5.3) are also most influential in the uncertainty in DBR volumes.
The combination of relatively high pressure and brine saturation in the intruded panel is required for direct brine release to the surface. Figure 5-26 shows a scatter plot of pressure in the waste panel versus DBR volumes for scenario S2, Lower intrusion, with symbols indicating the value of the mobile brine saturation [defined as brine saturation minus residual brine saturation in the waste]. The figure clearly shows that there are no releases until pressures exceed about 8 MPa as
59 of76

Information Only
Summary Report of the 2009 Compliance Recertification Application Performance Assessment
Revision 0
indicated by the vertical line. Above 8 MPa, a significant number of vectors have zero releases, but these vectors have mobile brine saturations less than zero and thus no brine is available to be released. When mobile brine saturation approaches I, relative permeability of the gas becomes small enough that no gas flows into the well, and in these circumstances DBR releases end after three days. Thus, in vectors with high mobile brine saturations, DBR releases increase proportionally with increases in pressure, as evidenced by the linear relationship between DBR volume and pressure for mobile brine saturation between 0.8 and 1.0. For vectors with mobile saturations between 0.2 and 0.8, both gas and brine can flow in the well, and the rate of gas flow can be high enough that the ending time ofDBR releases may be as long as 4.5 days. Although brine may be flowing at slower rates in these vectors than in vectors with high mobile saturations, brine flow may continue longer and thus result in larger DBR volumes.
Pressure vs. DBR Volume, S2 Lower Intrusion CRA-2009
80~====~---------r---------------------l 0 0-0.2 0 0.2-0.4 • 0.4-0.6
60 X 0.6-0.8
+ 0.8-1.0
2 4 6
X
• r:P X
8 10
Pressure (MPa)
+ .x •
• • X
·~x~ • 0
1' 0 0 • 0
0
0 0
otfofll 0 0 0
0
12 14 16
Figure 5-26. Sensitivity of DBR volumes to pressure and mobile brine saturation, replicate R1, scenario 52, Lower panel, CRA-2009 PA. Symbols indicate the range of mobile brine saturation given in the
legend.
60 of76

Information Only
Summary Report of the 2009 Compliance Recertification Application Performance Assessment
6. NORMALIZED RELEASES
Revision 0
This section presents a discussion of each of the four categories of releases that constitute the total release: cuttings and cavings; spallings; DBRs; and transport releases, followed by the total normalized releases for the CRA-2009 PA. In summary, despite the changes and corrections made between the CRA-2004 PABC and the CRA-2009 PA, there were no major changes in the overall pattern of releases. Cuttings, cavings and DBRs remain the most significant pathways for release of radioactive material to the land surface. Release by subsurface transport in the Salado or Culebra continue to make essentially no contribution to total releases. Finally, the resulting CCDFs of both analyses are within regulatory limits.
Rank regression analysis was used to evaluate the sensitivity of the output variables to the sampled parameters. Scatter plots of the dependent versus independent rank transformed variables resulting from the sensitivity analysis were examined to determine if there were any obvious non-monotonic relationships. Obvious non-monotonic relationships were not found although there are cases involving inputs that are categorized as discrete variables (e.g., OXSTAT) and cases where there are large proportions of the vectors showing no release (e.g., CULREL). Application of linear regression to such cases is somewhat problematic in terms of the assumptions of normally-distributed residuals and homogeneous variance among the residuals. However, in terms of ranking the relative importance of the parameters these issues are probably not significant. Details of the analysis can be found in Kirchner (2008b).
6.1 CUTTINGS AND CA VINGS
The overall mean CCDFs for cuttings and cavings releases from the CRA-2009 PA and the CRA-2004 PABC are shown in Figure 6-1. These resulting overall mean CCDFs are very similar, with only a slight increase in the CRA-2009 PA mean due to the increase in the drilling rate.
The rank regression analysis showed that the waste shear strength controls about 98% of the variability in mean cuttings and cavings releases in both the CRA-2009 PA and CRA-2004 P ABC (Kirchner 2008b ). Cuttings and caving releases are primarily controlled by the volume of cuttings and cavings produced, which in turn is a highly non-linear function of the waste shear strength (Ismail 2008).
61 of76

Information Only
Summary Report of the 2009 Compliance Recertification Application Performance Assessment
" h
• • • .. • " " 1S • ~ e ..
10,-------------------------------------.-----------------,
0.1
0.01
I ~ ~ PABC Overall Mean ···----~ ··-···-+------1- - - CRA-2009 Overall Mean
1
1 - -Release Limits '
I -----+.------ - - I
I I
'--·-1
I I
0.001 --·-·--··-------··---·--·--·- ----- -- - - __ ... 0.0001 "-~~~.......,-~~~---~~~-~~...Jo~+-~-~.......,--~~~4
0.0001 0.001 0.01 0.1 10 100
R • Release (EPA Units)
Revision 0
Figure 6-1. Overall mean CCDFs for cuttings and cavings releases: CRA-2009 PA and CRA-2004 PABC.
6.2 SPALLINGS
Figure 6-2 shows the overall mean spallings release CCDFs from the CRA-2009 PA and the CRA-2004 P ABC. This increase in overall mean spallings release values can be directly attributed to an increase in overall mean spallings volumes, with a small increase due to the increase in the drilling rate. The frequency of non-zero spallings volumes calculated by CUTTINGS_S increased. CUTTINGS_S interpolates the DRSPALL volumes using repository pressures calculated by BRAGFLO to calculate the spallings volume released from a single intrusion for the WIPP P A intrusion scenarios. These increases are largely attributable to the increase in pressure in the repository as a result of the larger amounts of brine available. The increase of the brine in the repository is due to higher DRZ porosities (Ismail2008).
The rank regression analysis indicates that the dominant parameter with regard to controlling spallings releases in the CRA-2009 PA is the intact halite porosity (Kirchner 2008b ). Its higher ranking in the CRA-2009 PA analysis compared to the CRA-2004 P ABC analysis may be due to the increase in the maximum value of its distribution. The positive correlation is due to the increased pressures which resulted from the porosity increase (see Sections 4.1.1 and 5.3.1). A negative correlation is observed for the particle diameter for disaggregated waste, which is due to the tendency to have greater fluidization at smaller particle diameters (Kirchner 2008b ).
62 of76

Information Only
Summary Report of the 2009 Compliance Recertification Application Performance Assessment
10r------------------------------------.-----------------.
1-
"' A
I ~ 1 0.01 ..
0.001
--CRA-2004 PABC Overall Mean
• • .. CRA-2009 Overall Mean
1 - -Release Limits
I - _____ _j ____ --.-
I I
- - ------- - _L_ __ I I I
0.0001 +---~~---~--~-----~~-----------~~--------_._._.j 0.0001 0.001 0.01 0.1 10 100
R • Release (EPA Units)
Revision 0
Figure 6-2. Overall mean CCDFs for spallings releases: CRA-2009 PA and CRA-2004 PABC.
6.3 DIRECT BRINE
The overall mean CCDFs for DBRs from the CRA-2009 PA and the CRA-2004 PABC are shown in Figure 6-3. At all probabilities, the CRA-2009 PA mean DBRs increased from the CRA-2004 PABC values, particularly at higher probabilities. DBR volumes were higher on average in the CRA-2009 PA than in the CRA-2004 PABC, but the maximum values in the CRA-2009 PA are lower than in the CRA-2004 PABC. This increase in overall DBRs can be directly attributed to an increase in overall mean DBR volumes, with a small increase due to the increase in the drilling rate. The frequency of non-zero DBR volumes also increased. The frequency and volume of the DBR are strongly correlated to the repository pressure. These increases are largely attributable to the increase in pressure in the repository as a result of the larger amounts of brine available. The increase of the brine in the repository is due to higher DRZ porosities (Clayton 2008a).
The rank regression analysis shows that four variables, the "solubility multiplier" that represents uncertainty in solubilities for all actinides in the +III oxidation state (Xiong et a!. 2005), the initial brine pore pressure in the Castile Formation, the inundated corrosion rate for steel and frequency with which Castile brine intrudes the repository due to a drilling event, account for more than 50% of the uncertainty in DBRs for the CRA-2009 PA (Kirchner 2008b). These variables are also important in the CRA-2004 P ABC analysis although the third- and fourthranked variables are in reverse order relative to the CRA-2009 PA (Kirchner 2008b ).
The solubility of actinides impacts their concentration in DBRs and the corrosion of iron is expected to produce gas, but at the same time it consumes water. When the repository is flooded with brine from the intrusion of a brine pocket it is likely that the influence on DBR would be positive since the production of hydrogen would outweigh the minimal impact of the
63 of76

Information Only
Summary Report of the 2009 Compliance Recertification Application Perfonnance Assessment
Revision 0
consumption of water. However, a negative correlation is observed between the ranked variables, suggesting that the corrosion of steel has its strongest influence when the repository is not saturated and DBRs are expected to be small. The frequency with which Castile brine intrudes the repository due to a drilling event and the initial pressure of that brine affect the pressure in the repository. As DBR volumes are a strong function of pressure, a positive correlation is expected and shown (Kirchner 2008b ).
1 ----------··-
0: h
j ........ - .. . . . r---....:...:...:.· ;:_· .. 0.1 l
~
J 0.01
0.001 --·-------··-- ---·---. -·--
CRA-2004 PABC Overall Mean !
--- -1-- - * • • CRA-2009 Overall M~o ' 1 - -Release Um1ts
I I -, ---
1 I
------- I -----1
I I
0.0001 +-~~~--~-~.,_~~~~r-~--~--"--~~.,_-~-~ 0.0001 0.001 0.01 0.1 10 100
R =Release (EPA Units)
Figure 6-3. Overall mean CCDFs for DBRs: CRA-2009 PA and CRA-2004 PABC.
6.4 GROUNDWATER TRANSPORT
Figure 6-4 shows the mean CCDF for normalized releases due to transport through the Culebra for replicate R2 of the CRA-2009 PA and the CRA-2004 P ABC. No transport releases larger than 10"6 EPA units occurred in replicates Rl and R3. Normalized transport releases for the CRA-2009 PA are qualitatively similar to the CRA-2004 PABC results in that only one replicate (R2) exhibits releases that are siguificantly larger than the numerical error inherent in the transport calculations. Overall, the mean releases for replicate R2 of the two analyses are quite similar and the numbers of vectors that had releases are identical, with only a slight increase in the CRA-2009 PA due to the increase in the drilling rate (Dunagan 2008).
64 of76
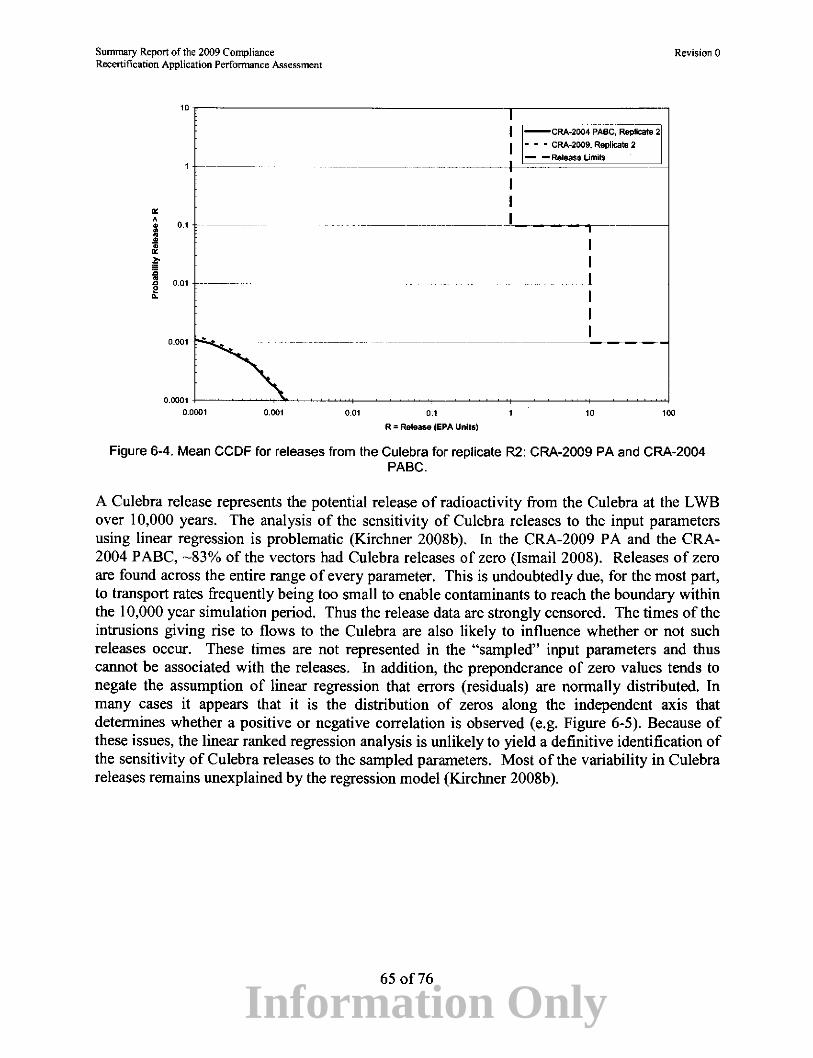
Information Only
Summary Report of the 2009 Compliance Recertification Application Performance Assessment
10r-----------------------------------,~-----------------,
1 '------
" •
I 0.1
i J 0.01 -------
I [.-------ccccRAc--2ccOO:-c4-::-PAB=c.-=R-epc:-l<at-ce--cJ2
1 - - - CRA-2009, Replicate 2 - -Release Umits --- ----- --------+-'=~~~~=~
I I
. -------- ------ __ j ______ ~~..----------
1 I
. ----------- ---- --- _______ l_ ______ _
I I
0000~ --
I ----------------------------
0 0001
Revision 0
0.0001 0.001 0.01 0.1 10 100
R = Release (EPA Units)
Figure 6-4. Mean CCDF for releases from the Culebra for replicate R2: CRA-2009 PA and CRA-2004 PABC.
A Culebra release represents the potential release of radioactivity from the Culebra at the L WB over 10,000 years. The analysis of the sensitivity of Culebra releases to the input parameters using linear regression is problematic (Kirchner 2008b). In the CRA-2009 PA and the CRA-2004 PABC, -83% of the vectors had Culebra releases of zero (Ismail2008). Releases of zero are found across the entire range of every parameter. This is undoubtedly due, for the most part, to transport rates frequently being too small to enable contaminants to reach the boundary within the 10,000 year simulation period. Thus the release data are strongly censored. The times of the intrusions giving rise to flows to the Culebra are also likely to influence whether or not such releases occur. These times are not represented in the "sampled" input parameters and thus cannot be associated with the releases. In addition, the preponderance of zero values tends to negate the assumption of linear regression that errors (residuals) are normally distributed. In many cases it appears that it is the distribution of zeros along the independent axis that determines whether a positive or negative correlation is observed (e.g. Figure 6-5). Because of these issues, the linear ranked regression analysis is unlikely to yield a definitive identification of the sensitivity of Culebra releases to the sampled parameters. Most of the variability in Culebra releases remains unexplained by the regression model (Kirchner 2008b ).
65 of76

Information Only
Summary Report of the 2009 Compliance Recertification Application Performance Assessment
1W,---------------------------------------------------,
100
-~ • 60 -~ ~ ~ ~ ~
&l ~
60 ~ .c ~ :; u ... 40
w
\ • • • • ••• • •
I• Culebra Releases !
-------- -----------
0~------------------------------------------------~ 0 20 40 50 80 100 120
CFRACPOR
Figure 6-5. The preponderance and distribution of zeros can control the regression.
6.5 TOTAL
Revision 0
Total releases are calculated by totaling the releases from each release pathway: cuttings and cavings releases, spallings releases, DBRs, and transport releases (there were no undisturbed releases to contribute to total release). Figure 6-6 shows the 300 CCDFs for total releases in replicates Rl, R2 and R3 of the CRA-2009 PA. As seen in Figure 6-6, all of the CCDFs lie below and to the left of the limits specified in 40 CFR § 191.13(a).
The overall mean CCDF is computed as the arithmetic mean of the mean CCDFs from each replicate. To quantitatively determine the sufficiency of the sample size, a confidence interval is computed about the overall mean CCDF using the Student's !-distribution and the mean CCDFs from each replicate. Figure 6-7 shows 95 percent confidence intervals about the overall mean. The CCDF and confidences intervals lie below and to the left of the limits specified in 40 CFR § 191.13(a). Thus, the WIPP continues to comply with the containment requirements of 40 CFR Part 191.
Figure 6-8, Figure 6-9 and Figure 6-10 show the mean CCDFs for each component of total releases, for replicates Rl, R2 and R3 of the CRA-2009 PA, respectively. The contributions to total releases for each release pathway in the CRA-2009 PA are the same as were observed in the CRA-2004 P ABC (Dunagan 2008).
66 of76

Information Only
Summary Report of the 2009 Compliance Recertification Application Performance Assessment
10r-------------------------------------------y---------------------,
0.1 ---·--
O.o1
0.001
0.0001 1----------~----------~------_illl 0.0001 0.001 0.01 0.1
R = Release (EPA Units)
1- -~;:I Release Limits I
I I
_ __l__ ··----1 I I I
10 100
Figure 6-6. Total normalized releases, replicates R1, R2 and R3, CRA-2009 PA.
10,-------
I --Mean : - " Lower 95% Cl
I .. • • Upper 95% Cl
+-------------;::---------------------~- - -KRelease Llmltsn f--------i
0.1 --·
0.01 --.... __ _
0.001 ---
I I I
I I
---1-----1 I I
0.0001 1----------~----------~--------~----------+---'-"-' ------~---------" 0.0001 0.001 0.01 0.1 10 100
R = Release (EPA Units)
RevisionO
Figure 6-7. Confidence interval on overall mean CCDF for total normalized releases, CRA-2009 PA.
67 of76

Information Only
Summary Report of the 2009 Compliance Recertification Application Performance Assessment
10,-----------------------------------------,--------------------.
- -Cuttings and Gavings • • • Direct Brine
+----------...,o;;:::-------------1--j- - Spallings --Tolal
0.1
.. .. .. .. .. . . . . . . ~-....._~.-------
0.001 t----
-- - - ------~-----
\
\
-----T • \
L::_ -Release limits
---,---1 I L__
I I I
0.0001 +-~~~~~-~~~~-r-~~~~~----~~~~L-~~~~-~~~~ 0.0001 0.001 0.01 0.1 10 100
R : Release (EPA UnftsJ
Revision 0
Figure 6-8. Mean CCDFs for components of total normalized releases, replicate R1, CRA-2009 PA.
10 ~----------
.. . .. .. -... 0.1 .. - ~- ......
·-:..:..:-~ .. -0.01
0.001 ,t_.._ ____ ---
' •
'
' '
\
\
'\ ,·. \
-------
\
\ \ \
- -Cuttings and Cavings
• • • Direct Brine - - Spallings --Total
I - • Total !=rom Culebra - -Release Limits _ _j
I
~~---- T----
1 I I __ _ I I I
0.0001 +--~~~~.,...>.·~~~~ ..... -~~~~.....;~-~~""-""Y-....l~~~~r--~~~~.....j 0.0001 0.001 0.01 0.1 10 100
R = Release (EPA Unltsl
Figure 6-9. Mean CCDFs for components of total normalized releases, replicate R2, CRA-2009 PA.
68 of76

Information Only
Summary Report of the 2009 Compliance Recertification Application Performance Assessment
10r------------------------------------.~--------------~
"' A
j :;. ~
0.1
- -Cuttings and cavings '"' - - Direct Brine
+---------=--------------------4H- - Spalllngs
.. .. .. -.. _ .... _·---~-.._ --.-· --
--
--Total - -Release Limits
__ J_ ---.-·-····--1 I 1 001
..... . .L--··· I
\ I I
0.001 \
\ \ \
0.0001 +---~~ ....... --~~~----~~~~'--~~L.......,_-'L~~~Y-~~-......j 0.0001 0.001 0.01 0.1 10 100
R = Release (EPA Units)
Revision 0
Figure 6-10. Mean CCDFs for components of total normalized releases, replicate R3, CRA-2009 PA.
Figure 6-11 provides a comparison between the CRA-2009 PA and the CRA-2004 P ABC. At all probabilities, the overall mean CCDFs for total normalized releases from the two analyses are very similar. A small increase is noticeable because of change in the drilling rate parameter and the increase in the DBR s(Dunagan 2008). Mean total releases differ by -0.01 EPA units at a probability ofO.l and -0.1 EPA units at a probability ofO.OO! (Table 6-1). These increases in the total releases are primarily a result of the increases in the DBRs, discussed in Section 6.3.
Table 6·1. CRA-2009 PA and CRA-2004 PABC 1 statistics on the overall mean for total normalized releases in EPA units at probabilities of 0.1 and 0.001.
Probability Analysis Mean Total Lower Upper Qelell$0. Release 95%CL·. 95%CL Ul!lit··
0.1 CRA·2004 PABC 0.09 0.08 0.09 I
CRA-2009 PA 0.10 0.10 0.11 I
CRA-2004 PABC 0.60 0.52 0.68 IO 0.001
CRA-2009PA 0.92 IO 0.72 0.48 . . . 1 CRA-2004 PABC data was Imttally reported m Vugnn and Dunagan (2005) .
There are some definite similarities between the CCDFs for the two analyses. First, for most probabilities, cuttings and cavings are the most significant pathways for release of radioactive material to the land surface. Second, release by spallings and subsurface transport in the Salado or Culebra make essentially no contribution to total releases. Finally, the resulting CCDFs of both analyses are within regulatory limits.
69 of76

Information Only
Summary Report of the 2009 Compliance Recertification Application Performance Assessment
10,------------------------------------..-----------------,
.. A m 0.1
J ~ :a • e 0.01 ..
0.001
I --CRA-2004 PABC Overaff Mean
I - · - CRA-2009 Overall Mean
- -Release Limits
+--=----~~
I I
- '-, ________ _l_- --...-~---
0.0001 -1-----------------~--------~------~-----'L.------------------' 0.0001 0.001 0.01 0.1 10 100
R = Release (EPA Units)
Revision 0
Figure 6-11. Overall mean CCDFs for total normalized releases: CRA-2009 PA and CRA-2004 PABC.
As in the CRA-2004 PABC, cuttings, cavings and DBRs account for the majority of the total releases estimated in the CRA-2009 PA. As indicated in the rank regression analysis, in both the CRA-2009 PA and the CRA-2004 PABC, uncertainty in total normalized releases is largely due to uncertainty in waste shear strength (Kirchner 2008b ). The volumes of cuttings and cavings are primarily controlled by shear strength (Kirchner 2008b), and the negative correlation found in the analysis is expected. The "solubility multiplier" which represents uncertainty in solubilities for all actinides in the +III oxidation state (Xiong et al. 2005) remained the second most dominant parameter contributing to variability in total releases in all replicates (Kirchner 2008b). Solubility of actinides impacts their concentration in DBRs. The variability in total releases explained by the waste shear strength in the CRA-2009 PA dropped from previous levels. The waste shear strength only accounts for about 81% of the total variability in total releases in the CRA-2009 PA, whereas in the CRA-2004 PABC it accounted for 88% of the variability (Kirchner 2008b ). This decrease is due to the increase in DBRs, which increases the contribution ofDBRs to total releases.
70 of76

Information Only
Sununary Report of the 2009 Compliance Recertification Application Performance Assessment
REFEERENCES
Revision 0
Clayton, D.J. (2007). Corrections to Input Files for DBR PABC Calculations. Sandia National Laboratories, Carlsbad, NM. ERMS 546311.
Clayton, D.J. (2008a). Analysis Package for Direct Brine Releases: Compliance Recertification Application- 2009. Sandia National Laboratories, Carlsbad, NM. ERMS 548571.
Clayton, D.J. (2008b ). Analysis Plan for the Performance Assessment for the 2009 Compliance Recertification Application, Revision 1, AP-137. Sandia National Laboratories, Carlsbad, NM. ERMS 547905.
Clayton, D.J. and E.D. Vugrin. (2007). Justification of Chemistry Parameters for Use by BRAGFLO Version 6.0. Sandia National Laboratories, Carlsbad, NM. ERMS 545611.
Cotsworth, E. (2004a). EPA's CRA Completeness Comments, 1st set. U.S. Environmental Protection Agency., Washington, DC. ERMS 535554.
Cotsworth, E. (2004b). EPA's CRA Completeness Comments, 2nd set. U.S. Environmental Protection Agency, Washington, DC. ERMS 537187.
Cotsworth, E. (2004c). EPA's CRA Completeness Comments, 3rd set. U.S. Environmental Protection Agency, Washington, DC. ERMS 536771.
Cotsworth, E. (2004d). EPA's CRA Completeness Comments, 4th set. U.S. Environmental Protection Agency, Washington, DC. ERMS 540236.
Detwiler, P. (2004a). Initial Response to Environmental Protection Agency (EPA) September 2, 2004, Letter on Compliance Recertification Application [DOE Letter #6). U.S. Department of Energy, Carlsbad, NM. ERMS 540239.
Detwiler, P. (2004b). MgO Emplacement [DOE Letter #5]. U.S. Department of Energy, Carlsbad, NM. ERMS 540238.
Detwiler, P. (2004c ). Partial response to Environmental Protection Agency (EPA) May 20, 2004 letter on CRA. U.S. Department of Energy, Carlsbad, NM. ERMS 537372.
Detwiler, P. (2004d). Partial response to Environmental Protection Agency (EPA) May 20, 2004 letter on CRA, [1st response submittal to EPA]. U.S. Department of Energy, Carlsbad, NM. ERMS 537430.
Detwiler, P. (2004e). Response to Environmental Protection Agency (EPA) July 12, 2004letter on CRA. U.S. Department of Energy, Carlsbad, NM. ERMS 537369.
Dunagan, S. (2007). Parameter Problem Report (PPR), PPR-2007-001 for REFCON:FVW. Sandia National Laboratories, Carlsbad, NM. ERMS 545481.
71 of 76

Information Only
Summary Report of the 2009 Compliance Recertification Application Performance Assessment
Revision 0
Dunagan, S. (2008). Analysis Package for CCDFGF: 2009 Compliance Recertification Application. Sandia National Laboratories, Carlsbad, NM. ERMS 548776.
Gamer, J.W. (2006). Software Installation and Checkout and regression Testing Report of PANEL, Version 4.03 on the COMPAQ ES40, ES45 and ES47 Platforms Using Open VMS 8.2. Sandia National Laboratories, Carlsbad, NM. ERMS 543600.
Gamer, J.W. and C.D. Leigh (2005). Analysis Package for PANEL, CRA-2004 Performance Assessment Baseline Calculation. Sandia National Laboratories, Carlsbad, NM. ERMS 540572.
Gilkey, A.P. (1995). PCCSRC, Version 2.21, Software Installation and Checkout Form. Sandia National Laboratories, Carlsbad, NM. ERMS 227771.
Gilkey, A.P. (2003). Software Installation and Checkout Form for SECOTP2D, Version 1.41. Sandia National Laboratories, Carlsbad, NM. ERMS 525384.
Gilkey, A.P. (2006). Software Installation and Checkout and Regression Testing Report of NUTS version 2.05c on the Compaq ES40, ES45, and ES47 Platforms. Sandia National Laboratories, Carlsbad, NM. ERMS 543789.
Gilkey, A.P. and E.D. Vugrin (2005). Software Installation and Checkout and Installation and Checkout for CUTTINGS_$ Version 6.00 Regression Testing for the Compaq ES45 Platform. Sandia National Laboratories, Carlsbad, NM. ERMS 537042.
Gitlin, B.C. (2005). Fifth Set of CRA Comments. U.S. Environmental Protection Agency, Washington, DC. ERMS 540240.
Helton, J.C., J.E. Bean, F.W. Berglund, F. Davis, K. Economy, J.W. Gamer, J.D. Johnson, R.J. MacKinnon, J. Miller, D.O. O'Brien, J.L. Ramsey, J.D. Schreiber, A. Shinta, L.N. Smith, D.M. Stoelzel, C. Stockman and P. Vaughn (1998). Uncertainty and Sensitivity Analysis Results Obtained in the 1996 Performance Assessment for the Waste Isolation Pilot Plant. Sandia National Laboratories, Albuquerque, NM. SAND98-0365, ERMS 252619.
Ismail, A.E. (2007a). Errors in Input Files for NUTS for CRA-2004 PABC Calculations. Sandia National Laboratories, Carlsbad, NM. ERMS 546200.
Ismail, A.E. (2007b). Parameter Problem Report (PPR), PPR-2007-002 for S_HALITE, DRZ_O. Sandia National Laboratories, Carlsbad. NM. ERMS 545713.
Ismail, A. E. (2007c ). Revised Porosity Estimates for the DRZ. Sandia National Laboratories, Carlsbad, NM. ERMS 545755.
Ismail, A.E. (2008). Analysis Package for CUTTINGS_S: Compliance Recertification Application 2009, Revision l. Sandia National Laboratories. Carlsbad, NM. ERMS 548618.
72 of76
Information Only
Summary Report of the 2009 Compliance Recertification Application Perfonnance Assessment
Revision 0
Ismail, A.E. and J.W. Gamer. (2008). Analysis Package for Salado Transport Calculations: Compliance Recertification Application 2009. Sandia National Laboratories, Carlsbad, NM. ERMS 548845.
Kirchner, T. (2008a). Generation of the LHS Samples for the AP-137 Revision 0 (CRA09) PA Calculations. Sandia National Laboratories, Carlsbad, NM. ERMS 547671.
Kirchner, T. (2008b). Sensitivity of the CRA-2009 Performance Assessment Calculation Releases to Parameters. Sandia National Laboratories, Carlsbad, NM. ERMS 548788.
Kirkes, G.R. (2005a). Baseline Features, Events, and Processes List for the Waste Isolation Pilot Plant, Revision 1. San.dia National Laboratories, Carlsbad, NM. ERMS 539356.
Kirkes, G.R. (2005b). SP 9-4, Performing FEPS Baseline Impact Assessment for Planned or Unplanned Changes. Revision 0. Sandia National Laboratories, Carlsbad, NM. ERMS 539468.
Kirkes, G.R. (2007). Evaluation of the Duration of Direct Brine Release in WJPP Performance Assessment. Sandia National Laboratories, Carlsbad, NM. ERMS 545988.
Kirkes, G.R. (2008). Features, Events and Processes Assessment for Changes Described in Analysis Plan- 137. Sandia National Laboratories, Carlsbad, NM. ERMS 548816.
Kirkes, G.R. and C.G. Herrick. (2006). Analysis Plan for the Modification of the Waste Shear Strength Parameter and Direct Brine Release Parameters, AP-131. Sandia National Laboratories, Carlsbad, NM. ERMS 541530.
Leigh, C.D., J.R. Trone and B. Fox. (2005). TRU Waste Inventory for the 2004 Compliance Recertification Application Performance Assessment Baseline Calculation. Sandia National Laboratories, Carlsbad, NM. ERMS 541118.
Long, J.J. (2008). Execution of Performance Assessment Codes for the 2009 Performance Assessment Baseline Calculation. Sandia National Laboratories, Carlsbad, NM. ERMS 548350.
Lord, D.L. (2004). Software Installation and Checkout Form for DRSPALL, Version 1.10. Sandia National Laboratories, Carlsbad, NM. ERMS 533957.
Lowry, T.S. (2005). Analysis Package for Salado Transport Calculations: CRA-2004 PA Baseline Calculation. Sandia National Laboratories, Carlsbad, NM. ERMS 541084
Lowry, T.S. and J. Kanney. (2005). Analysis Report for the CRA-2004 PABC Culebra Flow and Transport Calculations. Sandia National Laboratories, Carlsbad, NM. ERMS 541508.
73 of76

Information Only
Summary Report of the 2009 Compliance Recertification Application Performance Assessment
Revision 0
McKenna, S.A. (2005). Software Installation and Checkout for MODFLOW 2000, Version 1.6. Sandia National Laboratories, Carlsbad, NM. ERMS 540470.
Nemer, M.B. (2007a). Change Control for BRAGFLO, Version 5.0, (Proposed 6.0). Sandia National Laboratories, Carlsbad, NM. ERMS 544904.
Nemer, M.B. (2007b). Design Document for BRAGFLO Version 6.0. Sandia National Laboratories, Carlsbad, NM. ERMS 545015.
Nemer, M.B. (2007c). Effects of Not Including Emplacement Materials in CPR Inventory on Recent PA Results. Sandia National Laboratories, Carlsbad, NM. ERMS 545689.
Nemer, M.B. (2007d). Software Installation and Checkout for BRAGFLO, Version 6.0. Sandia National Laboratories, Carlsbad, NM. ERMS 545019.
Nemer, M.B. (2007e). Software Quality Assurance Plan for BRAGFLO Version 6.0. Sandia National Laboratories, Carlsbad, NM. ERMS 545013.
Nemer, M.B. (2007f). User's Manual for BRAGFLO Version 6.0. Sandia National Laboratories, Carlsbad, NM. ERMS 545016.
Nemer, M.B. (2007g). Validation Document for BRAGFLO Version 6.0. Sandia National Laboratories, Carlsbad, NM. ERMS 545018.
Nemer, M.B. and DJ. Clayton. (2008). Analysis Package for Salado Flow Modeling, 2009 Compliance Recertification Application Calculation. Sandia National Laboratories, Carlsbad, NM. ERMS 548607.
Patterson, R. (2005). Hanford Tank and K-Basin Wastes [DOE Letter #9: Response to CRA Comments]. U.S. Department of Energy, Carlsbad, NM. ERMS 540241.
Piper, L. (2004). Partial Response to Environmental Protection Agency (EPA) September 2, 2004 Letter on Compliance Recertification Application [DOE Letter #7: Response to CRA Comments]. U.S. Department of Energy, Carlsbad, NM. ERMS 540242.
SNL. (1997). Final, Supplemental Summary of EPA-Mandated Performance Assessment Verification Test (All Replicates) and Comparison with the Compliance Certification Application Calculations. Sandia National Laboratories, Carlsbad, NM. ERMS 414879.
Stoelzel, D.M. and D.G. O'Brien. (1996). Conceptual Model Description of BRAGFLO Direct Brine Release Calculations to Support the Compliance Certification Application (CCA MASS Attachment 16-2). U.S. Department of Energy, Carlsbad, NM. ERMS 239090.
Triay, I.R. (2005). Partial Response to Environmental Protection Agency (EPA) September 2, 2004, Letter on Compliance Recertification Application [DOE Letter #8: Response to
74 of 76

Information Only
Sununary Report of the 2009 Compliance Recertification Application Performance Assessment
Revision 0
CRA Comments]. U.S. Department of Energy, Carlsbad Field Office, Carlsbad, NM. ERMS 540243.
U.S. DOE. (1980). Final Environmental Impact Statement: Waste Isolation Pilot Plant. U.S. Department of Energy, Assistant Secretary for Defense Programs, Vols. 1-2., Washington, D.C. DOE/EIS-0026, ERMS 238839.
U.S. DOE. (1990). Final Supplement: Environmental Impact Statement, Waste Isolation Pilot Plant. U.S. Department of Energy, Office of Environmental Restoration and Waste Management. Vols. 1-13, Washington, D.C. DOE/EIS-0026-FS, ERMS 247955 and 243022.
U.S. DOE. (1993). Waste Isolation Pilot Plant Strategic Plan. U.S. Department of Energy, Washington, D.C. ERMS 251353.
U.S. DOE. (1996). Title 40 CPR Part 191 Compliance Certification Application for the Waste Isolation Pilot Plant. U.S. Department of Energy, Waste Isolation Pilot Plant Carlsbad Area Office, Carlsbad, NM. DOE/CA0-1996-2184.
U.S. DOE. (2004). Title 40 CPR Part 191 Compliance Recertification Application for the Waste Isolation Pilot. U.S. Department of Energy Waste Isolation Pilot Plant, Carlsbad Field Office, Carlsbad, NM. DOEIWWP 2004-3231.
U.S. DOE. (2007). Delaware Basin Monitoring Annual Report. U.S. Department of Energy Waste Isolation Pilot Plant, Carlsbad Field Office, Carlsbad, NM. DOE/WWP-07-2308.
U.S. EPA. (1996). 40 CPR 194: Criteria for the Certification and Recertification of the Waste Isolation Pilot Plant's Compliance with the 40 CPR Part 191 Disposal Regulations; Final Rule. Federal Register, Vol. 61, No. 28, pp. 5224- 5245. U.S. Environmental Protection Agency, Washington, DC. ERMS 241579.
U.S. EPA. (1998). 40 CPR 194: Criteria for the Certification and Recertification of the Waste Isolation Pilot Plant's Compliance with the 40 CPR Part 191 Disposal Regulations: Certification Decision; Final Rule. Federal Register, Vol. 63, No. 95, pp. 27353-27406. U.S. Environmental Protection Agency, Office of Radiation and Indoor Air, Washington, D.C. ERMS 250492.
Vugrin, E.D. (2004). Software Installation and Checkout and Regression Testing for CCDFGF Version 5.02 on the ES40 and ES45. Sandia National Laboratories, Carlsbad, NM. ERMS 538169.
Vugrin, E.D. (2005a). Analysis Package for DRSPALL, CRA 2004 Performance Assessment Baseline Calculation. Sandia National Laboratories, Carlsbad, NM. ERMS 540415.
75 of76

Information Only
Summary Report of the 2009 Compliance Recertification Application Performance Assessment
Revision 0
Vugrin, E.D. (2005b). Software Installation and Checkout and Analysis Report for the ES45 Regression Test of LHS, Version 2.42. Sandia National Laboratories, Carlsbad, NM. ERMS 538376.
Vugrin, E.D. and B. Fox. (2005). Software Installation and Checkout and Regression Testing for CUTTINGS_S Version 6.02 on the ES40 and ES45, Revision 0. Sandia National Laboratories, Carlsbad, NM. ERMS 540155.
Vugrin, E.D. and S. Dunagan. (2005). Analysis Package for CCDFGF: CRA-2004 Performance Assessment Baseline Calculation. Sandia National Laboratories, Carlsbad, NM. ERMS 540771.
Xiong, Y., E.J. Nowak and L.H. Brush. (2005). Updated Uncertainty Analysis to Actinide Solubilities for the Response to EPA Comment C-23-16, Rev 1. Sandia National Laboratories, Carlsbad, NM. ERMS 539595.
76 of76