saniplan tool - pas.org.in
TRANSCRIPT
PAS Project, CEPT University, Ahmedabad
PAS Project 1
SaniPlan Tool

Location of Tool in IFSM Toolbox . . .
2

Location of Tool in IFSM Toolbox . . .
4
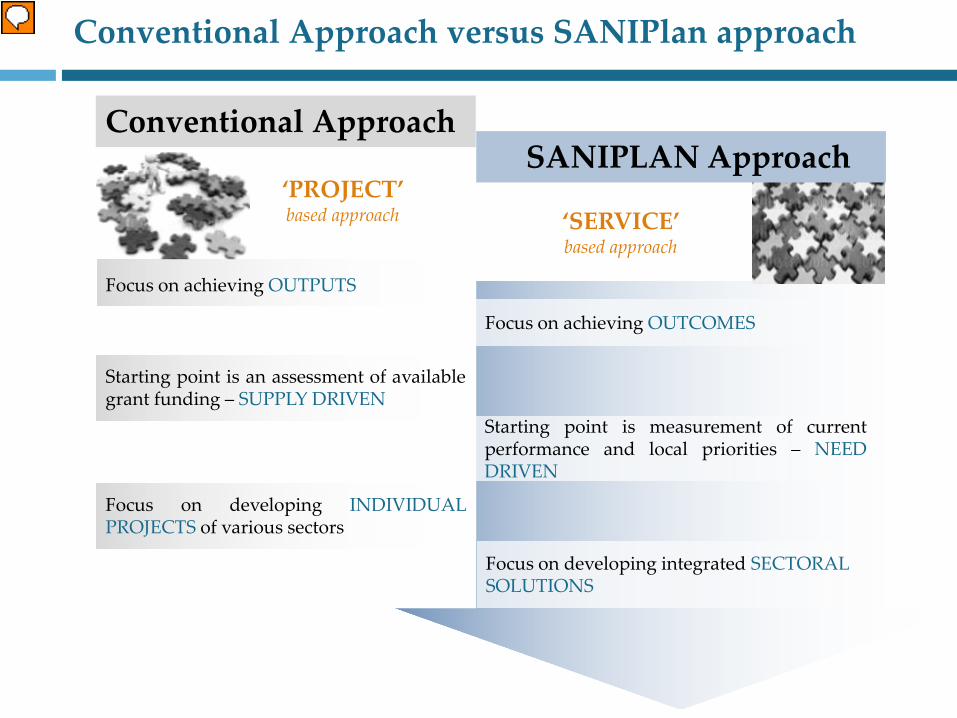
‘SERVICE’based approach
Focus on achieving OUTCOMES
Focus on developing integrated SECTORAL SOLUTIONS
Starting point is measurement of currentperformance and local priorities – NEEDDRIVEN
SANIPLAN Approach‘PROJECT’ based approach
Starting point is an assessment of availablegrant funding – SUPPLY DRIVEN
Focus on developing INDIVIDUALPROJECTS of various sectors
Focus on achieving OUTPUTS
Conventional Approach
Conventional Approach versus SANIPlan approach
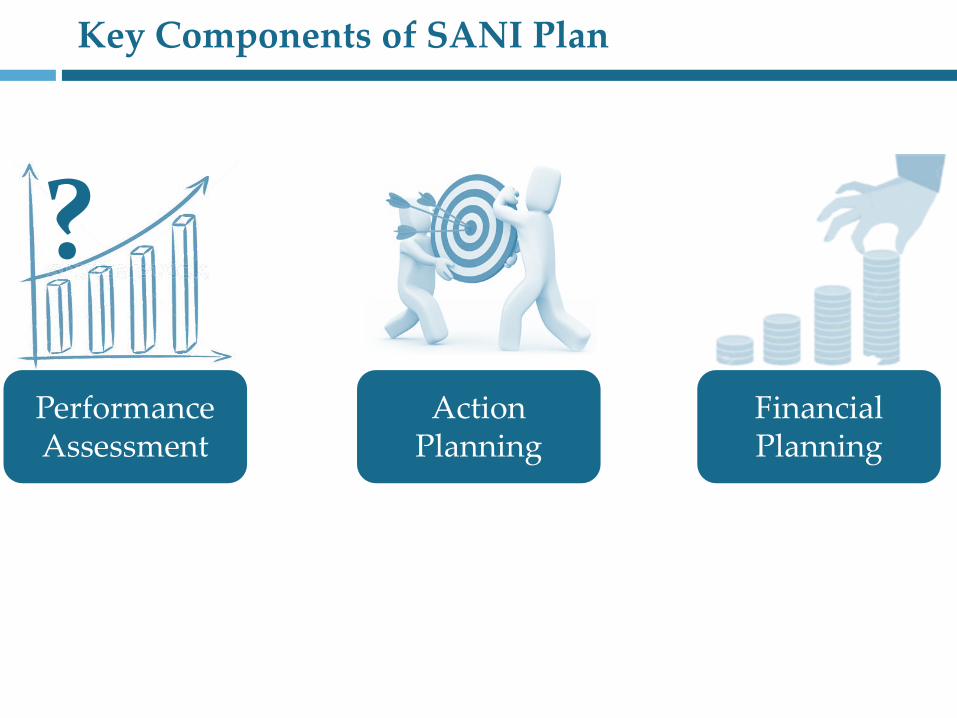
Key Components of SANI Plan
Performance Assessment
?Financial Planning
Action Planning
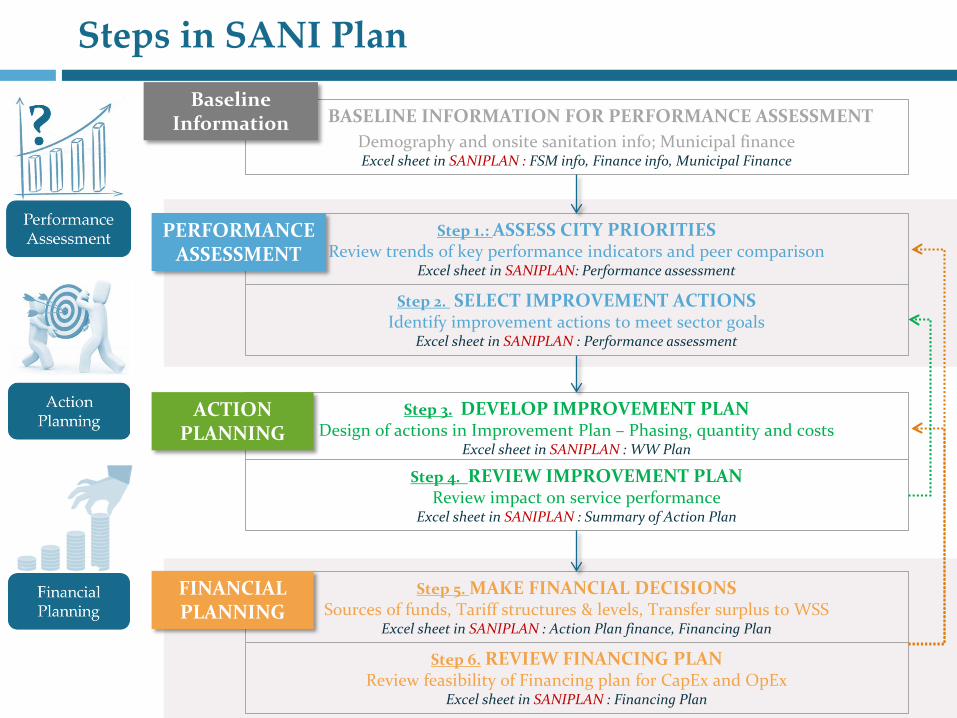
BASELINE INFORMATION FOR PERFORMANCE ASSESSMENTDemography and onsite sanitation info; Municipal finance Excel sheet in SANIPLAN : FSM info, Finance info, Municipal Finance
Step 1.: ASSESS CITY PRIORITIESReview trends of key performance indicators and peer comparison
Excel sheet in SANIPLAN: Performance assessment
Step 2. SELECT IMPROVEMENT ACTIONSIdentify improvement actions to meet sector goals
Excel sheet in SANIPLAN : Performance assessment
Step 3. DEVELOP IMPROVEMENT PLANDesign of actions in Improvement Plan – Phasing, quantity and costs
Excel sheet in SANIPLAN : WW Plan
Step 4. REVIEW IMPROVEMENT PLANReview impact on service performance
Excel sheet in SANIPLAN : Summary of Action Plan
Step 5. MAKE FINANCIAL DECISIONSSources of funds, Tariff structures & levels, Transfer surplus to WSS
Excel sheet in SANIPLAN : Action Plan finance, Financing Plan
Step 6. REVIEW FINANCING PLANReview feasibility of Financing plan for CapEx and OpEx
Excel sheet in SANIPLAN : Financing Plan
Baseline Information
PERFORMANCE ASSESSMENT
ACTION PLANNING
FINANCIAL PLANNING
Steps in SANI Plan

Step-1 Baseline Information
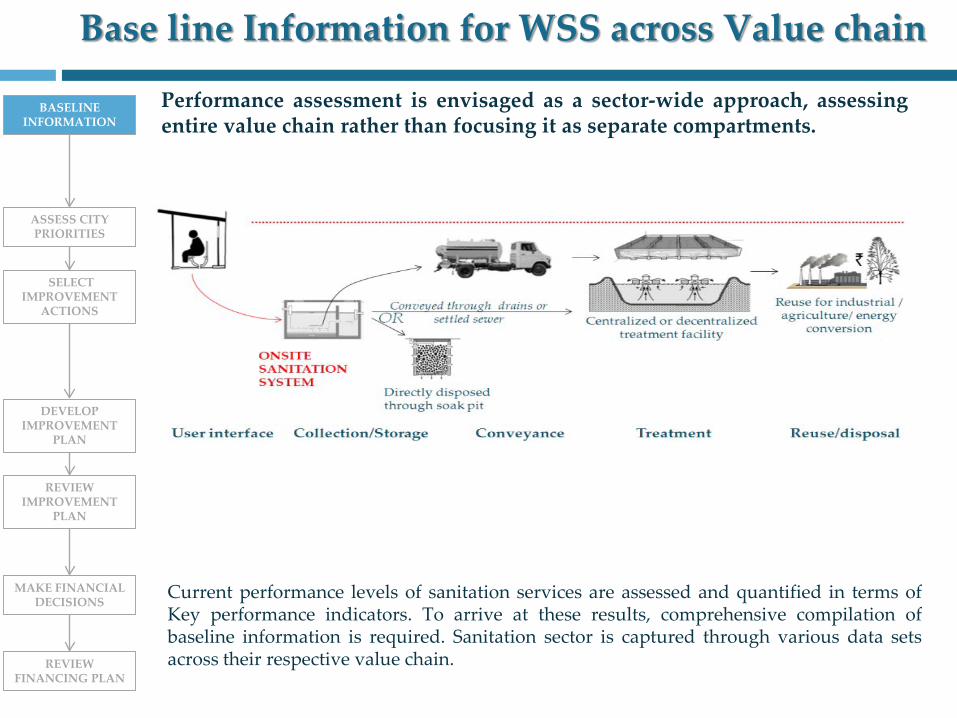
Base line Information for WSS across Value chain
8
Performance assessment is envisaged as a sector-wide approach, assessingentire value chain rather than focusing it as separate compartments.
Current performance levels of sanitation services are assessed and quantified in terms ofKey performance indicators. To arrive at these results, comprehensive compilation ofbaseline information is required. Sanitation sector is captured through various data setsacross their respective value chain.
BASELINE INFORMATION
ASSESS CITY PRIORITIES
SELECT IMPROVEMENT
ACTIONS
DEVELOP IMPROVEMENT
PLAN
REVIEW IMPROVEMENT
PLAN
MAKE FINANCIAL DECISIONS
REVIEW FINANCING PLAN

Snapshot of WSS Info input sheet
WSS Info sheet of
SANIPlan
B Details of non-sewered areas in cityi) Households with individual toilet facility
Sr. No. Non-slum households Slum householdsBlack water disposal system of
toiletsEffluent disposal system of
toilets1 Septic tanks Soak pits 424 2 Septic tanks Open/ closed drains (unsafe) 3,816 189 3 Pit latrines (unsafe) Open/ closed drains (unsafe) 211 2
4,451 191
ii) Emptying of septic tanksSr. No. Suggested emptying cycle (number of years between successive emptying)
1 3 2 1
Sr. No. Urban local body (ULB) Private service providers1
Yes No
21
3 5 4
1.0
iii) Faecal sludge treatment and disposal (FSTD) facilitySr. No. Unit Value
1 Cu.m./ month - 2 Cu.m./ month - 3
% 0%
4 Cu.m./ month -
The USEPA suggests 3-5 years, Govt. of India suggests a 2-3 years cleaning cycle
For household level septic tanksFor septic tanks of community/public toilets
Number of trips made by a suction emptier truck (Trips/working day/truck)NOTE : If trips are not made daily, then convert trip frequency into per day ratio. Eg: 1 trip is made every week then, 1/6 = 0.17 trips/ day
Functional capacity of FSTD facility
Particulars
Quantity of manure reused, if any
Installed capacity of FSTD facility
Involvement in emptying septic tanks in the city (Yes/No)
Estimated percentage of by-product (manure) derived from septage treated at the plant
Aggregate capacity of all suction emptier trucks (kl)
Total
Particulars
Particulars
Number of suction emptier trucks used for cleaning septic tanks

Snapshot of Finance Info input sheet Status of budgets
2009 2010 2011 2012 2013 2014Actual figure Actual figure Actual figure Actual figure Revised estimate Budget estimate
(A) (A) (A) (A) (RE) (BE) TRUE TRUE TRUE TRUE TRUE TRUE
I Municipal revenue and expenditure All figures in INR LakhsSr. No. Particulars 2009 (A) 2010 (A) 2011 (A) 2012 (A) 2013 (RE) 2014 (BE)
Opening balance 295.2 315.2 300.2 473.3 743.5 858.0 Property tax 89.6 85.8 86.9 142.1 200.7 250.1 Other taxes and charges 58.7 72.6 64.6 98.0 174.3 182.5 Other receipts (non-tax + grants) 445.0 601.6 656.0 761.9 1,013.9 971.4 Total revenue receipts 593.3 760.0 807.5 1,002.0 1,389.0 1,403.9
Revenue expenditure 546.5 802.1 724.7 918.3 1,169.3 1,320.7
Capital receipts 463.5 196.5 644.0 128.9 962.6 688.2 Capital expenditure 365.0 188.3 958.6 215.0 939.1 471.2
II WSS revenue and expenditure All figures in INR LakhsB FSM and Wastewater
Sr. No. Particulars 2009 (A) 2010 (A) 2011 (A) 2012 (A) 2013 (RE) 2014 (BE)Wastewater related taxes and charges - - - - - - Other receipts - - - - - - Total revenue receipts - - - - - -
Revenue expenditure 55.5 68.5 84.9 111.6 121.2 108.0
Capital receipts - - - - - - Capital expenditure - - - - - -
III Taxes and user charges All figures in INR LakhsA Demand, Collection and Balance statement
Demand Collection Demand Collection Demand CollectionCURRENT DEMAND
1 General property tax 112.6 94.9 111.6 91.8 111.6 91.8 3 FSM and wastewater related taxes and
charges5 Others 111.2 90.4 134.7 112.5 134.7 112.5
Total 223.8 185.3 246.3 204.3 246.3 204.3 ARREAR DEMAND
1 General property tax 66.2 46.9 37.6 19.3 37.6 19.3 3 FSM and wastewater related taxes and 5 Others 53.2 40.0 52.0 37.8 52.0 37.8
Total 119.4 86.9 89.6 57.1 89.6 57.1
2014 (BE)2012 (A)
Select type of budget figures provided for each yearAbbreviation for budget type
Particulars
Sr. No. Particulars2013 (RE)
Availability of budget (tick if available)

Step-2 Performance Assessment
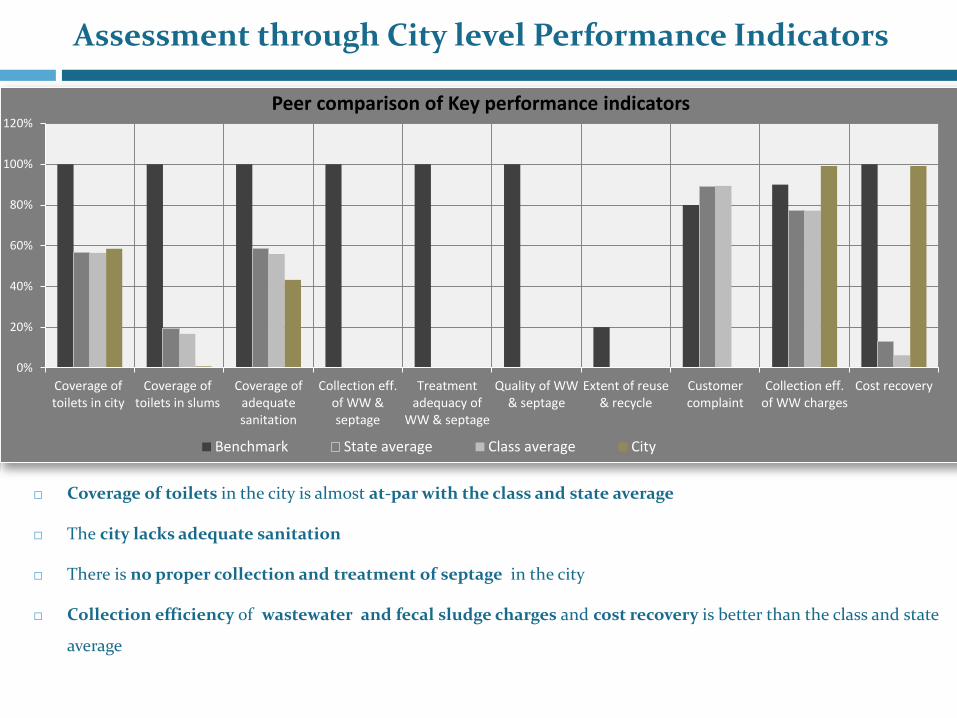
Coverage of toilets in the city is almost at-par with the class and state average
The city lacks adequate sanitation
There is no proper collection and treatment of septage in the city
Collection efficiency of wastewater and fecal sludge charges and cost recovery is better than the class and state
average
Assessment through City level Performance Indicators
0%
20%
40%
60%
80%
100%
120%
Coverage oftoilets in city
Coverage oftoilets in slums
Coverage ofadequatesanitation
Collection eff.of WW &septage
Treatmentadequacy of
WW & septage
Quality of WW& septage
Extent of reuse& recycle
Customercomplaint
Collection eff.of WW charges
Cost recovery
Peer comparison of Key performance indicators
Benchmark State average Class average City
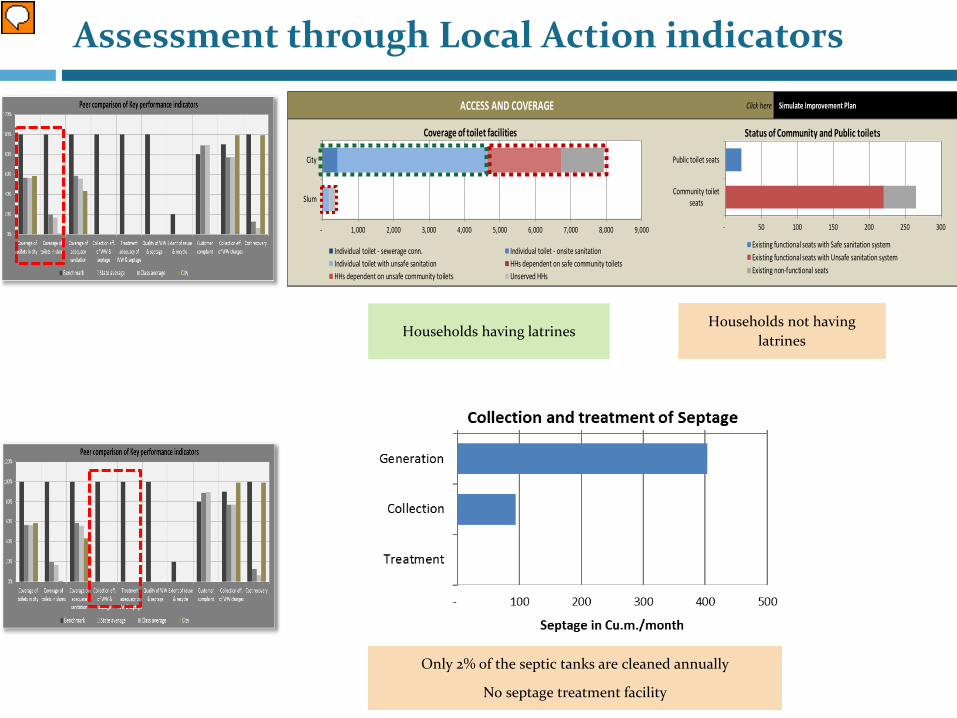
Assessment through Local Action indicators
Click hereACCESS AND COVERAGE Simulate Improvement Plan
- 1,000 2,000 3,000 4,000 5,000 6,000 7,000 8,000 9,000
Slum
City
Coverage of toilet facilities
Individual toilet - sewerage conn. Individual toilet - onsite sanitationIndividual toilet with unsafe sanitation HHs dependent on safe community toiletsHHs dependent on unsafe community toilets Unserved HHs
- 50 100 150 200 250 300
Community toiletseats
Public toilet seats
Status of Community and Public toilets
Existing functional seats with Safe sanitation systemExisting functional seats with Unsafe sanitation systemExisting non-functional seats
Households having latrines Households not having
latrines
Only 2% of the septic tanks are cleaned annually
No septage treatment facility
Step-3 Action Planning
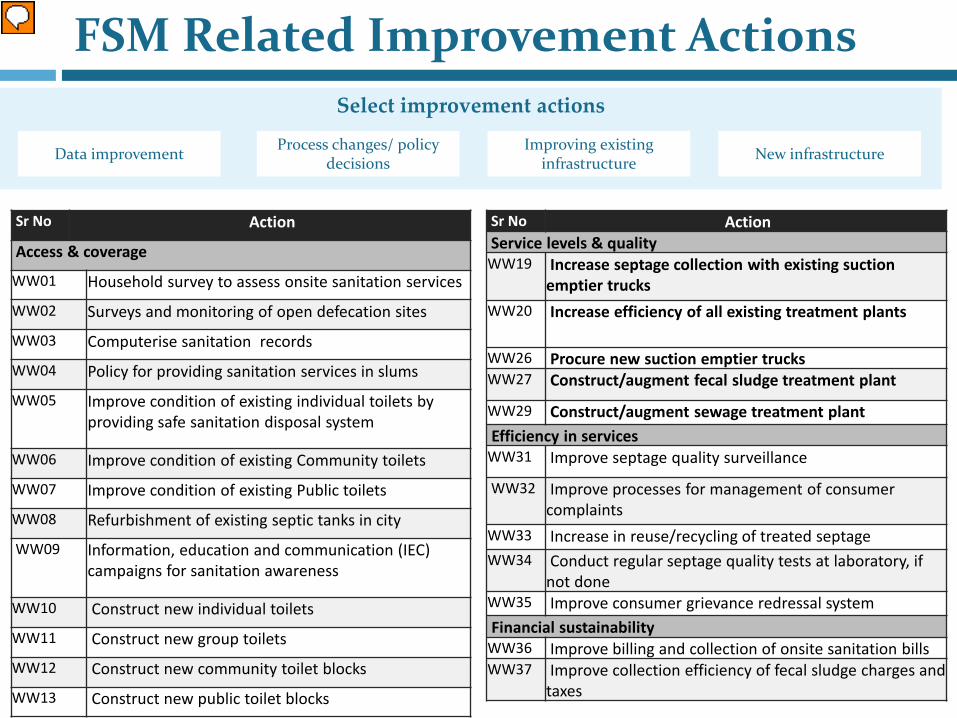
FSM Related Improvement Actions
Sr No Action
Access & coverage
WW01 Household survey to assess onsite sanitation services
WW02 Surveys and monitoring of open defecation sites
WW03 Computerise sanitation records
WW04 Policy for providing sanitation services in slums
WW05 Improve condition of existing individual toilets by providing safe sanitation disposal system
WW06 Improve condition of existing Community toilets
WW07 Improve condition of existing Public toilets
WW08 Refurbishment of existing septic tanks in city
WW09 Information, education and communication (IEC) campaigns for sanitation awareness
WW10 Construct new individual toilets
WW11 Construct new group toilets
WW12 Construct new community toilet blocks
WW13 Construct new public toilet blocks
Sr No Action Service levels & quality
WW19 Increase septage collection with existing suction emptier trucks
WW20 Increase efficiency of all existing treatment plants
WW26 Procure new suction emptier trucks WW27 Construct/augment fecal sludge treatment plant
WW29 Construct/augment sewage treatment plant Efficiency in services
WW31 Improve septage quality surveillance
WW32 Improve processes for management of consumer complaints
WW33 Increase in reuse/recycling of treated septage WW34 Conduct regular septage quality tests at laboratory, if
not done WW35 Improve consumer grievance redressal system Financial sustainability
WW36 Improve billing and collection of onsite sanitation bills WW37 Improve collection efficiency of fecal sludge charges and
taxes
Select improvement actions
Data improvement Process changes/ policy decisions
Improving existing infrastructure New infrastructure

Learn more Activate Procure new suction emptier trucks 2015 2016
- Suction emptier trucks with LG at present Numbers 1 - Suction emptier trucks with private operators at present Numbers - Suction emptier trucks of LG- Additional trucks to be procured by LG Numbers 2 - Aggregate capacity of all new suction emptier trucks kilo liters 7.0 - Number of trips by a suction emptier truck Trips/ truck/day 3.0 Suction emptier trucks of Private operators- Additional number of trucks expected to be procured by private operators to function within city limits
Numbers
- Aggregate capacity of all new suction emptier trucks kilo liters
- Number of trips by a suction emptier truck within city limits Trips/ truck/day
- Block cost for a suction emptier truck to be procured by LG Cost/truck 1,200,000 - O&M expenses for new trucks procured by LG % of CapEx/annum 50%
PROVIDE WASTEWATER COLLECTION & CONVEYANCE SYSTEM TO HOUSEHOLDS
Improvement
Baseline
Finance
Planning of improvement actions
16
Individual actions are calibrated as output based tangible targets. A set of these calibratedactions will form an implementation plan for ULB across ten years of plan period. Hence,this Action Plan must evolve through an iterative process of identifying appropriate actions,phasing and financing pattern.
Activate/ Deactivate actions
Phasing of actions
Baseline information
Improvement information
Cost and Finance information
Calibrate selected actionsPhasing Technology Capital Cost Operating cost and
revenue generated

Assess Impact of Improvement ActionsPerformance levels 2014 2015 2016 2017 2018 2019 2020 2021 2022 2023 2024
Access and coverage
Coverage of households with individual and group toilets in city 58% 67% 75% 82% 90% 97% 96% 96% 95% 95% 94%
Coverage of households with individual and group toilets in slums 53% 62% 71% 80% 88% 96% 95% 95% 94% 94% 93%
Coverage of households with improved sanitation facility in city 85% 95% 100% 100% 100% 100% 100% 100% 100% 100% 100%
Households resorting to open defecation in city 15% 5% 0% 0% 0% 0% 0% 0% 0% 0% 0%
Households dependent on community toilet facilities 26% 28% 25% 18% 10% 3% 4% 4% 5% 5% 6%
Non-functional community and public toilets 17% 11% 6% 0% 0% 0% 0% 0% 0% 0% 0%
Service level and qualityCoverage of households with adequate sanitation system 5% 27% 49% 70% 90% 97% 96% 96% 95% 95% 94%
Efficiency of wastewater and septage collection system 5% 27% 49% 70% 90% 97% 96% 96% 95% 95% 94%
Adequacy of wastewater and septage treatment capacity 0% 0% 0% 3% 10% 27% 24% 21% 19% 17% 16%
Households with full on-site sanitation system 5% 27% 49% 70% 90% 97% 96% 96% 95% 95% 94%
Households with on-site sanitation and settled sewer 0% 0% 0% 0% 0% 0% 0% 0% 0% 0% 0%
Households with sewerage network services 0% 0% 0% 0% 0% 0% 0% 0% 0% 0% 0%
Spatial coverage of closed surface drains 0% 0% 0% 0% 0% 0% 0% 0% 0% 0% 0%
Septic tanks cleaned annually in city 8% 34% 34% 34% 34% 32% 31% 31% 31% 31% 31%
Adequacy of sewage treatment capacity 0% 0% 0% 0% 0% 0% 0% 0% 0% 0% 0%
Adequacy of treatment plant capacity for effluent and sullage 0% 0% 0% 0% 0% 0% 0% 0% 0% 0% 0%
Adequacy of septage treatment capacity 0% 0% 0% 118% 107% 100% 100% 99% 98% 98% 97%
Number of households with access to individual and group toilets as percentage of total households in city.
Number of households in slum settlements with access to individual and group toilets as percentage of total slum households.
Number of households with access to safe and adequate sanitation system for wastewater disposal (sewerage or on-site) as percentage of total households in city.
Aggregate quantum of wastewater collected (through sewerage and settled sewer network) at the intake of treatment plant and wastewater discharged through soak pits as percentage of normative wastewater generated in city. This indicator is calculated based on weighted average of households and wastewater collection systems.
Aggregate quantum of sewage, sludge and sullage to be treated with present treatment facil ities as percentage of normative wastewater generated in city. This indicator is calculated based on weighted average of households and wastewater treatment facil ities.
Number of households with full on-site sanitation disposal system as septic tanks connected to soak pits for grey water disposal, as percentage of total households in city.
Number of households with on-site black water disposal system as septic tanks connected to settled sewer/ small bore sewers for grey water disposal, as percentage of total households in city.
Number of septic tanks (includes septic tanks of individual toilets, community and public toilets) cleaned annually as percentage of total septic tanks in city.
Municipal area covered by closed surface drains for storm water drainage as percentage of total jurisdictional area of city.
Quantum of sewage that can be treated at secondary treatment plants as percentage of normative sewage collected by sewerage network.
Quantum of sullage and effluent that can be treated at primary treatment plants as percentage of normative sullage and effluent collected by settled sewer or drains (unsafe way).
Quantum of septage that can be treated at faecal sludge treatment plant as percentage of normative septage generated in city.
Number of households dependent on functional community toilet facil ities near their houses as percentage of total households in city.
Number of households with individual connections to sewerage network, as percentage of total households in city.
Number of households with access to some kind of toilet facil ity (individual and community toilet), as percentage of total households in city (as defined by Joint Monitoring Program
Number of non-functional community and public toilet seats as percentage of total community and public toilet seats.
Number of households in city without any safe sanitation facil ity and resort to open defecation, as percentage of total households in city.
Step-4 Financial Planning
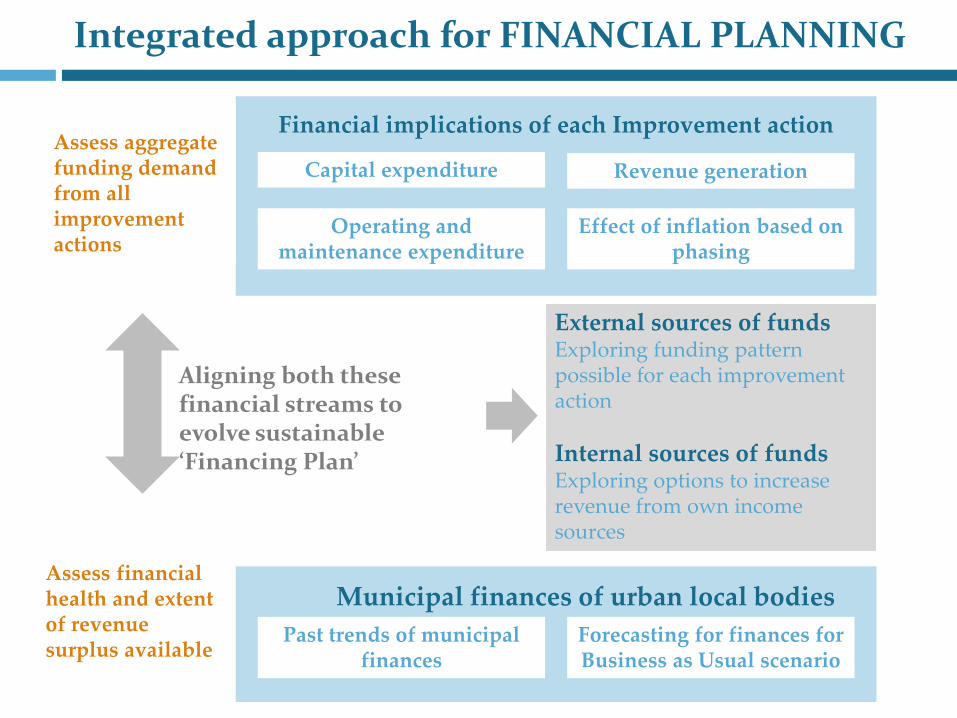
Integrated approach for FINANCIAL PLANNING
Financial implications of each Improvement action
Capital expenditure
Operating and maintenance expenditure
Revenue generation
Effect of inflation based on phasing
Assess aggregate funding demand from all improvement actions
Municipal finances of urban local bodiesPast trends of municipal
financesForecasting for finances for Business as Usual scenario
Assess financial health and extent of revenue surplus available
External sources of fundsExploring funding pattern possible for each improvement action
Internal sources of fundsExploring options to increase revenue from own income sources
Aligning both these financial streams to evolve sustainable ‘Financing Plan’
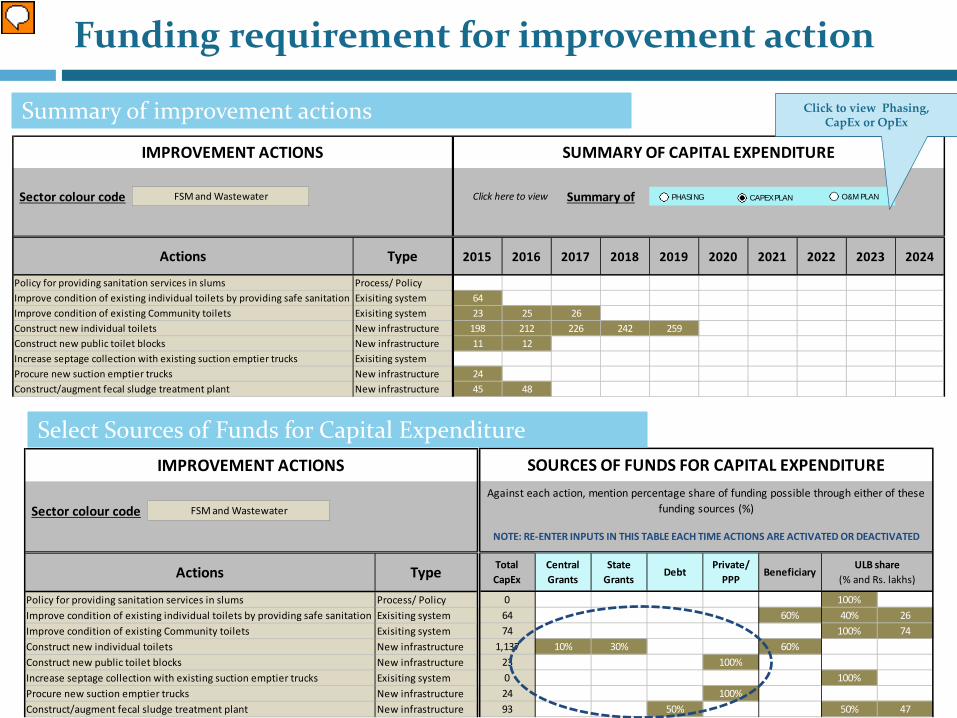
Funding requirement for improvement action
Sector colour code
2015 2016 2017 2018 2019 2020 2021 2022 2023 2024
0 0 0 0 0 0 0 0 0 064 0 0 0 0 0 0 0 0 023 25 26 0 0 0 0 0 0 0
198 212 226 242 259 0 0 0 0 011 12 0 0 0 0 0 0 0 00 0 0 0 0 0 0 0 0 024 0 0 0 0 0 0 0 0 045 48 0 0 0 0 0 0 0 0
Summary of
Type
IMPROVEMENT ACTIONS SUMMARY OF CAPITAL EXPENDITURE
FSM and Wastewater
Procure new suction emptier trucksConstruct/augment fecal sludge treatment plant
Actions
Improve condition of existing individual toilets by providing safe sanitation Improve condition of existing Community toiletsConstruct new individual toiletsConstruct new public toilet blocksIncrease septage collection with existing suction emptier trucks
Process/ PolicyPolicy for providing sanitation services in slums
Click here to view
Exisiting systemExisiting systemNew infrastructureNew infrastructureExisiting systemNew infrastructureNew infrastructure
CAPEX PLAN O&M PLANPHASING
Click to view Phasing, CapEx or OpEx
Total CapEx
Central Grants
State Grants
DebtPrivate/
PPPBeneficiary
0 0% 100% 064 60% 40% 2674 0% 100% 74
1,137 10% 30% 60% 0% 023 100% 0% 0% 00 0% 100% 024 100% 0% 0% 093 50% 0% 50% 47
ULB share (% and Rs. lakhs)
Against each action, mention percentage share of funding possible through either of these funding sources (%)
NOTE: RE-ENTER INPUTS IN THIS TABLE EACH TIME ACTIONS ARE ACTIVATED OR DEACTIVATED
SOURCES OF FUNDS FOR CAPITAL EXPENDITURE
Sector colour code
Type
IMPROVEMENT ACTIONS
FSM and Wastewater
Procure new suction emptier trucksConstruct/augment fecal sludge treatment plant
Actions
Improve condition of existing individual toilets by providing safe sanitation Improve condition of existing Community toiletsConstruct new individual toiletsConstruct new public toilet blocksIncrease septage collection with existing suction emptier trucks
Process/ PolicyPolicy for providing sanitation services in slumsExisiting systemExisiting systemNew infrastructureNew infrastructureExisiting systemNew infrastructureNew infrastructure
Summary of improvement actions
Select Sources of Funds for Capital Expenditure
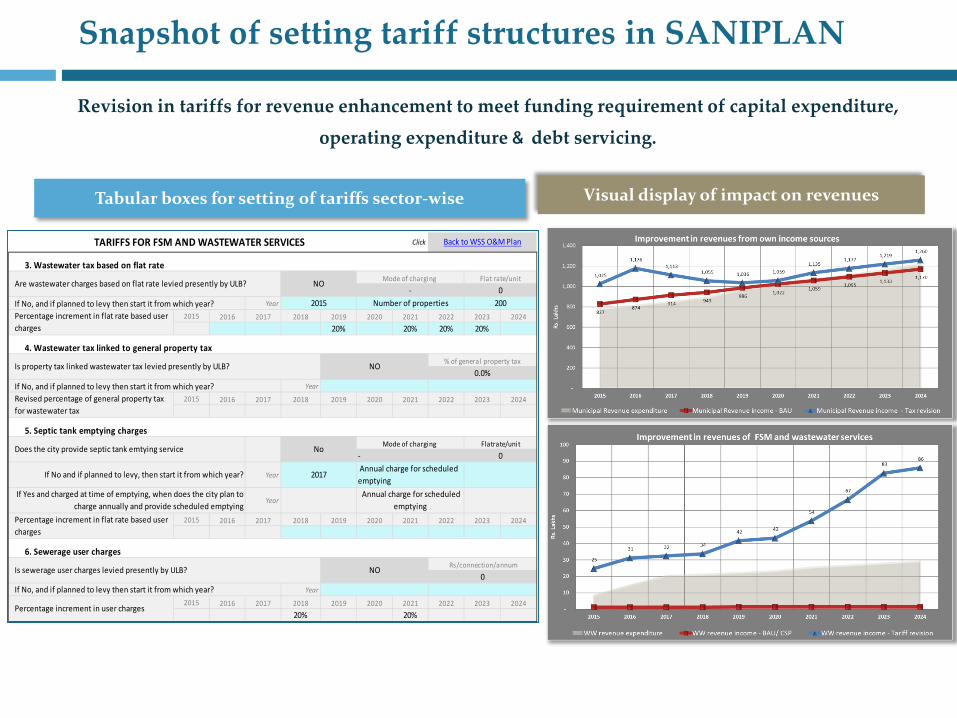
Snapshot of setting tariff structures in SANIPLAN
21
Revision in tariffs for revenue enhancement to meet funding requirement of capital expenditure,
operating expenditure & debt servicing.
Tabular boxes for setting of tariffs sector-wise Visual display of impact on revenues
Click
3. Wastewater tax based on flat rate
Year
2015 2016 2017 2018 2019 2020 2021 2022 2023 202420% 20% 20% 20%
4. Wastewater tax linked to general property tax
Year
2015 2016 2017 2018 2019 2020 2021 2022 2023 2024
5. Septic tank emptying charges
Year
Year
2015 2016 2017 2018 2019 2020 2021 2022 2023 2024
6. Sewerage user charges
Year
2015 2016 2017 2018 2019 2020 2021 2022 2023 202420% 20%
Percentage increment in flat rate based user charges
If Yes and charged at time of emptying, when does the city plan to charge annually and provide scheduled emptying
2017
Mode of charging Does the city provide septic tank emtying service
If No and if planned to levy, then start it from which year?
Mode of charging -
TARIFFS FOR FSM AND WASTEWATER SERVICES Back to WSS O&M Plan
If No, and if planned to levy then start it from which year?
Is sewerage user charges levied presently by ULB? NO
2015
Flat rate/unitNO
No
Number of properties
Is property tax linked wastewater tax levied presently by ULB?
Are wastewater charges based on flat rate levied presently by ULB?
If No, and if planned to levy then start it from which year? 200Percentage increment in flat rate based user charges
Revised percentage of general property tax for wastewater tax
Percentage increment in user charges
Annual charge for scheduled emptying
0 Rs/connection/annum
0.0%% of general property tax
If No, and if planned to levy then start it from which year?
NO
Annual charge for scheduled emptying
Flatrate/unit- 0
0

Snapshot of CapEx and OpEx plan summary in SANIPLAN
Snapshot of Operating plan summary and
tariff structures
Snapshot of Capital plan summary and external sources of
funds
Sources of funds 2015 2016 2017 2018 2019 2020 2021 2022 2023 2024 Total
Already approved CapIn 0 0 0 0 0 0 0 0 0 0 0
Internal fund transfers for CapEx 71 92 17 0 0 0 0 0 0 0 180
Grant-in-aids 79 85 91 97 104 0 0 0 0 0 455
Private contributions 192 139 136 145 155 0 0 0 0 0 767
Borrowings 23 24 0 0 0 0 0 0 0 0 47
Debt servicing requirement 0 2 5 5 7 9 8 8 7 7 57
DSCR feasible :- - Yes Yes Yes Yes Yes Yes Yes Yes Yes -
REVIEW OF EXTERNAL FUNDING
FSM AND WASTEWATER CAPITAL PLAN
0
50
100
150
200
250
300
350
400
2015 2016 2017 2018 2019 2020 2021 2022 2023 2024Rs
. Lak
hs
CapEx financing sources
WSS CapEx WSS own CapIn funds WSS rev surplus transfer Non WSS CapIn surplus transfer
Grants Public contributions Borrowings Opening balance
2014 2015 2016 2017 2018 2019 2020 2021 2022 2023 2024
1156 1156 1156 1156 1156 1156 1156 1156 1156 1156 1156
0 0 0 0 0 0 0 0 0 0 0
0 0 300 300 300 330 330 330 363 363 363
0 0 0 0 0 0 0 0 0 0 0
1156 1156 1456 1456 1456 1486 1486 1486 1519 1519 1519
- 0% 26% 0% 0% 2% 0% 0% 2% 0% 0%
- Yes Yes Yes Yes Yes Yes Yes Yes Yes Yes
Annual demand from HHs depending on septic tanks
Annual increment
FSM AND WASTEWATER OPERATING PLAN
REVIEW OF TAXES AND CHARGESAverage tax demand
(per household per annum)
Property tax
Wastewater tax
Annual septic tank emptying charges
Operating ratio feasible :-
Sewerage tax
-
50
100
150
200
250
300
350
2015 2016 2017 2018 2019 2020 2021 2022 2023 2024
Rs. L
akhs
OpEx financing sources
WSS OpEx WSS rev inc - BAU WSS rev inc - CSP actions
WSS rev inc - Tariff revision Non WSS rev surplus transfer Opening balance
SANIPlan Dashboard
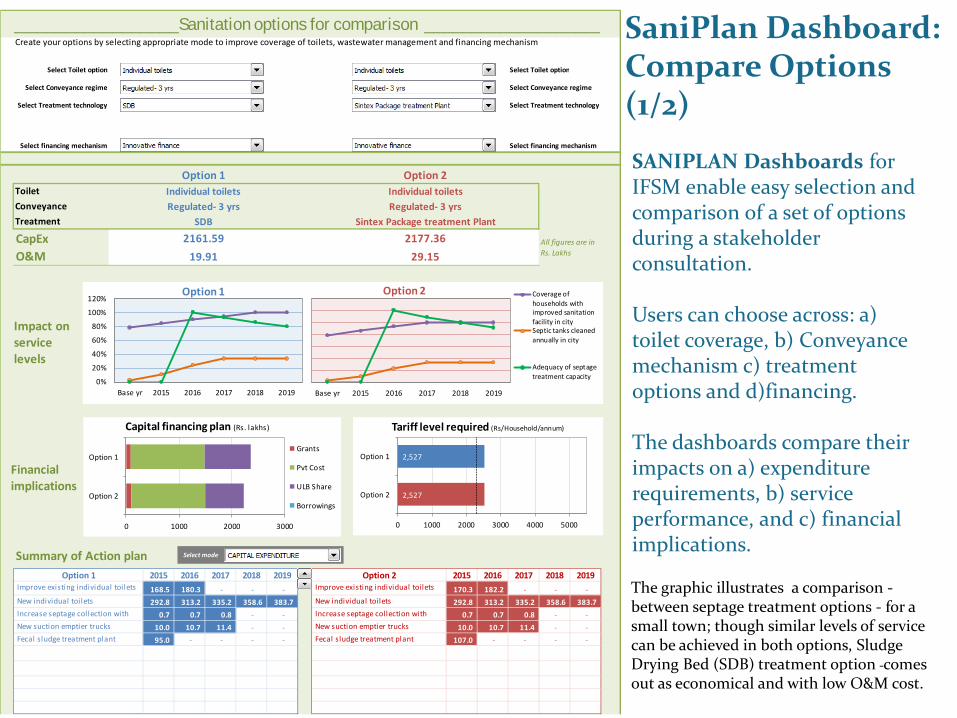
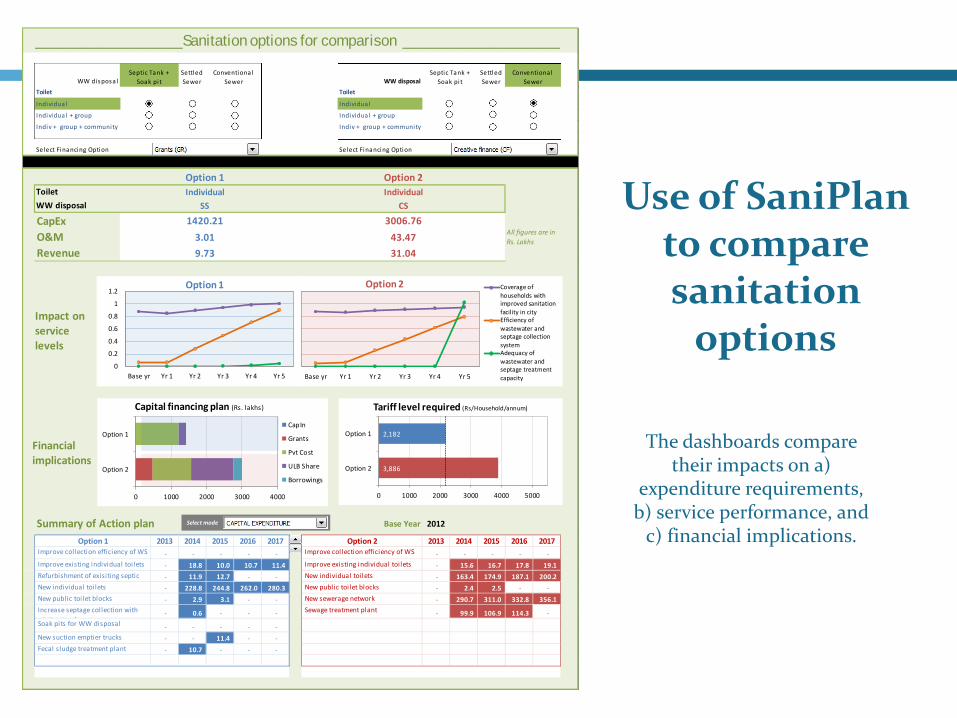
SaniPlan Dashboard: Compare Options (1/2)
SANIPLAN Dashboards for IFSM enable easy selection and comparison of a set of options during a stakeholder consultation.
Users can choose across: a) toilet coverage, b) Conveyance mechanism c) treatment options and d)financing.
The dashboards compare their impacts on a) expenditure requirements, b) service performance, and c) financial implications.
The graphic illustrates a comparison -between septage treatment options - for a small town; though similar levels of service can be achieved in both options, Sludge Drying Bed (SDB) treatment option comes out as economical and with low O&M cost.
Create your options by selecting appropriate mode to improve coverage of toilets, wastewater management and financing mechanism
Select Toilet option Select Toilet option
Select Conveyance regime Select Conveyance regime
Select Treatment technology Select Treatment technology
Select financing mechanism Select financing mechanism
Toilet ConveyanceTreatment
2015 2016 2017 2018 2019 2015 2016 2017 2018 2019168.5 180.3 - - - 170.3 182.2 - - - 292.8 313.2 335.2 358.6 383.7 292.8 313.2 335.2 358.6 383.7
0.7 0.7 0.8 - - 0.7 0.7 0.8 - - 10.0 10.7 11.4 - - 10.0 10.7 11.4 - - 95.0 - - - - 107.0 - - - -
Sintex Package treatment Plant
2177.3629.15
SDBRegulated- 3 yrsIndividual toilets Individual toilets
New suction emptier trucks New suction emptier trucks
2161.59CapExO&M
__________________Sanitation options for comparison ___________________
Option 2Option 1
New individual toilets Increase septage collection with
Improve existing individual toilets
Summary of Action plan
Improve existing individual toilets
New individual toilets Increase septage collection with
Option 1 Option 2
Regulated- 3 yrs
19.91All figures are in Rs. Lakhs
Fecal sludge treatment plant
Fecal sludge treatment plant
0%
20%
40%
60%
80%
100%
120%
Base yr 2015 2016 2017 2018 2019
Option 1
Base yr 2015 2016 2017 2018 2019
Option 2 Coverage ofhouseholds withimproved sanitationfacility in citySeptic tanks cleanedannually in city
Adequacy of septagetreatment capacity
0 1000 2000 3000
Option 2
Option 1
Capital financing plan (Rs. lakhs)
Grants
Pvt Cost
ULB Share
Borrowings
Impact on service levels
Financial implications
2,527
2,527
0 1000 2000 3000 4000 5000
Option 2
Option 1
Tariff level required (Rs/Household/annum)
Select mode
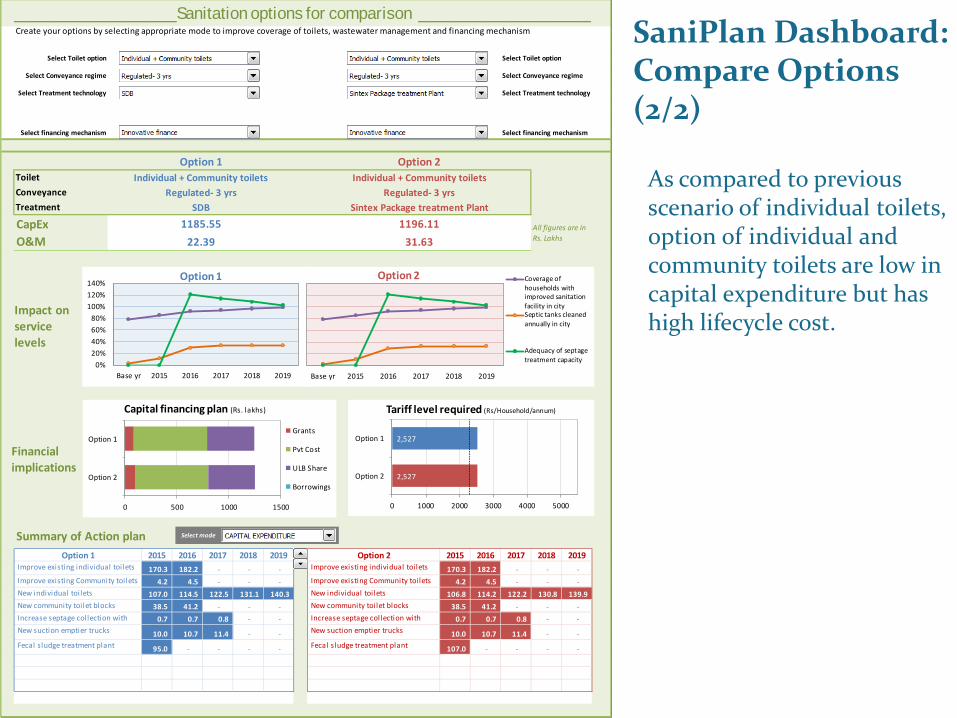
SaniPlan Dashboard: Compare Options (2/2)
As compared to previous scenario of individual toilets, option of individual and community toilets are low in capital expenditure but has high lifecycle cost.
Create your options by selecting appropriate mode to improve coverage of toilets, wastewater management and financing mechanism
Select Toilet option Select Toilet option
Select Conveyance regime Select Conveyance regime
Select Treatment technology Select Treatment technology
Select financing mechanism Select financing mechanism
Toilet ConveyanceTreatment
2015 2016 2017 2018 2019 2015 2016 2017 2018 2019170.3 182.2 - - - 170.3 182.2 - - -
4.2 4.5 - - - 4.2 4.5 - - - 107.0 114.5 122.5 131.1 140.3 106.8 114.2 122.2 130.8 139.9
38.5 41.2 - - - 38.5 41.2 - - - 0.7 0.7 0.8 - - 0.7 0.7 0.8 - -
10.0 10.7 11.4 - - 10.0 10.7 11.4 - -
95.0 - - - - 107.0 - - - -
Sintex Package treatment Plant
1196.1131.63
SDBRegulated- 3 yrs
Individual + Community toilets Individual + Community toilets
New community toilet blocks New community toilet blocks
1185.55CapExO&M
__________________Sanitation options for comparison ___________________
Option 2Option 1
Improve existing Community toilets New individual toilets
Improve existing individual toilets
Summary of Action plan
Improve existing individual toilets
Improve existing Community toilets New individual toilets
Option 1 Option 2
Regulated- 3 yrs
22.39All figures are in Rs. Lakhs
Increase septage collection with New suction emptier trucks
Fecal sludge treatment plant Fecal sludge treatment plant
Increase septage collection with New suction emptier trucks
0%20%40%60%80%
100%120%140%
Base yr 2015 2016 2017 2018 2019
Option 1
Base yr 2015 2016 2017 2018 2019
Option 2 Coverage ofhouseholds withimproved sanitationfacility in citySeptic tanks cleanedannually in city
Adequacy of septagetreatment capacity
0 500 1000 1500
Option 2
Option 1
Capital financing plan (Rs. lakhs)
Grants
Pvt Cost
ULB Share
Borrowings
Impact on service levels
Financial implications
2,527
2,527
0 1000 2000 3000 4000 5000
Option 2
Option 1
Tariff level required (Rs/Household/annum)
Select mode
Select Option 1 Select Option 2WW disposa l WW disposal
Individual Individual
Individual + group Individual + group
Indiv + group + community Indiv + group + community
Select Financing Option Select Financing Option
Toilet WW disposal
2013 2014 2015 2016 2017 2013 2014 2015 2016 2017- - - - - - - - - - - 18.8 10.0 10.7 11.4 - 15.6 16.7 17.8 19.1 - 11.9 12.7 - - - 163.4 174.9 187.1 200.2 - 228.8 244.8 262.0 280.3 - 2.4 2.5 - - - 2.9 3.1 - - - 290.7 311.0 332.8 356.1
- 0.6 - - - - 99.9 106.9 114.3 -
- - - - - - - 11.4 - - - 10.7 - - -
Septic Tank + Soak pi t
Conventional Sewer
Septic Tank + Soak pi t
Settled Sewer
Conventional Sewer
Settled Sewer
New suction emptier trucks Fecal sludge treatment plant
ToiletToilet
Soak pits for WW disposal
Individual IndividualCS
3006.7643.4731.04
SS
2012Base Year
New public toilet blocks New individual toilets
1420.213.019.73
New public toilet blocks Increase septage collection with existing trucks
O&MRevenue
New sewerage network Sewage treatment plant
__________________Sanitation options for comparison ___________________
Option 2Option 1
Improve existing individual toilets Refurbishment of exisiting septic
Improve collection efficiency of WS
Summary of Action plan
Improve collection efficiency of WS Improve existing individual toilets
New individual toilets
Option 1 Option 2
All figures are in Rs. Lakhs
CapEx
0
0.2
0.4
0.6
0.8
1
1.2
Base yr Yr 1 Yr 2 Yr 3 Yr 4 Yr 5
Option 1
Base yr Yr 1 Yr 2 Yr 3 Yr 4 Yr 5
Option 2 Coverage ofhouseholds withimproved sanitationfacility in cityEfficiency ofwastewater andseptage collectionsystemAdequacy ofwastewater andseptage treatmentcapacity
0 1000 2000 3000 4000
Option 2
Option 1
Capital financing plan (Rs. lakhs)
CapIn
Grants
Pvt Cost
ULB Share
Borrowings
Impact on service levels
Financial implications
3,886
2,182
0 1000 2000 3000 4000 5000
Option 2
Option 1
Tariff level required (Rs/Household/annum)
Select mode
Use of SaniPlanto compare sanitation
options
The dashboards compare their impacts on a)
expenditure requirements, b) service performance, and
c) financial implications.
Application of SaniPlan
Thank you
www.pas.org.in
PAS project
@pas_project
http://fb.com/pas.cept
https://twitter.com/pas_project