santa clara county, california - urbandisplacement.org · carpet, sanita.on issues, no...
TRANSCRIPT

Housing Insecurity & Consequences of Displacement
Santa Clara County, California
JUSTINE MARCUS
MIRIAM ZUK, PH.D.
UC BERKELEY

Research Question
What are the impacts of displacement for individuals and families in Santa Clara County?

Study Design

Study Design• Partnerships with Bay Legal and the Law Foundation of Silicon Valley in San Jose
• Potential participants screened by legal aid before participants agree to release their
information to the UC Berkeley study team
• Participants were provided a $40 gift card for participation
• Two Groups:
– Not Displaced: people who either did not move in the last 2 years or moved by own choice
– Displaced: clients who were forced to leave their home because they were displaced:
§ Executed or threatened eviction (prompted by missed
rent payment, owner move-in, etc., or no reason)
§ Told by landlord to leave
§ Property sold
§ Untenable rent increase
§ Felt that the area was too dangerous to stay
§ Landlord wouldn’t make repairs to home
§ Property in foreclosure or condemned
§ Landlord harassment
§ Locked out by landlord
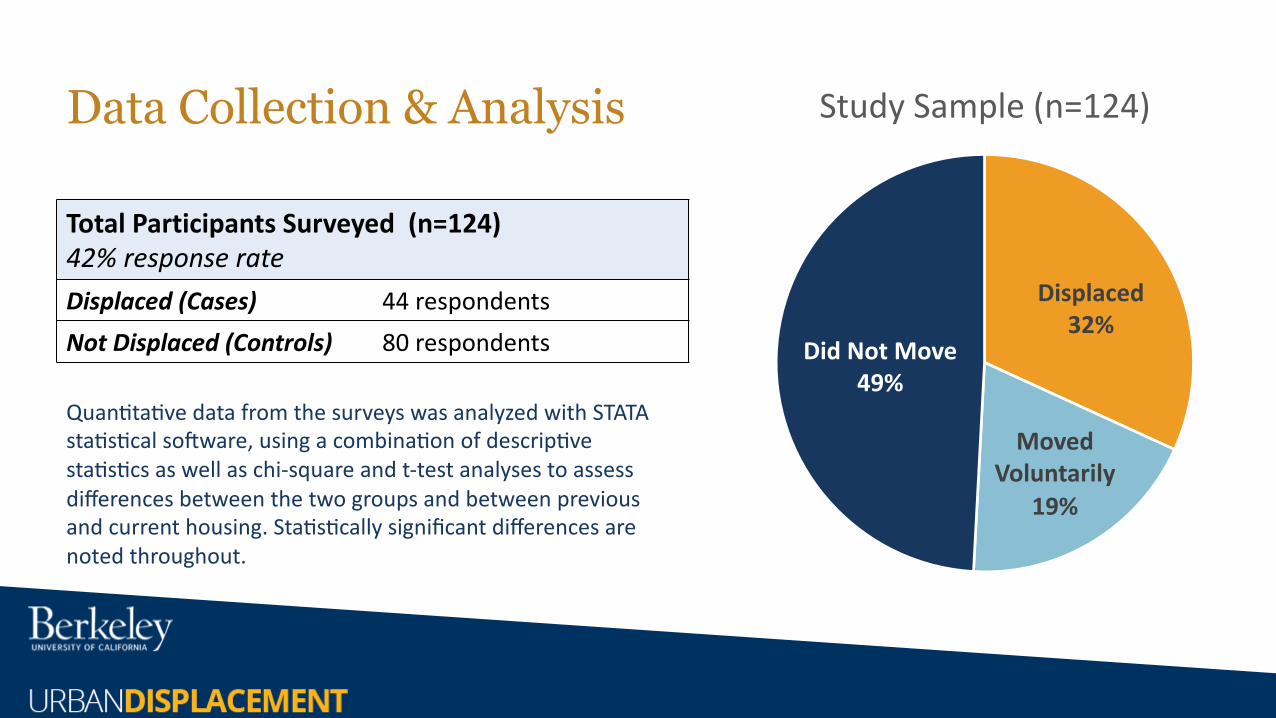
Data Collection & Analysis
Total Participants Surveyed (n=124) 42% response rateDisplaced (Cases) 44 respondents
Not Displaced (Controls) 80 respondents
Quan0ta0ve data from the surveys was analyzed with STATA sta0s0cal so>ware, using a combina0on of descrip0ve sta0s0cs as well as chi-square and t-test analyses to assess differences between the two groups and between previous and current housing. Sta0s0cally significant differences are noted throughout.
Displaced32%
Moved Voluntarily
19%
Did Not Move49%
Study Sample (n=124)

Demographics

14%21%
16%
49%
13%
25%
36%26%
Less than a HS
Diploma
HS Graduate Some College, No
Degree
Associate's,
Bachelor's, Graduate,
or Professional
Degree
Displaced (n=43)
Not Displaced (n=80)
Study Sample: Educational Attainment and Income
Median Monthly Household Income
- Displaced: $2,064
- Not Displaced: $3,119

These differences in disability were significant, despite groups having a
similar average age of 51 years.
In our study sample, participants who were not displaced were statistically more likely to have a disability or have someone in their household with a disability (p<0.05).
58%
78%
Percent of Households with Someone with a Disabilty
Displaced (n=43)
Not Displaced (n=79)

In our study sample, participants who were displaced were more likely to be Black than participants who had not been displaced (p<0.05)*.
30% 32% 32%*
5%22%
42%31%
14%*4%
20%
White Latino Black Asian Other or Multiracial
Displaced (n=44) Not Displaced (n=80)

Overall Housing Instability in Santa Clara County
includes all respondents who were housed and still living in Santa Clara County at the time of the survey

Half of respondents were not comfortable talking to their landlord about repairs or housing concerns.
48%
14%
38%
Very comfortable Somewhat comfortable Not comforable
How comfortable do you feel talking to your landlord about repairs or other housing concerns that you might have?
All Respondents Still Living in SC County (n=92)

1 in 3 respondents fear landlord retaliation for requesting repairs or raising other housing concerns.
36%
3%
Yes Maybe
Do you fear that your landlord will retaliate for requesting repairs or raising other housing issues?
All Respondents Still Livingin SC County (n=94)
Retaliation refers to a landlord taking action against a the tenant in response to these requests —such as evicting or threatening to evict
them, harassing them, or raising the rent

80 percent of respondents reported at least one significant housing issue, such as mold or pests.
80%
At Least 1 Housing Issue
All Respondents Still Livingin SC County (n=101)
Housing issues included defec.ve hea.ng or cooling systems, mold, pests (i.e., rats, roaches), defec.ve appliances or electrical wiring, leaks, falling plaster or holes,
inadequate locks, inadequate trash collec.on, inadequate or no hot water, leaking or clogged plumbing, missing or broken smoke detectors, broken windows, old
carpet, sanita.on issues, no refrigerator, and unsafe stairs or railing.

Almost half of respondents said they thought they would have to leave their home in the next year.
45%
What is the likelihood that you will have to leave this place within the next year?
All Respondents Still Living in SC County (n=89)
Extremely or Somewhat High

Displacement
includes all respondents who were displaced in the last two years

Reason participant was displaced (select all that apply).
2%5%
7%9%9%9%
14%16%
20%27%
32%41%
52%
Landlord went into foreclosureLandlord changed locks and locked resident out
Landlord or relative of landlord to move inMissed payment and thought if didn't leave, would be evicted
Property condemned or deemed illegal to inhabitProperty was sold
Landlord wouldn't make repairsRent raised
Neighborhood was dangerousLandlord harassment or violence
Unlawful detainer or eviction lawsuit or noticeLandlord verbally told resident(s) to leave
EvictedDisplaced (n=44)
Respondents self-reported how and why they were displaced.

8
6
3
1 1 1
Nonpaymentof rent
Nuisance,damage, orillegal usecomplaint
No reasongiven or did
not know
Home wasbeing sold
Landlordgoing to
makerenovations
Owner orfamily move-
in
Reason for Eviction Notice or Unlawful Detainer (n=20)
About half of households (20) who were displaced received a formal eviction notice, but the reasons for the notice varied.
Yes, 20No, 21
Don't Know, 2
Did you receive a formal written eviction notice or unlawful detainer from your landlord ?

Of the 2o households who received a formal eviction notice or unlawful detainer, 13 went to court. Only 5 of those households were accompanied by an attorney.
7
5
8
Received formal eviction notice or unlawful detainer (n=20)
Went to Court without anAttorneyWent to Court with anAttorneyDidn't Go to Court

42%
7%
67%
Signed move-out agreement Received financial buy-out Sought non-legal services or support (i.e.,social services, advocate)
Displaced (n=43)
Of the households that were displaced, several signed move-out agreements and two-thirds sought support.
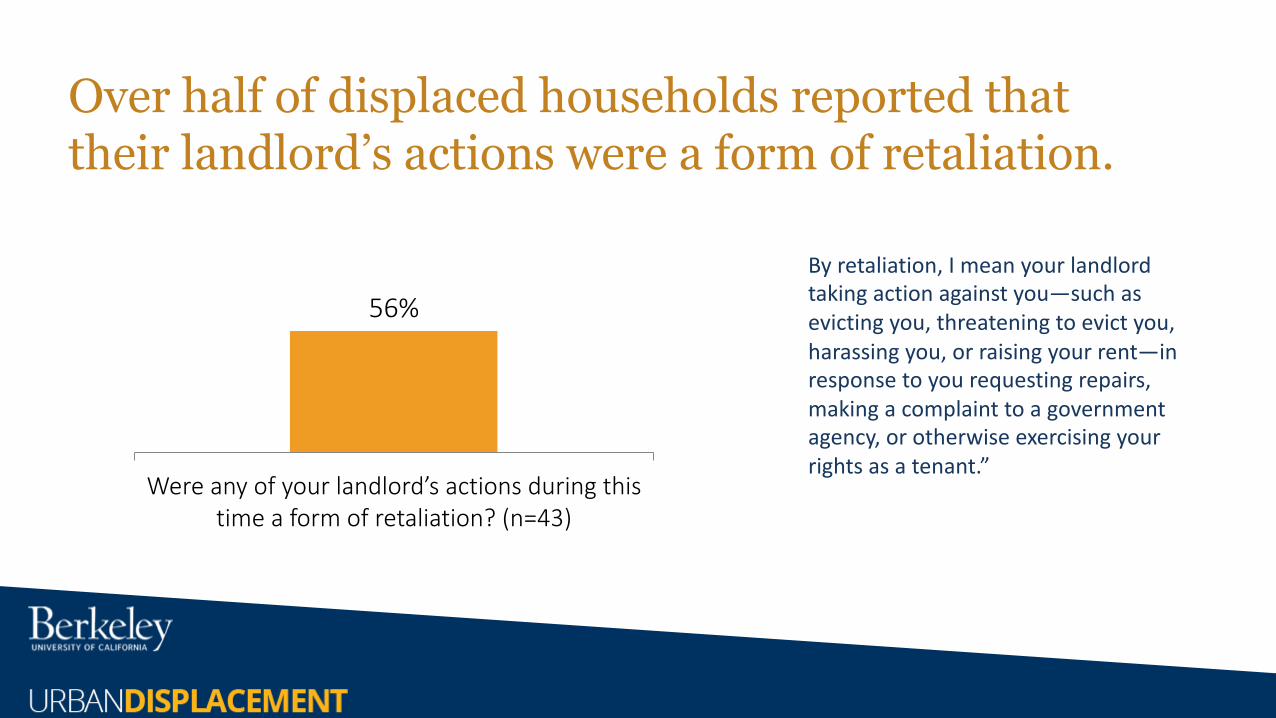
56%
Were any of your landlord’s actions during this time a form of retaliation? (n=43)
Over half of displaced households reported that their landlord’s actions were a form of retaliation.
By retaliation, I mean your landlord taking action against you—such as evicting you, threatening to evict you, harassing you, or raising your rent—in response to you requesting repairs, making a complaint to a government agency, or otherwise exercising your rights as a tenant.”

Housing & Neighborhood Characteristics

Participants who were displaced were statistically more likely to be currently marginally housed (p<0.01).**
75%
5%20%
91%
5% 4%
Housed Homeless Marginally Housed
Displaced (n=44)
Not Displaced (n=80)
Homeless: self-reported living in shelter, on the streets, in a vehicle, or “homeless.’
Marginally Housed: self-reported living in a motel/hotel, garage, or with family or friends in which respondent is “doubling up,” such as sleeping on the couch.

Participants who were displaced were significantly more likely to live in more crowded conditions (p<0.05).*
1.05
0.74
People per Room
Displaced (n=41)
Not Displaced (n=72)
Does not include households who are currently homeless.

Displaced households were statistically more likely to be severely rent burdened, meaning they spend 50 percent or more of their income on rent (p<0.05).*
30% 30%
30%49%
40%21%
Displaced (n=30) Not Displaced (n=61)
Rent Burden: Percent of Income Spent on Rent
Severley Rent Burdened (50%+)
Rent Burdened (30 - 49.9%)
Not Rent Burdened (<30%)
Includes only respondents who reported both rent and income information.

On average, participants reported fewer housing issues (e.g., mold, broken windows, etc.) in their current residence, compared to the home from which they were displaced (p<0.001).***
7
3
Average Number of Household Issues
Before Displaced (n=42)After Displaced (n=42)

45% of displaced respondents live in the same city as where they were living when they were displaced; 9% within a mile of their previous home. Another 34% live in a new city, but still in Santa Clara County.
Same Neighborhod (1 mile)9%
Same City36%
Other City in Santa Clara County34%
Other County in CA7%
Left California9%
Homeless5%
(n=44)

Community
excludes participants currently experiencing homelessness

Participants who were displaced rated their social support and likelihood of community advocacy significantly lower (p<0.05).*
71%
32%*
69%* 64%
81%76%
52%*
87%*
63%75%
I feel I belong in my
neighborhood.
I lend or exchange
things or favors with
my neighbors.*
I would be willing to
work together with
others in my
neighborhood to take
action on a political
issue I care about.*
Living in this
neighborhood gives me
a sense of community
Overall, I am happy
living in my
neighborhood.
Displaced (n=42)
Not Displaced (n=76)

Participants who were displaced felt significantly safer in their new neighborhood (p<0.05).
61%
83%
Felt Very Safe or Quite Safe in their Neighborhood (n=41)*
Before Displaced After Displaced
This difference is largely the result of the nine respondents whose displacement was the result of a safety concern in their former neighborhood. If these individuals are excluded from the analysis, there is no sta=s=cal difference in percep=ons of safety, on average. See details in the next slide.
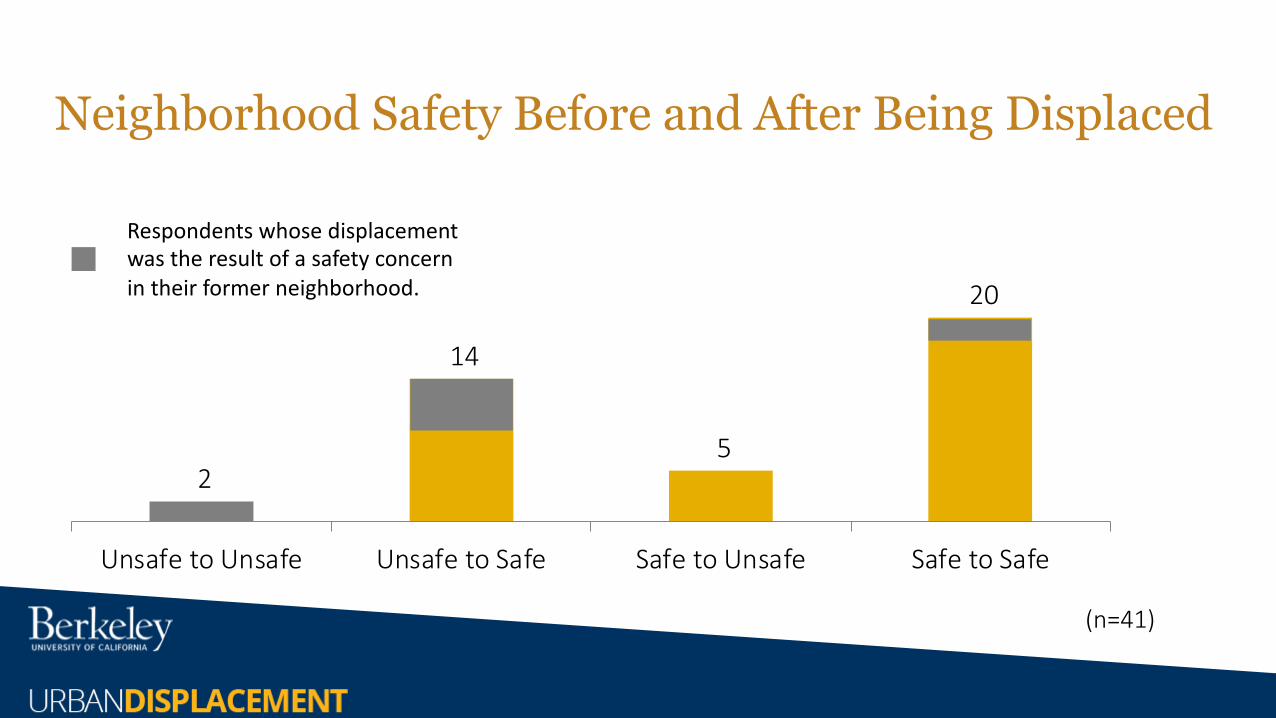
Neighborhood Safety Before and After Being Displaced
2
14
5
20
Unsafe to Unsafe Unsafe to Safe Safe to Unsafe Safe to Safe
(n=41)
Respondents whose displacement was the result of a safety concern in their former neighborhood.

School

Over a third of children in displaced households changed schools due to the move.
13
4
9
4
School-Aged Children in Displaced Households (n=30)
Changed Schools Mid-Year
Changed Schools at Start of Year
Advanced to New School (e.g., started HS)
Did Not Change Schools

Study Challenges• The study population includes individuals who have experienced and continue to
experience profound housing and economic instability. • The study team often found it challenging to schedule survey phone appointments
with potential respondents due to work and childcare schedules, disconnected phone lines, and respondent difficultly finding quiet, private spaces to complete the survey.
• This was especially true for respondents who were currently experiencing homeless or marginally housed.
• The study team also found that respondents were hesitant to participant and/or share certain pieces of information due to privacy concerns. These concerns may have been heightened due to the current policies and practices regarding people who are undocumented.
• These challenge suggest that it is more likely that we under-sampled people who are currently experiencing homelessness or were marginally housed, as well as immigrant communities.

Acknowledgements
• This project has been made possible by a grant from the Silicon Valley Community Foundation.
• This study would not have been possible without the study design and recruitment support from the staff and interns at Bay Legal and the Law Foundation of Silicon Valley.
• Thank you to the other members of the UC Berkeley research team: Juliet Peña Pariona, Noemi Paez, Jenny Feng, Karina Paredes, and Ellen Lee.
• Finally, our gratitude to the survey respondents who shared their time and stories with us.