santander uk investor update q420 live
TRANSCRIPT

Santander UK Group Holdings plc
February 2021
Investor Update for the year ended 31 December 2020

2020 PBT of £552m, down 44% YoY. Adjusted PBT of £710m, down 45%1
£448m Covid-19 related provision for expected credit losses in 2020; credit impairment charges down 43% QoQ. Adjusted Banking NIM1 down 1bp to 1.63% (+9bps QoQ) with deposit repricing actions Operating expenses down 2% YoY and adjusted operating expenses down 5%, through realised efficiency savings
Impact of Covid-19 partially mitigated by
strong net interest income improvement…
Strong net mortgage growth of £4.4bn, with a rebound in application volumes after the Q220 housing market closure £4.6bn of government backed business loans to support customers through the pandemic CET1 of 15.2% (+90bps) and UK leverage ratio of 5.1% (+40bps), both significantly above regulatory requirements LCR of 150% (+10p.p.) with very strong customer deposit growth of £13.9bn (2019: £5.7bn)
Invested £332m and realised £244m of savings since programme start in 2019 with a strategic focus on improving returns while becoming more agile, efficient and responsive to the needs of our customers
Learning from the Covid-19 crisis, including a reassessment of our business operations and adapting to the demands of our customers and employees by becoming more digital and being able to offer more flexibility to our people
2
Transforming for success as an integral
part of Banco Santander’s ‘One Europe’ strategy
Confident in the resilience of our
balance sheet
Delivering a very resilient performance despite the difficult operating environment
Focus on our multi-year transformation
programme
We are confident in the resilience of our balance sheet …
1. The financial results were impacted by a number of specific income, expenses and charges with an aggregate impact on profit before tax of £158m in 2020 (2019: £319m). See Quarterly Management Statement for the year ended 31 December 2020 for further details of APMs and a reconciliation to PBT. Adjusted Banking NIM excludes the beneficial impact on an accounting adjustment made in Q420. See Quarterly Management Statement for the year ended 31 December 2020 for further details
3
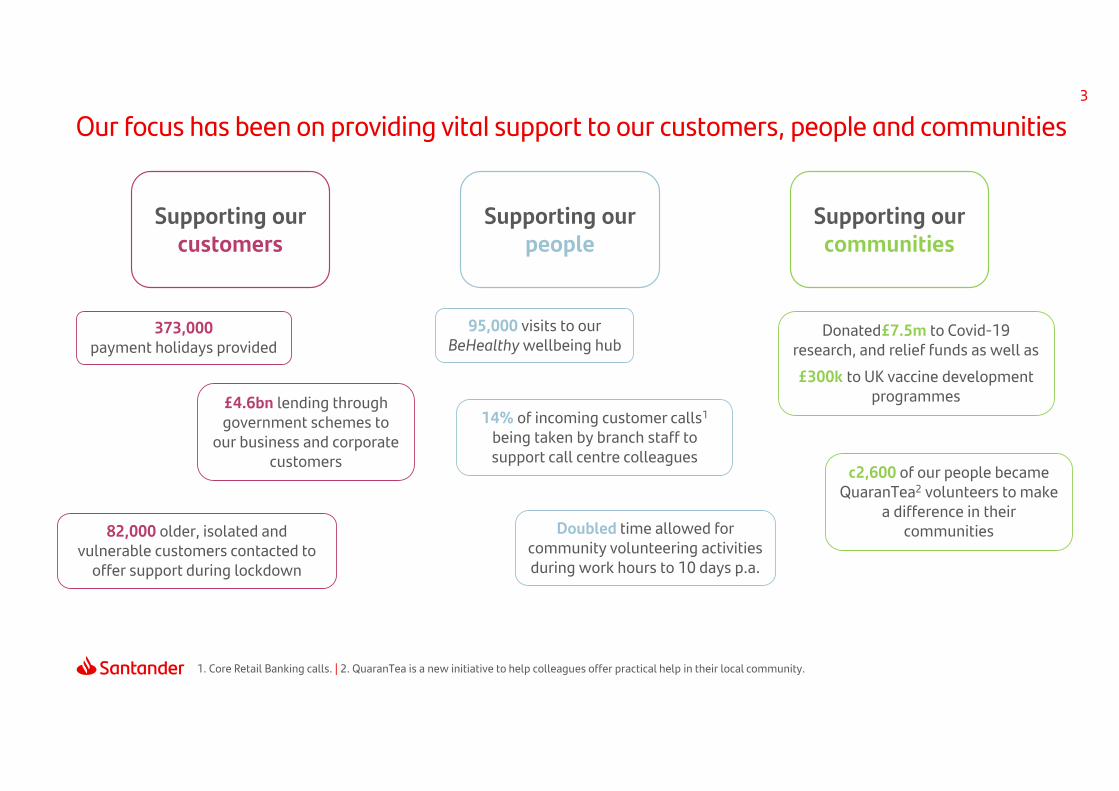
373,000payment holidays provided
Supporting our people
Our focus has been on providing vital support to our customers, people and communities
Supporting our customers
Supporting our communities
Donated£7.5m to Covid-19 research, and relief funds as well as £300k to UK vaccine development
programmes
Doubled time allowed for community volunteering activities during work hours to 10 days p.a.
£4.6bn lending through government schemes to
our business and corporate customers
14% of incoming customer calls1
being taken by branch staff to support call centre colleagues
82,000 older, isolated and vulnerable customers contacted to
offer support during lockdown
c2,600 of our people became QuaranTea2 volunteers to make
a difference in their communities
95,000 visits to our BeHealthy wellbeing hub
1. Core Retail Banking calls. | 2. QuaranTea is a new initiative to help colleagues offer practical help in their local community.

1. Stage 3 ratio is total stage 3 exposure as a percentage of customer loans plus undrawn stage 3 exposures. | 2. The financial results were impacted by a number of specific income, expenses and charges with an aggregate impact on profit before tax of £158m in 2020 (2019: £319m). See Quarterly Management Statement for the year ended 31 December 2020 for further details of APMs and a reconciliation to PBT. | 3. Q420 increase due to £74m UK Bank Levy which is charged annually in Q4
Customer deposits £191.7bn£13.9bn
Mortgage loans £169.8bn£4.4bn
Adj. Banking NIM 1.63%1bps
CET1 capital ratio 15.2%90bps
Stage 3 ratio1 1.42%27bps
Dec20 vs Dec19
Operating income
Adjusted income statement2
Profit before tax
Operating expenses
Provisions3
Credit impairment losses
4
£3,822m6%
£710m45%
£2,258m5%
£209m31%
£645m>100%
Impact of Covid-19 partially mitigated by decisive management actions
Balance sheet highlights
£1,030m3%
£247m4%
£556m1%
£129m>100%
£98m43%
2020 vs 2019 Q420 vs Q320

5
Key trends and 2021 outlookMortgage growth expected to be in line with market
Credit impairment losses expected to be lower than 2020
Banking NIM expected to be broadly in line with Q420
Operating expenses expected to continue to trend downward
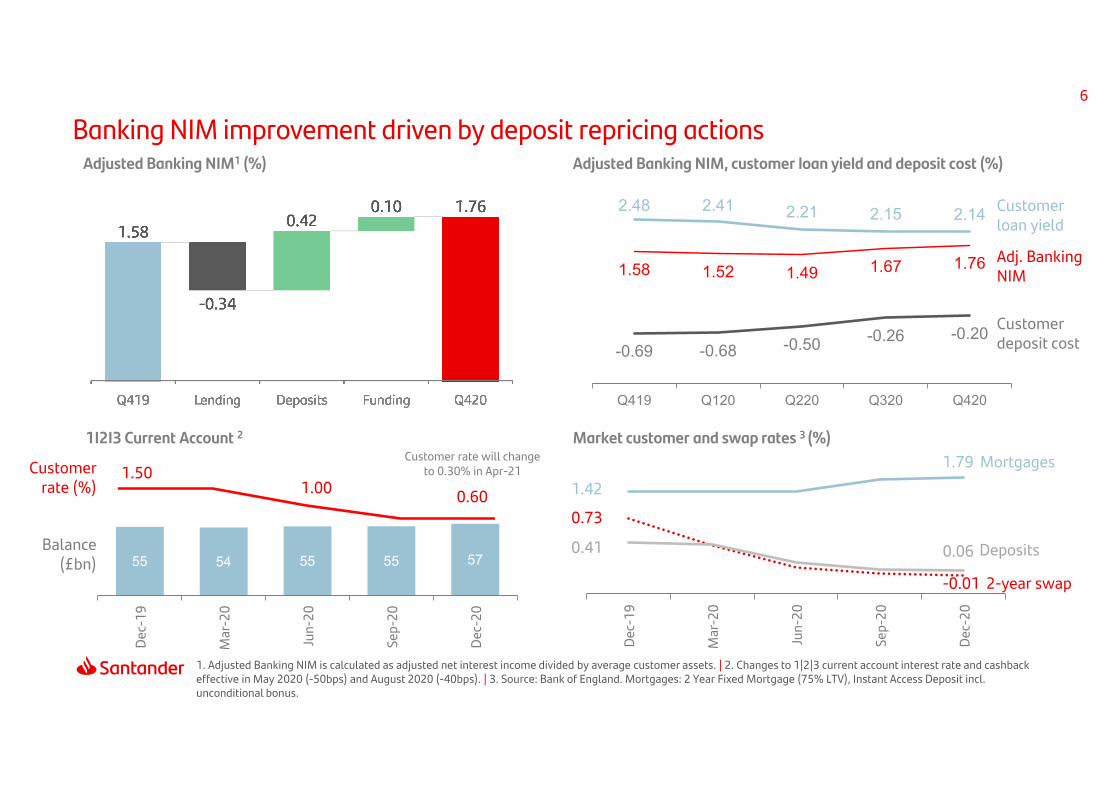
1.58 1.52 1.491.67
1.76
Q419 Q120 Q220 Q320 Q420
Adjusted Banking NIM (%)
588 584565
553 556
Q419 Q120 Q220 Q320 Q420
Adjusted operating expenses (£m)
-6%
83165
211171
98
Q419 Q120 Q220 Q320 Q420
2020: £645mCredit impairment losses (£m)
3.8
2.4
-0.4 0.4 2.0
Q419 Q120 Q220 Q320 Q420
Net mortgage lending (£bn)2020 mortgage growth- Santander UK: 2.7%- Market: 2-3%
Q419 Q120 Q220 Q320 Q420
1.58 1.52 1.49 1.67 1.76
2.48 2.41 2.21 2.15 2.14
-0.69 -0.68 -0.50 -0.26 -0.20
Dec-
19
Mar
-20
Jun-
20
Sep-
20
Dec-
20
Mortgages
2-year swap
Deposits
1.791.42
-0.01
0.41 0.06
0.73
Banking NIM improvement driven by deposit repricing actions
1. Adjusted Banking NIM is calculated as adjusted net interest income divided by average customer assets. | 2. Changes to 1|2|3 current account interest rate and cashback effective in May 2020 (-50bps) and August 2020 (-40bps). | 3. Source: Bank of England. Mortgages: 2 Year Fixed Mortgage (75% LTV), Instant Access Deposit incl. unconditional bonus.
6
1I2I3 Current Account 2 Market customer and swap rates 3 (%)
55 54 55 55 57
Dec-
19
Mar
-20
Jun-
20
Sep-
20
Dec-
201.50
1.00 0.60
Customer rate (%)
Balance (£bn)
Adjusted Banking NIM1 (%) Adjusted Banking NIM, customer loan yield and deposit cost (%)
Customer loan yield
Adj. Banking NIM
Customer deposit cost
Customer rate will change to 0.30% in Apr-21

Underpinned by delivery of One Europe group synergies
1,009933
862
997 1,030
588 584 565 553 556
Q419 Q120 Q220 Q320 Q420
Focus on cost management through our multi-year transformation programme7
1. See Quarterly Management Statement for the year ended 31 December 2020 for further details and a reconciliation of adjusting items (transformation, operating lease depreciation and Covid-19 related expenses)
+1%QoQ
Adjusted operating expenses (£m)Adjusted operating income (£m)
+1%QoQ
58 63 66 55 54
Adjusted cost-to-income ratio (%)1 Transformation programme investment (£m)
Serving our customers better: more efficient network use, digital service model development
Repositioning our corporate footprint: support agile working and collaboration, optimise how and where we work
Digitising the back office: end-to-end IT processes, automation, leverage technology such as cloud and big data
Other: initiatives to improve efficiency and simplification
Generated £244m of savings
Investment

8343 66 49 39
122145
12259
Q419 Q120 Q220 Q320 Q420
10 13 12 9
1116
2630 31
Q419 Q120 Q220 Q320 Q420
Credit impairments increased largely due to Covid-19; underlying performance resilient
1. Cost of risk (CoR) is rolling 12-month credit impairment losses as a percentage of average customer loans. | 2. Covid-19 related ECL build was £500m which equates to Covid-19 credit impairment losses of £448m after the benefit from corporate exposures securitisation. | 3. Other Covid-19 related management judgements
Cost of risk1 (bps) Credit impairments outlook remains highly uncertain
8
1.15% 1.42%20202019
15.5% 19.0%
ECL provision build (£m)
Other
Covid-19 Covid-19 related ECL build 2
Credit impairment losses (£m)
3
Stage 3ratio
Stage 3coverage ratio
Excluding Covid-19 related credit impairment losses
Resilient balance sheet with limited unsecured retail exposure and prudent approach to risk9
Consumer (auto) finance lending (£bn) Credit card & UPL lending (£bn)Mortgage lending (£bn)
157.6
10.4 1.8
Stage 1 Stage 2 Stage 3
85% of customers have LTV of <75%
New business LTV: 64%
- London lending: 60%
- Buy-to-let lending: 65%
54% credit card customers pay-off balance in
full each month
46% of UPL have average loan balance of <£5k
Prime lending with 82% of the book
secured on the vehicle
7.28%Coverage ratio 1
1. Coverage ratio is calculated as ECL divided by exposure.
81%
Customer loans
£210.4bn
Mortgages
1.25%0.01%
7.6
0.4 0.0
Stage 1 Stage 2 Stage 3
62.76%Coverage ratio 1
4%
Customer loans
£210.4bn
Consumer
9.88%0.58
3.9
0.4 0.1
Stage 1 Stage 2 Stage 3
47.70%Coverage ratio 1
2%
Customer loans
£210.4bn
Credit cards& UPL
33.07%1.12
169.8 8.0 4.4
<0.1

Prime mortgage portfolio reflects our prudent approach to risk10
116
31
138
2008 2020
218
280
14 14
2019 2020
Loan loss allowanceGross write-offs
73% of stage 3 is pre-2009 lending
Ave LTV 42%, from 51% in 2008
Mortgage lending origination vintage split (£bn)
169
Loan loss allowance and write-offs (£m)
Pre-2009 1
2009 and later
Stock LTV distribution Mortgage loan size Borrower profile Interest rate profile
>100% <1% >£2.0m <1% Home movers 42% Fixed rate 80%
>85-100% 4% £1.0 to £2.0m 1% Re-mortgagers 31% Variable rate 13%
>75-85% 11% £0.5m to £1.0m 8% First-time buyers 20% Standard variable rate3 7%
>50-75% 41% £0.25m to £0.5m 28% BTL 7%
Up to 50% 44% <£0.25m 62%
Average LTV 42% Ave. loan size (stock)2 £165k BTL balance £11.6bn SVR balance3 £12.6bn
1. Pre-2009 lending in 2008 is Santander UK only. Pre-2009 lending in 2020 includes all books including those originated by Alliance & Leicester, Santander UK only is £27bn. |2 Average loan size of new business £218k. | 3. Standard variable rate includes follow on rate.
0.3
0.4
0.30.3
0.60.8
1.1
1.2
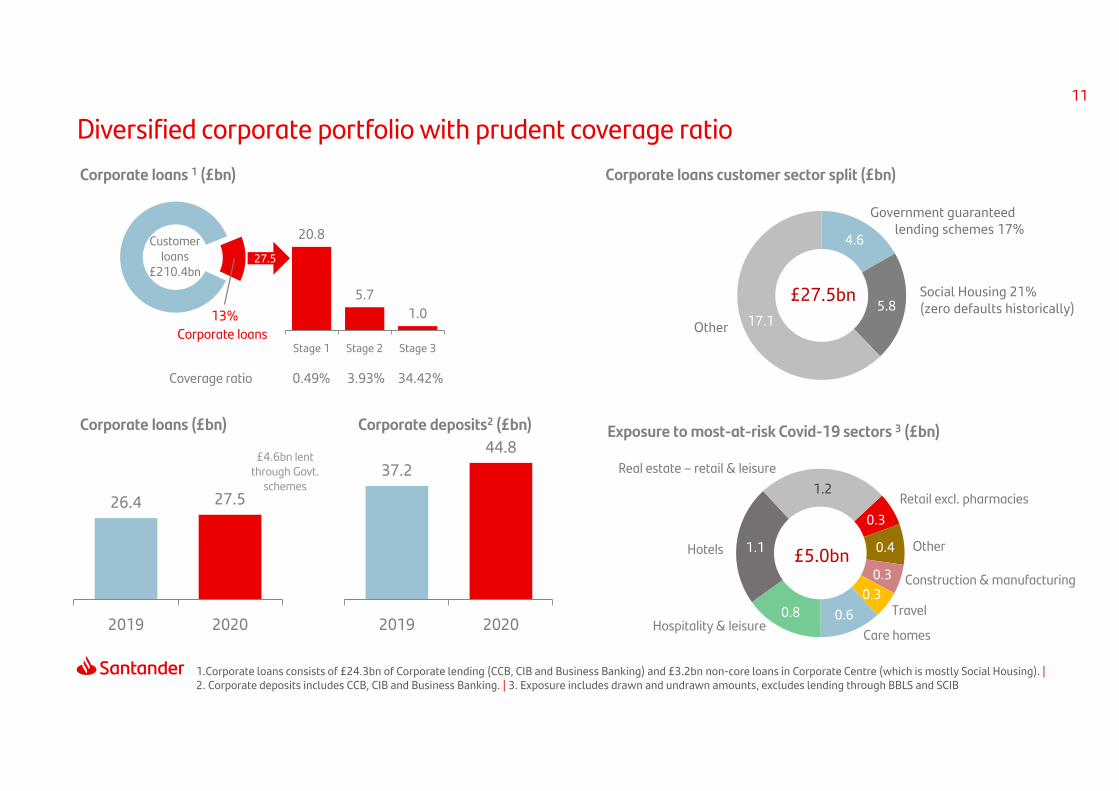
£5.0bn
Exposure to most-at-risk Covid-19 sectors 3 (£bn)
Hotels
Care homes
Real estate – retail & leisure
Travel
Retail excl. pharmacies
Hospitality & leisure
Construction & manufacturing
Other
Corporate loans customer sector split (£bn)
Government guaranteed lending schemes 17%
Social Housing 21%(zero defaults historically)
Other
4.6
5.817.1
£27.5bn
Diversified corporate portfolio with prudent coverage ratio11
1.Corporate loans consists of £24.3bn of Corporate lending (CCB, CIB and Business Banking) and £3.2bn non-core loans in Corporate Centre (which is mostly Social Housing). |2. Corporate deposits includes CCB, CIB and Business Banking. | 3. Exposure includes drawn and undrawn amounts, excludes lending through BBLS and SCIB
20.8
5.7 1.0
Stage 1 Stage 2 Stage 3
34.42%Coverage ratio
13%
Customer loans
£210.4bn
3.93%0.49%
27.5
Corporate loans 1 (£bn)
26.4 27.5
2019 2020
37.244.8
2019 2020
Corporate loans (£bn) Corporate deposits2 (£bn)
Corporate loans
£4.6bn lent through Govt.
schemes

Supporting our customers through Covid-19 uncertainty with payment holidays12
1. Breakdown of PH by value at 31 December 2020
Breakdown of PH granted 1
98%
75%
77%
77%
89%
2%
12%
13%
11%
8%
8%
4%
8%
2%
4%
6%
4%
2%
Up to date after PH Ongoing PH
New to arrears after PH end In arrears before PH granted
37.1
0.5
0.2
0.1
2.4
Total PHgranted 1
(£bn)
2.5
0.1
<0.1
<0.1
0.1
OutstandingPH
(£bn)
251,000
54,000
34,000
32,000
2,500
Customerssupported
Mortgages
Consumer(auto) finance
UPLs
Credit cards
Business &corporates

Strong capital and liquidity positions
12.213.2
14.315.2
2017 2018 2019 2020
CET 1 ratio (%)
Liquidity coverage ratio (%)1
120
164142 150
2017 2018 2019 2020
13
1. Santander UK plc. With effect from 1 January 2019, and in accordance with our ring-fence structure, SFS was withdrawn from Santander UK’s Domestic Liquidity Sub-group. We now monitor and manage liquidity risk for Santander UK plc and SFS separately
CET1 ratio improved and remains significantly above regulatory requirements
UK leverage ratio at 5.1%, was 1.5p.p. above the regulatory requirement
LCR increase reflects very strong customer deposit growth of £13.9bn (2019: £5.7bn)
UK leverage ratio (%)
4.4 4.5 4.7 5.1
2017 2018 2019 2020

Fixed IncomeAppendix

Resilient position through strong capital build and active RWA management 15
1. Net Balance sheet growth across Retail, Corporate and CIB. | 2. Lower deduction of negative amounts resulting from the calculation of regulatory expected loss amounts. | 3. IRFS9 adjustment and other intangible assets. | 4. Oct 2020 EBA technical standards specifying the prudential treatment of software assets likely to be reversed by UK regulator. | 5. RWA includes c£250m of change in treatment of software assets.
Capital and leverage
CET1 ratio (%)
UK leverage ratio (%)
RWAs (£bn)
Dec20Dec18Dec17
OpCo total capital (%)
HoldCo total capital (%)
12.2
4.4
87.0
19.3
17.8
287.0
13.2
4.5
78.8
20.3
19.1
275.6
15.2
5.1
72.95
21.2
21.1
258.9Leverage exposure (£bn)
T2 1.6% T2 1.6%
Dec19
14.3
4.7
73.2
21.7
21.6
269.2
CET1 ratio improved by 90bps year on year, an increase to £11.1bn in CET1 capital
The UK leverage ratio improved by 40bps year on year primarily through improvement in CET1 capital and active management of leverage exposures
The impact of adverse market driven movements in the defined benefit pension schemes was offset by a lower deduction of regulatory expected loss amounts over credit provisions
CET1 ratio includes a benefit of c.30bps and UK leverage ratio c.10bps from the change in treatment of software assets outlined in the EBA technical standard on the prudential treatment of software assets
In line with the PRA recommendation on 10 December 2020, Santander UK paid an interim dividend for 2020

Maintaining resilient capital position in a changing regulatory environment 16
Total capital ratios - RWA
Santander UK plc Santander UK Group Holdings plc
1. Distribution restrictions expected to apply if Santander UK’s CET1 ratio fell between current Regulatory Minimum Capital level, equal to CRD IV 4.5% minimum plus Pillar 2A and the CRD IV buffers | 2. At 31 Dec 2020, Santander UK Group Holdings plc and Santander UK plc Pillar 2A requirements were 4.94% (2.8% CET1).
Capital requirements - RWA
Buffer to MDA increased to 5.4%, driven by the increase in CET1 and the reduction of the UK counter cyclical buffer (CCyB) to 0%
At 31st Dec SanUK’s P2A capital requirement remained with an RWA percentage based element
During 2020 we continued to manage towards our end state capital structure, with the removal of c.£530m of legacy Opco capital instruments
Our AT1 outstanding is sized on leverage ratio requirements
Leverage – RWA Basis

17
End state Loss Absorbing Capacity HoldCo requirements1,2,3
Santander UK end state MREL is forecast to be driven by CRR leverage
Combined Buffer Requirement (CBR) will always be fulfilled from CET1
MREL recapitalisation management buffer size will be driven by the value of Holdco senior unsecured securities due to become MREL ineligible during the preceding 6 months
1. Assumes RWA and Leverage Exposure are as of the end of 2020 | 2. At December 2020, Santander UK Group Holdings Pillar 2A requirements was 4.94%. | 3. End state requirements as of Jan 2022 | 4. Combined Buffer Requirement includes CCB 2.5% & CCyB 0% and will be met exclusively with CET1

Proven resilience in Bank of England stress tests 18
In the 2019 ACS test, Santander UK had the lowest CET1 drawdown across UK banks, the 3.1% drawdown (post Non-dividend strategic management actions) compares favourably to our current 5.4% buffer to MDA
In December 2020, the Financial Policy Committee (FPC) judged that UK banks, in aggregate, have capital buffers that allow them to lend in, and remain resilient to, a wide range of possible outcomes for the UK and global economies
This ‘reverse stress test’ conducted by the FPC in August 2020, concluded that the macroeconomic scenarios required to generate such losses would need to be very severe, with UK unemployment peaking at around 15%
3.15.2 6.3 7.2 9.1
18.6
Santander Barclays RBS HSBC Lloyds Nationwide
Bank of England scenarios
1. Source: BoE, Financial Stability Report, Dec 19. | 2. Source: BoE, Interim Financial Stability Report, May 2020. | 3. Santander UK IRFS9 Base case. | 4. CET1 drawdown is post Non-dividend ‘strategic’ management actions only.
BoEStressACS 20191
BoECovid-19Desktop
20202
2019Y/E
2020Y/E3
2021 (f)3
% % % % %UK GDP Growth (4.7) (14) 1.3 (11.5) 4.5
Unemployment 9.2 8 3.8 6.8 7.5House Price Inflation (33) (16) 2.3 3.8 (2.0)
Base rate 4.0 0.2 0.75 0.1 0.1
Performance at the BoE stress ACS 2019 test4

Strong funding position across a diverse range of products19
2021 2022 2023 2024
Average spread1
(%)
MTF maturities (£bn, Dec20)2MTF issuance (£bn)
Senior Holdco3
Senior OpCoSecured Funding4
15.5
7.1 6.7
17.2
Opco T2
TFSME impact to fundingTerm funding stock (£bn, Dec20)
OpCo Senior unsecuredSubordinated debtCovered bonds
HoldCo Senior unsecured
TFS
SecuritisationSecured funding
TFSME
1. Average spread is the weighted margin above SONIA for issuance in that calendar year. | 2. Includes issuances from Santander Consumer Finance UK and associated joint ventures and TFS. | 3. Earliest between first call date and maturity date. | 4. Including TFS & TFSME.
0.74 0.74 0.78 0.79
7.3
14.8
4.1 5.4
2017 2018 2019 2020
Average duration:38 months
18
2
79
21
12
6
44
Outstanding stock: £57bn
Initial allowance
Expected additional allowance
2020 Drawing
Excess Capacity

Santander UK group down-streaming model20
1. Meeting MREL eligibility criteria and exchange rates at 31 Dec 2020. | 2. Senior loan. | 3. Secondary non-preferential. | 4. Santander Financial Services formerly ANTS. | 5. Santander Equity Investments Limited. | 6. Santander UK other subsidiaries will have limited on-going funding requirements.
Current down-streaming of HoldCo issuance1
Other subsidiaries 6
Sant
ande
r UK
Grou
p Ho
ldin
gsRe
solu
tion
entit
ySa
ntan
der U
K pl
cM
ater
ial s
ubsi
diar
y
Recapitalisation
Senior HoldCo
Loss absorption
SEIL5
T2
AT1
SNP3 debt
T2
AT1
INTERNAL MREL
SFS4
2% 1%
£830m
11%
£2.2bn£7.5bn
100% 87%
SL2
94%5%
Wholesale funding model
No guarantee100% owned
Banco Santander SA
Multiple point of entry resolution group
No guarantee100% owned
Santander UK Group Holdings plcHoldCo
Santander UK plcRing-fenced bank
Single point of entry resolution group
Other subsidiaries
(including SFS4)
No guarantee100% owned
The PRA regulates capital, liquidity (including dividends) and large exposures
Requirement to satisfy the PRA that we can withstand capital and liquidity stresses on a standalone basis
issues
issues
Senior unsecured
Secured funding
Subordinated debt
Senior unsecured(MREL)

Credit ratings – January 202121
Opco - Santander UK plcHoldco - Santander UK Group Holdings plc
A / A-1 / Negative A1 / P-1 / Negative A+ / F1 / Negative
AAA Opco Covered Bond Aaa Opco Covered Bond AAA Opco Covered BondAA+ Aa1 AA+AA Aa2 AAAA- Aa3 AA-A+ A1 Opco Senior Unsecured A+ Opco Senior UnsecuredA Opco Senior Unsecured A2 A Holdco Senior UnsecuredA- A3 A-
BBB+ Baa1 HoldcoSenior UnsecuredTier 2
BBB+ Holdco Tier 2
BBB Holdco Senior Unsecured Baa2 BBBBBB- Baa3 BBB- Holdco AT1BB+ Holdco Tier 2 Ba1 Holdco AT1 BB+BB Ba2 BBBB- Ba3 BB-B+ Holdco AT1 B1 B+
Moody’sS&P Fitch

Strategy and responsible bankingupdate

Delivering on our strategic priorities23
Our strategic priorities are aligned to Banco Santander’s One Europe strategy, with a focus on customer loyalty, simplification, improved efficiency and sustainable growth, while aiming to be the best bank for all our stakeholders.
We are transforming the business for success in order to meet changing customer needs and deliver on our purpose to help people and businesses prosper.
Further information on our strategy and how we measure success will be provided in our 2020 Annual Report due to be published in March 2021 alongside our ESG Supplement, detailing our sustainability strategy
31.12.20 31.12.19
1. Grow customer loyalty by providing an outstanding customer experienceLoyal customers (million) 4.4 4.6Digital customers (million) 6.3 5.8Retail net promoter score (NPS) 8th 4thBusiness and corporate NPS 1st 1st
2. Simplify and digitise the business for improved efficiency and returns
Adjusted RoTE 4.2% 7.8%Adjusted cost-to-income ratio 59% 59%
3. Invest in our people and ensure they have the skills and knowledge to thrive
Top 10 company to work for Medium term aim
4. Further embed sustainability across our businessFinancially empowered people 500,000 248,100
Customers remain at the heart of what we do and a key part of our strategy although we have seen some deterioration in our KPIs for loyal customers and retail NPS this year. This followed 1I2I3 Current Account repricing actions linked to base rate reductions however balances have improved over the year and overall account numbers have remained broadly stable

Our journey to become a more sustainable bank24
5-year plan to transition from philanthropic CSR to strategic sustainability
Launched new sustainability strategy
Set sustainability targets. Enhanced ESG disclosures
Times Top 50 Employer for Women 2020
Deliver on the next stage of our strategy, including priority areas
and ambition set by the Board, and set mid-term strategic targets
Creation of Sustainability Business Partners
Sustainability team moves to CEO office
Banco Santander issues €1 billion green bond to finance 360 renewable energy projects across Europe and the Americas
Responsible banking targets set including a commitment to provide more than €120bn in green finance by 2025
Committed to UN Principles for Responsible Banking
Awarded top ranking in DJSI World as most sustainable bank
No. 1 in Bloomberg Gender Equality index
Board Responsible Banking Committee
established
Responsible banking chapter included in
Annual Report
Ongoing ESG investor engagement programme
Analysis of mortgage book for climate
related physical risks
For more on ESG:
For more on ESG:
Completed materiality assessment
202020192018 2021
Plan to publish our first Diversity Pay Report
Banco Santander
Above the timeline
Below the timeline
Santander UK
2021-2025 ESG targets

Embedding ESG across our business and stepping up Covid-19 support25
Helping our communities to prosper
£7.5m donatedfor Covid-19research and relief
> 10,000 scholarshipsgranted
Promoting sustainable economic growth
100%renewable electricity used in 2019
Driving financial inclusion c82,000older, isolated or vulnerable customers contacted to offer support
Creating a thriving culture82%of our people proud to work for Santander UK
32% women in senior positions
500,000people financially empowered
Increasing customer contact throughout lockdown• During lockdown we saw a significant increase in online
customer chat volumes as people were unable to access our branches
• We trained and enabled branch staff to help deal with increased customer calls volumes
• We were concerned that many of our elderly and vulnerable customers would be isolated during lockdown and we proactively contacted those most at risk to offer support
Scam awareness to help our customers keep their money safe• Fraud and scams cost people in the UK >£10bn p.a.• We have been running online scam awareness events to help
people spot the signs of common scams and keep their money safe. This is especially important as scammers have been more active and taking advantage of the Covid-19 crisis
Additional support for our charity partners• £3m donation to our charity partners Age UK and Alzheimer’s
Society to help with immediate Covid-19 needs• Focused on becoming the best ‘dementia friendly’ bank in the
UK. 34% of our people completed Dementia Friend e-learning to help them support vulnerable customers and colleagues>1,700 attendees
online scam awareness courses
> 99%waste recycled or diverted from landfill
Great Place to Workaccredited
x4 increaseonline customer chat volumes (Q220 v Q120)
1.2 million 1properties assessed under initial climate change risk analysis
Additional support to help with Covid-19 crisis
1. We have conducted an initial high-level analysis of climate change related impacts on credit portfolios based on various climate scenarios. We have c1.2 million properties in our mortgage book and we are studying and analysing climate related risks on these by working with partners to access to detailed property information

Appendix

27
Economic scenarios (%)
Wide range of potential outcomes for the UK economy
Downside 3
Downside 2
Downside 1
Base case
Upside
GDP 2020 (11.5) (11.1) (10.5) (11.5) (10.5)
2021 (8.0) (0.8) 4.0 4.5 4.8
2022 3.1 3.2 3.6 6.1 4.9
Base rate 2020 0.10 0.10 0.10 0.10 0.10
2021 (0.50) 0.75 0.10 0.10 0.25
2022 0.0 1.75 0.10 0.10 0.75
House price inflation (HPI)
2020 3.5 3.7 3.7 3.5 3.7
2021 (19.7) (11.3) (5.4) (2.0) (4.6)
5-yr CAGR (4.4) (4.5) (2.0) 1.4 0.5
Unemployment(ILO)
2020 6.8 6.3 6.3 6.8 6.3
2021 11.4 8.5 6.5 7.5 6.1
5-yr peak 11.9 8.8 6.5 7.9 6.3
Weighting 10 25 15 45 5
GDP: Annual growth rate. HPI: Annual growth rate, Q4.
Base case GDP (%)
1.0
-21.5
-12.9
15.9 10.42.7
-30
-20
-10
0
10
20
Q419 Q420 Q421 Q422
-30
-20
-10
0
10
20
30
Q419 Q420 Q421 Q422
UpsideDownside 1Downside 2Downside 3
GDP scenarios (%)

DisclaimerSantander UK Group Holdings plc (Santander UK) is a subsidiary of Banco Santander SA (Santander).
This presentation provides a summary of the unaudited business and financial trends for the year ended 31 December 2020 for Santander UK Group Holdings plc and its subsidiaries (Santander UK), including its principal subsidiary, Santander UK plc. Unless otherwise stated, references to results in previous periods and other general statements regarding past performance refer to the business results for the same period in 2019.
Alternative Performance Measures (APMs)In addition to the financial information prepared under IFRS, this presentation includes financial measures that constitute APMs, as defined in European Securities and Markets Authority (ESMA) guidelines. These measures are definedand reconciliations to the nearest IFRS measures are available in the appendix to the Santander UK Group Holdings plc Quarterly Management Statement for the year ended 31 December 2020.
This presentation was prepared for information and update purposes only and it does not constitute a prospectus or offering memorandum. In particular, this presentation shall not constitute or imply any offer or commitment to sell ora solicitation of an offer, invitation, recommendation or commitment to buy or subscribe for any security or to enter into any transaction, nor does this presentation constitute any advice or a recommendation to buy, sell or otherwisedeal in any securities of Santander UK, Santander UK plc or Santander or any other securities and should not be relied on for the purposes of any investment decision. This presentation has not been filed, reviewed or approved by anyregulator, governmental regulatory body or securities exchange in any jurisdiction or territory.
Santander UK and Santander caution that this presentation may contain forward-looking statements. Words such as ‘believes’, ‘anticipates’, ‘expects’, ‘intends’, ‘aims’, ‘plans’, ‘targets’ and similar expressions are intended to identifyforward-looking statements, but are not the exclusive means of identifying such statements. By their very nature, forward-looking statements are not statements of historical or current facts; they cannot be objectively verified, arespeculative and involve inherent risks and uncertainties, both general and specific, and risks exist that the predictions, forecasts, projections and other forward-looking statements will not be achieved. Forward-looking statementsspeak only as of the date on which they are made and are based on the knowledge, information available and views taken on the date on which they are made; such knowledge, information and views may change at any time.Santander UK and Santander also caution recipients of this presentation that a number of important factors could cause actual results to differ materially from the plans, objectives, expectations, estimates and intentions expressed insuch forward-looking statements. Some of these factors are identified on page 243 of the Santander UK plc Annual Report 2018. Investors and recipients of this presentation should carefully consider such risk factors and otheruncertainties and events. Undue reliance should not be placed on forward-looking statements when making decisions with respect to Santander UK, Santander UK plc and/or their securities. Nothing in this presentation should beconstrued as a profit forecast.
Statements as to historical performance, historical share price or financial accretion are not intended to indicate or mean that future performance, future share price or future earnings (including earnings per share) for any period willnecessarily match or exceed those of any prior year or period. This presentation reflects prevailing conditions at the indicated date, all of which are subject to change or amendment without notice. The future delivery of any amendedinformation neither implies that the information (whether amended or not) contained in this presentation is correct as of any time subsequent to its date nor that Santander UK or Santander are under an obligation to provide suchamended information.
No representation or warranty of any kind is made with respect to the accuracy, reliability or completeness of any information, opinion or forward-looking statement, any assumptions underlying them, the description of futureoperations or the amount of any future income or loss contained in this presentation or in any other written or oral information made or to be made available to any interested party or its advisers by Santander UK or Santander’sadvisers, officers, employees or agents. It does not purport to be comprehensive and has not been independently verified. Any prospective investor should conduct their own due diligence on the accuracy of the information contained inthis presentation.
Santander UK is a frequent issuer in the debt capital markets and regularly meets with investors via formal roadshows and other ad hoc meetings. In line with Santander UK’s usual practice, over the coming quarter it expects to meetwith investors globally to discuss the updates and results contained in this presentation as well as other matters relating to Santander UK.
To the fullest extent permitted by law, neither Santander UK nor Santander, nor any of their respective affiliates, officers, agents, employees or advisors, accept any liability whatsoever for any loss arising from any use of, or relianceon, this presentation.
By attending / reading the presentation you agree to be bound by these provisions.
Source: Santander UK Q4 2020 results ‘Quarterly Management Statement for the year ended 31 December 2020’ or Santander UK Group Holdings Management Information (MI), unless otherwise stated. Santander has a standardlisting of its ordinary shares on the London Stock Exchange and Santander UK plc continues to have its preference shares listed on the London Stock Exchange. Further information in relation to Santander UK can be found at:www.santander.co.uk/uk/about-santander-uk. Neither the content of Santander UK’s website nor any website accessible by hyperlinks on Santander UK’s website is incorporated in, or forms part of, this presentation.
28

29
Bojana FlintDirector of Investor Relations
+44 (0)7720 733 819
Key dates
Q1’21 results: 28 April 2021
Q2’21 results: 28 July 2021
Q3’21 results: 27 October 2021
www.aboutsantander.co.uk
Contact details
Paul SharrattHead of Debt Investor Relations
+44 (0)7715 087 829
Chris HeathHead of Funding
+44 (0) 7715 802 609