santander uk plc 2010 half yearly financial report · glossary of financial services industry terms...
TRANSCRIPT

Santander UK plc
2010 Half Yearly Financial Report

Santander UK plc
Interim Management Report for the six months ended 30 June 2010
1
Contents
Business and Financial Review – Interim Management Report Chief Executive’s Review 2
Business Review - Summary 4 Key Performance Indicators 8
Business Review 10 Other Material Items 18
Balance Sheet Business Review 19 Risk Management 32
Principal Risks and Uncertainties 66 Related Party Transactions 66
Forward-looking Statements 67 General Information 67
Financial Statements
Independent Review Report to Santander UK plc 68 Primary Financial Statements 69
Notes to the Condensed Financial Statements 72
Shareholder Information Glossary of Financial Services Industry Terms 97
Directors’ Responsibility Statement 102

Business and Financial Review – Interim Management Report
Chief Executive’s Review
2
Overview Santander UK has delivered a strong performance in a difficult economic environment. Our statutory profit after tax increased by 35% compared to the same period last year, with our trading income up 6% to £2,487m and trading expenses broadly flat. This resulted in trading profit before tax growing by 16% to £1,125m, with our cost-to-income ratio now 39%, considerably below our internal estimate of the Personal Financial Services (‘PFS’) sector average of approximately 54%.
This cost advantage provides us with a significant competitive advantage which we have utilised in delivering better value-for-money products, such as the Santander Zero Current Account, relatively high-paying savings accounts and competitive mortgage deals. These products have seen Santander UK score more best-buy mentions than any of our UK competitors in the first half of the year.
We continued to broaden our loyalty strategy in the second quarter with better overdraft rates for primary current account customers and the launch of a Loyalty Tracker Bond. By offering better value products to our approximately 25 million customers, we aim to deepen our relationship with them and increase the number of products per customer that we sell.
We have also continued to build on our growing SME franchise, with lending to this market up over 20% in the last year. We recently announced that we had reached an agreement to acquire (subject to certain conditions) 318 Royal Bank of Scotland and NatWest branches, 40 SME banking centres, more than 400 relationship managers, four corporate banking centres, three private banking centres, and approximately 5,000 employees. On completion, this will increase our SME business from its current approximately 3% market share to over approximately 8% (on an asset basis of SME businesses with turnover up to £25m per annum) and we believe it will enable us to strengthen our challenger status in this market. Business Performance The combination of our retail and corporate banking businesses is a powerful one: with a distribution capability across more than 1,300 branches and 25 Corporate Business Centres combined with a broadening commercial product range. This powerful sales platform has delivered significant new business, including new bank account openings of 519,000 in the first six months of 2010, and keeping us on track to open over one million new bank accounts for the second year running by the end of 2010. In the six months ended 30 June 2010, we had opened 239,000 new credit card accounts, generated investment sales of £1.8bn, and increased lending to SME businesses by over 20%.
We continue to support UK homeowners with mortgage gross lending of £12.3bn and an estimated gross lending market share of 19%, well ahead of our 14% stock share. Our continued focus on the quality of new lending based on affordability and robust risk management continues to serve us well, with a LTV of 51% on mortgage stock and 62% on new business.
We have continued to maintain a balance between new business margin, prudent lending criteria and our market share aspirations. Provisions for the first six months of 2010 were lower than the same period last year and arrears on our mortgage book remained well below the sector average.
In Corporate and Business Banking, we continued to develop and grow our business, and benefited from business customers’ increasing desire to have a multi- rather than single-bank relationship.
We have been successful in attracting retail, private banking and corporate deposits of £4.6bn in the first six months of 2010, demonstrating the strength of the Santander brand and the success of our innovative product offering.
Our Private Banking and Global Banking & Markets operations have also contributed well in difficult market conditions and delivered a solid first-half performance. Integration and Rebrand The rebranding of Abbey and Bradford & Bingley’s savings business was completed in January 2010. This has delivered a significant advantage for customers, as they are now able to transact in 1,000 Santander UK branches.
The integration of Alliance & Leicester is on track and we expect to transfer Alliance & Leicester onto Partenon, Santander’s proprietary IT platform, and to complete the rebranding of the branch network by the end of 2010, which will further increase the number of Santander UK branches to over 1,300. We are on plan to deliver the targeted £180m of cost savings by the end of 2011, as stated at the time of the Alliance & Leicester acquisition in 2008. Rewarding customer loyalty Our strategy of rewarding customers who do more business with us has set us apart from our peers. Since January, we have: > launched the Santander Zero Current Account. The Zero Current Account has one of the lowest fees in the market,
with no overdraft fees and fee-free overseas ATM and point-of-sale transactions; > removed charges for using all 4,300 Santander ATMs in Spain for all customers who have their primary current
account with Santander UK; > waived the 3% balance transfer fee on the Zero Credit Card for all existing customers with a mortgage or a current
account with Santander UK; > kept the Flexi-ISA open for Santander UK Current Account customers; and > increased the LTV to 90% on mortgages exclusively available to customers who hold their primary current account
with Santander UK, while maintaining prudent lending policies. We have introduced the next stage of this strategy with the launch of the Loyalty Tracker Bond, which is available to our mortgage, investment and primary current account customers.

Business and Financial Review – Interim Management Report
Chief Executive’s Review continued
3
Investing for growth Customer service remains a top priority, and we intend to build on the improvements made to date. We expect to create over 600 jobs in our UK branches and call centres over the next 12 months, following continued growth above our market share of stock. These additional roles will support our ongoing business and future growth, whilst enabling us to continue improving our service to customers. A key part of this initiative will be to ensure customers get quick and efficient service during the busiest times. “Best Bank in the UK” - Euromoney awards For the third year running, we have been voted the “Best Bank in the UK” by Euromoney. This is a significant achievement and reflects the progress we have made in the last five years in transforming our business, but equally it is testament to the outstanding contribution all of our staff have made towards delivering our vision to be the best commercial bank in the UK. Funding and Liquidity The prudent management of our balance sheet is a key strategic imperative. While continuing to lend to our retail and SME customers, we have managed to improve our funding position and, in particular, to reduce the amount of short-term financing that we utilise. This has been possible due to our continued success in attracting commercial deposits and by the further reduction in our non-core asset portfolio.
Year on year, commercial deposits have grown by 11%, more than twice the level of commercial assets at 5%. The loan-to-deposit ratio, including equity, reduced from 126% at 31 December 2009 to 124% at 30 June 2010, despite continued commercial lending growth. In addition, since 31 December 2009, a further £3.8bn of the Alliance & Leicester treasury asset portfolio has been sold.
Market conditions remain difficult in terms of access to credit and liquidity. Despite this, during the first half of 2010 we have been able to leverage our strong financial position and brand to raise over £10bn of medium-term wholesale funding including, in March 2010, £1.4bn from a mortgage-backed securitisation and, in June 2010, £6.5bn from additional mortgage-backed issuances. A further £3.2bn of funding has been raised from medium-term issuances since 30 June 2010. We will continue to access wholesale markets as opportunities arise. In addition, as at 30 June 2010, we held £31bn of core liquid assets (largely cash and government securities). Key Financial Highlights Santander UK has delivered statutory profit after tax of £868m, an increase of 35% compared to the same period in 2009. Trading profit before tax (management’s preferred profit measure, described in the Business Review Summary on page 4 increased by 16% to £1,125m compared to the first half of the previous year. > Trading income was up 6%, largely driven by balanced growth in customer lending and deposits across a mix of
products combined with effective margin management. > Trading expenses decreased reflecting savings from the integration of Alliance & Leicester, offset by investment in
growth initiatives and the rebranding as Santander. > The combination of tightly controlled costs and strong revenue growth resulted in a further improvement in the trading
cost-to-income ratio to 39%. > Trading provisions were lower than the equivalent period in 2009 reflecting, in part, the better than expected
unemployment trends, the persistent low interest rate environment and improvements in house prices, but also collection efforts and the overall asset quality. We have preserved conservative levels of coverage, and our mortgage arrears and properties-in-possession levels have remained significantly better than industry benchmarks from the Council of Mortgage Lenders.
Statutory profit after tax for the six months ended 30 June 2010 also benefited from the non-recurrence of adverse mark-to-market movements experienced in the first half of 2009. The economy and UK regulation The UK economy has recovered and made modest progress but demand for credit is subdued and we expect the market will remain challenging. House purchase volumes are higher than a year ago, but remain low relative to the past decade, and house price inflation remains stable. We therefore expect interest rates to remain low for the rest of this year.
The UK Government's recent announcements on regulatory reform imply considerable change ahead for the banking industry. We believe Santander UK is well-placed to respond to this change.
We look forward to contributing to the consultation on changes to the UK tripartite system of regulation, as well as the work of the UK Independent Banking Commission on bank structure and competition. Summary The first six months of 2010 have been strong for Santander UK, by virtue in large part of the support, dedication and commitment of all our staff. I thank them personally for their efforts, and look forward to the remainder of 2010 with a sense of prudent optimism and belief that our UK business remains well-positioned for the challenges and opportunities ahead.
António Horta-Osório Chief Executive

Business and Financial Review – Interim Management Report
Business Review – Summary
4
Santander UK plc (the ‘Company’ and its subsidiaries, together the ‘Group’ or ‘Santander UK’) sets out below its Interim Management Report for the six months ended 30 June 2010.
Summarised consolidated statutory income statement Six months ended
30 June 2010 £m
Six months ended 30 June 2009
£m Net interest income 1,905 1,687 Non-interest income 705 605 Total operating income 2,610 2,292 Administrative expenses (880) (914) Depreciation and amortisation (143) (128) Total operating expenses excluding provisions and charges (1,023) (1,042) Impairment losses on loans and advances (387) (405) Provisions for other liabilities and charges (39) - Total operating provisions and charges (426) (405) Profit before tax 1,161 845 Taxation charge (293) (202) Profit for the period 868 643
30 June 2010 31 December 2009
Core Tier 1 capital ratio (%)(1) 8.0% 6.8% Tier 1 capital ratio (%) 11.1% 9.5% Risk weighted assets (£m) 67,913 67,438
(1) Excludes accrual for dividend for the six months ended 30 June 2010. Including this, core Tier 1 capital ratio was 7.4%. Profit before tax of £1,161m increased from £845m in the first half of 2009. Material movements by line include: Net interest income Six months ended
30 June 2010 £m
Six months ended 30 June 2009
£m Retail Banking 1,733 1,416 Corporate Banking 173 134 Private Banking 67 58 Group Infrastructure (68) 79 1,905 1,687 Six months ended 30 June 2010 compared to six months ended 30 June 2009 Net interest income of £1,905m increased by £218m from £1,687m in the first half of 2009. By segment, the movements were: > Retail Banking net interest income of £1,733m increased by £317m (22%) from £1,416m in the first half of 2009. This
increase was largely driven by balanced growth in customer lending and deposits (£7.7bn, 5% growth in Retail assets and £6.7bn, 6% growth in Retail liabilities) across a mix of products combined with effective margin management. Key drivers of this increase were income from existing mortgage balances as more customers reverted to standard variable rate mortgages in the current low interest rate environment, and improved margins on new and retained business in both the mortgage and unsecured loan portfolios, more than offsetting the higher cost of retail deposits. In terms of mortgage lending, the Group achieved a 19% share of the gross mortgage lending market in the UK in the first half of 2010 (higher than the 2009 share of 17%), with lending written at margins above stock margin and with a continued emphasis on targeting lower loan-to-value segments. In addition, net interest income growth benefited from an 11% growth in bank account liability balances and existing hedging strategies which helped to reduce the impact of lower interest rates on the deposit book.
> Corporate Banking net interest income of £173m increased by £39m from £134m in the first half of 2009. The increase was primarily driven by exceptional growth in deposit balances (42% increase year on year) and increased lending to the UK SME market through our network of 25 Corporate Business Centres (growth in lending balances of over 20%) as well as the benefit of changes to transfer pricing arrangements (applied since 2009 as described below).
> Private Banking net interest income of £67m increased by £9m from £58m in the first half of 2009. The increase was primarily due to increased customer deposits year on year through both Cater Allen and Abbey International at improved margins and the benefit of changes to transfer pricing arrangements (applied since 2009 as described below) which more than offset competitive market pressures on pricing.
> Group Infrastructure net interest (expense)/income of (£68m) decreased by £147m from £79m in the first half of 2009. The decrease of £147m reflected an increase in funding costs during the year, including a higher cost of liquid assets held (which increased to £31bn), higher medium-term funding costs and the non-recurrence of certain one-off benefits, including the returns on Bradford & Bingley funds acquired late in 2008. In addition, less income was earned on the Alliance & Leicester treasury asset portfolio due to the continued de-leveraging process, with approximately 50% of the portfolio sold in the 12 months since 30 June 2009. A new transfer pricing mechanism was implemented in 2009 to calculate the profitability of customer assets and deposits in each business segment, which has also contributed to the adverse trend in Group Infrastructure. The changes apply a higher funding cost/return to new customer assets/deposits respectively, taking into consideration both customer type and term, and the current market environment and rates. The impact is broadly neutral for Retail Banking, positive for Corporate Banking given its growth in deposits, and positive for Private Banking given it only has a deposit base.

Business and Financial Review – Interim Management Report
Business Review – Summary continued
5
Non-interest income Six months ended
30 June 2010 £m
Six months ended 30 June 2009
£m Retail Banking 315 332 Corporate Banking 108 124 Global Banking & Markets 221 262 Private Banking 6 6 Group Infrastructure 55 (119) 705 605 Six months ended 30 June 2010 compared to six months ended 30 June 2009 Non-interest income of £705m increased by £100m from £605m in the first half of 2009. By segment, the movements were: > Retail Banking non-interest income of £315m decreased by £17m from £332m in the first half of 2009. The decrease of
£17m was largely due to lower investment fees as a result of lower new business commissions combined with the mix of sales shifting away from structured products towards managed funds (which will yield a trail income in future periods rather than upfront commission). In addition, unsecured lending related fees reduced, driven by lower volumes (down 19%), while mortgage fees were adversely affected by lower redemption volumes impacting the sector.
> Corporate Banking non-interest income of £108m decreased by £16m from £124m in the first half of 2009. The underlying treasury income in relation to derivatives sold to corporate customers was higher. However, this was offset by a smaller proportion of the income being recognised in this segment.
> Global Banking & Markets non-interest income of £221m decreased by £41m from £262m in the first half of 2009, reflecting a weaker performance in the short-term markets business, which suffered due to a less favourable trading environment as a result of spread volatility on government bonds and more difficult liquidity conditions compared to the first half of 2009 when spreads were significantly wider.
> Private Banking non-interest income of £6m was in line with the first half of 2009. > Group Infrastructure non-interest income of £55m increased by £174m from non-interest income expense of £119m in
the first half of 2009. The increase of £174m in the period reflected mark-to-market losses in 2009 not repeated in 2010. Substantial mark-to-market gains arose in the second half of 2008 from movements in interest rates, which were more than offset by losses due to widening asset spreads on assets designated at fair value through profit or loss. In 2009, the mark-to-market gains reversed but the credit spreads did not change significantly, resulting in the recognition of losses. In addition, 2010 included one-off gains such as the profit on disposal of certain businesses in the period. These positive trends were partially offset by the non-recurrence of certain one-off benefits, including profit earned on the buy-back of securitisation debt in 2009 and higher losses on disposal in the Alliance & Leicester treasury asset portfolio which is being sold-down.
Administrative expenses Six months ended
30 June 2010 £m
Six months ended 30 June 2009
£m Retail Banking 617 680 Corporate Banking 79 85 Global Banking & Markets 60 43 Private Banking 21 19 Group Infrastructure 103 87 880 914 Six months ended 30 June 2010 compared to six months ended 30 June 2009 Administrative expenses of £880m decreased by £34m from £914m in the first half of 2009. By segment, the movements were: > Retail Banking administrative expenses of £617m decreased by £63m from £680m in the first half of 2009. The decrease
was largely due to the removal of duplication across back office and support functions due to the integration of Alliance & Leicester and the Bradford & Bingley savings business. As well as headcount reductions, savings have been achieved through review and renegotiation of procurement contracts, benefiting from the scale of the Banco Santander, S.A. group, and tight management control of costs.
> Corporate Banking administrative expenses of £79m decreased by £6m from £85m in the first half of 2009. The decrease was due to operational efficiencies arising from the integration of Alliance & Leicester, partially offset by investment in the Corporate Business Centre network. The investment includes an additional 127 roles on a full-time equivalent (“FTE”) basis over the last twelve months and an increase of 70% in the floor space of the Corporate Business Centre network.
> Global Banking & Markets administrative expenses of £60m increased by £17m from £43m in the first half of 2009, reflecting ongoing investment in growth initiatives relating to new products, markets and customer segments. There was a 36% increase in headcount, across the customer transaction businesses, and the new Gilt Edge Market Making desk.
> Private Banking administrative expenses of £21m increased by £2m from £19m in the first half of 2009 largely due to a move in premises during the period.
> Group Infrastructure administrative expenses of £103m increased by £16m from £87m in the first half of 2009. The increase largely reflected one-off expenditure relating to the rebranding of Abbey and the Bradford & Bingley savings business as Santander in January 2010. In addition, higher expenses resulted from the process of transferring the business of Alliance & Leicester plc to Santander UK plc under Part VII of the Financial Services and Markets Act 2000 in May 2010. These expenses were offset in part by savings from the sale of the James Hay business in March 2010.

Business and Financial Review – Interim Management Report
Business Review – Summary continued
6
Depreciation and amortisation Six months ended
30 June 2010 £m
Six months ended 30 June 2009
£m Retail Banking 96 81 Corporate Banking 39 43 Global Banking & Markets 2 2 Private Banking - 1 Group Infrastructure 6 1 143 128 Six months ended 30 June 2010 compared to six months ended 30 June 2009 Depreciation and amortisation of £143m increased by £15m from £128m in the first half of 2009. By segment, the movements were: > Retail Banking depreciation and amortisation of £96m increased by £15m from £81m in the first half of 2009. The
increase of £15m resulted from the continued investment in IT systems and the integration of Alliance & Leicester and the Bradford & Bingley savings business.
> Corporate Banking depreciation and amortisation of £39m decreased by £4m from £43m in the first half of 2009. The decrease reflected lower operating lease depreciation due to lower balances in the Alliance & Leicester book following the continued deleveraging process.
> Private Banking depreciation and amortisation of £nil were broadly in line with £1m in the first half of 2009. > Group Infrastructure depreciation and amortisation of £6m increased by £5m from £1m in the first half of 2009. The
increase reflected investment in the rebranding of Abbey and the Bradford & Bingley savings business as Santander. Impairment losses on loans and advances Six months ended
30 June 2010 £m
Six months ended 30 June 2009
£m Retail Banking 356 365 Corporate Banking 31 19 Private Banking - 1 Group Infrastructure - 20 387 405 Six months ended 30 June 2010 compared to six months ended 30 June 2009 Impairment losses on loans and advances of £387m decreased by £18m from £405m in the first half of 2009. By segment, the movements were: > Retail Banking impairment losses on loans and advances of £356m decreased by £9m from £365m in the first half of
2009, with the largest decrease relating to mortgages. This improving performance in difficult economic conditions has been delivered as a result of three factors: a high quality mortgage book, effective collection handling and the slight upturn in house prices in a low interest rate environment. Similarly, performance across the unsecured portfolios has also improved in the year to date.
> Corporate Banking impairment losses on loans and advances of £31m increased by £12m from £19m in the first half of 2009. The increase of £12m reflected growth in asset balances and some deterioration arising from market conditions. The run-down Alliance & Leicester Corporate portfolios continue to perform in line with our original expectations with provisions raised in 2008 still expected to cover losses inherent in the portfolios.
> Private Banking impairment losses on loans and advances of £nil were broadly in line with £1m in the first half of 2009. > Group Infrastructure impairment losses on loans and advances decreased by £20m to £nil (2009: £20m) in respect of the
Alliance & Leicester treasury asset portfolio in 2009. These losses were offset by the income on the portfolio, which is classified in net interest income. In the first half of 2010, there have been no further provisions for the Alliance & Leicester treasury asset portfolio.
Business and Financial Review – Interim Management Report
Business Review – Summary continued
7
Personal Financial Service non-performing loans 30 June 2010
£m 31 December 2009
£m
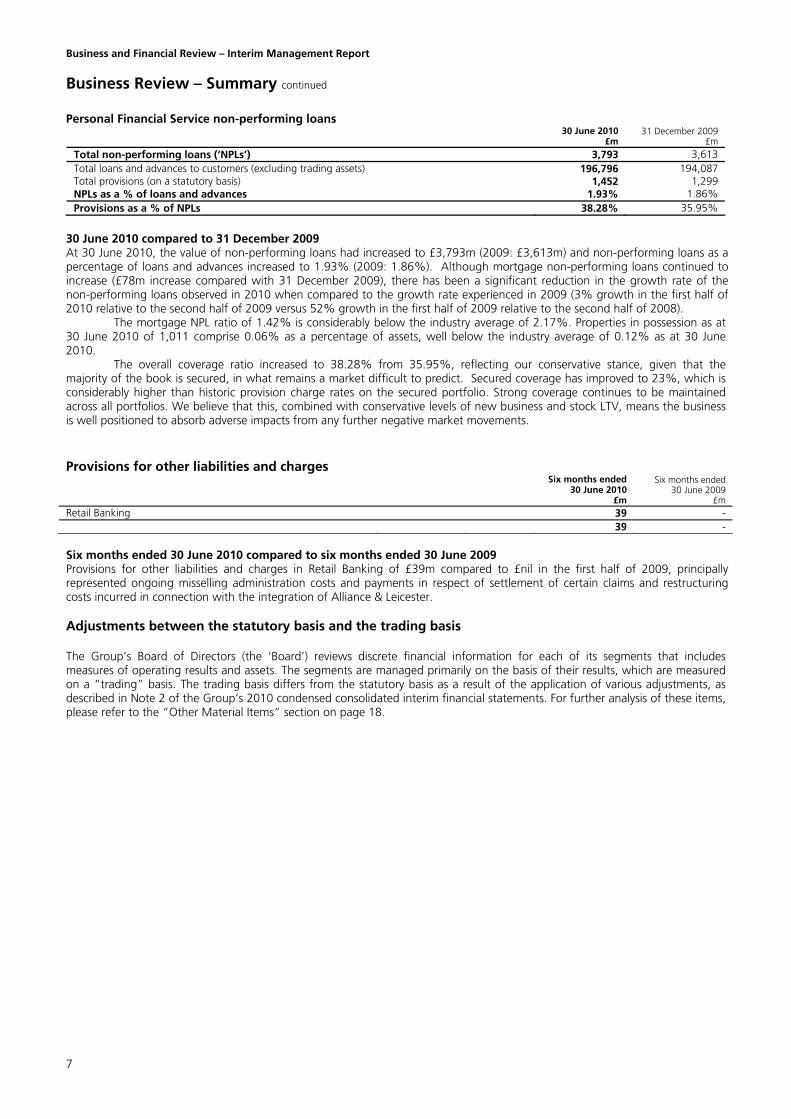
Total non-performing loans (‘NPLs’) 3,793 3,613 Total loans and advances to customers (excluding trading assets) 196,796 194,087 Total provisions (on a statutory basis) 1,452 1,299 NPLs as a % of loans and advances 1.93% 1.86% Provisions as a % of NPLs 38.28% 35.95%
30 June 2010 compared to 31 December 2009 At 30 June 2010, the value of non-performing loans had increased to £3,793m (2009: £3,613m) and non-performing loans as a percentage of loans and advances increased to 1.93% (2009: 1.86%). Although mortgage non-performing loans continued to increase (£78m increase compared with 31 December 2009), there has been a significant reduction in the growth rate of the non-performing loans observed in 2010 when compared to the growth rate experienced in 2009 (3% growth in the first half of 2010 relative to the second half of 2009 versus 52% growth in the first half of 2009 relative to the second half of 2008).
The mortgage NPL ratio of 1.42% is considerably below the industry average of 2.17%. Properties in possession as at 30 June 2010 of 1,011 comprise 0.06% as a percentage of assets, well below the industry average of 0.12% as at 30 June 2010.
The overall coverage ratio increased to 38.28% from 35.95%, reflecting our conservative stance, given that the majority of the book is secured, in what remains a market difficult to predict. Secured coverage has improved to 23%, which is considerably higher than historic provision charge rates on the secured portfolio. Strong coverage continues to be maintained across all portfolios. We believe that this, combined with conservative levels of new business and stock LTV, means the business is well positioned to absorb adverse impacts from any further negative market movements. Provisions for other liabilities and charges Six months ended
30 June 2010 £m
Six months ended 30 June 2009
£m Retail Banking 39 - 39 - Six months ended 30 June 2010 compared to six months ended 30 June 2009 Provisions for other liabilities and charges in Retail Banking of £39m compared to £nil in the first half of 2009, principally represented ongoing misselling administration costs and payments in respect of settlement of certain claims and restructuring costs incurred in connection with the integration of Alliance & Leicester. Adjustments between the statutory basis and the trading basis The Group’s Board of Directors (the ‘Board’) reviews discrete financial information for each of its segments that includes measures of operating results and assets. The segments are managed primarily on the basis of their results, which are measured on a “trading” basis. The trading basis differs from the statutory basis as a result of the application of various adjustments, as described in Note 2 of the Group’s 2010 condensed consolidated interim financial statements. For further analysis of these items, please refer to the “Other Material Items” section on page 18.

Business and Financial Review – Interim Management Report
Key Performance Indicators
8
Key performance indicators relevant to the Group during the six months ended 30 June 2010 and 30 June 2009, and as at 30 June 2010 and 31 December 2009, are set out below. This information describes the key measures used by management in assessing the success of the business against its strategies and objectives.
Key performance indicator Note 2010 2009 Trading revenues 1 £2,487m £2,351m Trading cost-to-income ratio 2 39% 42% Profit for the period 3 £868m £643m Commercial Banking margin 4 1.92% 1.75% Total number of employees 5 18,581 19,483 Market share of mortgage stock 6 13.8% 13.5% Loan-to-deposit ratio 7 124% 126% Loan-to-value ratio on mortgage stock (indexed) 8 51% 52% Risk weighted assets 9 67,913 67,438
1. Trading revenues
Trading revenues comprise net interest income and non-interest income. Discussion and analysis of this data is set out in the Business Review on pages 10 to 17.
Management reviews trading revenues in order to assess the Group’s effectiveness in obtaining new customers and business. Management’s target for trading revenues has been growth of between 5% and 10% per annum. The increase of 5.7% for the six months ended 30 June 2010 was towards the lower end of this range, reflecting the low interest rate environment, cost of medium-term funding and cost of higher liquidity holdings, which are expected to continue to impact future periods.
2. Trading cost-to-income ratio
The trading cost-to-income ratio is defined as trading expenses divided by trading income. Discussion and analysis of trading income and expenses is set out in the Business Review on pages 10 to 17.
Management reviews the trading cost-to-income ratio in order to measure the operating efficiency of the Group. Management’s target for the trading cost-to-income ratio was to achieve sustained further improvements from the level of 45% which was first achieved in 2008 prior to the impact of the transfer of Alliance & Leicester plc. In the first half of 2010, this target was met and the cost-to-income ratio reduced to 39%.
3. Profit for the period Profit for the period is the statutory consolidated profit after tax for the period. Discussion and analysis of this data is set out in this Business Review – Summary section on pages 4 to 7.
Management reviews the profit for the period in order to monitor the effectiveness of the Group’s strategy and to increase the strength of its capital base and its capacity to pay dividends to its shareholder Banco Santander, S.A.. Management’s target for the profit for the period was to achieve sustained growth over the previous period, and this has been achieved in the first half of 2010.
In order to ensure that targets related to the above three key performance indicators were met, management also evaluated other measures which are set out below as critical drivers towards achieving the three key performance indicators above on a sustainable basis. 4. Commercial Banking margin
Commercial Banking margin is defined as trading net interest income (adjusted to remove net interest income from the run-down Alliance & Leicester treasury asset portfolio) over average commercial assets (mortgages, unsecured personal loans, corporate loans and overdrafts). Discussion and analysis of this data is set out in the Business Review on pages 10 to 17.
Management reviews the Commercial Banking margin in order to assess the economic sustainability of its commercial banking products and operations. Management’s target for the Commercial Banking margin is to ensure that it is appropriate for the current market conditions and profit targets. This target was met in the period ended 30 June 2010 by virtue of balanced growth in customer assets and liabilities, the improvements in the margin and reported profit growth.

Business and Financial Review – Interim Management Report
Key Performance Indicators continued
9
5. Total number of employees Total number of employees is measured at the period-end and calculated on an FTE basis. The total number of employees at 30 June 2010 on an FTE basis was 18,581 (31 December 2009: 19,483). As part of the planning process, headcount targets are set for each division and reviewed on a monthly basis.
Management reviews the total number of employees in order to support the continuing overall control of the Group’s cost base and the trading cost-to-income ratio. Management’s targets for the total number of employees are to ensure that staffing levels are optimal for the nature and size of the Group’s business. In 2010, headcount was reduced by 902 full-time equivalents. Of this reduction, 458 arose from the sale of James Hay. The remainder reflected the continued integration of the Bradford & Bingley savings business and Alliance & Leicester. This has been partially offset by investment in areas of the business identified for growth, particularly Corporate Banking and Global Banking & Markets.
6. Market share of mortgage stock Market share of mortgage stock represents the book value of the Group’s mortgage asset as a percentage of the total book value of mortgages in the UK market, and is measured at the period-end. Market share of mortgage stock is calculated by reference to data on the size of the UK mortgage market produced by the Bank of England. Discussion and analysis of this data is set out in the Business Review on page 11.
Management reviews market share of mortgage stock as one of the measures to assess the Group’s effectiveness in obtaining new customers. Management’s target for market share of mortgage stock is to maintain or grow modestly the Group’s historical market share of mortgage stock, subject to earning an appropriate margin. In 2010, market share increased by 0.3% to 13.5% at 30 June 2010, driven by profitable new business and successful retention strategies.
7. Loan-to-deposit ratio Management places a significant emphasis on the loan-to-deposit ratio as part of its focus on maintaining a sustainable funding model. The loan-to-deposit ratio represents the book value of the Group’s commercial assets (i.e. retail, corporate and private banking assets) divided by its commercial liabilities (i.e. retail, corporate and private banking deposits) and shareholders’ equity, and is measured at the period-end.
Management reviews the loan-to-deposit ratio in order to assess the Group’s ability to fund its commercial operations with commercial borrowings, reducing reliance on sourcing funding from the wholesale markets while improving its customer product holdings. Management’s target for the loan-to-deposit ratio is sustained improvements in future years. During 2010, Santander UK has continued to achieve strong commercial net lending growth of 5% which has been more than matched by a larger (11%) increase in net deposit flows, resulting in a further improvement in our loan-to-deposit ratio to 124% (31 December 2009: 126%).
8. Loan-to-value (‘LTV’) ratio on mortgage stock (indexed) As a result of the difficult economic environment, management places a significant emphasis on the LTV ratio on mortgage stock in order to ensure that the profit target be achieved. The LTV ratio is calculated as the book value of the Group’s residential mortgages as a percentage of the estimated current market value of the properties against which the mortgages are secured. The current market value is estimated from house price indices by adjusting the value of the property at the time of the origination of the mortgage for changes in house prices from that date to the balance sheet date. The LTV ratio is a measure of the estimated current level of security that the Group possesses on its mortgage loans. Discussion and analysis of this data is set out in the Risk Management Report on pages 41 and 42.
Management reviews the LTV ratio in order to assess the Group’s potential resilience to future declines in property prices. Management's target for the LTV ratio is, subject to market conditions, to sustain a LTV ratio of less than 60%. During 2010, the Group has continued to focus on the quality of new mortgage lending based on affordability and lower LTV segments of the market. The average LTV on stock value at 30 June 2010 was slightly lower than the previous year at 51% (31 December 2009: 52%) principally due to the effects of house price increases in the first half of the year.
9. Risk weighted assets Risk weighted assets are a measure of a bank’s assets adjusted for their associated risks. Risk weightings are established in accordance with the Basel Capital Accord as implemented by the UK Financial Services Authority.
Management reviews risk weighted assets in order to determine how the regulatory capital of the Group is being utilised, and to understand risk-adjusted trends of the Group’s assets. Management’s target for risk weighted assets is for modest growth consistent with maintaining a strong Tier 1 ratio.
As at June 2010, risk weighted assets of £67,913m increased by 0.7% since 31 December 2009, driven by the growth in commercial assets of 2%, offset by the impact of continued de-leveraging of the Alliance & Leicester treasury asset portfolio.

Business and Financial Review – Interim Management Report
Business Review
10
Trading profit before tax by segment
30 June 2010
Retail Banking
£m
Corporate Banking
£m
Global Banking & Markets
£m
Private Banking
£m
Group Infrastructure
£m Total
£m Net interest income/(expense) 1,838 193 - 63 (246) 1,848 Non-interest income 330 74 221 6 8 639 Total trading income 2,168 267 221 69 (238) 2,487 Total trading expenses (699) (84) (62) (21) (109) (975) Impairment losses on loans and advances (356) (31) - - - (387) Trading profit/(loss) before tax 1,113 152 159 48 (347) 1,125 Adjust for: - Reorganisation and other costs (53) - - - - (53) - Hedging and other variances (15) - - - 69 54 - Profit on part sale of subsidiaries - - - - 35 35 - Capital and other charges (105) (20) - 4 121 - Profit/(loss) before tax 940 132 159 52 (122) 1,161
30 June 2009
Retail Banking
£m
Corporate Banking
£m
Global Banking & Markets
£m
Private Banking
£m
Group Infrastructure
£m Total
£m Net interest income/(expense) 1,491 150 - 54 (73) 1,622 Non-interest income 346 87 262 6 28 729 Total trading income 1,837 237 262 60 (45) 2,351 Total trading expenses (732) (91) (45) (20) (88) (976) Impairment losses on loans and advances (365) (19) - (1) (20) (405) Trading profit/(loss) before tax 740 127 217 39 (153) 970 Adjust for: - Reorganisation and other costs (29) - - - - (29) - Hedging and other variances (6) - - - (90) (96) - Capital and other charges (83) (16) - 4 95 - Profit/(loss) before tax 622 111 217 43 (148) 845
Six months ended 30 June 2010 compared to six months ended 30 June 2009 Trading profit before tax of £1,125m increased by £155m on the first half of the previous year (2009: £970m), driven by strong income growth, flat expenses and reduced impairment losses.
> Retail Banking trading profit before tax increased by £373m to £1,113m (2009: £740m), driven by a strong increase in trading income and a reduction in costs resulting from the integration benefits of Alliance & Leicester. Trading income benefited as more customers reverted to standard variable rate mortgages, and margins on new and retained business improved in both the mortgage and unsecured loan portfolios in the low interest environment. In addition, the Retail Banking business delivered strong growth in customer deposits, together with growth in bank account liability balances, and benefited from existing hedging strategies which helped to reduce the impact of lower interest rates on the deposit book. These positive income trends were partly offset by lower fee income from sales of structured investment products, lower fees on unsecured lending products in line with lower new business volumes and lower personal protection insurance.
> Corporate Banking trading profit before tax increased by £25m to £152m (2009: £127m). This movement was due to a strong income performance and lower operating expenses benefiting from integration synergies, partially offset by slightly higher impairment losses. The increased trading income was largely driven by exceptional growth in deposit balances. In addition, there has been increased lending to the UK SME market through the network of 25 Corporate Business Centres with growth in lending balances of over 20%, as well as the benefit of changes to transfer pricing arrangements (applied since 2009).
> Global Banking & Markets trading profit before tax decreased by £58m to £159m (2009: £217m). Trading income decreased, reflecting the non-recurrence of particularly favourable market conditions in the first half of 2009, as well as a weaker performance in the short-term markets business, which suffered due to a less favourable trading environment as a result of spread volatility on government bonds and more difficult liquidity conditions. In addition, trading costs increased, reflecting ongoing investment initiatives relating to new products, markets and customer segments.
> Private Banking trading profit before tax increased by £9m to £48m (2009: £39m). This movement was due to a strong income performance resulting from increased customer deposits year-on-year, as well as the benefit of changes to transfer pricing arrangements (applied since 2009).
> Group Infrastructure trading loss before tax increased by £194m to £347m (2009: £153m), reflecting an increase in funding costs during the year including a higher cost of liquid assets held (which have increased to £31bn) and medium-term funding, and non-recurrence of certain one-off benefits, including the returns on Bradford & Bingley funds acquired late in 2008. In addition, trading costs increased, largely reflecting one-off expenditure relating to the rebranding of Abbey and the Bradford & Bingley savings business in January 2010.

Business and Financial Review – Interim Management Report
Business Review continued
11
Business volumes Business volumes are set out below. These volumes are used by management to assess the sales performance of the Group, both absolutely and relative to its UK peers, and to inform management of product trends in the market.
2010 2009
Mortgages: Gross mortgage lending £12.3bn £10.8bn Capital repayments £9.0bn £8.8bn Net mortgage lending £3.3bn £2.0bn Mortgage stock £170.2bn £166.9bn Market share – gross mortgage lending(1) 19.3% 16.3% Market share – capital repayments(1) 14.6% 13.6% Market share – mortgage stock(1) 13.8% 13.5% Customer funds and bank accounts: Commercial net deposit flows £4.6bn £4.7bn Investment sales – Annual Premium Income (‘API’) £1.8bn £1.8bn Commercial deposits stock £148.5bn £143.9bn Bank account openings: Adult bank account openings (000’s) 400 408 Bank account openings (000’s) 519 515 Other: Credit card sales (000’s) 239 183 Gross unsecured personal lending £0.7bn £0.9bn
(1) Market shares are estimated internally, based on information from the Bank of England and The Council of Mortgage Lenders (“CML”). Main highlights for the six months to 30 June 2010 (compared to the same period in 2009 unless otherwise stated) include:
> Gross mortgage lending of £12.3bn, with an estimated market share of 19.3%, was ahead of the same period last year and ahead of our market share of mortgage stock, with a continued focus on the quality of new lending based on affordability and lower loan to value (‘LTV’) segments. The average LTV on new business completions in the first half of 2010 was 61% versus 59% in the first half of 2009.
> Capital repayments of £9.0bn were broadly in line with the same period last year. Our estimated market share of capital repayments increased to 14.6%, reflecting the smaller market size in 2010. This performance was achieved against a market backdrop of heightened competition in low LTV segments, demonstrating effective retention strategies in key segments.
> Net mortgage lending of £3.3bn exceeded prior year net lending, as the Group continues to be a consistent lender in difficult times.
> Net deposit inflows of £4.6bn were broadly in line with last year, with a strong performance in Retail and Private Banking offset by a weaker performance from the Corporate Banking business. Retail Banking delivered strong inflows, in increasingly competitive market conditions, and benefited from the alignment of product marketing and pricing strategies across the brands, including the introduction of formerly Abbey-branded products, such as fixed rate bonds and Individual Savings Accounts, a strong ISA season and promotional activity in the former Bradford & Bingley branches. In addition, there was an 11% increase in bank account liabilities. Corporate Banking flows were positive despite a difficult economic environment, with a favourable maturity profile.
> Investment sales - API of £1.8bn were in line with 2009, as we continued to cross sell our investment products to our savings base which has deepened our customer relationships albeit in a difficult market.
> The number of bank account openings was marginally higher than last year, maintaining the trend of previous quarters and on track to achieve over 1 million openings by the year-end. This was a significant achievement given the campaign in the first half of 2009 (5% in-credit balances) was not repeated in the first half of 2010. A further campaign is planned for the second half in 2010. In addition, in the first half of 2010, the loyalty strategy contributed to approximately 150,000 Zero Current Account openings. The proportion of adult bank accounts has remained high which, in part, drove the liability increase. The current account is viewed by Santander UK as a key relationship product in the UK, as it is the driver of cross-selling opportunities and is therefore an area of focus throughout the branch network.
> Credit card sales for which we have focused on lower risk customers were higher than in the first half of 2009, driven by a strong performance in telephone and internet sales, and the success achieved with the Zero Credit Card, of which approximately 160,000 have been opened in the year to date.
> Total gross unsecured personal lending (‘UPL’) decreased to £0.7bn, representing a 19% decrease from 2009, following the same trend as the previous year and reflecting our cautious stance, with the unsecured loan portfolio balance down 21% on 2009. We continue to focus on lending to existing customers with a strong, established credit history.

Business and Financial Review – Interim Management Report
Business Review continued
12
Retail Banking Retail Banking offers a comprehensive range of banking products and related financial services (residential mortgages, savings and banking, and other personal financial services products) to customers throughout the UK. It serves customers through the Santander UK and Alliance & Leicester networks of branches and ATMs, as well as through telephone and internet channels.
Six months ended 30 June 2010
£m
Six months ended 30 June 2009
£m Net interest income 1,838 1,491 Non-interest income 330 346 Total trading income 2,168 1,837 Total trading expenses (699) (732) Impairment losses on loans and advances (356) (365) Trading profit before tax 1,113 740 Adjust for: - Reorganisation and other costs (53) (29) - Hedging and other variances (15) (6) - Capital and other charges (105) (83) Statutory profit before tax 940 622
Segment balances 30 June 2010
£bn 31 December 2009
£bn Customer assets 168.4 165.5 Customer deposits 113.7 110.9
Retail Banking trading profit before tax Six months ended 30 June 2010 compared to six months ended 30 June 2009 Trading profit before tax increased by £373m to £1,113m (2009: £740m). By income statement line, the movements were:
> Trading net interest income increased by £347m to £1,838m (2009: £1,491m), largely driven by balanced growth in customer lending (up 5%) and deposits (up 6%) across a mix of products combined with effective margin management. A key driver was income from existing mortgage balances increasing as more customers reverted to standard variable rate mortgages in the current low interest rate environment and new and retained business margins improved in both the mortgage and unsecured loan portfolios more than offsetting the higher cost of retail deposits. In terms of mortgage lending, the Group achieved a 19% share of the gross mortgage lending market in the UK in the first half of 2010 (higher than the 2009 share of 17%), with lending written at margins above stock margin and with a continued emphasis on targeting lower loan-to-value segments. In addition, net interest income growth benefited from an 11% growth in bank account liability balances and existing hedging strategies which helped to reduce the impact of lower interest rates on the deposit book.
> Trading non-interest income decreased by £16m to £330m (2009: £346m), largely due to lower investment fees reflecting lower new business commissions in the sustained low rate environment combined with the mix of sales shifting away from structured investment products towards managed funds (which will yield a trail income in future periods rather than an upfront commission). In addition, unsecured lending related fees reduced, driven by lower volumes (down 19%), and mortgage fees were adversely affected by lower redemption volumes impacting the sector.
> Trading expenses of £699m decreased by £33m (2009: £732m). The decrease in administrative expenses was largely due to the removal of duplication across back office and support functions due to the integration of Alliance & Leicester and the Bradford & Bingley savings business. Savings have also been achieved through review and renegotiation of contracts benefiting from procurement savings of the Banco Santander, S.A. group, and tight management control of costs. These savings were partially offset by increased depreciation as a result of continued investment in IT systems and in the integration of Alliance & Leicester and the Bradford & Bingley savings business.
> Impairment losses on loans and advances of £356m decreased by £9m from £365m in the first half of 2010, with the largest decrease relating to mortgages. Although mortgage non-performing loans continued to increase (£78m increase compared to 31 December 2009), there has been a significant reduction in the growth rate of the non-performing loans observed in 2010 when compared to the growth rate experienced in 2009 (3% growth in the first half of 2010 relative to the second half of 2009 versus 52% in the first half of 2009 relative to the second half of 2008). This improving performance in difficult market conditions has been delivered as a result of three factors: credit quality of a high quality mortgage book, effective collection handling and the slight upturn in house prices in a low interest rate environment. Similarly, performance across the unsecured portfolios has also improved in the year to date.

Business and Financial Review – Interim Management Report
Business Review continued
13
Retail Banking segment balances
> At 30 June 2010, customer assets of £168.4bn were 5% higher than the same point in 2009 (2% higher than at 31 December 2009) reflecting the growth in mortgage balances. This was driven by continued strong growth in gross mortgage lending, where market share was 19% (compared to stock share of 14%), and success in retention activities. Gross lending remains focused on quality based on affordability and lower LTVs segments. Partly offsetting this growth has been the continued reduction in UPL balances, down 21%, where the focus has been on lending to existing customers with proven repayment track records.
> At 30 June 2010, customer deposits increased 6% to £113.7bn compared to 30 June 2009 (3% higher than at 31 December 2009) benefiting from strong inflows in the six months, in an increasingly competitive market. The ISA season in 2010 was particularly successful, while a focus on bank accounts, and specifically higher value, primary accounts, resulted in an 11% increase in bank account liabilities.

Business and Financial Review – Interim Management Report
Business Review continued
14
Corporate Banking Corporate Banking provides a range of banking services principally to small and mid-sized (‘SME’) UK companies (with turnover between £1m and £25m) through its network of Corporate Business Centres and specialist businesses. A broad range of banking products is offered including loans, bank accounts, deposits, treasury services, asset finance, cash transmission, trade finance and invoice discounting. The specialist businesses within Corporate Banking service customers in various business sectors including Real Estate, Social Housing, and Infrastructure. Corporate Banking is also responsible for managing the run down of certain acquired Alliance & Leicester treasury portfolios. Six months ended
30 June 2010 £m
Six months ended 30 June 2009
£m Net interest income 193 150 Non-interest income 74 87 Total trading income 267 237 Total trading expenses (84) (91) Impairment losses on loans and advances (31) (19) Trading profit before tax 152 127 Adjust for: - Capital and other charges (20) (16) Statutory profit before tax 132 111
Segment balances 30 June 2010
£bn 31 December 2009
£bn Total customer assets 24.5 24.4 Core customer assets(1) 19.6 18.9 - of which SME 7.5 6.7 Customer deposits 19.4 18.8
(1) Excludes Alliance & Leicester non-growth portfolios
Corporate Banking trading profit before tax Six months ended 30 June 2010 compared to six months ended 30 June 2009 Trading profit before tax increased by £25m to £152m (2009: £127m). By income statement line, the movements were:
> Trading net interest income improved by £43m to £193m (2009: £150m). The increase in net interest income in 2010 was primarily driven by exceptional growth in deposit balances (42% increase year on year) and the benefit of transfer pricing arrangements (applied since 2009). In addition, there has been increased lending to the UK SME market through the network of 25 Corporate Business Centres and growth in lending balances of over 20%, with margins improving.
> Trading non-interest income decreased by £13m to £74m (2009: £87m). The underlying treasury income in relation to derivatives sold to corporate customers was higher. However, this was offset by a smaller proportion of the income being recognised in this segment.
> Trading expenses of £84m were £7m lower than the previous year (2009: £91m). The decrease was due to operational efficiencies arising from the integration of Alliance & Leicester, partially offset by investment in the Corporate Business Centre network. The investment includes hiring of an additional staff of 127 on an FTE basis over the last twelve months and an increase of 70% in the floor space of the Corporate Business Centre network.
> Impairment losses on loans and advances of £31m increased by £12m from £19m in the first half of 2009. The increase of £12m reflected growth in asset balances and some deterioration arising from market conditions. The run-down Alliance & Leicester Corporate portfolios continue to perform in line with our original expectations with provisions raised in 2008 still expected to cover losses inherent in the portfolios.
Corporate Banking segment balances
> At 30 June 2010, core customer assets of £19.6bn were 11% higher than the same point in 2009 (4% higher than at 31 December 2009) driven by a strong performance via our 25 Corporate Business Centres and a broader product offering. We have continued to build on our growing SME franchise, with lending to this group totalling £7.5bn up over 20% since 30 June 2009 (up 12% compared to 31 December 2009).
> Customer deposits increased 42% to £19.4bn compared to 30 June 2009 impacted by increased competition in this market. Net flows for the six months ended 30 June 2010 were positive with a favourable maturity profile.

Business and Financial Review – Interim Management Report
Business Review continued
15
Global Banking & Markets Global Banking & Markets is a financial markets business focused on providing value added financial services to large corporates not serviced by Corporate Banking (being, in general, very large multinationals and financial institutions, as well as to the rest of Santander UK’s business (including the Retail Banking and Corporate Banking divisions). Six months ended
30 June 2010 £m
Six months ended 30 June 2009
£m Net interest income - - Non-interest income 221 262 Total trading income 221 262 Total trading expenses (62) (45) Impairment losses on loans and advances - - Trading and statutory profit before tax 159 217
Segment balances 30 June 2010
£bn 31 December 2009
£bn Total assets 43.6 44.0
Global Banking & Markets trading profit before tax Six months ended 30 June 2010 compared to six months ended 30 June 2009 Trading profit before tax decreased by £58m to £159m (2009: £217m). By income statement line, the movements were: > Trading non-interest income of £221m decreased by £41m from £262m in the first half of 2009, reflecting the
non-recurrence of particularly favourable market conditions in the first half of 2009, as well as a weaker performance in the short-term markets business, which suffered due to a less favourable trading environment as a result of spread volatility on government bonds and more difficult liquidity conditions.
> Trading expenses of £62m increased by £17m (2009: £45m), reflecting ongoing investment initiatives relating to new products, markets and customer segments. There has been a 36% increase in headcount, across the customer transaction businesses and the new Gilt Edge Market Making desk.

Business and Financial Review – Interim Management Report
Business Review continued
16
Private Banking Private Banking offers private banking and other specialist banking services in the UK through the Group’s majority interest in Santander Private Banking UK Limited, and offshore banking through Abbey National International Limited, Alliance & Leicester International Limited, and Bradford & Bingley International Limited.
Six months ended 30 June 2010
£m
Six months ended 30 June 2009
£m Net interest income 63 54 Non-interest income 6 6 Total trading income 69 60 Total trading expenses (21) (20) Impairment losses on loans and advances - (1) Trading profit before tax 48 39 Adjust for: - Capital and other charges 4 4 Statutory profit before tax 52 43
Segment balances 30 June 2010
£bn 31 December 2009
£bn Customer deposits 15.4 14.2
Private Banking trading profit before tax Six months ended 30 June 2010 compared to six months ended 30 June 2009 Trading profit before tax increased by £9m to £48m (2009: £39m). By income statement line, the movements were: > Trading net interest income increased by £9m to £63m (2009: £54m). The increase was primarily due to increased
customer deposits year-on-year through both Cater Allen and Abbey International with the benefit of transfer pricing arrangements (applied since 2009) which more than offset competitive market pressures on pricing.
> Trading non-interest income of £6m was in line with the first half of 2009.
> Trading expenses of £21m increased by £1m (2009: £20m), largely due to a move in premises during the period.
> Impairment losses on loans and advances of £nil were broadly in line with the first half of 2009.
Private Banking segment balances > At 30 June 2010, customer deposits increased 15% to £15.4bn compared to 30 June 2009 (8% higher than at 31
December 2009) benefiting from strong inflows in the six months, in an increasingly competitive market. Strong levels of new business were recorded in both Cater Allen and Abbey International, where balances were up 9% and 38% respectively year-on-year.

Business and Financial Review – Interim Management Report
Business Review continued
17
Group infrastructure Group Infrastructure consists of Asset and Liability Management (‘ALM’), which is also responsible for Group Capital and Funding, and the Alliance & Leicester treasury asset portfolio. ALM is responsible for managing the Group’s structural balance sheet composition and, in conjunction with the Risk Division, strategic and tactical liquidity risk management. This includes short-term, medium-term, covered bond and securitisation funding programmes. ALM's responsibilities also include management of Retail Banking’s product and structural exposure to interest rates and, in that role, it is a link between Retail Banking and Global Banking & Markets.
The negative income and expenses reflect the element of funding cost and expenses not recharged to the business.
Six months ended 30 June 2010
£m
Six months ended 30 June 2009
£m Net interest expense (246) (73) Non-interest income 8 28 Total trading income (238) (45) Total trading expenses (109) (88) Impairment losses on loans and advances - (20) Trading loss before tax (347) (153) Adjust for: - Hedging and other variances 69 (90) - Profit on part sale of subsidiaries 35 - - Capital and other charges 121 95 Statutory loss before tax (122) (148)
Group infrastructure trading profit before tax Six months ended 30 June 2010 compared to six months ended 30 June 2009 Trading loss before tax increased by £194m to £347m (2009: £153m). By income statement line, the movements were: > Trading net interest expense increased by £173m to £246m (2009: £73m), reflecting an increase in funding costs
during the year including a higher cost of liquid assets held (which have increased to £31bn) and medium-term funding, and the non-recurrence of certain one-off benefits, including the returns on Bradford & Bingley funds acquired late in 2008. In addition, less income was earned on the Alliance & Leicester treasury asset portfolio due to the deleveraging process, with approximately 50% of the portfolio sold in the 12 months since 30 June 2009. A new transfer pricing mechanism was implemented in 2009 to calculate the profitability of customer assets and deposits in each of the business segments, which has also contributed to the adverse trend in Group Infrastructure. The changes apply a higher funding cost/return to new customer assets/deposits respectively, taking into consideration both customer type and term, and the current market environment and rates. The impact is broadly neutral for Retail Banking, but positive for Corporate Banking given growth in deposits, and positive for Private Banking given it only has a deposit base.
> Trading non-interest income decreased to £8m (2009: £28m), principally due to the non-recurrence of certain one-off benefits, including profit earned on the buy-back of securitisation debt in 2009.
> Trading expenses of £109m were £21m higher than the previous year (2009: £88m). The increase largely reflected expenditure relating to the rebranding of Abbey and the Bradford & Bingley savings business as Santander in January 2010. In addition, higher expenses resulted from the process of transferring the business of Alliance & Leicester plc to Santander UK plc under Part VII of the Financial Services and Markets Act 2000. These expenses were offset in part by savings due to the sale of the James Hay business in March 2010.
> Impairment losses on loans and advances decreased by £20m to £nil (2009: £20m) in respect of the Alliance & Leicester treasury asset portfolio in 2009. These losses were offset by the income on the portfolio, which is classified in net interest income. In 2010 to date, there have been no further provisions for the Alliance & Leicester treasury asset portfolio.

Business and Financial Review – Interim Management Report
Other Material Items
18
Adjustments between the statutory basis and the trading basis The Board reviews discrete financial information for each of the Group’s reporting segments that includes measures of operating results and assets, which are measured on a “trading” basis. The trading basis differs from the statutory basis as a result of the application of various adjustments, as presented below. Management considers that the trading basis provides the most appropriate way of reviewing the performance of the business.
The trading adjustments consist of: Reorganisation and other costs
Six months ended 30 June 2010
£m
Six months ended 30 June 2009
£m Cost reduction programme 21 22 Misselling remediation administration costs 32 7 53 29
Cost reduction programme related expenses were broadly flat compared to the first half of 2009 and represented restructuring costs incurred in connection with the integration of Alliance & Leicester.
Misselling remediation administration costs increased to £32m (2009: £7m) reflecting ongoing misselling administration costs and payments in respect of settlement of certain claims. Hedging and other variances
Six months ended
30 June 2010 £m
Six months ended 30 June 2009
£m Income/(expense) 54 (96)
The Balance Sheet and Income Statement are subject to mark-to-market volatility, including that arising from the accounting for elements of derivatives deemed under IFRS rules to be ineffective as hedges. Volatility also arises on certain assets previously managed on a fair value basis, and hence classified as fair value through profit or loss under IFRS, that are now managed on an accruals basis.
Substantial mark-to-market gains arose in the second half of 2008 from movements in interest rates, which were more than offset by losses due to widening asset spreads on assets designated at fair value through profit or loss. In the first half of 2009, the mark-to-market gains reversed, but the credit spreads did not change significantly, resulting in the recognition of losses of £96m. In 2010 to date, there have been limited mark-to market losses.
In addition, other variances include the reversal of coupon payments on certain equity instruments which are treated as an interest expense in the trading results but are reported below the profit after tax line for statutory purposes. Profit on part sale of subsidiaries
Six months ended
30 June 2010 £m
Six months ended 30 June 2009
£m 35 -
These profits are excluded from the results to allow management to understand the underlying performance of the business. In 2010, the profit on sale of certain businesses has been excluded. In 2009, there were no such profits. Capital and other charges Capital charges principally comprise internal nominal charges for capital invested in the Group’s businesses. Management implemented this charge to assess if capital is invested effectively. On a consolidated basis, the total of these internal reallocations is £nil.

Business and Financial Review – Interim Management Report
Balance Sheet Business Review
19
Throughout this section, references to UK and non-UK refer to the location of the office where the transaction is recorded. Summary This balance sheet business review describes the Group’s significant assets and liabilities and its strategy and reasons for entering into such transactions. The principal assets and liabilities are summarised by their nature, rather than by their classification in the balance sheet. The balance sheet business review is divided into the following sections: > Securities – The Group’s strategies and reasons for holding securities are described on page 21, as well as an analysis by
type of issuer. > Loans and advances to banks – These assets are described on page 21, including commentary on the balances at 30
June 2010 compared to 31 December 2009. > Loans and advances to customers – These assets are described on page 22, including: > Commentary on the balances - at 30 June 2010 compared to 31 December 2009. > Provisions on loans and advances to customers – commentary on the movements in the provisions during
the six months ended 30 June 2010 and details of significant exposures to countries experiencing severe liquidity problems.
> Derivatives – The Group’s derivative positions are summarised on page 22. Cross-references are provided to other
disclosures about the Group’s strategies and reasons for entering into derivative transactions, and further detailed analysis of derivative notional amounts and assets and liabilities by type of contract.
> Tangible fixed assets – A summary of the Group’s capital expenditure during the period by segment is set out on
pages 22 and 23. > Deposits by banks – These liabilities are summarised on page 23, including average balances and maximum balances
during the period, with further analysis geographically. > Deposits by customers – These liabilities are summarised on page 23, including average balances and maximum
balances during the period, with further analyses geographically and by customer type. > Debt securities in issue – The Group’s debt securities in issue are summarised on page 24, including commentary on
the movements in the major debt issuance programmes during the period and cross-references to detailed descriptions of the programmes.
> Retirement benefit obligations – Details of the movements in the Group’s pension deficit are set out on pages 24. > Off balance sheet arrangements – The Group’s off-balance sheet arrangements, including guarantees, commitments,
contingencies, and exposures to off-balance sheet entities sponsored by the Group are described on page 25. > Capital management and resources – A summary of the Group’s approach to capital management and resources is
set out on pages 25 to 27, as well as disclosures required by Pillar 3, details of the Group’s capital ratios and regulatory capital resources and requirements.
> Liquidity – The Group’s liquidity arrangements are described on pages 28 to 29, including a summary of the sources
and uses of liquidity, together with commentary on the Group’s cash flows. > Other > Changes in net interest income – An analysis of changes in the Group’s interest income, interest expense
and net interest income between changes in volume and changes in rate is presented on page 30. > Average balance sheets – As period-end statements may not be representative of the Group’s activity
throughout the period, average balance sheets for the Group are presented on page 31. The average balance sheets summarise the significant categories of assets and liabilities, including all major categories of interest-earning assets and interest-bearing liabilities, together with average interest rates.

Business and Financial Review – Interim Management Report
Balance Sheet Business Review continued
20
Reconciliation to classifications in the condensed consolidated balance sheet The classifications of assets and liabilities in the Group’s condensed consolidated balance sheet, including the Note reference, and in the balance sheet business review may be reconciled as follows: 30 June 2010 Balance sheet business review section
Balance sheet line item and note Note Securities
Loans and advances to
banks
Loans and advances to
customers Derivatives Tangible
fixed assets Other Balance
sheet total £m £m £m £m £m £m £m Assets Cash and balances at central banks - - - - - 22,493 22,493 Trading assets 6 17,025 5,179 847 - - - 23,051 Derivative financial instruments 7 - - - 27,897 - - 27,897 Financial assets designated at fair value 8 690 - 6,188 - - - 6,878 Loans and advances to banks - 5,812 - - - - 5,812 Loans and advances to customers 9 - - 189,678 - - - 189,678 Available for sale securities 11 806 - - - - - 806 Loans and receivables securities 12 - 3,508 2,210 - - - 5,718 Macro hedge of interest rate risk - - - - - 1,350 1,350 Property, plant and equipment 14 - - - - 872 - 872 Operating lease assets 15 - - - - 278 - 278 Tax, intangibles and other assets - - - - - 3,849 3,849 Total assets 18,521 14,499 198,923 27,897 1,150 27,692 288,682
Deposits by banks
Deposits by
customers
Debt securities
in issue Derivatives
Retirement benefit
obligations Other
Balance sheet total
£m £m £m £m £m £m £m Liabilities Deposits by banks 5,263 - - - - - 5,263 Deposits by customers - 148,597 - - - - 148,597 Derivative financial instruments 7 - - - 24,648 - - 24,648 Trading liabilities 16 31,769 3,317 1,297 - - - 36,383 Financial liabilities designated at fair value 17 - 8 5,532 - - - 5,540 Debt securities in issue 18 - - 48,903 - - - 48,903 Other borrowed funds 19 - - 1,524 - - - 1,524 Subordinated liabilities 20 - - 5,243 - - - 5,243 Retirement benefit obligations 21 - - - - 1,483 - 1,483 Tax, other liabilities and provisions - - - - - 3,359 3,359 Total liabilities 37,032 151,922 62,499 24,648 1,483 3,359 280,943 31 December 2009 Balance sheet business review section
Balance sheet line item and note Note Securities
Loans and advances to
banks
Loans and advances to
customers Derivatives Tangible
fixed assets Other Balance
sheet total £m £m £m £m £m £m £m Assets Cash and balances at central banks - - - - - 4,163 4,163 Trading assets 6 17,410 5,252 10,628 - - - 33,290 Derivative financial instruments 7 - - - 22,827 - - 22,827 Financial assets designated at fair value 8 5,979 - 6,379 - - - 12,358 Loans and advances to banks - 9,151 - - - - 9,151 Loans and advances to customers 9 - - 186,804 - - - 186,804 Available for sale securities 11 797 - - - - - 797 Loans and receivables securities 12 - 7,208 2,690 - - - 9,898 Macro hedge of interest rate risk - - - - - 1,127 1,127 Property, plant and equipment 14 - - - - 938 - 938 Operating lease assets 15 - - - - 312 - 312 Tax, intangibles and other assets - - - - - 3,626 3,626 Total assets 24,186 21,611 206,501 22,827 1,250 8,916 285,291
Deposits by banks
Deposits by customers
Debt securities
in issue Derivatives
Retirement benefit
obligations Other Balance
sheet total £m £m £m £m £m £m £m
Liabilities Deposits by banks 5,811 - - - - - 5,811 Deposits by customers - 143,893 - - - - 143,893 Derivative financial instruments 7 - - - 18,963 - - 18,963 Trading liabilities 16 40,824 4,115 1,213 - - - 46,152 Financial liabilities designated at fair value 17 45 12 4,366 - - - 4,423 Debt securities in issue 18 - - 47,758 - - - 47,758 Other borrowed funds 19 - - 1,352 - - - 1,352 Subordinated liabilities 20 - - 5,597 - - - 5,597 Retirement benefit obligations 21 - - - - 1,070 - 1,070 Tax, other liabilities and provisions - - - - - 3,050 3,050 Total liabilities 46,680 148,020 60,286 18,963 1,070 3,050 278,069

Business and Financial Review – Interim Management Report
Balance Sheet Business Review continued
21
Securities The Group holds securities for a variety of purposes: > As part of its trading activities in the Short Term Markets business of Global Banking & Markets; > For yield and liquidity purposes, including the Asset and Liability Management investment portfolio of Group
mortgage-backed securities and other asset-backed securities, in Group Infrastructure; and > In the Alliance & Leicester treasury asset portfolio in Group Infrastructure which is being reduced. The securities in this
portfolio are accounted for as loans and receivables as described in Note 19 of the Group’s 2009 Annual Report and are therefore disclosed in the Loans and advances to banks and Loans and advances to customers sections of this Balance Sheet Business Review. As at 30 June 2010, this portfolio was £5.7bn.
The following table sets out the book and market values of securities at 30 June 2010 and 31 December 2009. For further information, see the Notes to the condensed consolidated interim financial statements.
30 June 2010 £m
31 December 2009 £m
Trading portfolio Debt securities:
UK Government 1,625 968 US treasury and other US Government agencies and corporations 4 628 Other OECD governments 1,376 1,273 Bank and building society: - Certificates of deposit - Government guaranteed - 205 - Certificates of deposit - Other 1,710 1,730 Other issuers: - Floating rate notes – Government guaranteed 9,860 8,090 - Floating rate notes – Other 1,815 3,038
Ordinary shares and similar securities 635 1,478 17,025 17,410 Available for sale securities Debt securities:
UK Government 500 405 Other issuers 254 342
Ordinary shares and similar securities 52 50 806 797 Financial assets designated at fair value through profit or loss Debt securities:
Bank and building society certificates of deposit - 2,220 Other issuers: - Mortgage-backed securities 283 3,355 - Other asset-backed securities 72 50 - Synthetic floating rate notes and structured debt securities 335 354
690 5,979 Total 18,521 24,186 Trading portfolio - 30 June 2010 compared to 31 December 2009 The size of the total trading portfolio has remained largely unchanged at 30 June 2010 compared to 31 December 2009, although there has been a shift from floating rate notes to government-guaranteed floating rate notes due to the enhanced risk-adjusted yield, and additional holdings of UK Government securities for liquidity purposes. Available for sale securities - 30 June 2010 compared to 31 December 2009 The size of the portfolio remains largely unchanged at 30 June 2010 compared to 31 December 2009. Financial assets designated at fair value through profit or loss - 30 June 2010 compared to 31 December 2009 The decrease in the portfolio at 30 June 2010 compared to 31 December 2009 was due to the maturity of certain certificates of deposit combined with the sale of the majority of the mortgage-backed securities portfolio to Banco Santander, S.A. in June 2010 as described in Note 26 to the condensed consolidated interim financial statements. Loans and advances to banks Loans and advances to banks include loans to banks and building societies and balances with central banks (excluding those central bank balances which can be withdrawn on demand). Loans and advances to banks - 30 June 2010 compared to 31 December 2009 Loans and advances to banks decreased at 30 June 2010 compared to 31 December 2009 due to significant disposals and maturities of assets within the Alliance & Leicester treasury asset portfolio, which are classified as loan and receivable securities, redemption of loans to Banco Santander, S.A. group companies and reduced repurchase agreement (‘repo’) activity with bank counterparties.

Business and Financial Review – Interim Management Report
Balance Sheet Business Review continued
22
Loans and advances to customers The Group provides lending facilities primarily to personal customers in the form of mortgages secured on residential properties and a limited number of lending facilities to corporate customers. Purchase and resale agreements represent sale and repurchase activity with professional non-bank customers by the Global Banking & Markets Short Term Markets business. Loans and advances to customers – 30 June 2010 compared to 31 December 2009 Loans and advances to customers decreased at 30 June 2010 compared to 31 December 2009 due to a significant decrease in repurchase agreement (‘repo’) activity with non-bank counterparties, which more than offset an increase in retail and corporate lending. Provisions on loans and advances to customers Details of the Group’s provisioning policy are set out on page 64 and in the Accounting Policies section on pages 116 to 118 to the 2009 Annual Report. An analysis of the movements in provisions for bad and doubtful debts is set out in Note 9 to the condensed consolidated interim financial statements. Provisions on loans and advances to customers – six months ended 30 June 2010 compared to six months ended 30 June 2009 Retail Banking impairment losses on loans and advances of £356m decreased by £9m from £365m in the first half of 2009, with the largest decrease relating to mortgages. This improving performance in difficult economic conditions has been delivered as a result of three factors: a high quality mortgage book, effective collection handling and the slight upturn in house prices in a low interest rate environment. Similarly, performance across the unsecured portfolios has also improved in the year to date. Corporate Banking impairment losses on loans and advances of £31m increased by £12m from £19m in the first half of 2009. The increase of £12m reflected growth in asset balances and some deterioration arising from market conditions. Sovereign debt exposure At 30 June 2010, the Group had the following exposures to sovereign debt.
30 June 2010 £m
United Kingdom(1) 20,414 United States of America 3,483 Switzerland 1,030 Spain 182 Austria 163 25,272
(1) Excludes the exposure on margin given with respect to the Bank of England's Special Liquidity Scheme Derivative assets and liabilities
30 June 2010
£m 31 December 2009
£m Assets Derivative financial instruments: - held for trading 25,222 21,472 - held for fair value hedging 2,675 1,355 27,897 22,827 Liabilities Derivative financial instruments: - held for trading 22,077 16,775 - held for fair value hedging 2,571 2,188 24,648 18,963 Derivatives are held by the Group for trading or for risk management purposes. All derivatives are classified as held at fair value through profit or loss. For accounting purposes, the Group chooses to designate certain derivatives as in a hedging relationship if they meet specific criteria. The main hedging derivatives are interest rate and cross-currency swaps, which are used to hedge fixed-rate lending and structured savings products and medium-term note issuances, capital issuances and other capital markets funding. Further detailed analysis of the derivatives held by the Group, both for trading and hedging purposes, including derivative notional amounts and assets and liabilities analysed by type of contract is contained in Note 7 of the condensed consolidated interim financial statements. Tangible fixed assets 30 June 2010
£m 31 December 2009
£m Property, plant and equipment 872 938 Operating lease assets 278 312 1,150 1,250 Capital expenditure incurred during the period/year 85 343

Business and Financial Review – Interim Management Report
Balance Sheet Business Review continued
23
Capital expenditure during the six months ended 30 June 2009 and the 12 months ended 31 December 2009 was principally incurred by Retail Banking (mostly consisting of computer infrastructure, computer software and furniture and fittings for branches) and by Corporate Banking (consisting of operating lease assets).
Management believes its existing properties and those under construction, in conjunction with those it leases, are adequate and suitable for its business as presently conducted and to meet future business needs. All properties are adequately maintained. Deposits by banks(1)
The balances below include deposits by banks that are classified in the balance sheet as trading liabilities and financial liabilities designated at fair value. Six months ended
30 June 2010 £m
12 months ended 31 December 2009
£m Period/year-end balance(2) 37,032 46,680 Average balance(3) 39,836 48,907 Maximum balance 41,784 57,845 (1) The Group’s policy is to mark to market the majority of its deposits by banks including interest. Mark-to-market movements are recorded in net trading and other
income rather than net interest income. As a result, it has not been possible to calculate average or period/year-end interest rates. (2) The period/year-end deposits by banks balance includes non-interest bearing items in the course of transmission of £973m (2009: £652m). (3) Average balances are based upon monthly data. At 30 June 2010, deposits by foreign banks amounted to £13,828m (2009: £15,282m).
The following table sets forth the average balances of deposits by banks by geography.
Six months ended 30 June 2010
£m
12 months ended 31 December 2009
£m UK 38,137 45,152 Non-UK 1,699 3,755 39,836 48,907 Deposits by customers The balances below include deposits by customers that are classified in the balance sheet as trading liabilities and financial liabilities designated at fair value.
Six months ended 30 June 2010
£m
12 months ended 31 December 2009
£m Period/year-end balance 151,922 148,020 Average balance(1) 151,508 141,312 Maximum balance 154,425 148,020 (1) Average balances are based upon monthly data. The following table sets forth the average balances of deposits by geography.
Six months ended 30 June 2010
£m
12 months ended 31 December 2009
£m UK 143,687 134,209 Non-UK 7,821 7,103 151,508 141,312 The following table sets forth the average balances of deposits by geography and customer type.
Six months ended 30 June 2010
£m
12 months ended 31 December 2009
£m
UK Retail demand deposits 74,978 73,060 Retail time deposits 48,271 42,873 Wholesale deposits 20,438 18,276 143,687 134,209 Non-UK Retail demand deposits 2,897 3,170 Retail time deposits 4,589 3,724 Wholesale deposits 335 209 7,821 7,103 151,508 141,312

Business and Financial Review – Interim Management Report
Balance Sheet Business Review continued
24
Debt securities in issue The Group has issued debt securities in a range of maturities, interest rate structures and currencies, for purposes of meeting liquidity, funding and capital needs.
Note 30 June 2010
£m 31 December 2009
£m Trading liabilities 16 1,297 1,213 Financial liabilities designated at fair value 17 5,532 4,366 Debt securities in issue 18 48,903 47,758 Other borrowed funds 19 1,524 1,352 Subordinated liabilities 20 5,243 5,597 62,499 60,286
Most of the debt securities that the Group has issued are classified as ‘Debt securities in issue’ in the balance sheet. The remaining debt securities issued by the Group are classified separately in the balance sheet, either because they qualify as Trading liabilities or were designated upon initial recognition as Financial liabilities designated at fair value, or there are key differences in the legal terms of the securities, such as liquidation preferences (‘Other borrowed funds’), or subordination of the rights of holders to the rights of holders of certain other liabilities (‘Subordinated liabilities’). Trading liabilities – The debt securities in issue classified as trading liabilities are set out in Note 16 to the condensed consolidated interim financial statements and include short positions in securities. The balance remained largely unchanged at 30 June 2010 compared to 31 December 2009. Financial liabilities designated at fair value – Details of the securities classified as ‘Financial liabilities designated at fair value’ are set out in Note 17 to the condensed consolidated interim financial statements.
Financial liabilities designated at fair value increased at 30 June 2010 compared to 31 December 2009 due to new issues being classified at fair value, partially offset by repayments. Debt securities in issue – Details of the Group’s main debt securities issuance programmes are set out in Note 18 to the condensed consolidated interim financial statements and Note 31 in the 2009 Annual Report.
Debt securities in issue increased at 30 June 2010 compared to 31 December 2009 due to further issuances under the covered bond programme and the Fosse securitisation programme. This increase has been partially offset by maturities of debt securities in the Holmes securitisation programme. Other borrowed funds – Details of the individual securities classified as Other borrowed funds are set out in Note 19 to the condensed consolidated interim financial statements and Note 32 in the 2009 Annual Report.
Other borrowed funds increased at 30 June 2010 compared to 31 December 2009 due to the effect of changes in the sterling-US dollar exchange rate on the Group’s US$1,000m Non-Cumulative Trust Preferred Securities. Subordinated liabilities – Details of the individual securities classified as Subordinated liabilities are set out in Note 33 in the 2009 Annual Report.
Subordinated liabilities decreased at 30 June 2010 compared to 31 December 2009 due to the redemption of the £200m 5.25% Subordinated Notes 2015 and the euro 400m Subordinated Floating Rate EURIBOR Notes 2015 partially offset by the effect of changes in the sterling-US dollar exchange rate. Retirement benefit obligations
30 June 2010 £m
31 December 2009 £m
Total net liabilities 1,483 1,070 The Group operates a number of defined contribution and defined benefit pension schemes, and post retirement medical benefit plans. Further disclosures of the Group’s retirement benefit obligations are contained in Note 21 to the condensed consolidated interim financial statements.
The total net deficit on the Group’s defined benefit schemes, and other post retirement medical benefit plans, increased from £1,070m at 31 December 2009 to £1,483m at 30 June 2010. The key reasons for the increase in the deficit at 30 June 2010 were a reduction of 34 basis points in the net discount rate (i.e. the discount rate less the inflation rate) used to value the defined benefit scheme liabilities, and asset returns below expectations. These increases were partly offset by employer contributions made.

Business and Financial Review – Interim Management Report
Balance Sheet Business Review continued
25
Off-Balance Sheet Arrangements In the ordinary course of business, the Group issues guarantees on behalf of customers. The significant types of guarantees are described on page 40 of the 2009 Annual Report. See Note 37 of the 2009 Annual Report for additional information regarding the Group’s guarantees, commitments and contingencies. In the ordinary course of business, the Group also enters into securitisation transactions as described in Note 10 to the condensed consolidated interim financial statements. The securitisation companies are consolidated. The mortgage assets continue to be administered by the Group. The securitisation companies provide the Group with an important source of long-term funding. Capital management and resources Capital management and capital allocation The Group adopts a centralised capital management approach, based on an assessment of both regulatory requirements and the economic capital impacts of our businesses. Details of the Group’s objectives, policies and processes for managing capital, including the group capital table, can be found in Note 29 to the condensed consolidated interim financial statements. Capital and risk management disclosures required by Pillar 3 Banco Santander, S.A. is supervised by the Banco de España on a consolidated basis. The Group has applied Banco Santander, S.A.’s approach to capital measurement and risk management in its implementation of Basel II. As a result, the Group has been classified as a significant sub-group of Banco Santander, S.A. at 30 June 2010. The relevant Pillar 3 disclosure requirements for the Group are set out below. Further information on the Basel II risk measurement of the Group’s exposures is included in Banco Santander, S.A.’s Pillar 3 report. Scope of the Group’s capital adequacy Santander UK plc and its subsidiaries are a UK banking group regulated by the UK Financial Services Authority. The basis of consolidation for prudential purposes is the same as the basis of consolidation for financial statement purposes. Consequently, the results of significant subsidiaries regulated by the UK Financial Services Authority are included in the Group’s capital adequacy disclosures.
On 9 January 2009, primarily in order to optimise the capital, liquidity funding and overall financial efficiency of the enlarged Santander group, Banco Santander, S.A. transferred all of its Alliance & Leicester plc shares to the Company in exchange for newly issued ordinary shares of the Company.
On 3 August 2010, Banco Santander S.A., through a wholly-owned Spanish-based subsidiary Santusa Holding, S.L., injected capital of £4,456m of equity capital into Santander UK plc. If this capital injection had taken place prior to 30 June 2010, the Core Tier 1 ratio of 8.0% as set out below would have been 14.5%. The capital will, however, be used to support organic and inorganic growth as well as a planned reorganisation of Banco Santander, S.A. group companies in the UK.
Capital transferability between the Group’s subsidiaries is managed in accordance with the Group’s corporate purpose and strategy, its risk and capital management policies and with regard to UK legal and regulatory requirements. There are no other current or foreseen material practical or legal impediments to the prompt transfer of capital resources or repayment of liabilities when due between the Company and its subsidiaries and associates. Capital ratios The calculations of Group capital are prepared on a basis consistent with the Group’s regulatory filings.
The table below sets forth the Group’s capital ratios:
30 June 2010 31 December 2009 Core Tier 1 (after deductions)(1) 8.0% 6.8% Tier 1 11.1% 9.5% Total capital 18.5% 17.6% (1) Excludes accrual for dividend for the six months ended 30 June 2010. Including this, core Tier 1 capital ratio was 7.4%. Ratios are calculated by taking the relevant capital resources as a percentage of risk weighted assets.

Business and Financial Review – Interim Management Report
Balance Sheet Business Review continued
26
Regulatory capital resources The table below sets forth the composition of the Group’s regulatory capital resources. The calculations reflect the amounts prepared on a basis consistent with the Group’s regulatory filings. 30 June 2010
£m 31 December 2009
£m
Core Tier 1 capital: Called up share capital 2,412 2,412 Share premium 1,857 1,857 Retained earnings and other reserves 2,994 2,251 7,263 6,520 Deductions from Core Tier 1 capital: Intangible Assets (1,550) (1,541) Securitisation positions (61) (75) Expected Losses (245) (325) (1,856) (1,941) Total Core Tier 1 capital after deductions 5,407 4,579 Non-cumulative Preference Shares 855 833 Innovative Tier 1 instruments 1,563 1,332 Excess on limits for including Innovative Tier 1 capital in total Tier 1 capital and other Tier 1 (309) (306) Total Tier 1 capital after deductions 7,516 6,438 Tier 2 capital: Subordinated debt 5,029 5,516 Excess Innovative Tier 1 capital 404 306 Other 10 10 5,443 5,832 Deductions from Tier 2 capital: Securitisation positions (61) (75) Expected Losses (340) (325) Total Tier 2 capital after deductions 5,042 5,432 Total Capital Resources 12,558 11,870 The Group’s Core Tier 1 capital consists of ordinary share capital, share premium and retained earnings including profits for the six months ended 30 June 2010 and the year ended 31 December 2009 after adjustment to comply with the UK Financial Services Authority’s rules with the exception of the inclusion of unaudited profits. A reconciliation to the statutory reserves is set out below: 30 June 2010
£m 31 December 2009
£m
Total shareholders equity (accounting basis) 7,739 7,222 Less: Reserve Capital Instruments (See Note 23) (297) (297) Less: Non-cumulative Preference Shares and Innovative Tier 1 Capital Securities (See Note 23) (597) (591) Less: Available for sale reserves (14) (12) Pensions adjustment 463 217 Changes in liabilities designated as fair value through profit or loss from changes in Group’s own credit risk (31) (19) Core Tier 1 capital 7,263 6,520 The IAS19 pension deficit is deducted from shareholders’ equity. In the Group’s regulatory filings, the next five years’ deficit contributions are treated as a deduction.
Valuation adjustments relating to liabilities designated at fair value through profit or loss which are not attributable to changes in benchmark interest rates are excluded from regulatory capital resources.
The increase in Core Tier 1 capital primarily relates to retained profits for the period. Non-cumulative Preference Shares and Innovative Tier 1 Capital Securities are shown separately in the above table. Details of the Innovative Tier 1 Capital Securities are set out in Note 32 of the 2009 Annual Report and Note 23 to the condensed consolidated interim financial statements. For capital management purposes and in accordance with the UK Financial Services Authority’s rules, Innovative Tier 1 is treated as Tier 1 capital. The UK Financial Services Authority’s capital adequacy rules restrict the amount of Innovative Tier 1 capital included in Tier 1 capital to 15% of Core Tier 1 capital after deductions. The excess is classified as Tier 2.

Business and Financial Review – Interim Management Report
Balance Sheet Business Review continued
27
For details of the subordinated debt issues that meet the UK Financial Services Authority’s definition of Tier 2 capital see Note 33 of the 2009 Annual Report and Note 20 to the condensed consolidated interim financial statements. In accordance with the UK Financial Services Authority’s rules, in the last five years to maturity, dated subordinated debt issues are amortised on a straight-line basis.
During 2009, accounting valuation adjustments to Tier 1 and Tier 2 instruments were also included in capital as permitted in accordance with UK Financial Services Authority rules. The Group has elected to deduct certain securitisation positions from capital rather than treat these exposures as a risk weighted asset.
The expected losses deduction represents the difference between expected loss calculated in accordance with the Group’s Retail Internal Rating-Based (‘IRB’) and Advanced Internal Rating-Based (‘AIRB’) models, and the impairment provisions calculated in accordance with IFRS. Details of the Group’s accounting policy for credit provisions are set out in the Accounting Policies in the 2009 Annual Report pages 116 to 118. Expected losses are calculated using risk parameters based on either through-the-cycle, or economic downturn estimates, and which are subject to conservatism due to the imposition of regulatory floors. They are therefore currently higher than the impairment provision which accounts for losses incurred at the balance sheet date.
Intangible assets represent goodwill arising on the transfer of Alliance & Leicester plc, the acquisition of the Bradford & Bingley savings business, and the acquisition of Cater Allen Private Bank and certain capitalised computer software costs. Regulatory capital requirement The table below analyses the composition of the Group’s regulatory capital requirements. The calculations reflect the amounts prepared on a basis consistent with the Group’s regulatory filings.
30 June 2010 £m
31 December 2009 £m
Credit Risk - Standardised approach: Institutions 25 16 Corporates 632 602 Retail 215 208 Secured on real estate property 206 210 Past due items 44 38 Other items 255 254 1,377 1,328 Credit Risk - IRB approach: Retail exposures secured by real estate collateral 1,792 1,732 Qualifying revolving retail 150 149 Other retail 268 298 Institutions 135 188 Corporates 647 581 Other 35 62 3,027 3,010 Counterparty risk capital component 191 213 Operational risk – Standardised approach 529 529 Market Risk: Interest rate Position Risk Requirement (‘PRR’) 56 34 Equity PRR 35 37 Commodity PRR 23 45 FX PRR 32 33 Internal models 163 166 309 315 Total Pillar 1 capital requirement 5,433 5,395 Risk weighted assets (based on an 8% capital charge) 67,913 67,438
The UK Financial Services Authority approved the Group’s application of the Retail IRB and AIRB approaches to the Group’s credit portfolios with effect from 1 January 2008. Residential lending capital resources requirement include securitised residential mortgages.
Although core business volumes have increased in the first half of 2010, these increases have been offset by de-leveraging of certain non-core portfolios. During the course of 2009, regulatory approval was received to apply a refined approach to the retail exposures secured by real estate collateral which addressed the effects of pro-cyclicality on the estimates for probability of default (PD).

Business and Financial Review – Interim Management Report
Balance Sheet Business Review continued
28
Funding and Liquidity Liquidity risk is the potential that, although remaining in operation, the Group does not have sufficient liquid financial resources to enable it to meet its obligations as they fall due, or can secure them only at excessive cost. The Board is responsible for the Group’s liquidity management and control framework and has approved key liquidity limits in setting the Group’s liquidity risk appetite. Along with its internal Liquidity Risk Manual, which sets out the liquidity risk control framework and policy, the Group abides by the “Sound Practices for Managing Liquidity in Banking Organisations” set out by the Basel Committee as its standard for liquidity risk management and control. The Group also complies with the UK Financial Services Authority’s liquidity requirements, and has appropriate liquidity controls in place.
See “Business and Financial Review – Risk Management” for more information. Cash flows Six months ended
30 June 2010 £m
Six months ended 30 June 2009
£m Net cash inflow/(outflow) from operating activities 1,978 (751) Net cash inflow from investing activities 175 1,415 Net cash inflow/(outflow) from financing activities 3,713 (4,960) Increase/(decrease) in cash and cash equivalents 5,866 (4,296) During the six months ended 30 June 2010 and 30 June 2009, cash and cash equivalents increased by £5,866m and decreased by £4,296m respectively. The following discussion highlights the major activities and transactions that affected the Group’s cash flows during the first six months of 2010 and 2009.
Cash Flows from Operating Activities During the six months ended 30 June 2010 and 30 June 2009, net cash inflow(outflow) from operating activities was £1,978m and £(751m), respectively. The Group’s operating activities support the Group’s lending activities, including the origination of mortgages and unsecured personal loans. During 2010, net customer deposit inflows exceeded net lending due to strong deposit flows in the Retail division following the alignment of product marketing and pricing strategies across the brands. Cash Flows from Investing Activities The Group’s investing activities primarily involve the acquisition and disposal of businesses, and the purchase of tangible and intangible assets.
During the six months ended 30 June 2010, net cash of £175m mainly arose from cash received from the sale of the James Hay business. During the six months ended 30 June 2009, net cash of £1,415m was generated by investing activities, primarily as a result of proceeds in respect of available-for-sale securities that were sold or matured during the period. Cash Flows from Financing Activities The Group’s financing activities reflect transactions involving the issuance and repayment of long-term debt, and the issuance of, and payment of dividends on, the Company’s shares.
During the six months ended 30 June 2010, net cash inflow from financing activities was £3,713m, principally due to borrowing under new loans. There were new issues of long-term debt (specifically covered bonds and mortgage securitisation issues under the Fosse programme) partially offset by the redemption of subordinated debt and mortgage securitisation issues under the Holmes programme. During the six months ended 30 June 2009, net cash outflow from financing activities was £4,960m, principally due to the repayment of loan capital. Sources of funding and liquidity The Group is primarily funded by retail deposits. This, together with corporate deposits, forms its Commercial Bank franchise, which attracts deposits from a variety of entities. More than three quarters of Commercial Bank customer lending is financed by Commercial Bank customer deposits. The retail sources primarily originate from the Retail Banking savings business. Although largely callable, these funds provide a stable and predictable core of liquidity due to the nature of the retail accounts and the breadth of personal customer relationships.
Additionally, the Group has a strong wholesale funding base, which is diversified across funding types and geography. Through the wholesale markets, the Group has active relationships with counterparties across a range of sectors, including banks, central banks, other financial institutions, corporates and investment funds. Other sources of funding include collateralised borrowings, mortgage securitisations and long-term debt issuance. While there is no certainty regarding money market lines of credit extended to the Group, they are actively managed as part of the ongoing business. No guaranteed lines of credit have been purchased as such arrangements are not common practice in the European banking industry.
Short-term funding is accessed through money market instruments, including time deposits, certificates of deposit and commercial paper. Medium to long-term funding is accessed primarily through the international bond markets. In addition, the Group utilises its euro medium-term note programme. The major debt issuance programmes are managed by Abbey National Treasury Services plc on its own behalf, except for the US commercial paper programme, which is managed for Abbey National North America LLC, a guaranteed subsidiary of the Company, and are set out in Note 31 to the 2009 Annual Report.

Business and Financial Review – Interim Management Report
Balance Sheet Business Review continued
29
The ability to sell assets quickly is also an important source of liquidity for the Group. The Group holds marketable investment securities, such as central bank, eligible government and other debt securities, which could be disposed of, either by entering into sale and repurchase agreements, or by being sold to provide additional funding should the need arise. The Group also makes use of asset securitisation arrangements to provide alternative funding sources.
Along with other major UK banks and building societies, the Company participated in the Bank of England's Special Liquidity Scheme whereby it exchanged self-subscribed covered bonds or mortgage securitisation issuances for highly liquid Treasury Bills. All major UK banks and building societies were required to participate as part of the measures designed to improve the liquidity position of the UK banking system in general. The Company did not participate in the other UK Government backed schemes; namely the Credit Guarantee Scheme and the Asset Purchase Scheme.
Within the framework of prudent funding and liquidity management, the Group manages its Commercial Banking activities to minimise liquidity risk. As at 30 June 2010, the Group’s loan to deposit ratio was 124% (31 December 2009: 126%) and this improvement was driven by growth in net deposit inflows which exceeded net lending growth. The Group aims to further reduce this ratio strategically over the remainder of the year.
Securitisation of assets The Group has provided prime retail mortgage-backed securitised products to a diverse investor base through its mortgage backed funding programmes. Funding has historically been raised via mortgage-backed notes, both issued to third parties and retained (the latter as central bank eligible collateral, both under the Bank of England's Special Liquidity Scheme facility and for contingent funding purposes in other Bank of England, European Central Bank, Swiss National Bank, and US Federal Reserve facilities). It is expected that issues to third parties and retained issuances will together represent a similar proportion of the Group’s overall funding through 2010. Uses of funding The principal uses of funding for the Group are Retail and Corporate Banking lending, payment of interest expense, dividends paid to shareholders, and the repayment of debt. The Group’s ability to pay dividends depends on a number of factors, including the Group’s regulatory capital requirements, distributable reserves, financial performance and cash flow. For further information on funding and liquidity, including liquidity risk management and developments during the year, see Risk Management – Liquidity Risk – Group wide on pages 38 to 40 and Risk Management – Impact of the Current Credit Environment on pages 56 to 65. Current market conditions Market conditions remain difficult in terms of access to credit and liquidity. Despite this, during the first half of 2010, we have been able to leverage our strong financial position and brand to raise over £10bn of medium-term wholesale funding, including in March 2010, £1.4bn from a mortgage-backed securitisation and, in June 2010, £6.5bn from additional mortgage-backed issuances. A further £3.2bn of funding has been raised from medium-term issuances since 30 June 2010. We will continue to access wholesale markets as opportunities arise. These markets have traditionally been and continue to be important sources of funding.
During this time, the Group kept its main stress scenarios under review upon which the Board’s risk appetite is based, in light of market developments and the FSA's ILAS liquidity regime that came into force on 1 June 2010. At all times, the Group sought to maintain a liquid asset buffer of securities comprising ILAS eligible assets (Government bonds and central bank reserve accounts) as well as securities that are eligible for discount with the central banks to which the Group has access. This buffer was at least sufficient to survive either an acute Group-specific stress during stressed market conditions, or a prolonged loss of unsecured wholesale funding during stressed market conditions. The underlying analysis of customer deposit behaviour under stressed conditions is aligned with the assumptions made in operational contingency planning.

Business and Financial Review – Interim Management Report
Balance Sheet Business Review continued
30
Changes in net interest income - volume and rate analysis The following table allocates changes in interest income, interest expense and net interest income between changes in volume and changes in rate for the Group for the six months ended 30 June 2010 compared to the six months ended 30 June 2009, and the 12 months ended 31 December 2009 compared to the 12 months ended 31 December 2008.
Volume and rate variances have been calculated on the movement in the average balances and the change in the interest rates on average interest-earning assets and average interest-bearing liabilities. The variance caused by changes in both volume and rate has been allocated to rate changes.
Six months ended 30 June 2010 compared to
Six months ended 30 June 2009
12 months ended 31 December 2009 compared to
12 months ended 31 December 2008
Total change
Changes due to increase/(decrease) in
Total change
Changes due to increase/(decrease) in
£m
Volume £m
Rate £m £m
Volume £m
Rate £m
Interest income Loans and advances to banks - UK (68) 6 (74) (284) 93 (377) - Non-UK (14) 48 (62) (9) 10 (19) Loans and advances to customers - UK (221) 287 (508) (625) 2,664 (3,289) - Non-UK - - - 2 - 2 Debt securities - UK (140) (148) 8 319 244 75 Total interest income - UK (429) 145 (574) (590) 3,001 (3,591) - Non-UK (14) 48 (62) (7) 10 (17) (443) 193 (636) (597) 3,011 (3,608) Interest expense Deposits by banks - UK (200) (175) (25) (25) (5) (20) Deposits by customers - retail demand deposits - UK 27 22 5 (1,361) 770 (2,131) - Non-UK 21 (3) 24 12 40 (28) Deposits by customers - retail time deposits - UK (34) 207 (241) (318) 447 (765) - Non-UK 9 24 (15) (17) 74 (91) Deposits by customers - wholesale deposits - UK 22 72 (50) 823 210 613 - Non-UK - - - - - - Bonds and medium-term notes - UK (311) (130) (181) (1,224) 148 (1,372) - Non-UK (5) 31 (36) (281) 77 (358) Dated and undated loan capital and other subordinated liabilities
- UK (190) (28) (162) 147 90 57 - Non-UK 3 (1) 4 (7) 10 (17) Other interest-bearing liabilities - UK (3) 9 (12) 14 5 9 Total interest expense - UK (689) (22) (667) (1,944) 1,665 (3,609) - Non-UK 28 50 (22) (293) 201 (494) (661) 28 (689) (2,237) 1,866 (4,103) Net interest income 218 165 53 1,640 1,145 495

Business and Financial Review – Interim Management Report
Balance Sheet Business Review continued
31
Average balance sheet (1) (2)
Six months ended 30 June 2010 Six months ended 30 June 2009
Average balance
£m
Interest
£m
Average rate
%
Average balance
£m
Interest
£m
Average rate
% Assets Loans and advances to banks - UK 16,844 50 0.59 16,414 118 1.44 - Non-UK 1,808 1 0.11 695 15 4.32 Loans and advances to customers(3) - UK 188,411 3,283 3.48 181,008 3,504 3.87 - Non-UK 13 1 5.38 19 1 5.53 Debt securities - UK 8,347 61 1.46 13,221 201 3.04 Total average interest-earning assets, interest income 215,423 3,396 3.15 211,357 3,839 3.63 Provision for loan losses (1,464) - - (1,450) - - Trading business 25,039 - - 26,466 - -
Assets designated at fair value through profit and loss 9,555 - - 11,879 - - Non-interest-earning assets: - Other 38,869 - - 40,037 - - Total average assets 287,422 - - 288,289 - - Non-UK assets as a % of total 0.63% - - 0.25% - - Liabilities Deposits by banks - UK (4,691) (41) 1.75 (7,355) (241) 6.55 Deposits by customers: retail demand - UK (74,978) (589) 1.57 (73,554) (562) 1.53 - Non-UK (2,897) (36) 2.49 (3,269) (15) 0.92 Deposits by customers: retail time - UK (48,271) (438) 1.81 (39,601) (472) 2.38 - Non-UK (4,589) (42) 1.83 (3,360) (33) 1.96 Deposits by customers: wholesale - UK (16,747) (88) 1.05 (10,835) (66) 1.22 Bonds and medium-term notes - UK (38,330) (164) 0.86 (44,413) (475) 2.13 - Non-UK (13,503) (16) 0.24 (7,786) (21) 0.54 Dated and undated loan capital and other subordinated liabilities - UK (7,292) (31) 0.85 (7,780) (221) 5.68 - Non-UK (671) (30) 8.94 (678) (27) 7.96 Other interest-bearing liabilities - UK (1,136) (16) 2.82 (913) (19) 4.16 Total average interest-bearing liabilities, interest expense (213,105) (1,491) 1.40 (199,544) (2,152) 2.16 Trading business (39,447) - - (52,151) - - Liabilities designated at fair value through profit and loss (6) - - (42) - - Non-interest-bearing liabilities: - Other (28,703) - - (30,804) - - Shareholders’ funds (6,161) - - (5,748) - - Total average liabilities and shareholders’ funds (287,422) (1,491) - (288,289) (2,152) - Non-UK liabilities as a % of total 7.54% - - 5.24% - - Interest spread - - 1.75 - - 1.48 Net interest margin - - 1.77 - - 1.60
(1) Average balances are based upon monthly data. (2) The ratio of average interest-earning assets to interest-bearing liabilities for the six months ended 30 June 2010 was 101.09% (Six months ended 30 June 2009:
105.92%). (3) Loans and advances to customers include non-performing loans. See “Analysis of provisions on loans and advances to customers” in the Risk Management
Report.

Business and Financial Review – Interim Management Report
Risk Management
32
Summary This Risk Management report describes the Risk Governance Framework of Santander UK plc (the ‘Company’, and together with its subsidiaries, the ‘Group’), and includes more detail on the Group’s key risks, on a segmental basis or aggregated where relevant. It is divided into the following sections: Introduction - A description of the Group’s Risk Governance Framework, including the three tiers of the Risk Governance structure. Financial Risks and Risk Management – Significant changes in the Group-wide disclosures about specific risks which do not originate in any single operating segment, as well as Group-wide disclosures about credit risk, market risk and pension obligation risk are described on pages 34 to 38. Liquidity Risk – A description of the liquidity risks the Group faces, along with their management and activity in 2010 and 2009, can be found on pages 38 to 40. Discussion of Key Risks by Operating Segment- Detailed discussions about risk exposures, measurement information and management policies presented by operating segment can be found on pages 40 to 55: > Risks in Retail Banking – The risks in this segment are described on pages 40 to 46, comprising: > Credit risk, including its management, an analysis of types and credit quality of retail lending and disclosures
relating to provisioning, arrears and recoveries. > Market risk, including its management. > Risks in Corporate Banking - The risks in this segment are described on pages 47 to 50, comprising: > Credit risk, including its management, mitigation and the disclosure of exposure by rating of counterparty. > Market risk, including its management. > Risks in Global Banking & Markets - The risks in this segment are described on pages 50 to 52, comprising: > Credit risk, including its management, mitigation and the disclosure of exposure by rating of counterparty. > Market risk, including its management and disclosures on short-term market risk, structural market risk and
trading market risk. > Risks in Private Banking - The risks in this segment are described on pages 52 and 53, comprising a description of
credit risk and market risk in the entities which this segment incorporates. > Risks in Group Infrastructure - The risks in this segment are described on pages 53 to 55, comprising: > Credit risk, including its management and the disclosure of exposure by rating of counterparty. > Market risk, including its management and disclosure of Net Interest Margin Sensitivity and the Market Value
of Equity sensitivity. > A description of the types of derivative contracts used to hedge risks in this segment. The Impact of the Current Credit Environment – Detailed disclosures can be found on pages 56 to 65, including a description of the Group’s exposures to certain classes of financial assets and off-balance sheet entities. Introduction The Group accepts that risk arises from its full range of activities, and actively manages and controls it. The management of risk is an integral part of the Group’s activities. Risk is defined as the uncertainty around the Group’s ability to achieve its business objectives and execute its strategy effectively. Risk constitutes the Group’s exposure to uncertainty and the consequent variability of return. Specifically, risk equates to the adverse impacts on profitability arising from different sources of uncertainty. The key risks Santander UK is exposed to are Credit (Retail, Corporate & Commercial, Wholesale), Market (Traded and Non-Traded), Operational, Pension Obligation, Concentration, Residual Value, Liquidity, Asset Backed Funding (including Encumbrance), Reputational and Business Strategic. Risk measurement is used to capture the source of the uncertainty and the magnitude of its potential effect on the profitability and solvency of the Group. Effective risk management and control is therefore of fundamental importance to the Group’s long-term success.
Understanding and controlling risk is critical for the effective management of the business. The Group’s Risk Framework aims to ensure that risk is managed and controlled on behalf of shareholders, customers, depositors, employees and the Group’s regulators. Effective and efficient risk governance and oversight provide management with assurance that the Group’s business activities will not be adversely impacted by risks that could have been reasonably foreseen. This in turn reduces the uncertainty of achieving the Group’s strategic objectives.
Authority for Risk Management flows from the Santander UK plc Board of Directors (the ‘Board’) to the Chief Executive and from him to specific individuals. Formal standing committees are maintained for effective management or oversight. Their authority is derived from the person they are intended to assist.

Business and Financial Review – Interim Management Report
Risk Management continued
33
Risk Governance Framework The diagram below shows the Risk Governance Framework in operation in respect of risk management and oversight.
FEVE is a Spanish acronym for “Firmas En Vigilancia Especial”, which means business under special watch. The Risk Division at Banco Santander, S.A. reports to the President of the Comisión Delegada de Riesgos (‘CDR’ or Delegated Risk Committee).
The main elements of risk governance within the Group are as follows: First tier of risk governance Risk management is provided by the Board. It approves the Group’s risk appetite in consultation with Banco Santander, S.A. as appropriate, approves the strategy for managing risk and is responsible for the Group’s system of internal control. The Board is supported by the Chief Executive and Executive Management, who have primary responsibility for understanding, identifying, and owning the risks generated by their lines of business and establishing a framework for managing those risks within the Board-approved risk appetite of the Group. In addition, understanding, identifying, and owning the risks generated by the Group’s operations are the responsibility of the Divisional Heads and central functions. These functions provide technical support and advice to assist in the management and control of risk. Within this tier, there is a process for transaction review and approval within certain thresholds, discharged by the Credit Approval Committee. Transactions reviewed which exceed the threshold limits set are subject to prior review by Banco Santander, S.A.’s Risk Division before final approval by the Credit Approval Committee. Risk Committee The Risk Committee is a management committee, established under the authority of and chaired by the Chief Executive. The Risk Committee reviews risk issues, gives advice and recommendations to the Chief Executive, the Executive Committee, or other parties as appropriate and makes decisions on risk issues within its sphere of responsibility.

Business and Financial Review – Interim Management Report
Risk Management continued
34
Second tier of risk governance Risk control is provided by the Board independently supported by the Risk Division. The roles of the Chief Risk Officer, the Head of Wholesale Risk, and the Risk Division include development of risk measurement methodologies, risk approval, risk monitoring, risk reporting and escalation of risk issues in line with the relevant risk policy for all risks across all lines of Retail Banking, Corporate Banking, Global Banking & Markets, Private Banking and Group Infrastructure business.
Dedicated Business ROFs advise and support the Chief Risk Officer in fulfilling his risk control responsibilities and help to ensure that risks are suitably understood, managed and controlled.
The Risk Division provides independent challenge to all business areas in respect of risk management and compliance with policies and advises the business when they are approaching the limits of the Group’s risk appetite.
The Board, as supported by the Risk Division, is responsible for ensuring compliance with Group policies and limits imposed by Banco Santander, S.A. including: > Group-wide risk policies; > Group-wide risk limits/parameters; > Approval processes relating to transactions that exceed local risk limits; > The systematic review of large exposures to clients, sectors, geographical areas and different risk types; and > Reporting to Banco Santander, S.A..
Third tier of risk governance Risk assurance provides independent objective assurance on the effectiveness of the management and control of risk across the Group. This is provided through the Non–Executive Directors, the Audit and Risk Committee and the Internal Audit function. Non-Executive Directors The Non-Executive Directors are members of the Board who have a particular responsibility for constructively challenging and contributing to the development of strategy, scrutinising the performance of management in meeting agreed goals and objectives and monitoring reporting performance, and assuring themselves that the financial controls and systems of risk management are robust and defensible. Audit and Risk Committee The Audit and Risk Committee is made up of Non-Executive Directors, and is a committee of the Board. The Committee has responsibility for: > The oversight of the risk governance framework; > Review of the effectiveness of the Group’s internal and external audit processes; > Review of control policies and procedures including regulatory compliance and financial reporting; > The identification, assessment and reporting of risks; and > The risk governance structure and associated compliance with risk control policies and procedures. Internal Audit The Internal Audit function supports the Audit and Risk Committee by providing independent and objective opinions on the effectiveness and integrity of the Group’s risk governance arrangements. It does this via a systematic programme of risk-based audits of the controls established and operated by the “first tier” risk management functions and those exercised by the “second tier” risk control functions.
The audit opinions and underlying rationale of findings and recommendations form the basis upon which the Audit and Risk Committee can take reasonable (but not absolute) assurance that the risk governance arrangements are fit for purpose and working properly. The Audit and Risk Committee also receive reports from management, the risk control functions and the external auditors to help them to discharge their risk governance oversight responsibilities. Financial Risks and Risk Management The financial risks affecting the Group are discussed below. Risks are generally managed through tailored management policies within the business division or operating segment in which they are originated.
Group-wide disclosures including those relating to specific risks which do not originate in any single operating segment, are described separately at the beginning of this section, apart from liquidity risk which is discussed at the end of the section, following the detailed disclosures about the impact of the current credit environment.
The Group-wide disclosures are followed by detailed discussions about risk exposures, measurement information and management policies presented by operating segment, being Retail Banking, Corporate Banking, Global Banking & Markets, Private Banking, and Group Infrastructure (which includes Asset and Liability Management (‘ALM’) and the Alliance & Leicester treasury asset portfolio).

Business and Financial Review – Interim Management Report
Risk Management continued
35
Financial Instruments The Group uses financial instruments to manage the structural balance sheet exposures that arise from its activities, in accordance with Risk policies and the Asset and Liability Management Committee’s direction. The Group also trades in financial instruments where it takes positions in exchange-traded and over the counter instruments, including derivatives, to take advantage of short-term market movements in the equity and bond markets and in currency and interest rates. Operational Risk – Group-wide Operational risk is the risk of loss to the Group resulting from inadequate or failed internal processes, people and systems, or from external events. Such risks can materialise as frauds, process failures, system downtime or damage to assets due to fire, floods etc. When such risks materialise they have not only immediate financial consequences for the Group but also an effect on its business objectives, customer service, regulatory responsibilities and reputation. Operational risk exposures arise across the Group’s business divisions and operating segments, and are managed on a consistent basis. Managing operational risk The Group undertakes extensive activity to minimise the impacts operational risks may have on business areas. An independent central operational risk function (Enterprise and Operational Risk) has responsibility for establishing the framework within which these risks are managed and is aligned to operational risk professionals within business areas to ensure consistent approaches are applied across the Group. The primary purpose of the framework is to define and articulate the Group-wide policy, processes, roles and responsibilities. The framework incorporates industry practice and regulatory requirements.
The day-to-day management of operational risk is the responsibility of business managers who identify, assess and monitor the risks, in line with the processes described in the framework. The operational risk function ensures that all key risks are regularly reported to Risk Fora, the Risk Committee and Board. Key operational risk activity in 2010 During 2010, the Group has continued to respond to the developing operational risk environment with coordinated responses, and the Group continues to perform detailed control reviews in response to major industry events.
Following many high profile customer data security lapses experienced by other organisations in the UK, the Group has continued to take proactive steps to minimise similar risks. A corporate information security programme was established which involved the strengthening of controls for the management of sensitive data and included the implementation of encryption standards across the Group.
The Group continues to strengthen its point of sale compliance and control procedures to minimise risk and serve its customers. To this end, work continues to progress in implementing new systems which are already successfully operating in Banco Santander, S.A.. In 2009, implementations concentrated on integrating Bradford & Bingley savings business and Alliance & Leicester group systems, with further focus on Alliance & Leicester throughout 2010.
Internet frauds continued to reduce during the first half of 2010 due to the implementation of improvements to fraud detection rates and the introduction of a Banco Santander S.A. group transactional model in 2009 which increased the volume of cases that were intercepted. As part of integration activity, these controls were replicated throughout all Santander UK companies.
In line with UK Financial Services Authority guidance and industry practice, the Group has crisis management and disaster recovery arrangements to ensure that critical business processes are maintained in the event of an unforeseen interruption. Insurance policies are also purchased to provide cover for a range of potential operational risk losses. In response to the increased threats of terrorism, flooding, and pandemic disasters, contingency strategies continue to be refined and key progress has included the development of dispersed contingency sites and automated system switch over facilities.
Corporate operational risk frameworks were implemented throughout all Banco Santander S.A. group companies in 2009, integrating approaches across the Bradford & Bingley savings business, Alliance & Leicester and Santander UK. To highlight awareness of Operational Risk issues, appropriate training is available for management and staff involved in control functions throughout the Group. Credit Risk – Group-wide Credit risk is the risk that counterparties will not meet their financial obligations resulting in the Group losing the monies lent, including any interest accrued, or having to close out transactions prematurely, which may incur losses after realising collateral held. Significant concentrations of credit risk During 2010, the Group’s most significant exposures to credit risk derived from: > the residential mortgage portfolio and unsecured personal lending businesses in Retail Banking; > secured lending and derivatives exposures to companies, real estate entities and social housing associations, and as well
as portfolios of assets inconsistent with the Group’s future strategy such as shipping and aviation in Corporate Banking; > unsecured lending and derivatives exposure to banks and other financial institutions in Global Banking & Markets; and > the Alliance & Leicester treasury asset portfolio in Group Infrastructure.

Business and Financial Review – Interim Management Report
Risk Management continued
36
The residential mortgage portfolio comprises loans to private individuals secured against residential properties in the UK. This is a prime portfolio with total exposure of £170.2bn at 30 June 2010 (31 December 2009: £166.7bn). The Unsecured Personal Loan portfolio comprises unsecured loans to private individuals issued in the UK. Total exposure stood at £4.5bn at 30 June 2010 (31 December 2009: £4.9bn). The commercial loan, real estate and social housing portfolios in Corporate Banking comprise loans secured on UK property, corporate loans and associated derivatives. The total committed facilities exposure to these portfolios was £26.4bn at 30 June 2010 (31 December 2009: £25.3bn).
Although Global Banking & Markets’, Corporate Banking’s and Group Infrastructure’s operations are based mainly in the UK, they have built up exposures to various entities around the world and are therefore exposed to concentrations of risk related to geographic area. At 30 June 2010, 2% (31 December 2009: 2%) of Global Banking & Markets’ credit exposures were to counterparties from the United States, and 81% (31 December 2009: 77%) were to counterparties from the UK. 2% (31 December 2009: 2%) of Global Banking & Markets’ exposures were to countries that are not members of the Organisation for Economic Co-operation and Development (‘OECD’). The remaining exposures were mainly to European counterparties. At 30 June 2010, 87% (31 December 2009: 87%) of Corporate Banking’s credit exposures were to counterparties from the UK, 2% (31 December 2009: 2%) were to counterparties from the United States, and 11% (31 December 2009: 11%) were to counterparties from other countries. Group Infrastructure’s exposures result from its asset portfolios, including the Alliance & Leicester treasury asset portfolio. At 30 June 2010, the Alliance & Leicester treasury asset portfolio stood at £5.7bn (31 December 2009: £9.9bn). Details of credit ratings and geographic analysis can be found on pages 56 to 65.
Geographical exposures are governed by country limits set by Banco Santander, S.A. centrally and determined according to the classification of the country (whether it is a developed OECD country or not), the rating of the country and its gross domestic product. The Group is further constrained in its country risk exposure, within the group limits, and by its capital base. Maximum exposure to credit risk The following table presents the amount that best represents the Group’s estimated maximum exposure to credit risk at the reporting date without taking account of any collateral held or other credit enhancements:
30 June 2010 £m
31 December 2009 £m
Trading assets 19,567 21,688 Purchase and resale agreements 4,425 14,685 Derivative financial instruments 27,897 22,827 Financial assets designated at fair value 6,878 12,358 Available-for-sale securities 806 797 Loan and receivable securities 5,718 9,898 Loans and advances to customers 189,678 186,804 Loans and advances to banks 4,871 6,069 Other 7,728 4,334 Third party exposures(1) (2) 267,568 279,460 (1) In addition, the Group is exposed to credit risk in respect of guarantees granted, loan commitments and stock borrowing and lending agreements. The estimated
maximum exposure to credit risk is described in Note 37 to the 2009 Consolidated Financial Statements on page 157 of the 2009 Annual Report. (2) Excludes loans to other members of the Banco Santander, S.A. group. In managing the gross exposures, the Group uses the policies and processes described in the Credit Risk sections below. Collateral, when received, can be held in the form of security over the mortgaged property, full debentures over a company’s assets and through market standard collateral agreements. Loans and advances An analysis of the Group’s loans and advances in three categories: neither past due nor impaired, past due but not individually impaired, or individually impaired is set out on pages 54 to 56 in the 2009 Annual Report. There have been no significant changes in the first half of 2010. Analysis of provisions on loans and advances to customers An analysis of the Group’s provisions on loans and advances to customers is presented below.
30 June 2010
£m 31 December 2009
£m Observed provisions Advances secured on residential properties - UK 410 313 Corporate advances - UK 237 185 Finance leases - UK 1 1 Other secured advances - UK 63 50 Unsecured personal advances - UK 323 341 Total observed provisions 1,034 890 Incurred but not yet observed provisions Advances secured on residential properties - UK 181 171 Corporate advances - UK 133 172 Finance leases - UK 1 1 Other secured advances - UK 13 12 Unsecured personal advances - UK 90 53 Total incurred but not yet observed provisions 418 409 Total provisions 1,452 1,299

Business and Financial Review – Interim Management Report
Risk Management continued
37
Movements in provisions for impairment losses on loans and advances An analysis of movements in the Group’s provisions for impairment losses on loans and advances is presented below.
Six months ended 30 June 2010
£m
12 months ended 31 December 2009
£m
Provisions at 1 January 1,299 1,001 Amounts written off Advances secured on residential properties – UK (7) (84) Corporate loans – UK (17) - Finance leases – UK (2) (4) Other secured advances – UK (8) (17) Unsecured personal advances – UK (204) (425) Total amounts written off (238) (530) Observed provisions charged against profit Advances secured on residential properties – UK 104 223 Corporate advances – UK 69 172 Finance leases – UK 2 5 Other secured advances – UK 21 30 Unsecured personal advances – UK 186 539 Total observed provisions charged against profit 382 969 Incurred but not yet observed provisions charged against profit 9 (141) Total provisions charged against profit 391 828 Provisions at the end of the period 1,452 1,299
Group recoveries An analysis of the Group’s recoveries is presented below.
Six months ended 30 June 2010
£m
12 months ended 31 December 2009
£m
Advances secured on residential properties - UK - 1 Corporate advances - UK 1 23 Finance leases - UK - 1 Unsecured personal advances - UK 3 30 Total amount recovered 4 55
Group non-performing loans and advances (1)
30 June 2010
£m
31 December 2009
£m Group non-performing loans and advances that are impaired 1,714 1,833 Group non-performing loans and advances that are not impaired 2,079 1,780 Total non-performing loans and advances(2) 3,793 3,613 % % Non-performing loans and advances as a % of loans and advances to customers(3) 1.93 1.86 Provision as a percentage of total non-performing loans and advances 38.28 35.95 (1) Loans and advances are classified as non-performing typically when the counterparty fails to make payments when contractually due for three months or longer. (2) All non-performing loans are UK and continue accruing interest. (3) Loans and advances to customers include social housing loans and finance leases, and exclude trading assets.
Group restructured loans Loans have been restructured or renegotiated by capitalising the arrears where customers in arrears have maintained an agreed monthly repayment for a specified period. For further information, refer to the discussions of restructured loans in the Retail Banking and Corporate Banking sections. Basel II Throughout 2009 and the six months ended 30 June 2010, the Group applied the retail internal ratings-based (IRB) approach for credit risk to its key retail portfolios. For the residential mortgage portfolio, the IRB approach employed addresses the effects of procyclicality evident in the estimates for probability of default (PD).
A combination of the advanced and foundation internal ratings-based approaches was employed for the principal wholesale and corporate portfolios. For the remaining credit exposures, currently on the Basel II standardised approach, a rolling programme of transition to the appropriate IRB approach is underway. The standardised approach for Operational Risk continued to be applied during the six months ended 30 June 2010.

Business and Financial Review – Interim Management Report
Risk Management continued
38
The Group applied Basel II to its Internal Capital Adequacy Assessment Process (ICAAP) and to the risk and capital disclosures made to the market. The Group has applied Banco Santander S.A.’s approach to risk management in its application of Basel II. Further information on the Group’s capital position under Basel II is included in Note 29 to the condensed consolidated interim financial statements. Further information on the Basel II risk measurement of the Group’s exposures was included in Banco Santander S.A.’s 2009 Pillar 3 report. The Group’s Pillar 3 disclosures are set out in the Balance Sheet Business Review on pages 25 to 27. Market risk – Group-wide Market risk is the potential for loss of income or decrease in the value of net assets caused by movements in the levels and prices of financial instruments including interest rate and foreign currency risks. The Group accepts that market risk arises from its full range of activities. The Group aims to actively manage and control market risk by limiting the adverse impact of market movements whilst seeking to enhance earnings within clearly defined parameters. The Market Risk Manual, which is reviewed and approved by the Head of Wholesale Risk on an annual basis, sets the framework under which market risks are managed and controlled. Business area policies, risk limits and mandates are established within the context of the Market Risk Manual.
Executive directors are responsible for ensuring that they have sufficient expertise to manage the risks originated and retained within their business divisions. The business areas are responsible for ensuring that they have sufficient expertise to manage the risks associated with their operations. The independent Risk function, under the direction of the Head of Wholesale Risk, aims to ensure that risk-taking and risk control occur within the framework prescribed by the Market Risk Manual. The Risk function also provides oversight of all risk-taking activities through a process of reviews.
The Group aims to ensure that exposure to market risks is measured and reported on an accurate and timely basis to senior management. In addition to the regular reporting for the purposes of active risk management, the Board also receives reporting of all significant market risk exposures on a monthly basis where actual exposure levels are measured against limits. Senior management recognise that different risk measures are required to best reflect the risks faced in different types of business activities. In measuring exposure to market risk, the Group uses a range of complementary measures, covering both value and income as appropriate. Pension obligation risk – Group-wide The Group has statutory funding obligations as the sponsoring employer for a number of defined benefit staff pension schemes. The schemes are managed by independent trustees in accordance with legislation and trust deeds and rules, for the benefit of members. The Group accepts that it is exposed to pension obligation risk that could give rise to an unexpected increase in the Group’s obligations to fund the schemes, either because of a loss of net asset value or because of changes in legislation or regulatory action. The principal risks to the net asset value of the schemes are an increase in the value of the liabilities arising from adverse changes in the longevity assumptions, increases in inflation or reductions in the discount rate used, and scheme assets being adversely affected by market movements. Further information on pensions can be found in Note 21 to the condensed consolidated interim financial statements. Risk management The Chief Financial Officer is responsible for managing the Group’s exposure to pension obligation risk, in conjunction with the trustees. Further details of the funding arrangements for the pension schemes can be found in Note 21 to the condensed consolidated interim financial statements. Liquidity risk – Group wide Liquidity risk is the potential that the Group has insufficient financial resources to meet its payment and collateral obligations (to the extent that they will be settled by delivering cash or another financial asset) as they fall due, or can do so only at excessive cost. Liquidity risks arise throughout the Group. Its primary business activity is commercial banking and, as such, it engages in maturity transformation, whereby callable and short-term commercial deposits are invested in longer-term customer loans.
Liquidity risk is managed under a comprehensive and prudent liquidity risk management framework. The primary objective of the framework is to ensure that Santander UK is liquidity risk resilient by holding sufficient financial resources to withstand regulatory and internal stresses.
Primary sources of funding include:
> Customer deposits; > Secured and unsecured money-market funding (including unsecured cash, repo, CD and CP issuance); > Senior debt issuance (including discrete bond issues and MTNs); > Mortgage-backed funding (including securitisation and covered bond issuance); and > Subordinated debt and capital issuance (although the primary purpose is not funding). For accounting purposes, wholesale funding is classified as deposits by banks, debt securities in issue, other borrowed funds and subordinated liabilities.

Business and Financial Review – Interim Management Report
Risk Management continued
39
After an improvement in market conditions at the start of the year, funding and liquidity conditions remained volatile through the rest of the first half of 2010 whilst allowing windows of opportunities for issuance. From the Group’s perspective, short-term unsecured money-market funding has been continuously available and investor demand for unsecured and mortgage-backed issuance was present in the windows of opportunities as demonstrated by Santander UK's total medium-term issuance of approximately £10.2bn in the first half of the 2010. These markets have traditionally been and continue to be important sources of funding.
The Group continued to benefit both from the conservative proportion of retail assets that are funded in wholesale markets, as well as having entered the period of market stress in a strong liquidity position. All internal and external liquidity ratios were maintained during this period.
The key ongoing liquidity risks are:
> Loss of customer deposits; > Loss of access to secured and unsecured wholesale funding markets (including foreign exchange swaps) or
counterparties; > Intra-day payments systems dislocation; and > Contingent liabilities arising from mortgage-backed or other funding, such as collateral calls or early amortisation. Funding and liquidity risk management The Board is responsible for the liquidity risk management and control framework and defines the liquidity risk appetite. Funding and liquidity risk management are the responsibility of the Chief Financial Officer who delegates day-to-day responsibility to the Treasurer, Head of ALM. The Group has a centralised funding and liquidity risk management approach whereby all liquidity/funding is managed centrally by the Treasurer, Head of ALM, under the direction of the Asset & Liability Management Committee and within the framework of the Liquidity Risk Manual. In addition to daily reporting of business level and consolidated liquidity risk information to senior management, the Asset and Liability Management Committee and the Risk Committee monitor the Group’s funding and liquidity position on a monthly basis. The Board also receives a monthly update on key liquidity metrics.
The Group views the essential elements of funding and liquidity risk management as controlling potential cash outflows, maintaining prudent levels of highly liquid assets and ensuring that access to funding is available from a diversity of sources. A management and monitoring process, and a series of liquidity limits, triggers and other metrics within which liquidity is managed, underpin these elements. The Board targets a funding strategy that avoids excessive reliance on wholesale funding and attracts enduring commercial deposits by understanding the liquidity persistence of customer deposits under different scenarios, appropriately reflecting product features and types of customers. The funding strategy aims to provide effective diversification in the sources and tenor of funding as well as establishing the capacity to raise additional unplanned funding from those sources quickly. An excessive concentration in either liquid assets or contractual liabilities also contributes to potential liquidity risk, and so limits have been defined under the Liquidity Risk Appetite. Management also monitors the Group’s compliance with limits set by the UK Financial Services Authority. In addition to such limits, liquidity ratios have trigger-review levels that require the Treasurer, Head of ALM and Head of Wholesale Risk to initiate appropriate reviews of current exposure when such levels are exceeded.
In line with the policy of Banco Santander, S.A., the Group manages its funding and maintains adequate liquidity on a stand-alone basis. Nevertheless, the Group co-ordinates issuance plans with Banco Santander, S.A., where appropriate. While the Group’s liquidity risk is consolidated and centrally controlled, liquidity risk is also measured, monitored and controlled within the specific business area or the subsidiary where it arises.
The Group holds, at all times, an unencumbered liquid asset buffer to mitigate liquidity risk. The size and composition of this buffer is determined both by internal stress tests as well as the appropriate UK Financial Services Authority liquidity regime; a surplus is maintained in both cases. Since 31 December 2009, the Group has increased its holding of Individual Liquidity Adequacy Standards (ILAS) eligible assets (as defined within the UK Financial Services Authority liquidity regime) (‘core liquid assets’), held exclusively for liquidity purposes to £31bn. The table below shows the liquid assets held by the Group: 30 June 2010 £bn Cash at central banks 22 Government bonds 9 Core liquid assets 31 High quality bonds 6 Others liquid assets(1) 15 Total liquid assets 52 (1) Includes own issuances eligible for discounting at central banks. During the six months ended 30 June 2010 and the year ended 31 December 2009, the Group benefited both from the conservative proportion of retail assets that are funded in wholesale markets, as well as having entered the period of market stress in a strong liquidity position. All internal and external liquidity ratios were maintained during this period.
The key element of the Group’s liquidity risk management is focused on holding sufficient liquidity to withstand a series of stress tests. Within the framework of prudent funding and liquidity management, Santander UK manages its activities to minimise liquidity risk, differentiating between short-term and strategic activities.

Business and Financial Review – Interim Management Report
Risk Management continued
40
Short-term, tactical liquidity management: > Liquid assets – a buffer of liquid assets is held to cover unexpected demands on cash in extreme but plausible stress
scenarios. In the Group’s case, the largest stress events include large and unexpected deposit withdrawals by retail customers and a loss of unsecured wholesale funding.
> Intra-day collateral management – to ensure that adequate collateral is available to support payments in each payment or settlement system in which the Group participates, as they fall due.
Strategic funding and liquidity management: > Structural balance sheet shape – to manage the extent of maturity transformation (investment of shorter term
funding in longer term assets), the funding of non-marketable assets with wholesale funding and the extent to which non-marketable assets can be used to generate liquidity.
> Wholesale funding strategy – to avoid over-reliance on any individual counterparty, currency, market or product, or group of counterparties, currencies, markets or products that may become highly correlated in a stress scenario; and to avoid excessive concentrations in the maturity of wholesale funding.
> Wholesale funding capacity – to maintain and promote counterparty relationships, monitor line availability and ensure funding capacity is maintained through ongoing use of lines and markets.
Collateral calls on derivatives positions can pose a significant liquidity risk. Collateral calls may arise at times of market stress and when asset liquidity may be tightening. The timing of the cash flows on a derivative hedging an asset may be different to the timing of the cash flows of the asset being hedged, even if they are similar in all other respects. Collateral calls may be triggered by a credit downgrading. The Group manages these risks by including collateral calls in stress tests on liquidity, and by maintaining a portfolio of assets held for managing liquidity risk.
Risk limits and triggers are set for the key tactical and strategic liquidity risk drivers. These are monitored by the Treasurer, Head of ALM and Risk Division and reported monthly to the Asset & Liability Management Committee, Risk Committee and the Board. Maturities of financial liabilities A maturity analysis of the Group’s financial liabilities is set out in the 2009 Annual Report. There have been no significant changes in the first half of 2010.
Risk Management in Retail Banking Credit risk in Retail Banking Credit risk is the risk that counterparties will not meet their financial obligations, which may result in Retail Banking losing the principal amount lent, the interest accrued and any unrealised gains (less any security held). Credit risk occurs mainly in Retail Banking’s loan and investment assets (including residential mortgages and secured lending, personal and business banking). Retail Banking actively manages and controls credit risk. Managing credit risk The Group is principally a retail prime lender and has no appetite or product offering for any type of sub-prime business. The Group’s credit policy explicitly prohibits such lending and is specifically designed to ensure that any business written is responsible, affordable (both initially and an on-going basis) and of a good credit quality.
The Board has approved a set of risk appetite limits to cover credit risk arising in Retail Banking. Within these limits, credit mandates and policies are approved with respect to products sold by the Group. Residential mortgages and secured lending Retail Banking lends on many types of property but only after a credit risk assessment of the borrower, including affordability modelling and an assessment of the property, is undertaken. The quality of the mortgage assets are monitored to ensure that they are within agreed portfolio limits. Residential lending is subject to lending policy and lending authority levels, which are used to structure lending decisions to the same standard across the retail network, a process further improved by mortgage credit scoring, underwriter accreditation and regular compliance reviews. Details concerning the prospective borrower and the mortgage are subject to a criteria-based decision-making process. Criteria for assessment include credit references, loan-to-value ratio, borrower status and the mortgage credit score.
All mortgages provided by Retail Banking are secured on UK properties. All properties must be permanent in construction; mobile homes are not generally acceptable. The Group can provide a loan for the purchase of properties outside the UK where the property is a second home and the loan is secured on the main property located in the UK.
Prior to granting any first mortgage loan on a property, the Group has the property valued by an approved and qualified surveyor. The valuation is based on Group guidelines, which build upon the Royal Institution of Chartered Surveyors guidance on valuation methods. In the case of re-mortgages, where the loan-to-value (‘LTV’) is 75% or lower, and the risk judged by the size of the advance requested and the credit score of the applicant is considered medium or low, and an accurate, reputable automated valuation is available, this may substitute for a surveyor’s valuation.

Business and Financial Review – Interim Management Report
Risk Management continued
41
For existing mortgages, the current values of the properties on which individual mortgages are secured are estimated quarterly. For each individual property, details such as address, type of property and number of bedrooms are supplied to an independent agency that estimates current property valuations using information from recent property transactions and valuations. All additional loans require an automated valuation or surveyor’s valuation. The use of an automated valuation depends upon the availability of a reliable automated valuation, and the level of credit risk posed by the proposed loan. Higher risk loans The Group is principally a retail prime lender and does not originate second charge mortgages. A £37m portfolio of second charge mortgages was acquired as a result of the transfer of Alliance & Leicester plc to the Company as described in Note 47 to the 2009 Annual Report. This portfolio is in run-down.
Certain mortgage products may be considered higher risk. Operating as a prime lender in the UK mortgage market, the Group does not have any material sub-portfolio demonstrating very poor performance. The portfolio’s arrears performance has remained relatively stable and favourable to industry benchmarks. Arrears rates and loss rates remain very low. Nonetheless, there are some mortgage types that present higher risks than others. These products consist of:
Interest-only loans – Interest-only mortgages require monthly interest payments and the repayment of principal at maturity. This can be arranged via investment products including Individual Savings Accounts and pension policies, or by the sale of the property. It is the customer’s responsibility to ensure that they have sufficient funds to repay the principal in full at maturity.
Interest-only mortgages are well-established and common in the UK market. Lending policies to mitigate the risks inferred by this repayment structure are in place and mature. While the risks are higher than capital repayment mortgages, they are only modestly so. The performance of this significant sub-portfolio has been quite acceptable and stable.
Flexible loans – Flexible mortgages allow the customers to vary their monthly payment, or take payment holidays, within predetermined criteria and/or up to an agreed credit limit. Customers are also permitted to draw down additional funds at any time up to the limit or redraw amounts that have been previously overpaid. Loans with original LTV >100% – Progressively stricter lending criteria are applied to mortgages above a loan-to-value of 75%. Historically, in limited circumstances, customers were able to borrow more than 100% of the value of the property against which the loan was secured, within certain limits. However, no loans have been made with a loan-to-value of more than 100% since 2008. In the first half of 2010, less than 0.01% (209: less than 0.1%) of new secured loan advances were made with a loan-to-value of more than 90%.
Loans with higher loan-to-value ratios carry a higher risk due to the increased likelihood that liquidation of the collateral will not yield sufficient funds to cover the loan advanced, arrears and the costs of liquidation. These loans generally attract higher margins as a result. Sub-prime lending – The Group has no appetite or product offering for sub-prime business. The Group’s credit policy explicitly prohibits such lending and is designed to ensure that any business written is responsible, affordable (both initially and an on-going basis) and of a good credit quality. Mortgage credit quality and credit risk mitigation(1)
30 June 2010 31 December 2009 Loan-to-value analysis: New business < 75% 79% 83% 75% - 90% 21% 17% > 90% - - 100% 100% Average loan-to-value of new business (at inception) 62% 61% Stock < 75% 65% 61% 75% - 90% 22% 22% 90% - 100% 8% 10% >100% i.e. negative equity 5% 7% 100% 100% Average loan-to-value of stock (indexed) 51% 52% Borrower profile: New business First-time buyers 19% 17% Home movers 44% 37% Remortgagers 37% 46% 100% 100% Of which:(2) - Interest-only loans 35% 36% - Flexi loans 22% 9% - Loans with original LTV >100% - -
(1) Excludes any fees added to the loan, and only includes the drawn loan amount, not drawdown limits. (2) Where a loan exhibits more than one of the “higher risk” criteria, it is included in all the applicable categories.

Business and Financial Review – Interim Management Report
Risk Management continued
42
Mortgage credit quality and credit risk mitigation(1) (cont.d)
30 June 2010 31 December 2009 Borrower profile: Stock First-time buyers 17% 17% Home movers 39% 38% Remortgagers 44% 45% 100% 100% Of which: (2) - Interest-only loans 42% 43% - Flexi loans 18% 18% - Loans with original LTV >100% - -
(1) Excludes any fees added to the loan, and only includes the drawn loan amount, not drawdown limits. (2) Where a loan exhibits more than one of the “higher risk” criteria, it is included in all the applicable categories.
Loan-to-value analysis During the first half of 2010, LTV on new business completions declined during the first quarter (Q4 09: 64%, Q1 10: 61%), but started to rise in the second quarter to 62%, due to targeted policy relaxation and competitive pricing at higher LTV. The indexed stock LTV decreased to 51% from 2009 (Q2 09: 53%, Q4 09: 52%) principally due to the effects of house price increases in the first half of the year. Monthly mortgage completions in excess of 75% LTV increased from 20% in H2 2009 to 21% in the first half of 2010.
At 30 June 2010, 5% (2009: 7%) of the retail mortgage portfolio was over 100% LTV. The decrease was due to the general increase in property prices during the period, low LTV profile of new business and increased control of the retention process. Borrower profile During the first half of 2010, the proportion of new business from remortgages continued to decrease. This trend was seen across the UK market as low interest rates and strict lending criteria continued to reduce the incentives for customers to remortgage to another lender. Average earnings multiple (at inception) Six months ended 30 June
2010 2009 Average earnings multiple (at inception) 2.9 2.7
During the first half of 2010, the average earnings multiple (at inception) increased as compared to the same period in 2009 due a higher proportion of lending to first-time buyers which generally have higher earnings multiples. Mortgage arrears and repossessions The Collections & Recoveries Department is responsible for all debt management initiatives on the secured portfolio for Retail Banking. Debt management strategies, which include negotiating repayment arrangements and concessions and debt counselling, can start as early as the day after a repayment is past due and will continue until legal action. Different collection strategies are applied to different segments of the portfolio subject to the perceived levels of risk for example, loan-to-value, collections score and account characteristics.
If the agreed repayment arrangement is not maintained, legal proceedings may be taken and may result in the property being taken into possession. The Group sells the repossessed property at market price and uses the sale proceeds, net of costs, to pay off the outstanding value of the mortgage. The stock of repossessed properties held by the Group varies according to the number of new possessions and the buoyancy of the housing market.
A programme of forbearance designed to enable borrowers experiencing short to medium-term repayment difficulties to remain in their home has been in place since 2009. On average, each month less than 1% of accounts in arrears either have their term extended or convert to interest only. Levels of adherence to revised payment terms are currently high at approximately 60% (2009: 70%). The level of adherence deteriorated during the first half of 2010 due to the higher proportion of restructured loans that are already in arrears at the point of restructure.

Business and Financial Review – Interim Management Report
Risk Management continued
43
The following tables set forth information on UK residential mortgage arrears at 30 June 2010 and 31 December 2009 for Retail Banking compared to the industry average as provided by the Council of Mortgage Lenders (‘CML’). Group(1) CML(2)
Higher risk loans(3)
Mortgage arrears Interest-only
loans Flexible
loans Loans with original
LTV > 100%
Remaining loan
portfolio Total(3) (Percentage of total mortgage loans by number)
31 to 60 days in arrears: 31 December 2009 0.45 0.07 0.01 0.51 1.00 -
30 June 2010 0.43 0.06 - 0.52 0.99 - 61 to 90 days in arrears: 31 December 2009 0.27 0.04 - 0.29 0.58 -
30 June 2010 0.26 0.03 - 0.28 0.56 - 3 to 5 months in arrears: 31 December 2009 0.41 0.05 0.01 0.36 0.80 0.97 30 June 2010 0.40 0.05 - 0.37 0.80 0.88
6 to 11 months in arrears: 31 December 2009 0.22 0.04 - 0.16 0.40 0.81
30 June 2010 0.23 0.03 - 0.17 0.41 0.72 12 months or more in arrears: 31 December 2009 0.09 0.03 - 0.07 0.17 0.60
30 June 2010 0.11 0.03 - 0.08 0.21 0.57 (1) Group data is not readily available for arrears less than 31 days. (2) Council of Mortgage Lenders data is not available for arrears less than 3 months. (3) Where a loan exhibits more than one of the “higher risk” criteria, it is included in all the applicable categories. As a result, the total of the mortgage arrears for
“higher risk” loans and remaining loan portfolio will not agree to the total mortgage arrears percentages.
The following tables set forth information on UK properties in possession at 30 June 2010 and 31 December 2009 for Retail Banking compared to the industry average as provided by the Council of Mortgage Lenders, as well as the carrying amount of assets obtained as collateral. Group CML Properties in possession (Percentage of total mortgage loans by number) 31 December 2009 0.05 0.14 30 June 2010 0.06 0.12
Group Carrying amount of assets obtained as collateral £m 31 December 2009 110 30 June 2010 133 The table below analyses residential mortgages that have been restructured or renegotiated by capitalising the arrears where customers in arrears have maintained an agreed monthly repayment for an agreed period.
30 June
2010 30 June
2010 31 December
2009 31 December
2009 £m % £m %
Mortgages restructured during the period (1, 2) 230 100 325 100 Of which(3): - Interest only loans 101 44 157 48 - Flexi loans 8 3 15 5 - Loans with original LTV >100% - - 1 - (1) All mortgages originated by the Group are first charge. (2) Mortgages are included within the year that they were restructured. (3) Where a loan exhibits more than one of the “higher risk” criteria, it is included in all the applicable categories.
Banking and Consumer Credit. Retail Banking uses systems and processes to manage the risks involved in providing unsecured personal loans and overdraft lending or in granting bank account facilities. These include the use of application and behavioural scoring systems to assist in the granting of credit facilities as well as regular monitoring of scorecard performance and the quality of the unsecured lending portfolios. Behavioural scoring examines the lending relationships that a customer has with Retail Banking and how the customer uses their bank account. This information generates a score that is used to assist in deciding the level of risk (in terms of overdraft facility amount, card facilities granted and preferred unsecured personal loan value) for each customer that Retail Banking is willing to accept. Individual customer scores are normally updated on a monthly basis. Retail Banking has successfully extended the use of behavioural scoring into other areas of the business, including the refinement of debt management strategies and bank account transaction processing.

Business and Financial Review – Interim Management Report
Risk Management continued
44
Banking and unsecured personal loan arrears
30 June 2010 £m
31 December 2009 £m
Total banking and unsecured personal loan arrears(1,2) 239 257 Total banking and unsecured personal loan asset 4,455 4,830 Banking and unsecured personal loan arrears as a % of asset 5.37% 5.31%
(1) Banking arrears is defined as customers that had been in arrears for greater than 90 days. (2) Unsecured personal loan and credit card arrears are defined as the balances of accounts that are three or more months in arrears (> 4 instalments).
Provisions on loans and advances to customers The charge for provisions on loans and advances to customers adjusts the balance sheet provisions to the level that management deems adequate to absorb actual and inherent losses in Retail Banking’s loan portfolio from homogeneous portfolios of assets and individually identified loans. A proportion of Retail Banking’s provisions on loans and advances to customers relate to loans and advances secured either by a first charge on residential property in the UK, or by other appropriate security depending on the nature of the loan.
The Group’s provisioning policy is as follows. Further information is set out in the Accounting Policies in the 2009 Consolidated Financial Statements:
> Observed provision - an observed provision is established for all past due loans after a specified period of repayment
default where it is likely that some of the capital will not be repaid or recovered through enforcement of any applicable security. The length of the default period depends on the nature of the advance and is generally no more than three months. Once a loan misses a payment (breach of contractual terms) an assessment of the likelihood of collecting the principal and overdue payments is made. This assessment is generally made using statistical techniques developed on previous experience and on projections of current market conditions to the time the loss is expected to crystallise. These techniques estimate the propensity of loans to go to write-off and, as a separate exercise, the loss incurred on written off debt is monitored. For advances secured on residential property, the propensity of loans to reach repossession is determined with repossessed properties assessed on an individual basis through the use of an external valuation, anticipated disposal costs and the current exposure.
> Incurred but not yet observed provision - an incurred but not yet observed provision is made against loans which have not missed a payment but are known from past experience to have deteriorated since the initial decision to lend was made. Based on historical evidence, the number of accounts likely to default in the future as a result of events present at the balance sheet date are identified through use of statistical techniques. Further detailed examination is performed on the losses that emerge over a defined period of time after the reporting date called the emergence period. This period is determined to ensure that only those accounts which have credit deterioration at the reporting date are captured and excludes accounts which will suffer credit deterioration after the reporting period. The emergence period is two to three months for unsecured lending and 12 months for secured lending. The provision methodology outlined for observed provisions is then applied to accounts identified as impaired in the performing portfolios.
> Amounts written off - unsecured loans are written off when all internal avenues of collecting the debt have failed and the debt is passed onto external collection agencies. On secured loans, the write-off takes place on ultimate realisation of collateral value, or from claiming on any mortgage indemnity guarantee or other insurance. All write-offs are on a case by case basis, taking account of the exposure at the date of write-off, after accounting for the value from any collateral or insurance held against the loan. The write-off policy is regularly reviewed.
Security is realised in accordance with the Group’s internal debt management programme. Contact is made with customers with the aim to achieve a realistic and sustainable repayment arrangement. Litigation and/or enforcement of security is usually carried out only when the steps described above have been undertaken without success. As a result of the write-off policy, the provisions will be made significantly in advance of the related write-off on all products. The exception to this rule is the discovery of fraud, where the exposure is written off once full investigations have been completed and the probability of recovery is minimal. The time span between the discovery and write-off will be short and may not result in a provision being raised.

Business and Financial Review – Interim Management Report
Risk Management continued
45
Retail Banking analysis of provisions on loans and advances to customers An analysis of the Retail Banking provisions on loans and advances to customers is presented below.
30 June 2010
£m 31 December 2009
£m Observed provisions Advances secured on residential properties - UK 410 313 Finance leases - UK - - Other secured advances - UK 63 50 Unsecured personal advances - UK 323 341 Total observed provisions 796 704 Incurred but not yet observed provisions Advances secured on residential properties - UK 181 171 Other secured advances - UK 13 12 Unsecured personal advances - UK 90 53 Total incurred but not yet observed provisions 284 236 Total provisions 1,080 940
Retail Banking movements in provisions for impairment losses on loans and advances An analysis of movements in the Retail Banking provisions for impairment losses on loans and advances is presented below.
Six months ended 30 June 2010
£m
12 months ended 31 December 2009
£m
Provisions at 1 January 940 698 Amounts written off Advances secured on residential properties – UK (7) (84) Other secured advances - UK (8) (17) Unsecured personal advances - UK (204) (399) Total amounts written off (219) (500) Observed provisions charged against profit Advances secured on residential properties – UK 104 223 Other secured advances – UK 21 30 Unsecured personal advances – UK 186 513 Total observed provisions charged against profit 311 766 Incurred but not yet observed provisions charged against/(released into) profit 48 (24) Total provisions charged against profit 359 742 Provisions at the end of the period 1,080 940
Retail Banking recoveries An analysis of the Retail Banking recoveries is presented below.
Six months ended
30 June 2010 £m
12 months ended 31 December 2009
£m
Advances secured on residential properties - UK - 1 Unsecured personal advances - UK 3 30 Total amount recovered 3 31
Retail Banking non-performing loans and advances (1)
30 June 2010 £m
31 December 2009 £m
Retail Banking non-performing loans and advances that are impaired(2)
1,217 1,343 Retail Banking non-performing loans and advances that are not impaired 1,771 1,561 Total non-performing loans and advances(3) 2,988 2,904 % % Non-performing loans and advances as a % of loans and advances to customers 1.69 1.67 Provision as a percentage of total non-performing loans and advances 36.14 32.37
(1) Loans and advances are classified as non-performing typically when the counterparty fails to make payments when contractually due for three months or longer (2) Non-performing loans against which a provision for impairment losses has been established. (3) All non-performing loans are UK and continue accruing interest

Business and Financial Review – Interim Management Report
Risk Management continued
46
Retail Banking non-performing loans and advances by higher risk loan type(1)
30 June 2010 £m
31 December 2009 £m
Total non-performing loans and advances 2,988 2,904 Of which: - Interest only loans 1,703 1,665 - Flexi loans 241 251 - Loans with original LTV > 100% 24 25
(1) Where a loan exhibits more than one of the “higher risk” criteria, it is included in all the applicable categories. During the first half of 2010, non-performing loans and advances as a percentage of loans and advances increased from 1.67% to 1.69%. This was predominantly driven by higher arrears levels on bank accounts. The level of non-performing mortgage loans remained stable during the first half of 2010.
In 2009, non-performing loans and advances as a percentage of loans and advances to customers increased from 1.19% to 1.67%. This primarily reflected the impact of the continued market deterioration on the performance of the residential mortgage portfolio. This also further increased the proportion of non-performing loans secured against residential property in the non-performing loan balance which, in turn, further reduced the overall provision coverage as the distribution shifted towards mortgages that required a lower level of coverage due to inherent securities held against the non-performing loans.
Interest income recognised on impaired loans amounted to £65m in the first half of 2010 (2009: £49m). Retail Banking restructured loans Loans have been restructured or renegotiated by capitalising the arrears where customers in arrears have maintained an agreed monthly repayment for a specified period. The value of capitalised arrears on these loans during the first half of 2010 was £6m (2009: £3m).
The table below shows the Group’s loans not included in non-performing loans that have been restructured or renegotiated by capitalising the arrears.
30 June 2010
£m 31 December 2009
£m Restructured loans 315 377
Santander Business Banking Santander Business Banking provides a range of products to assist with the finance requirements of small businesses, including overdrafts and loans. Risk management policies are specific to and reflect the risks inherent in each product set. Approval processes for credit risk include the use of judgement, assisted by the use of probability of default and loss given default data, and the use of credit scoring. Business Banking operates within policies and authority levels approved by the Chief Risk Officer. Business Banking has a dedicated risk team, reflecting the desire for risk control to be close to the business needs and risks. Business Banking provides mortgages to borrowers on a range of mainly non-residential property. Agreed credit assessment criteria include serviceability ratios, loan-to-value ratios, and quality of tenants, with stress testing against interest rate movements. Concentration limits per borrower and business sector are also employed to ensure a balanced loan portfolio. The management of defaulting accounts and the repossession and sale of properties is handled by a dedicated function within the risk operation.
The strategic plan to extend the customer proposition into the SME market is being supported by a workstream which aims to manage all risks within this market and throughout the risk cycle. The development of the risk framework is overseen by the Chief Risk Officer. Market risk in Retail Banking Market risks are originated in Retail Banking only as a by-product of writing customer business and are transferred out of Retail Banking insofar as possible. Only prepayment and launch risk exposures are retained within Retail Banking, as these behavioural risks are influenced by internal marketing and pricing activity and are managed by Asset Business and Customer Funds Committees. Other market risks are transferred to the Asset and Liability Management (‘ALM’) operation within Group Infrastructure, where they can be managed in conjunction with exposures arising from the funding, liquidity or capital management activities of ALM. Funds received with respect to deposits taken are lent on to Group Infrastructure on matching terms as regards interest rate re-pricing and maturity. Similarly, loans are funded through matching borrowings from Group Infrastructure. Market risks arising from structured products, including exposure to changes in the levels of equity markets, are hedged within Global Banking & Markets.

Business and Financial Review – Interim Management Report
Risk Management continued
47
Risk Management in Corporate Banking Credit risk in Corporate Banking Credit risk is the risk that counterparties will not meet their financial obligations resulting in Corporate Banking losing the monies lent, including any interest accrued, or having to close out transactions prematurely, which may result in losses even after realising the value of any collateral held. Credit risk arises by Corporate Banking making loans, investing in other financial instruments or entering into financing transactions or derivative contracts. Corporate Banking actively manages and controls credit risk. Managing credit risk The Board has approved a set of risk appetite limits to cover different types of risk, including credit risk, arising in Corporate Banking. The Group’s credit risk appetite is measured and controlled by a maximum economic capital value, which is defined as the maximum level of unexpected loss that the Group is willing to sustain over a one-year period. Within these limits, credit mandates and policies are approved to cover detailed industry, sector and product limits. All transactions falling within these mandates and policies are accommodated under credit limits approved by the appropriate credit authority. Specific approval is usually required by the Credit Approval Committee (a specific committee established under the authority of the Chief Executive) for any transaction that falls outside the mandates.
Analyses of credit exposures and credit risk trends are provided each month to the Corporate and Commercial Banking Risk Oversight Forum, with key issues escalated to the Risk Committee as required. Large Exposures (as defined by the UK Financial Services Authority) are reported quarterly to the Risk Committee and the UK Financial Services Authority.
Credit risk on derivative instruments is calculated using the potential future mark-to-market exposure of the instruments at a 97.5% statistical confidence level and adding this value to the current value. The resulting “loan equivalent” or credit risk is then included against credit limits, along with other non-derivative exposures. In addition, there is a policy framework to enable the collateralisation of derivative instruments including swaps. If collateral is deemed necessary to reduce credit risk, any unsecured risk threshold, and the nature of any collateral to be accepted, is determined by management’s credit evaluation of the counterparty.
Corporate Banking continues to be targeted as an area where the Group aims to achieve controlled growth, mainly through the expansion of a Corporate network supporting lending to the Real Estate, Corporate (including SME, Education and Health sectors). Focus continues to be given to the control of credit risks within this expansion with, amongst other things, the development and implementation of robust Credit Policy Mandates and models covering both risk appetite and ratings. Corporate Banking loans(1)
Gross loans & advances
£m
Impairment allowance
£m
Loans & advances net of
impairment allowance
£m
Impaired loans
£m
Impaired loans as % of gross loans &
advances %
Impairment charge for the period
£m
% Collateral held against
impaired loans
% 30 June 2010 20,456 (372) 20,084 497 2.43 34 49 31 December 2009 20,122 (359) 19,763 618 3.07 60 47 (1) Excludes social housing bonds and operating lease assets. Corporate Banking committed facilities exposure by credit rating of the issuer or counterparty(1)
2010
Corporate £m
Real Estate £m
Social Housing £m
Non-growth £m
Total £m
AAA - 59 - - 59 AA 192 - 1,307 - 1,499 A 753 590 5,815 584 7,742 BBB 2,942 2,057 1,635 2,646 9,280 BB 1,804 2,031 10 1,750 5,595 B 80 158 - 220 458 CCC 35 25 - 99 159 D 47 83 - 474 604 Other(2) 996 - - - 996 Total 6,849 5,003 8,767 5,773 26,392
(1) All exposures are internally rated. External ratings are taken into consideration in the rating process, where available. (2) Individual exposures of £1m or less.

Business and Financial Review – Interim Management Report
Risk Management continued
48
2009 Corporate
£m Real Estate
£m Social housing
£m Non-growth
£m Total
£m AAA - 60 - - 60 AA 206 - 997 310 1,513 A 799 463 5,484 639 7,385 BBB 2,688 1,585 1,791 3,027 9,091 BB 1,462 2,043 100 1,726 5,331 B 124 180 - 204 508 CCC 16 5 - 66 87 D 111 95 - 199 405 Other(2) 921 - - - 921 Total 6,327 4,431 8,372 6,171 25,301
(1) All exposures are internally rated. External ratings are taken into consideration in the rating process, where available. (2) Individual exposures of £1m or less. Corporate Banking committed facilities exposure by geographical area
30 June 2010
Corporate £m
Real Estate £m
Social Housing £m
Non-growth £m
Total £m
United Kingdom 6,523 4,747 8,767 2,965 23,002 US - 65 - 540 605 Rest of the world 326 191 - 2,268 2,785 Total 6,849 5,003 8,767 5,773 26,392 31 December 2009
Corporate £m
Real Estate £m
Social Housing £m
Non-growth £m
Total £m
United Kingdom 6,019 4,202 8,372 3,353 21,946 US - 65 - 511 576 Rest of the world 308 164 - 2,307 2,779 Total 6,327 4,431 8,372 6,171 25,301 The increase in Corporate and Real Estate exposures in the first half of 2010 arose from the continued development of a UK corporate banking franchise and was offset by a reduction in the non growth portfolios, both in the UK and overseas. There are no significant exposures to Dubai, Portugal, Greece, Spain, Argentina and Iceland within the Corporate Banking book. Corporate Banking – Watchlist The entire corporate risk portfolio of new, emerging and serious circumstances relating to the portfolio (i.e. those loans on a ‘Watchlist’) and those in workouts are managed at the FEVE Corporate Risk forum. FEVE is a Spanish acronym for “Firmas En Vigilancia Especial”, which means businesses under special watch.
A summary of the Watchlist cases at 30 June 2010 and 31 December 2009 by portfolio and assessment of risk is as follows:
30 June 2010 Portfolio
£m Watch
£m Watch
% Workout
£m Workout
% NPL £m
NPL %
Corporate 6,849 401 6 113 2 140 2 Real Estate 5,003 570 11 459 9 207 4 Non-growth 5,773 1,191 21 280 5 458 8 Total 17,625 2,162 12 852 5 805 5
31 December 2009 Portfolio
£m Watch
£m Watch
% Workout
£m Workout
% NPL £m
NPL %
Corporate 6,327 377 6 204 3 135 2 Real Estate 4,431 672 15 331 7 206 5 Non-growth 6,171 1,232 20 502 8 368 6 Total 16,929 2,281 14 1,037 6 709 4
Exposures are classified as “workout” if they are being actively managed by the Risk Division. Corporate Banking arrears
30 June 2010
£m
31 December 2009 £m
Total Corporate lending asset in arrears 459 533 Total Corporate lending assets 21,016 20,707 Total Corporate lending asset in arrears as a % of assets 2.18% 2.57%

Business and Financial Review – Interim Management Report
Risk Management continued
49
Corporate Banking analysis of provisions on loans and advances to customers An analysis of the Corporate Banking provisions on loans and advances to customers is presented below.
30 June 2010
£m 31 December 2009
£m Observed provisions Corporate advances - UK 237 185 Finance leases - UK 1 1 Total observed provisions 238 186 Incurred but not yet observed provisions Corporate advances - UK 133 172 Finance leases - UK 1 1 Total incurred but not yet observed provisions 134 173 Total provisions 372 359
Corporate Banking movements in provisions for impairment losses on loans and advances: An analysis of movements in the Corporate Banking provisions for impairment losses on loans and advances is presented below.
Six months ended 30 June 2010
£m
Year ended 31 December 2009
£m
Provisions at 1 January 359 303 Amounts written off: - Corporate Loans (17) - - Finance Leases (2) (4) Total amounts written off (19) (4) Observed provisions charged against profit: - Corporate Loans 69 172 - Finance Leases 2 5 Total observed provisions charged against profit 71 177 Incurred but not yet observed provisions charged against profit (39) (117) Total provisions charged against profit 32 60 Provisions at the end of the period 372 359
Corporate Banking recoveries An analysis of the Corporate Banking recoveries is presented below.
Six months ended 30 June 2010
£m
Year ended 31 December 2009
£m Secured - 1 Unsecured 1 23 Total amount recovered 1 24 Corporate Banking non-performing loans and advances(1)
30 June 2010 £m
31 December 2009 £m
Non-performing loans and advances that are impaired 497 490 Non-performing loans and advances that are not impaired 308 219 Total non-performing loans and advances(2) 805 709 Non-performing loans and advances as a percentage of loans and advances to customers(3) 3.94% 3.52% Provision as a percentage of total non-performing loans and advances 46% 51% (1) Loans and advances are classified as non-performing either when payments are more than three months past due or where there are reasonable doubts about
full repayment (principal and interest) under the contractual terms. (2) All non-performing loans are UK and continue accruing interest. (3) Loans and advances to customers include social housing loans and finance leases.
At 30 June 2010, non-performing loans and advances as a percentage of loans and advances to customers increased to 3.94% from 3.52% as at 31 December 2009 as market conditions remained challenging which particularly affected customers in the Real Estate and shipping markets.
Interest income recognised on impaired loans amounted to £3.0m (2009: £3.6m). Credit risk mitigation Collateralisation The Corporate portfolio is largely unsecured but typically incorporates guarantee structures underpinned by both financial and non-financial covenants. The Social Housing portfolio is secured on residential real estate owned and let by UK Housing Associations. In the Real Estate portfolio, collateral is in the form of commercial real estate assets. Within the non-growth portfolios of assets inconsistent with the Group’s future strategy, collateral is regularly held through a charge over the underlying asset and in some circumstances, cash. There are also a small number of PFI transactions where collateral is held in the form of a charge over the underlying concession contract.

Business and Financial Review – Interim Management Report
Risk Management continued
50
Restructured loans Loans may be restructured or renegotiated by capitalising the arrears where customers in arrears have maintained an agreed monthly repayment for a specified period. Loans were restructured during the first half of 2010 and the year ended 31 December 2009 by way of debt for equity swaps, through new equity being raised or in some cases an exit has been achieved through the sale of debt. Market risk in Corporate Banking Market risks arising in the Corporate Banking division are transferred from the originating business to ALM within Group Infrastructure, where they can be managed in conjunction with exposures arising from the funding, liquidity or capital management activities of ALM. Funds received with respect to deposits taken are lent on to Group Infrastructure on matching terms as regards interest rate repricing and maturity. Similarly, loans are funded through matching borrowings from Group Infrastructure. Any permitted retained market risk exposure is minimal, and is monitored against limits approved by the Head of Wholesale Risk. Risk Management in Global Banking & Markets Credit risk in Global Banking & Markets Credit risk is the risk that counterparties will not meet their financial obligations resulting in Global Banking & Markets losing the monies lent, including any interest accrued, or having to close out transactions prematurely, which may incur losses after realising collateral held. Credit risk arises by Global Banking & Markets making loans, investing in debt securities or other financial instruments or entering into financing transactions or derivative contracts. Global Banking & Markets actively manages and controls credit risk. Managing credit risk The Board has approved a set of risk appetite limits to cover different types of risk, including credit risk, arising in Global Banking & Markets. The Group’s credit risk appetite is measured and controlled by a maximum economic capital value, which is defined as the maximum level of unexpected loss that the Group is willing to sustain over a one-year period. Within these limits, credit mandates and policies are approved to cover detailed industry, sector and product limits.
All transactions are accommodated under credit limits approved by the appropriate credit authority. Specific approval is usually required from the Credit Approval Committees (specific committees established under the authority of the Chief Executive) for any transaction that falls outside the mandates.
Analysis of credit exposures and credit risk trends are provided each month to the Wholesale Risk Oversight and Control Forum with key issues escalated to the Risk Committee as required. Large Exposures (as defined by the UK Financial Services Authority) are reported monthly to the Risk Committee and the UK Financial Services Authority.
Credit risk on derivative instruments is calculated using the potential future mark-to-market exposure of the instruments at a 97.5% statistical confidence level and adding this value to the current value. The resulting “loan equivalent” or credit risk is then included against credit limits, along with other non-derivative exposures. In addition, there is a policy framework to enable the collateralisation of derivative instruments including swaps. If collateral is deemed necessary to reduce credit risk, any unsecured risk threshold, and the nature of any collateral to be accepted, is determined by management’s credit evaluation of the counterparty. Credit risk mitigation (i) Netting arrangements The Group restricts its credit risk by entering into transactions under industry standard agreements which facilitate netting of transactions in the jurisdictions where netting agreements are recognised and have legal force. The netting arrangements do not generally result in an offset of balance sheet assets and liabilities for accounting purposes, as transactions are usually settled on a gross basis.
However, there is scope for the credit risk associated with favourable contracts to be reduced by netting arrangements embodied in the agreements to the extent that if an event of default occurs, all amounts with the counterparty under the specific agreement can be terminated and settled on a net basis. Derivatives, repurchase and reverse repurchase transactions, stock borrowing/lending transactions and other securities financing transactions are generally governed by industry standard agreements that facilitate netting. (ii) Collateralisation The Group also mitigates its credit risk to counterparties with which it primarily transacts financial instruments through collateralisation, using industry standard collateral agreements. Under these agreements, net exposures with counterparties are collateralised with cash, securities or equities. Exposures and collateral are generally revalued daily and collateral is adjusted accordingly to reflect deficits/surpluses. Collateral taken must comply with the Group’s collateral parameters policy. This policy is designed to control the quality and concentration risk of collateral taken such that collateral held can be liquidated when a counterparty defaults. Cash collateral in respect of derivatives held at 30 June 2010 was £0.9bn (2009: £1.5bn), not all derivative arrangements being subject to collateral agreements. Collateral obtained during the period in respect of purchase and resale agreements (including securities financing) is equal to at least 100% of the amount of the exposure.

Business and Financial Review – Interim Management Report
Risk Management continued
51
Global Banking & Markets net exposure by credit rating of the issuer or counterparty(1)
30 June 2010 £m
31 December 2009 £m
AAA 15,133 12,068 AA 462 512 A 2,268 2,596 BBB 517 403 BB 17 172 B 29 - Total 18,426 15,751 (1) External ratings are applied to all exposures where available. In the securities financing businesses, credit risk arises on both assets and liabilities and on both on and off-balance sheet transactions. Consequently, the above credit risk exposure arises not only from the on balance sheet assets, but also from securities financing trades classified as liabilities and off-balance sheet assets. Market risk in Global Banking & Markets Market risk-taking is performed within the framework established by the Market Risk Manual. A major portion of the market risk arises from exposures to changes in the levels of interest rates, equity markets and credit spreads. Interest rate exposure is generated from trading activities. Exposure to equity markets is generated by the creation and risk management of structured products by Global Banking & Markets for the personal financial services market and trading activities. Credit spread exposure arises from credit risk management and trading activities within Global Banking & Markets. Managing market risk Risks are managed within limits approved by the Head of Wholesale Risk or Banco Santander, S.A.’s Board Risk Committee and within the risk control framework defined by the Market Risk Manual. For trading activities, the primary risk exposures for Global Banking & Markets are interest rate, equity, credit spread and residual exposure to property indices. Interest rate risks are managed via interest rate swaps, futures and options (caps, floors and swaptions). Equity risks are managed via equity stock, index futures, options and structured equity derivatives. Credit-spread risks are managed via credit derivatives (credit default swaps, total return swaps). Property index risk is managed via insurance contracts and property derivatives.
To facilitate understanding and communication of different risks, risk categories have been defined. Exposure to all market risk factors is assigned to one of these categories. The Group considers two categories: > Short-term liquid market risk covers activities where exposures are subject to frequent change and could be closed
out over a short-time horizon. Most of the exposure is generated by Global Banking & Markets. > Structural market risk includes exposures arising as a result of the structure of portfolios of assets and liabilities, or
where the liquidity of the market is such that the exposure could not be closed out over a short-time horizon. The risk exposure is generated by features inherent in either a product or portfolio and normally presented over the life of the portfolio or product. Such exposures are a result of the decision to undertake specific business activities, can take a number of different forms, and are generally managed over a longer-time horizon.
Global Banking & Markets operates within a market risk framework designed to ensure that it has the capability to manage risk in a well-controlled manner. A comprehensive set of policies, procedures and processes have been developed and implemented to identify, measure, report, monitor and control risk across Global Banking & Markets. Trading market risk For trading activities the standardised risk measure adopted is Value at Risk. From 1 January 2010, this has been calculated at a 99% confidence level over a one-day time horizon in accordance with the standard used throughout Banco Santander, S.A.. Prior to this date, a 95% confidence level was used. On a daily basis, market risk factor sensitivities, Value at Risk measures and stress tests are produced, reported and monitored against limits for each major activity and at the aggregate Global Banking & Markets level. These limits are used to align risk appetite with the business’ risk-taking activities and are reviewed on a regular basis.
Measurement of risks can involve the use of complex quantitative methods and mathematical principles to model and predict the changes in instruments and portfolio valuation. These methods are essential tools to understand the risk exposures. Trading market risk exposure arises only in the Abbey National Treasury Services plc group. Exposures are managed on a continuous basis, and are marked to market daily.
The following table shows the Value at Risk-based consolidated exposures for the major risk classes as at 30 June 2010 and 31 December 2009, together with the highest, lowest and average exposures for the six month periods ended 30 June 2010 and 2009. Exposures within each risk class reflect a range of exposures associated with movements in that financial market. For example, interest rate risks include the impact of absolute rate movements, movements between interest rate bases and movements in implied volatility on interest rate options. The range of possible statistical modelling techniques and assumptions mean these measures are not precise indicators of expected future losses, but are estimates of the potential change in the value of the portfolio over a specified time horizon and within a given confidence interval. Historical simulation models are used with appropriate add-ons to reflect unobservable inputs.
From time to time, losses may exceed the amounts stated where the movements in market rates fall outside the statistical confidence interval used in the calculation of the value at risk analysis. The 99% confidence interval means that the theoretical loss at a risk factor level is likely to be exceeded in one period in a hundred. This risk is addressed by monitoring stress-testing measures across the different business areas.

Business and Financial Review – Interim Management Report
Risk Management continued
52
For trading instruments the actual, average, highest and lowest value at risk exposures shown below are all calculated to a 99% level of confidence using a simulation of actual one day market movements over a one-year period. The effect of historic correlations between risk factors is additionally shown below. The use of a one-day time horizon for all risks associated with trading instruments reflects the horizon over which market movements will affect the measured profit and loss of these activities.
The amounts below represent the potential change in market values of trading instruments. Since trading instruments are recorded at market value, these amounts also represent the potential effect on income. All amounts presented below are based on a 99% confidence level and the comparatives have been restated accordingly.
Actual exposure
Group trading instruments
30 June 2010
£m
31 December 2009
£m Interest rate risks 3.3 2.4 Equity risks 2.2 1.0 Spread risks 1.2 1.1 Property risks 3.2 6.0 Other risks(1) 0.3 0.4 Correlation offsets(2) (2.3) (2.3) Total correlated one-day Value at Risk 7.9 8.6 Exposure for the six months ended 30 June Average exposure Highest exposure Lowest exposure
Group trading instruments 2010
£m 2009
£m 2010
£m 2009
£m 2010
£m 2009
£m Interest rate risks 3.7 6.1 6.1 8.7 2.6 3.4 Equity risks 2.0 2.1 2.7 2.9 1.5 1.2 Spread risks 1.4 3.5 1.6 4.8 1.2 2.1 Property risks 8.2 8.8 9.1 9.5 3.2 8.0 Other risks(1) 0.2 1.1 0.6 1.4 0.2 1.0 Correlation offsets(2) (2.6) (4.4) - - - - Total correlated one-day Value at Risk 12.9 17.2 15.4 19.5 7.2 14.4 (1) Other risks include foreign exchange risk. (2) The highest and lowest exposure figures reported for each risk type did not necessarily occur on the same day as the highest and lowest total correlated one-
day Value-at-Risk. A corresponding correlation offset effect cannot be calculated and is therefore omitted from the above table. Property risks increased during 2009, mainly due to an equity release business funded by the Group, as total equity advances increased. During the six months ended 30 June 2010, the risk has reduced significantly due to the sale of the majority of one of the equity release portfolios to a third party. Derivatives held for Trading Purposes Global Banking & Markets is the only area of the Group actively trading derivative products and is additionally responsible for implementing most Group derivative hedging with the external market. For trading activities, Global Banking & Markets objectives are to gain value by marketing derivatives to end users and hedging the resulting exposures efficiently; and the management of trading exposure reflected on the Group’s balance sheet. Trading derivatives include interest rate, cross currency, equity, residential property and other index related swaps, forwards, caps, floors, swaptions, as well as credit default and total return swaps, equity index contracts and exchange traded interest rate futures and equity index options. Risk Management in Private Banking Credit risk in Private Banking Cater Allen Cater Allen provides a limited range of products to assist with the finance requirements of individuals and businesses. Risk management policies are specific to and reflect the risks inherent in each product set. Approval processes for credit risk include the use of judgement, assisted by the use of credit scoring and credit ratings. Cater Allen operates within policies and authority levels approved by the Chief Risk Officer. Cater Allen has a dedicated risk team, reflecting the desire for risk control to be close to the business needs and risks. Abbey International Abbey International’s office is in Jersey, with a focus on attracting deposits by offering a range of savings accounts denominated in sterling, US dollars and euros. There is no credit risk associated in taking deposits. Alliance & Leicester International Alliance & Leicester International’s office is in the Isle of Man, with a focus on attracting deposits by offering a range of savings accounts denominated in sterling, US dollars and euros. There is no credit risk associated in taking deposits.

Business and Financial Review – Interim Management Report
Risk Management continued
53
Bradford & Bingley International Bradford & Bingley International Limited is based in the Isle of Man with a focus on attracting deposits from both retail and corporate customers via savings accounts predominantly denominated in sterling. There is no credit risk associated in taking deposits. James Hay James Hay provides administration services for self-invested pension plans and the WRAP portfolio management product to end customers mainly via independent financial advisers and branded financial service providers. With the exception of fees receivable, there is no credit risk associated with this type of service. On 10 March 2010, Santander Private Banking UK Limited completed the disposal of James Hay Holdings Limited, together with its five subsidiary companies, by the sale of 100% of James Hay Holdings Limited’s shares to IFG UK Holdings Limited, a subsidiary of IFG Group for a cash consideration of approximately £39m. The IFG Group provides independent financial advisory, fund management and pension administration services in Ireland and the UK. Abbey Stockbrokers Abbey Stockbrokers Limited, trading as Abbey Sharedealing, provides a direct share dealing service to customers. Customers buy and sell shares on their account with the help of the dealers at Abbey Sharedealing. No advice is provided and all trades are on an execution only basis, account customers are required to provide funds before settlement. As such there is no credit risk associated with this type of activity. Market risk in Private Banking Market risk arises from exposures to changes in the levels of interest rates, foreign exchange rates and equity markets. Market risk arises through the provision of retail and other banking products and services, as well as structural exposures arising in the balance sheet of the entities in Private Banking. Managing market risk Market risks in Private Banking arising from exposure to changes in the levels of interest rates and foreign exchanges rates are substantially transferred from the original business to ALM. Risks not transferred are managed within a series of market risk mandates, which set triggers for reporting on the extent of market risk that may be retained. These limits are defined in terms of nominal amounts, sensitivity, earnings-at-risk or value-at-risk. The permitted retained market risk exposure is minimal. Market risks arising from structured products, including exposure to changes in the levels of equity markets, are hedged with Global Banking & Markets. Risk Management in Group Infrastructure Group Infrastructure consists of ALM, which is also responsible for Group Capital and Funding, as well as the Treasury asset portfolio. ALM is responsible for managing the Group’s structural balance sheet shape and, in conjunction with Risk Division, tactical liquidity risk management. This includes short-term and medium-term funding, covered bond and securitisation programmes. ALM's responsibilities also include Retail Banking’s product and structural exposure to interest rates and, in that role, there is a link between the Retail Banking and Global Banking & Markets. ALM recommends and helps to implement Board, Asset and Liability Management Committee and Risk Committee policies for all aspects of balance sheet management - formulating guidance for, and monitoring, the overall balance sheet shape, including maturity profile. Group Capital represents the return on the Group’s capital, reserves, preference shares and subordinated debt. Funding represents the provision of funding, both to other businesses within the Group and to fellow members of the Banco Santander, S.A. group. Credit risk in Group Infrastructure Credit risk is the risk that counterparties will not meet their financial obligations resulting in Group Infrastructure losing the monies lent, including any interest accrued, or having to close out transactions prematurely, which may incur losses after realising collateral held. Credit risk arises by Group Infrastructure making loans, investing in debt securities or other financial instruments or entering into financing transactions or derivative contracts. Managing credit risk Credit risk arises in Group Infrastructure with respect to the division’s holdings of externally rated asset-backed securities, bank floating rate notes, other assets held for liquidity purposes (which are principally concentrated in the AAA rating category), and lending to fellow members of the Banco Santander S.A. group.
All credit risk meets the criteria approved by the Board in respect to risk appetite parameters and all exposure, including intra-group, is captured on the global risk management systems and falls within limits approved by Banco Santander, S.A. Risk Division. The exposure is managed by the Group´s Wholesale Risk Team.

Business and Financial Review – Interim Management Report
Risk Management continued
54
Group Infrastructure net exposure by credit rating of the issuer or counterparty(1)
30 June 2010
£m
31 December
2009 £m
AAA 25,303 10,130 AA 3,677 7,540 A 5,440 10,531 BBB+ 1,171 2,507 BBB 48 375 Below BBB 87 430 D 5 - Total 35,731 31,513 (1) External ratings are applied to all exposures where available. The increase in net exposure to issuers and counterparties rated AAA during 2010 principally reflected increased holdings of liquid assets.
Risks are managed in accordance with limits, asset quality plans and criteria set out in the relevant policy statement. Decisions are based on independent credit risk analysis, supplemented by the output of internal ratings tools and external rating agency analysis. An internal ratings model is used to grade financial institution exposures and to generate probability of default and expected loss. The Group uses external ratings supplemented by internal analysis to assess the risks associated with structured credit and securitisation investments. Individual exposures are reviewed at least annually. Asset quality monitoring is reported by regular executive and management reporting which include expected loss analysis.
The Alliance & Leicester treasury asset portfolio is monitored for potential impairment through a detailed and expected cashflow analysis taking into account the structure and underlying assets of each individual security. Once specific events give rise to a reasonable expectation that future anticipated cash flows may not be received, the asset originating these doubtful cash flows will be deemed to be impaired. Market risk in Group Infrastructure Most market risks arising from the Retail Banking, Corporate Banking, and Private Banking divisions are transferred from the originating business to ALM within Group Infrastructure, where they can be managed in conjunction with exposures arising from the funding, liquidity or capital management activities of ALM. As a consequence, non-trading risk exposures are substantially transferred to Group Infrastructure. Market risks mainly arise through the provision of banking products and services to personal and corporate/business customers, as well as structural exposures arising in the Group’s balance sheet. These risks impact the Group’s current earnings and economic value.
The most significant market risk in Group Infrastructure is interest rate risk. Yield curve risk arises from the timing mismatch in the repricing of fixed and variable rate assets, liabilities and off-balance sheet instruments, as well as the investment of non-interest-bearing liabilities in interest-bearing assets. Basis risk arises to the extent that the volume of administered variable rate assets and liabilities are not precisely matched, which exposes the balance sheet to changes in the relationship between administered rates and market rates. Credit spread risk arises principally on Group Infrastructure’s holdings of mortgage-backed securities. Foreign exchange risk arises from differences in the present value of existing foreign-currency denominated assets and liabilities, and future known cash flows.
The Group is also exposed to risks arising from features in retail products that give customers the right to alter the expected cash flows of a financial contract. This creates prepayment risk, for example where customers may prepay loans before their contractual maturity. In addition, the Group is exposed to product launch risk, for example where the customers may not take up the expected volume of new fixed rate mortgages or other loans. Managing market risk The Asset and Liability Management Committee is responsible for managing the Group’s overall balance sheet position. Natural offsets are used as far as possible to mitigate yield curve exposures but the overall balance sheet position is generally managed using derivatives that are transacted through Global Banking & Markets and with external counterparties. The Treasurer, Head of ALM, is responsible for managing risks in accordance with the Asset and Liability Management Committee’s direction.
Risks are managed within limits approved either by the Head of Wholesale Risk or Banco Santander, S.A.’s Board Risk Committee, and within the risk control framework defined by the Market Risk Manual. The key risk limits relate to yield curve risk. They are: > Net Interest Margin sensitivity: the sensitivity of annual net interest margin to an instantaneous and unexpected adverse
100 basis point parallel shock to the yield curve. > Market Value of Equity sensitivity: the sensitivity of the net present value of interest rate sensitive positions to an
instantaneous and unexpected adverse 100 basis point parallel shock to the yield curve. These two measures provide complementary views of potential losses from interest rate movements. Market Value of Equity sensitivity provides a long-term view covering the present value of all future cash flows, whereas Net Interest Margin sensitivity considers only the impact on net interest margin over the next 12 months. Calculation of these two measures requires modelling of expected customer and other behaviours. These models are regularly reviewed and updated.

Business and Financial Review – Interim Management Report
Risk Management continued
55
The following table shows the results of these measures as at 30 June 2010 and 31 December 2009:
30 June 2010
£m
31 December
2009 £m
Net interest margin sensitivity (100 basis points adverse parallel shock) 40 (38) Market value of equity sensitivity (100 basis points adverse parallel shock) 245 2 Market risk on the Group's remaining Banco Santander, S.A. group-issued mortgage-backed securities portfolio is managed against credit spread triggers approved by the Head of Wholesale Risk. Sensitivity analysis is disclosed in Note 28 to the condensed consolidated interim financial statements. Derivatives Derivative financial instruments (‘derivatives’) are contracts or agreements whose value is derived from one or more underlying indices or asset values inherent in the contract or agreement, which require no or little initial net investment and are settled at a future date. They include interest rate, cross-currency and equity related swaps, forward rate agreements, caps, floors, options and swaptions (see below). In Group Infrastructure, derivatives are used for economic hedging.
All derivatives are classified as held at fair value through profit or loss. For accounting purposes under IFRS, the Group chooses to designate certain derivatives as in a hedging relationship if they meet specific criteria set out in IAS 39 “Financial Instruments: Recognition and measurement”.
The main hedging derivatives are interest rate and cross-currency swaps, which are used to hedge fixed-rate lending and structured savings products and medium-term note issuances, capital issuances and other capital markets funding.
Derivative products that are combinations of more basic derivatives (such as swaps with embedded option features), or that have leverage features, may be used in circumstances where the underlying position being hedged contains the same risk features. In such cases the derivative used will be structured to match the risks of the underlying asset or liability. Exposure to market risk on such contracts is therefore economically hedged.
The following table summarises the activities undertaken within Group Infrastructure, the related risks associated with such activities and the types of hedging derivatives used in managing such risks. These risks may also be managed using on-balance sheet instruments as part of an integrated approach to risk management. Further information is contained in Note 7 to the condensed consolidated interim financial statements and Note 13 to the 2009 Consolidated Financial Statements. Activity Risk Type of hedge Management of the return on variable rate assets financed by shareholders’ funds and net non-interest-bearing liabilities.
Reduced profitability due to falls in interest rates. Receive fixed interest rate swaps.
Management of the basis between administered rate assets and liabilities and wholesale market rates.
Reduced profitability due to adverse changes in the basis spread.
Basis swaps.
Management of repricing profile of wholesale funding.
Reduced profitability due to adverse movement in wholesale interest rates when large volumes of wholesale funding are repriced.
Forward rate agreements.
Fixed rate lending and investments.
Sensitivity to increases in interest rates. Pay fixed interest rate swaps.
Fixed rate retail and wholesale funding.
Sensitivity to falls in interest rates. Receive fixed interest rate swaps.
Equity-linked retail funding.
Sensitivity to increases in equity market indices. Receive equity swaps.
Management of other net interest income on retail activities.
Sensitivity of income to changes in interest rates. Interest rate swaps.
Issuance of products with embedded equity options.
Sensitivity to changes in underlying index and index volatility causing option exercise.
Interest rate swaps combined with equity options.
Lending and issuance of products with embedded interest rate options.
Sensitivity to changes in underlying rate and rate volatility causing option exercise.
Interest rate swaps plus caps/floors.
Investment in, and issuance of, bonds with put/call features.
Sensitivity to changes in rates causing option exercise. Interest rate swaps combined with swaptions(1) and other matched options.
(1) A swaption is an option on a swap that gives the holder the right but not the obligation to buy or sell a swap.

Business and Financial Review – Interim Management Report
Risk Management continued
56
Impact of the Current Credit Environment The Group aims to actively manage its exposure to financial institutions and non-bank financial institutions such as pension and investment funds, monoline insurers and general insurers. This exposure arises from investment in floating rate notes, short-term money market placements, derivative transactions and margin posting on securities borrowing transactions.
At 30 June 2010, the Group is not significantly exposed to sovereign debt of countries currently experiencing severe liquidity problems. The Group has exposure through a Floating Rate Note issued by a bank in Greece of £4m as at 30 June 2010 (2009: £36m).
Details of the Group’s investing and lending arrangements with respect to floating rate notes (‘FRNs’), asset-backed securities (‘ABS’) including mortgage-backed securities (‘MBS’), Collateralised Debt Obligations (‘CDOs’), Collateralised Loan Obligations (‘CLOs’), Structured Investment Vehicles (‘SIVs’), monoline insurers, off-balance sheet entities, other holdings for liquidity purposes and lending activities are set out below.
Classification in the Consolidated Balance Sheet The classification of these assets in the consolidated balance sheet is as follows: 30 June 2010 Type of Financial Instrument analysed further
Note FRNs ABS CDO CLO Other Sub-total OECD Govt
debts Bank & building
society CDs Total Balance sheet line item £m £m £m £m £m £m £m £m £m Trading assets – debt securities 6 11,675 - - - - 11,675 3,005 1,710 16,390 Financial assets designated at
fair value – debt securities 8 - 355 24 - 311 690 - - 690
Available for sale – debt securities
11 254 - - - - 254 500 - 754
Loans and receivables securities 12 3,461 1,929 46 243 39 5,718 - - 5,718 Total 15,390 2,284 70 243 350 18,337 3,505 1,710 23,552
31 December 2009 Type of Financial Instrument analysed further
Note FRNs ABS CDO CLO Other Sub-total OECD Govt
debts Bank & building
society CDs Total Balance sheet line item £m £m £m £m £m £m £m £m £m Trading assets – debt securities 6 11,128 - - - - 11,128 2,869 1,935 15,932 Financial assets designated at fair
value – debt securities 8 - 3,446 50 - 263 3,759 - 2,220 5,979
Available for sale – debt securities 11 342 - - - - 342 405 - 747 Loans and receivables securities 12 6,749 2,245 80 639 185 9,898 - - 9,898 Total 18,219 5,691 130 639 448 25,127 3,274 4,155 32,556
Additional analysis is presented below of the above financial instruments, except for the category “OECD Govt debts” and “Bank & building society CDs”. The fair values below exclude the effects of changes in foreign exchange rates. Summary
30 June 2010 Fair value movement(1) 2010 30 June 2010 Nominal
30 June 2010 Book value
30 June 2010 Fair value Income statement Reserves Provisions(1)
£m £m £m £m £m £m Floating rate notes 15,270 15,390 15,293 63 - (5) Asset backed securities 2,395 2,283 2,073 32 - - Collateralised debt obligations 114 70 84 4 - - Collateralised loan obligations 274 243 223 7 - - Other investments 362 350 344 4 - - Total 18,415 18,337 18,017 110 - (5)
30 June 2009 Fair value movement(1) 2009
31 Dec 2009 Nominal
31 Dec 2009 Book value
31 Dec 2009
Fair value Income statement Reserves Provisions(1)
£m £m £m £m £m £m Floating rate notes 18,267 18,219 18,129 12 - - Asset backed securities 5,893 5,691 5,424 (82) - (12) Collateralised debt obligations 215 130 130 (2) - - Collateralised loan obligations 703 639 606 - - - Other investments 453 448 449 6 - (6) Total 25,531 25,127 24,738 (66) - (18)
(1) Amounts in respect of assets held at the balance sheet date i.e. not including amounts relating to assets sold during the period/year.

Business and Financial Review – Interim Management Report
Risk Management continued
57
Fair value of debt securities by credit rating of the issuer or counterparty(1)
30 June 2010
FRNs
£m Other
£m Total
£m
AAA 11,583 1,371 12,954 AA+ 90 60 150 AA 1,183 289 1,472 A 1,951 461 2,412 BBB 449 154 603 Below BBB 37 118 155 Unrated - 271 271 Total 15,293 2,724 18,017 31 December 2009 FRNs
£m Other
£m Total
£m AAA 10,828 4,461 15,289 AA+ 83 - 83 AA 2,271 749 3,020 A 3,803 778 4,581 BBB 550 168 718 Below BBB 594 191 785 Unrated - 262 262 Total 18,129 6,609 24,738 (1) External ratings are applied to all exposures, where available.
Floating Rate Notes (a) Fair value movements by geographical location of issuer or counterparty
30 June 2010 movement 2010 30 June 2010
Nominal value 30 June 2010
Book value 30 June 2010
Fair value 30 June 2010 Fair value
as % of nominal Income
statement Reserves Provisions Country £m % £m £m % £m £m £m UK 10,920 71 11,060 11,049 101 33 - - Italy 315 2 313 313 99 2 - - Spain 1,126 6 1,115 1,085 96 1 - - Rest of Europe 1,823 12 1,804 1,755 86 7 - (5) US 168 1 156 150 89 8 - - Rest of the world 918 6 943 941 102 12 - - Total 15,270 98 15,391 15,293 100 63 - (5)
30 June 2009 Movement 2009 31 Dec 2009
Nominal value 31 Dec 2009
Book value 31 Dec 2009
Fair value 31 Dec 2009 Fair value
as % of nominal Income
statement Reserves Provisions Country £m % £m £m % £m £m £m UK 9,913 53 9,953 9,938 100 - - - Italy 653 4 650 650 100 - - - Spain 1,546 9 1,527 1,510 98 2 - - Rest of Europe 3,943 22 3,910 3,897 99 9 - - US 699 4 651 633 91 - - - Rest of the world 1,513 8 1,528 1,501 99 1 - - Total 18,267 100 18,219 18,129 99 12 - - (b) Fair value movements by credit rating of issuer or counterparty 2010 30 June 2010 movement
30 June 2010
Nominal value
30 June 2010
Book value 30 June 2010
Fair value 30 June 2010 Fair value
as % of nominal Income
statement Reserves Provisions Credit rating £m % £m £m % £m £m £m AAA 11,398 74 11,583 11,583 102 4 - - AA+ 90 1 90 90 100 - - - AA 1,197 8 1,187 1,183 99 22 - - A 2,041 14 2,013 1,951 96 27 - - BBB 480 3 469 449 94 10 - - Below BBB 64 - 49 37 61 - - (5) Total 15,270 100 15,391 15,293 100 63 - (5)

Business and Financial Review – Interim Management Report
Risk Management continued
58
2009 30 June 2009 movement
31 Dec 2009
Nominal value 31 Dec 2009
Book value 31 Dec 2009
Fair value 31 Dec 2009 Fair value
as % of nominal Income
statement Reserves Provisions Credit rating £m % £m £m % £m £m £m AAA 10,757 58 10,828 10,828 101 3 - - AA+ 83 - 83 83 100 - - - AA 2,297 13 2,270 2,271 99 5 - - A 3,925 22 3,865 3,802 97 3 - - BBB 589 3 570 551 94 - - - Below BBB 616 4 603 594 96 1 - - Total 18,267 100 18,219 18,129 99 12 - - Substantially all the AAA-rated FRNs held are issued by UK banks and guaranteed by the UK Government. The other FRNs held are principally issued by other banks and financial institutions. On average, the FRNs have 22 months (2009: 18 months) to maturity. Structured Investment Vehicles As at 30 June 2010, the Group had insignificant holdings in one SIV, with a nominal value of £8m (2009: £14m) against which provisions of £7m (2009: £11m) were held, giving a book value of £1m (2009: £3m). The SIV was classified as a floating rate note in the balance sheet and included in the tables above, and was divested soon after the end of the reporting period. A former SIV holding with a nominal value of £6m was divested during the period. Asset-Backed Securities The Group has a portfolio of structured assets, which is diversified by issuer, underlying asset type and geography. Further details on structured asset exposures are set out in the tables below. (a) Fair value movement by geographical location of issuer or counterparty
30 June 2010 movement 2010 30 June 2010
Nominal value 30 June 2010
Book value 30 June 2010
Fair value Fair value as
% of nominal Income
statement Reserves Provisions Country £m % £m £m % £m £m £m UK ABS 133 5 133 132 99 - - - MBS 689 29 716 653 95 13 - - 822 34 849 785 96 13 - - US ABS 560 23 518 493 88 4 - - MBS 249 10 197 144 58 8 - - 809 33 715 637 79 12 - - Rest of Europe ABS 179 11 158 147 84 2 - - MBS 467 15 446 396 85 4 - - 646 26 604 543 84 6 - - Rest of the world MBS 118 5 115 106 91 1 - - Total 2,395 100 2,283 2,073 87 32 - -
30 June 2009 movement 2009
31 Dec 2009 Nominal value
31 Dec 2009 Book value
31 Dec 2009 Fair value
Fair value as % of nominal
Income statement Reserves Provisions
Country £m % £m £m % £m £m £m UK ABS 142 2 141 140 99 - - - MBS 912 16 878 791 87 (5) - - 1,054 18 1,019 931 88 (5) - - US ABS 553 9 506 483 87 - - - MBS 292 5 218 125 43 - - - 845 14 724 608 72 - - - Rest of Europe ABS 300 5 288 283 94 (3) - - MBS 3,542 60 3,511 3,463 98 (74) - (12) 3,842 65 3,799 3,746 98 (77) - (12) Rest of the world MBS 152 3 149 139 91 - - - Total 5,893 100 5,691 5,424 92 (82) - (12)

Business and Financial Review – Interim Management Report
Risk Management continued
59
(b) Vintage of asset-backed securities by geographical location of issuer or counterparty
Original vintage 2010 Nominal Original credit enhancements
Original sub-prime exposure Pre-2005 2005 2006 2007 2008-2010
Country £m £m £m % % % % % UK ABS 133 2 - 17 3 37 43 - MBS 689 52 - 37 8 27 28 - 822 54 - 34 7 28 31 - US ABS 560 22 - 26 68 6 - - MBS 249 22 - 20 40 23 17 - 809 44 - 25 59 11 5 - Rest of Europe ABS 269 11 - 51 28 16 5 - MBS 377 31 - 19 3 29 49 - 646 42 - 33 14 23 30 - Rest of the world MBS 118 4 - 27 2 3 68 - Total 2,395 144 - 30 27 20 23 -
Original vintage 2009 Nominal Original credit enhancements
Original sub- prime exposure Pre-2005 2005 2006 2007 2008-2009
Country £m £m £m % % % % %
UK ABS 142 3 - 27 4 54 15 - MBS 912 68 - 35 10 26 29 - 1,054 71 - 34 9 30 27 - US ABS 553 31 - 27 66 6 1 - MBS 292 35 11 23 37 26 14 - 845 66 11 26 56 13 5 - Rest of Europe ABS 300 5 - 25 3 42 30 - MBS 3,542 46 - 80 1 9 10 - 3,842 51 - 76 1 11 12 - Rest of the world MBS 152 6 - 34 3 3 60 - Total 5,893 194 11 60 11 15 14 - (c) Fair value movements by credit rating of issuer or counterparty
30 June 2010 movement 2010 30 June 2010
Nominal value 30 June 2010
Book value 30 June 2010
Fair value Fair value as
% of nominal Income
statement Reserves Provisions Credit rating £m % £m £m % £m £m £m AAA ABS 643 27 597 566 88 1 - - MBS 916 34 865 781 86 6 - - 1,559 61 1,462 1,347 87 7 - - AA+ ABS 58 2 46 45 78 3 - - MBS 19 1 18 15 79 - - - 77 3 64 60 78 3 - - AA ABS 14 4 11 8 77 - - - MBS 156 7 146 113 72 - - - 170 11 157 121 74 - - - A ABS 76 3 75 74 97 1 - - MBS 250 11 305 295 118 9 - - 326 14 380 369 113 10 - - BBB ABS 81 3 79 77 95 - - - MBS 22 1 17 14 64 1 - - 103 4 96 91 88 1 - - Below BBB ABS 2 - 1 1 50 5 - - MBS 158 7 123 84 53 6 - - 160 7 124 85 53 11 - - Total 2,395 100 2,283 2,073 87 32 - -

Business and Financial Review – Interim Management Report
Risk Management continued
60
30 June 2009 movement 2009 31 Dec 2009
Nominal value 31 Dec 2009
Book value 31 Dec 2009
Fair value Fair value as
% of nominal Income
statement Reserves Provisions Credit rating £m % £m £m % £m £m £m AAA ABS 803 14 761 734 91 (3) - - MBS 3,730 63 3,667 3,553 95 (71) - - 4,533 77 4,428 4,287 95 (74) - - AA ABS 10 - 8 7 70 - - - MBS 364 6 348 313 86 - - - 374 6 356 320 86 - - - A ABS 56 1 51 50 89 - - - MBS 582 10 574 564 97 (5) - - 638 11 625 614 96 (5) - - BBB ABS 67 1 66 65 98 - - - MBS 51 1 42 34 67 - - - 118 2 108 99 84 - - - Below BBB ABS 59 1 49 49 83 - - - MBS 171 3 125 55 32 (3) - (12) 230 4 174 104 45 (3) - (12) Total 5,893 100 5,691 5,424 92 (82) - (12) (d) Vintage of asset-backed securities by credit rating of issuer or counterparty
Original vintage 2010 Nominal
Original credit enhancements
Original sub-prime exposure Pre-2005 2005 2006 2007 2008-2010
Credit rating £m £m £m % % % % % AAA ABS 643 26 - 27 63 10 - - MBS 916 77 - 17 8 31 44 - 1,559 103 - 21 32 22 25 - AA+ ABS 58 - - 1 94 5 - - MBS 19 3 - - - 100 - - 77 3 - 1 70 29 - - AA ABS 14 6 - 87 1 - 12 - MBS 156 12 - 20 7 20 53 - 170 18 - 46 5 12 37 - A ABS 76 1 - 26 1 73 - - MBS 250 4 - 77 9 9 5 - 326 5 - 67 8 21 4 - BBB ABS 81 1 - 17 9 4 70 - MBS 22 2 - 1 99 - - - 103 3 - 14 28 3 55 - Below BBB ABS 2 - - 70 30 - - MBS 158 12 - 25 26 28 21 - 160 12 - 25 26 28 21 - Total 2,395 144 - 30 27 20 23 -

Business and Financial Review – Interim Management Report
Risk Management continued
61
Original vintage 2009
Nominal Original credit enhancements
Original sub-prime exposure Pre-2005 2005 2006 2007 2008-2009
Credit rating £m £m £m % % % % % AAA ABS 803 37 - 27 45 18 10 - MBS 3,730 115 - 71 4 9 16 - 4,533 152 - 63 11 11 15 - AA ABS 10 1 - 29 41 30 - - MBS 364 15 5 5 6 65 24 - 374 16 5 6 7 63 24 - A ABS 56 1 - - - 100 - - MBS 582 3 - 95 3 - 2 - 638 4 - 86 3 9 2 - BBB ABS 67 - - 55 - 11 34 - MBS 51 4 - 49 40 11 - - 118 4 - 53 17 11 19 - Below BBB ABS 59 - - - 27 47 26 - MBS 171 18 6 22 23 35 20 - 230 18 6 16 24 38 22 - Total 5,893 194 11 60 11 15 14 - Included in the tables above are holdings of ALT-A US asset-backed securities with book values of £157m (2009: £185m) and fair values of £116m (2009: £107m). The following table shows the vintages of the collateral assets supporting the Group’s holdings of asset-backed securities and mortgage-backed securities at 30 June 2010 and 31 December 2009. 30 June 2010 Original vintage Nominal Pre-2005 2005 2006 2007 2008-2010 Asset Type £m % % % % % Prime lending 2,189 30 27 20 23 - ALT-A 206 17 38 25 20 - Sub-prime - - - - - - Total 2,395 30 27 20 23 - 31 December 2009 Original vintage Nominal Pre-2005 2005 2006 2007 2008-2009 Asset Type £m % % % % % Prime lending 5,663 61 10 15 14 - ALT-A 224 34 40 17 9 - Sub-prime 6 - - - 100 - Total 5,893 60 11 15 14 - Monoline Insurers The Group has a £128m (2009: £219m) exposure to securitisations which are wrapped by monoline insurers. The principal risk exposures are recorded against the securitisations, with the monoline wraps being viewed as contingent exposures. The exposures to monoline insurers are classified as asset-backed securities in the balance sheet and are included in the tables above. Collateralised Debt Obligations (a) Fair value movements by geographical location of issuer or counterparty
30 June 2010 movement 2010 30 June 2010
Nominal value
30 June 2010
Book value
30 June 2010
Fair value
Fair value
as % of nominal
Income statement Reserves Provision
Original exposure to
sub-prime Original credit enhancement
Country £m % £m £m % £m £m £m % % UK - - - - - - - - - - Rest of Europe 1 1 1 1 100 - - - - - US 112 98 68 82 73 4 - - - 100 Rest of the world 1 1 1 1 100 - - - - - Total 114 100 70 84 74 4 - - - 100

Business and Financial Review – Interim Management Report
Risk Management continued
62
30 June 2009 movement 2009 31 December 2009
Nominal value
31 December 2009
Book value
31 December 2009
Fair value
Fair value as % of nominal
Income statement Reserves Provision
Original exposure to
sub-prime Original credit enhancement
Country £m % £m £m % £m £m £m % % UK - - - - - - - - - - Rest of Europe 2 1 2 2 100 (1) - - - - US 212 99 127 127 60 (1) - - 11 30 Rest of the world 1 - 1 1 100 - - - - - Total 215 100 130 130 60 (2) - - 11 30 (b) Vintage of collateralised debt obligations by geographical location of issuer or counterparty
Original vintage 2010 Nominal
Original credit enhancements
Original sub-prime exposure Pre-2005 2005 2006 2007 2008-2010
Country £m £m £m % % % % % ABS CDO UK - - - - - - - - Rest of Europe 1 - - - 100 - - - US 26 3 - 100 - - - - 27 3 - 96 4 - - - Synthetic CDO US 33 4 - 100 - - - - 33 4 - 100 - - - - Other CDO US 53 6 - 53 1 18 28 - Rest of the world 1 - - 100 - - - - 54 6 - 53 1 18 28 - Total 114 13 - 78 1 8 13 -
Original vintage 2009
Nominal Original credit enhancements
Original sub-prime exposure Pre-2005 2005 2006 2007 2008-2009
Country £m £m £m % % % % % ABS CDO UK - - - - - - - - Rest of Europe 2 - - 50 50 - - - US 48 15 14 33 65 2 - - 50 15 14 34 64 2 - - Synthetic CDO US 95 11 - 100 - - - - 95 11 - 100 - - - - Other CDO US 70 8 1 38 5 24 33 - 70 8 1 38 5 24 33 - Total 215 34 15 64 17 8 11 -
(c) Fair value movements by credit rating of issuer or counterparty
30 June 2010 movement 2010 30 June 2010
Nominal value
30 June 2010
Book value
30 June 2010
Fair value
Fair value
as % of nominal
Income statement Reserves Provision
Original exposure to
sub-prime Original credit enhancement
Credit rating £m % £m £m % £m £m £m % % AAA 12 10 6 11 92 1 - - - - AA 17 15 14 14 82 - - - - 17 A 17 15 12 8 47 - - - - 25 BBB 25 22 16 20 80 1 - - - 25 Below BBB 43 38 22 31 72 2 - - - 33 Total 114 100 70 84 74 4 - - - 100
30 June 2009 movement 2009 31 December 2009
Nominal value
31 December 2009
Book value
31 December 2009
Fair value
Fair value as % of nominal
Income statement Reserves Provision
Original exposure to
sub-prime Original credit enhancement
Credit rating £m % £m £m % £m £m £m % % AAA 16 7 8 8 50 - - - - 26 AA 64 30 48 48 75 - - - 1 13 A 17 8 7 7 41 - - - 10 - BBB 23 11 15 15 65 - - - 1 1 Below BBB 95 44 52 52 55 (2) - - 6 2 Total 215 100 130 130 60 (2) - - 11 30

Business and Financial Review – Interim Management Report
Risk Management continued
63
(d) Vintage of collateralised debt obligations by credit rating of issuer or counterparty
Original vintage 2010 Nominal
Original credit enhancements
Original sub-prime exposure Pre-2005 2005 2006 2007 2008-2010
Credit rating £m £m £m % % % % % ABS CDO AAA 1 - - - 100 - - - BBB 7 1 - 100 - - - - Below BBB 18 3 - 100 - - - - 26 4 - 97 3 - - - Synthetic CDO BBB 17 2 - 100 - - - - Below BBB 17 2 - 100 - - - - 34 4 - 100 - - - - Other CDO AAA 11 - - 100 - - - - AA 16 2 - 98 2 - - - A 17 3 - 2 2 7 89 - BBB 1 - - 100 - - - - Below BBB 9 - - 8 - 92 - - 54 5 - 53 1 18 28 - Total 114 13 - 78 1 8 13 -
Original vintage 2009 Nominal
Original credit enhancements
Original sub-prime exposure Pre-2005 2005 2006 2007 2008-2009
Credit rating £m £m £m % % % % % ABS CDO AAA 12 6 - - 100 - - - AA 12 3 2 100 - - - - A 1 - - 100 - - - - BBB 5 1 2 100 - - - - Below BBB 20 5 10 100 - - - - 50 15 14 76 24 - - - Synthetic CDO A 15 1 - 100 - - - - BBB 16 3 - 100 - - - - Below BBB 64 7 - 100 - - - - 95 11 - 100 - - - - Other CDO AAA 3 1 - 67 - 33 - - AA 51 7 1 39 - 11 50 - A 1 - - - 100 - - - BBB 2 - - 50 50 - - - Below BBB 13 - - 31 - 69 - - 70 8 1 38 5 24 33 - Total 215 34 15 64 17 8 11 - In addition, in the ordinary course of business, the Group entered into long-term interest rate hedging contracts with five investment vehicles whose underlying assets comprise debt securities, bank loans and energy and infrastructure financings. Although the vehicles themselves are not externally rated, the counterparty exposure ranks super-senior to the most senior notes issued by the vehicles and these notes are rated AAA or AA. The total mark-to-market exposure at 30 June 2010 was £104m (2009: £100m).

Business and Financial Review – Interim Management Report
Risk Management continued
64
Collateralised Loan Obligations (a) Fair value movements by geographical location of issuer or counterparty
30 June 2010 movement 2010 30 June 2010
Nominal value 30 June 2010
Book value 30 June 2010
Fair value 30 June 2010 Fair value
as % of nominal Income
statement Reserves Provisions Country £m % £m £m % £m £m £m UK 53 19 49 44 83 2 - - Rest of Europe 36 13 31 23 64 1 - - US 185 68 163 156 84 4 - - Total 274 100 243 223 81 7 - -
30 June 2009 Movement 2009 31 Dec 2009
Nominal value 31 Dec 2009
Book value 31 Dec 2009
Fair value 31 Dec 2009 Fair value
as % of nominal Income
statement Reserves Provisions Country £m % £m £m % £m £m £m UK 93 13 87 82 88 1 - - Rest of Europe 42 6 36 28 67 - - - US 568 81 516 496 87 (1) - - Total 703 100 639 606 86 - - - (b) Vintage of collateralised loan obligations by geographical location of issuer or counterparty
Original vintage 2010 Nominal
Original credit enhancements
Original sub-prime exposure Pre-2005 2005 2006 2007 2008-2010
Country £m £m £m % % % % % UK 53 9 - 17 52 8 23 - Rest of Europe 36 6 - 23 - 46 31 - US 185 43 - 60 6 23 11 - Total 274 58 - 47 14 23 16 -
Original vintage 2009 Nominal
Original credit enhancements
Original sub- prime exposure Pre-2005 2005 2006 2007 2008-2009
Country £m £m £m % % % % % UK 93 13 - 14 59 14 13 - Rest of Europe 42 8 - 22 5 42 31 - US 568 122 - 82 4 10 4 - Total 703 143 - 70 11 12 7 - (c) Fair value movements by credit rating of issuer or counterparty
30 June 2010 movement 2010 30 June 2010
Nominal value 30 June 2010
Book value 30 June 2010
Fair value 30 June 2010 Fair value
as % of nominal Income
statement Reserves Provisions Credit rating £m % £m £m % £m £m £m AAA 13 5 12 12 92 1 - - AA 96 35 86 82 85 3 - - A 100 36 88 84 84 2 - - BBB 62 23 54 43 69 1 - - Below BBB 3 1 3 2 67 - - - Total 274 100 243 223 81 7 - -
30 June 2009 Movement 2009
31 Dec 2009 Nominal value
31 Dec 2009 Book value
31 Dec 2009 Fair value
31 Dec 2009 Fair value as % of nominal
Income statement Reserves Provisions
Credit rating £m % £m £m % £m £m £m AAA 202 29 185 176 87 - - - AA 254 36 225 218 86 - - - A 181 26 161 157 87 - - - BBB 56 8 49 39 70 - - - Below BBB 10 1 19 16 160 - - - Total 703 100 639 606 86 - - -

Business and Financial Review – Interim Management Report
Risk Management continued
65
(d) Vintage of collateralised loan obligations by credit rating of issuer or counterparty
Original vintage 2010 Nominal
Original credit enhancements
Original sub-prime exposure Pre-2005 2005 2006 2007 2008-2010
Credit rating £m £m £m % % % % % AAA 13 3 - 4 19 53 24 - AA 96 20 - 45 36 17 2 - A 100 22 - 68 - 16 16 - BBB 62 13 - 24 1 37 38 - Below BBB 3 - - 100 - - - - Total 274 58 - 47 14 23 16 -
Original vintage 2009 Nominal
Original credit enhancements
Original sub- prime exposure Pre-2005 2005 2006 2007 2008-2009
Credit rating £m £m £m % % % % % AAA 202 41 - 43 28 24 5 - AA 254 51 - 92 6 2 - - A 181 38 - 84 - 8 8 - BBB 56 12 - 24 - 34 42 - Below BBB 10 1 - 70 30 - - - Total 703 143 - 70 11 12 7 - Other investments
Book value Fair value Book value Fair value 30 June 2010
£m 30 June 2010
£m 31 Dec 2009
£m 31 Dec 2009
£m Principal Protected Notes 39 33 24 26 Other 311 311 424 423 350 344 448 449 The Principal Protected Notes are backed by highly rated bank counterparties and are due to mature by the end of 2016. Other investments of £311m (2009: £424m) principally consist of reversionary property securities and, in 2009, a debenture issued by a fellow subsidiary in the Banco Santander, S.A. group that matured in 2010. Exposure to Off-Balance Sheet Entities sponsored by the Group The only SPEs sponsored but not consolidated by the Group are SPEs which issue shares that back retail structured products. The Group's arrangements with these entities comprise the provision of equity derivatives and a secondary market-making service to those retail customers who wish to exit early from these products. As at 30 June 2010, the total value of products issued by the SPEs was £6,842m (2009: £5,798m), and the total value of repurchases held by the Group was £264m (2009: £234m). Credit Derivatives Global Banking & Markets previously operated a credit derivatives business. The business traded in single-name credit derivatives, credit derivative indices and a limited number of portfolio credit derivative transactions. The credit derivatives trading function operated within the same framework as other trading functions. Risk limits were established and monitored. As at 30 June 2010, there were a limited number of remaining credit derivative transactions with a nominal value of £629m (2009: £772m), adjusted for pool factor paydowns, where the Group faced external counterparties and the risk had been hedged with Banco Santander, S.A. in Spain.

Business and Financial Review – Interim Management Report
Principal Risks and Uncertainties
66
Our 2009 Annual Report outlines our assessment of the principal risks and uncertainties facing the Group, together with the processes that are in place to monitor and mitigate those risks where possible. Material risk factors are described in the Risk Factors section on page 192 to 197 of the 2009 Annual Report. Financial risks are described in the Risk Management Report for each segment of the business by type of risk on pages 32 to 65 of this Half Yearly Financial Report. Financial risks are:
> Operational risk; > Credit risk; > Market risk; > Pension obligation risk, and > Liquidity risk.
Material risk factors are:
> Santander UK’s risk management measures may not be successful; > Risks concerning borrower credit quality and general economic conditions are inherent in Santander UK’s business; > The soundness of other financial institutions could materially and adversely affect Santander UK’s business; > Risks associated with liquidity and funding are inherent in Santander UK’s business; > Any reduction in Santander UK’s credit rating could increase its cost of funding and adversely affect its interest
margins; > Market risks associated with fluctuations in interest rates, bond and equity prices and other market factors are inherent
in Santander UK’s business; > Risks associated with strategic decisions regarding organic growth, and potential acquisition and disposals; > Santander UK may incur unanticipated losses related to its recent business combinations; > Santander UK may fail to realise the anticipated benefits of its business combinations; > Santander UK’s business is concentrated in the UK and on the offering of mortgage related products and services; > Santander UK's business is conducted in a highly competitive environment; > Operational risks are inherent in Santander UK’s business; > Santander UK’s business could be affected if its capital is not managed effectively; > Santander UK relies on recruiting, retaining and developing appropriate senior management and skilled personnel; > Reputational risk could cause harm to Santander UK and its business prospects; > Santander UK’s businesses are subject to substantial legislation, regulatory and governmental oversight; > Santander UK is subject to regulatory capital and liquidity requirements that could limit its operations; > In the United Kingdom, Santander UK is responsible for contributing to compensation schemes in respect of banks and
other authorised financial services firms that are unable to meet their obligations to customers; > The UK Banking Act 2009 may adversely affect the Group’s business; and > Risks concerning enforcement of judgements made in the United States.
Looking forward to the second half of the current financial year, we believe that the risks and uncertainties identified in the 2009 Annual Report are still applicable.
Related Party Transactions For a full description of related party activity at 31 December 2009, please refer to Note 45 of the Group’s 2009 Annual Report. Significant changes to these arrangements during the first half of the year are described in Note 26 of the Group’s 2010 condensed consolidated interim financial statements.

Business and Financial Review – Interim Management Report
Forward-looking Statements
67
Santander UK and Banco Santander, S.A. both caution that this Half Yearly Financial Report may contain forward-looking statements. Section 27A of the U.S. Securities Act of 1933, as amended, and Section 21E of the U.S. Securities Exchange Act of 1934, as amended, contain a safe harbour for forward-looking statements on which we rely in making such statements in documents filed with the U.S. Securities and Exchange Commission. Such forward-looking statements are found in various places throughout this Half Yearly Financial Report. Words such as “believes”, “anticipates”, “expects”, “intends”, “aims” and “plans” and other similar expressions are intended to identify forward-looking statements, but they are not the exclusive means of identifying such statements. Forward-looking statements include, without limitation, statements concerning our future business development and economic performance. These forward-looking statements are based on management’s current expectations, estimates and projections and both Santander UK and Banco Santander, S.A. caution that these statements are not guarantees of future performance. We also caution readers that a number of important factors could cause actual results to differ materially from the plans, objectives, expectations, estimates and intentions expressed in such forward-looking statements. Factors that may affect Santander UK’s operations are described under ‘Risk Factors’ in Santander UK’s Annual Report on Form 20-F for 2009. A more detailed cautionary statement is also given on page 5 of Santander UK’s Annual Report on Form 20-F for 2009. When relying on forward-looking statements to make decisions with respect to Santander UK or Banco Santander, S.A., investors and others should carefully consider the foregoing factors and other uncertainties and events. Such forward-looking statements speak only as of the date on which they are made, and we do not undertake any obligation to update or revise any of them, whether as a result of new information, future events or otherwise. Statements as to historical performance, historical share price or financial accretion are not intended to mean that future performance, future share price or future earnings (including earnings per share) for any period will necessarily match or exceed those of any prior year.
General Information This announcement is not a form of statutory accounts. The information for the year ended 31 December 2009 does not constitute statutory accounts, as defined in section 434 of the Companies Act 2006. A copy of the statutory accounts for that year has been delivered to the Registrar of Companies. The auditor’s report on those accounts was unqualified, did not draw attention to any matters by way of emphasis and did not contain a statement under section 498(2) or (3) of the Companies Act 2006.
This report is also available on the Santander UK corporate website (www.aboutsantander.co.uk). British Bankers' Association draft Code for Financial Reporting Disclosure Santander UK has voluntarily adopted the draft British Bankers’ Association Code on Financial Reporting Disclosure (‘the draft BBA Code’) with effect from its 2009 Annual Report on Form 20-F. The draft BBA code sets out five disclosure principles together with supporting guidance. These principles have been applied, as appropriate, in the context of the 2010 Half Yearly Financial Report.

Financial Statements
Independent Review Report to Santander UK plc
68
We have been engaged by Santander UK plc (the ‘Company’) to review the condensed set of financial statements in the half-yearly financial report for the six months ended 30 June 2010 which comprises the Condensed Consolidated Income Statement, the Condensed Consolidated Statement of Comprehensive Income, the Condensed Consolidated Balance Sheet, the Condensed Consolidated Statement of Changes in Equity, the Condensed Consolidated Cash Flow Statement and related Notes 1 to 30. We have read the other information contained in the half-yearly financial report and considered whether it contains any apparent misstatements or material inconsistencies with the information in the condensed set of financial statements. This report is made solely to the Company in accordance with International Standard on Review Engagements (UK and Ireland) 2410 ‘Review of Interim Financial Information Performed by the Independent Auditor of the Entity’ issued by the Auditing Practices Board. Our work has been undertaken so that we might state to the Company those matters we are required to state to them in an independent review report and for no other purpose. To the fullest extent permitted by law, we do not accept or assume responsibility to anyone other than the Company for our review work, for this report, or for the conclusions we have formed. Directors' responsibilities The half-yearly financial report is the responsibility of, and has been approved by, the directors. The directors are responsible for preparing the half-yearly financial report in accordance with the Disclosure and Transparency Rules of the United Kingdom’s Financial Services Authority. As disclosed in the accounting policies, the annual financial statements of the group are prepared in accordance with IFRSs as adopted by the European Union. The condensed set of financial statements included in this half-yearly financial report has been prepared in accordance with International Accounting Standard 34 ‘Interim Financial Reporting’, as issued by the International Accounting Standards Board (‘IASB’), and as adopted by the European Union. Our responsibility Our responsibility is to express to the Company a conclusion on the condensed set of financial statements in the half-yearly financial report based on our review. Scope of Review We conducted our review in accordance with International Standard on Review Engagements (UK and Ireland) 2410 ‘Review of Interim Financial Information Performed by the Independent Auditor of the Entity’ issued by the Auditing Practices Board for use in the United Kingdom. A review of interim financial information consists of making inquiries, primarily of persons responsible for financial and accounting matters, and applying analytical and other review procedures. A review is substantially less in scope than an audit conducted in accordance with International Standards on Auditing (UK and Ireland) and consequently does not enable us to obtain assurance that we would become aware of all significant matters that might be identified in an audit. Accordingly, we do not express an audit opinion. Conclusion Based on our review, nothing has come to our attention that causes us to believe that the condensed set of financial statements in the half-yearly financial report for the six months ended 30 June 2010 is not prepared, in all material respects, in accordance with International Accounting Standard 34 as issued by the IASB and adopted by the European Union, and the Disclosure and Transparency Rules of the United Kingdom's Financial Services Authority.
Deloitte LLP Chartered Accountants and Statutory Auditors London, United Kingdom 26 August 2010 A review does not provide assurance on the maintenance and integrity of the website, including controls used to achieve this, and in particular whether any changes may have occurred to the financial information since first published. These matters are the responsibility of the directors but no control procedures can provide absolute assurance on this area. Legislation in the United Kingdom governing the preparation and dissemination of financial information differs from legislation in other jurisdictions.

Financial Statements
Condensed Consolidated Income Statement
69
For the six months ended 30 June 2010 and 2009
Notes
Six months ended 30 June 2010
£m
Six months ended 30 June 2009
£m Interest and similar income 3,396 3,839 Interest expense and similar charges (1,491) (2,152) Net interest income 1,905 1,687 Fee and commission income 459 469 Fee and commission expense (87) (65) Net fee and commission income 372 404 Net trading and other income 3 333 201 Total operating income 2,610 2,292 Administration expenses (880) (914) Depreciation and amortisation (143) (128) Total operating expenses excluding provisions and charges (1,023) (1,042) Impairment losses on loans and advances (387) (405) Provisions for other liabilities and charges (39) - Total operating provisions and charges (426) (405) Profit before tax 1,161 845 Taxation charge 4 (293) (202) Profit for the period 868 643 Attributable to: Equity holders of the parent 843 599 Non-controlling interests 25 44
All profits during the period were generated from continuing operations.
Condensed Consolidated Statement of Comprehensive Income For the six months ended 30 June 2010 and 2009
Notes
Six months ended 30 June 2010
£m
Six months ended 30 June 2009
£m Profit for the period 868 643 Other comprehensive income: Actuarial losses on retirement benefit obligations 21 (418) (802) Gains on available-for-sale securities 1 3 Exchange differences on translation of foreign operations - (6) Tax on items taken directly to equity 117 224 Net loss recognised directly in equity (300) (581) Losses/(gains) on available-for-sale securities transferred to profit or loss on sale 1 (13) Tax on items transferred to profit - 4 Net transfers to profit 1 (9) Total other comprehensive expense for the period before tax (416) (818) Tax relating to components of other comprehensive income 117 228 Total comprehensive income for the period 569 53 Attributable to: Equity holders of the parent 544 9 Non-controlling interests 25 44
Notes 1 to 30 are an integral part of these condensed consolidated interim financial statements.

Financial Statements
Condensed Consolidated Balance Sheet
70
As at 30 June 2010 and 31 December 2009
Notes
30 June 2010
£m
31 December 2009
£m Assets Cash and balances at central banks 22,493 4,163 Trading assets 6 23,051 33,290 Derivative financial instruments 7 27,897 22,827 Financial assets designated at fair value 8 6,878 12,358 Loans and advances to banks 5,812 9,151 Loans and advances to customers 9 189,678 186,804 Available-for-sale securities 11 806 797 Loans and receivables securities 12 5,718 9,898 Macro hedge of interest rate risk 1,350 1,127 Investments in associated undertakings 85 75 Intangible assets 13 1,459 1,446 Property, plant and equipment 14 872 938 Operating lease assets 15 278 312 Current tax assets 88 85 Deferred tax assets 1,167 946 Other assets 1,050 1,074 Total assets 288,682 285,291 Liabilities Deposits by banks 5,263 5,811 Deposits by customers 148,597 143,893 Derivative financial instruments 24,648 18,963 Trading liabilities 16 36,383 46,152 Financial liabilities designated at fair value 17 5,540 4,423 Debt securities in issue 18 48,903 47,758 Other borrowed funds 19 1,524 1,352 Subordinated liabilities 20 5,243 5,597 Other liabilities 2,323 2,323 Provisions 77 91 Current tax liabilities 653 300 Deferred tax liabilities 306 336 Retirement benefit obligations 21 1,483 1,070 Total liabilities 280,943 278,069 Equity Share capital 23 3,306 2,709 Share premium account 1,857 1,857 Retained earnings 2,413 1,911 Other reserves 31 29 7,607 6,506 Non-controlling interests 132 716 Total shareholders’ equity 7,739 7,222 Total liabilities and equity 288,682 285,291 Notes 1 to 30 are an integral part of these condensed consolidated interim financial statements.

Financial Statements
Condensed Consolidated Statement of Changes in Equity
71
For the six months ended 30 June 2010 and 2009
Other reserves
Notes
Share capital
£m
Share premium
£m
Available for sale reserve
£m
Foreign currency translation reserve
£m
Retained earnings
£m Total
£m
Non-controlling interest
£m Total
£m
1 January 2009 1,148 3,121 18 21 1,678 5,986 711 6,697 Dividends declared 5 - - - - (21) (21) (47) (68) Total comprehensive income (gross) - - (10) (6) (203) (219) 44 (175) Tax relating to components of other
comprehensive income
- - 3 1 224 228 - 228
Reclassification of RCIs 297 - - - - 297 - 297 30 June 2009 1,445 3,121 11 16 1,678 6,271 708 6,979 1 January 2010 2,709 1,857 12 17 1,911 6,506 716 7,222 Dividends declared 5 - - - - (40) (40) (18) (58) Total comprehensive income (gross) - - 2 - 425 427 25 452 Tax relating to components of other
comprehensive income - - - - 117 117 - 117
Issue of preference shares 23 300 - - - - 300 - 300
Redemption of A&L preference shares 24 - - - - - - (294) (294)
Reclassification of Innovative Tier 1 24 297 - - - - 297 (297) -
30 June 2010 3,306 1,857 14 17 2,413 7,607 132 7,739
Condensed Consolidated Cash Flow Statement For the six months ended 30 June 2010 and 2009
Notes
Six months ended 30 June 2010
£m
Six months ended 30 June 2009
£m Net cash flow from/(used in) operating activities Profit for the period 868 643 Adjustments for: Non-cash items included in net profit 1,354 (1,148) Change in operating assets 2,209 9,729 Change in operating liabilities (1,919) (5,047) Income taxes received/(paid) (35) (51) Effects of exchange rate differences (499) (4,877) Net cash flow from/(used in) operating activities 25 1,978 (751) Net cash flows from investing activities Proceeds from disposal of subsidiaries 240 - Investment in associates - (35) Purchase of tangible and intangible fixed assets (127) (225) Proceeds from sale of tangible and intangible fixed assets 66 21 Purchase of non-trading securities (4) (5) Proceeds from sale of non-trading securities 3 1,659 Purchase of non-trading securities (3) - Net cash flow from investing activities 175 1,415 Net cash flow from/(used in) financing activities Issue of loan capital 8,670 - Repayment of loan capital (4,900) (4,903) Dividends paid on preference shares classified in equity (19) - Dividends paid on reserve capital instruments (21) (21) Interest paid on preference shares classified in non-controlling interest - (19) Interest paid on Innovative Tier 1 Capital Securities (17) (17) Net cash flow from/(used in) financing activities 3,713 (4,960) Net increase/(decrease) in cash and cash equivalents 5,866 (4,296) Cash and cash equivalents at beginning of the period 26,364 27,675 Effects of exchange rate changes on cash and cash equivalents (857) (2,594) Cash and cash equivalents at the end of the period 25 31,373 20,785
Notes 1 to 30 are an integral part of these condensed consolidated interim financial statements.

Financial Statements
Notes to the Condensed Financial Statements
72
1. Accounting policies Disclosures required by IFRS 7 ‘Financial Instruments: Disclosure’ relating to the nature and extent of risks arising from financial instruments can be found in the Risk Management section on pages 32 to 65 which form part of these condensed consolidated interim financial statements. Going Concern The Directors have assessed the ability of Santander UK plc (the ‘Company’) and its subsidiaries (together the ‘Group’) to continue as a going concern, in the light of uncertain current and anticipated economic conditions, including analysing the financial resources available to it and stress testing performance forecasts through various scenarios. The Directors confirm they are satisfied that the Group has adequate resources to continue in business for the foreseeable future. For this reason, they continue to adopt the ‘going concern’ basis of accounting for preparing financial statements. General information These condensed consolidated interim financial statements are not a form of statutory accounts. The information for the year ended 31 December 2009 does not constitute statutory accounts as defined in section 434 of the Companies Act 2006. A copy of the statutory accounts for that year has been delivered to the Registrar of Companies. The auditor’s report on those accounts was unqualified, did not draw attention to any matters by way of emphasis and did not contain a statement under section 498(2) or (3) of the Companies Act 2006.
The condensed consolidated interim financial statements have been prepared in accordance with International Accounting Standard (‘IAS’) 34 ‘Interim Financial Reporting’, as issued by the International Accounting Standards Board (‘IASB’) and as adopted for use in the European Union. Accordingly, certain information and disclosures normally required to be included in the notes to the annual financial statements have been omitted or condensed. The condensed consolidated interim financial statements should be read in conjunction with the consolidated financial statements of the Group for the year ended 31 December 2009 which were prepared in accordance with International Financial Reporting Standards (‘IFRS’) as issued by the IASB in addition to being consistent with IFRS as adopted for use in the European Union.
The same accounting policies, presentation and methods of computation are followed in these condensed consolidated interim financial statements as were applied in the presentation of the Group’s 2009 Annual Report except as described below:
In the six months ended 30 June 2010, the Group adopted the following new or revised IFRS: IFRS 3 ‘Business Combinations’ – On 10 January 2008, the IASB issued an amendment to IFRS 3 ‘Business
Combinations’ which clarifies and changes certain elements of accounting for a business combination, including measurement of contingent consideration, step acquisition and intangible assets and also widens the scope of this standard. There are also associated amendments to IAS 27, IAS 28 and IAS 31.
The most significant changes to the Group’s previous accounting policies for business combinations are as follows: > acquisition-related costs which previously would have been included in the cost of a business combination are
included in administrative expenses as they are incurred; > any pre-existing equity interest in the entity acquired is remeasured to fair value at the date of obtaining control, with
any resulting gain or loss recognised in profit or loss; > any changes in the Group’s ownership interest subsequent to the date of obtaining control are recognised directly in
the equity, with no adjustment to goodwill; and > any changes to the cost of acquisition, including contingent consideration, resulting from events after the date of
acquisition are recognised directly in profit or loss. Previously, such changes resulted in an adjustment to goodwill.
Any adjustments to contingent consideration for acquisitions made prior to 1 January 2010 which result in an adjustment to goodwill continue to be accounted for under IFRS 3 (2004) and IAS 27 (2005), for which the accounting policies can be found in the Group’s 2009 Annual Report.
The Group did not make any acquisitions during the period. The condensed consolidated interim financial statements reflect all adjustments that, in the opinion of management of
the Group, are necessary for a fair presentation of the results of operations for the interim period. All such adjustments to the financial information are of a normal, recurring nature. Because the results from common banking activities are so closely related and responsive to changes in market conditions, the results for any interim period are not necessarily indicative of the results that can be expected for the year. Basis of preparation The condensed consolidated interim financial statements have been prepared under the historical cost convention, as modified by the revaluation of available for sale financial assets, financial assets and financial liabilities held at fair value through profit or loss and all derivative contracts.

Financial Statements
Notes to the Condensed Financial Statements continued
73
2. Segments The principal activity of the Group is financial services. The Group’s business is managed and reported on the basis of the following segments:
> Retail Banking; > Corporate Banking; > Global Banking & Markets; > Private Banking; and > Group Infrastructure.
The Group’s segments are strategic business units that offer different products and services. They are managed separately because each business requires different technology and marketing strategies. The Group has five segments. Retail Banking offers a range of personal banking, savings and mortgage products and services, primarily under the brands Santander and Alliance & Leicester. Corporate Banking offers banking services principally to small and mid-sized UK companies under the brand Santander. Global Banking & Markets provides financial markets sales, trading and risk management services, as well as manufacturing retail structured products. It also contains operations in run down. Private Banking offers specialist banking services and offered self-invested pension plans and WRAP products. Group Infrastructure consists of Asset and Liability Management activities, Group Capital, Funding and the Alliance & Leicester treasury asset portfolio.
The segment information below is presented on the basis used by the Company’s board of directors (the ‘Board’) to evaluate performance, in accordance with IFRS 8. The Board reviews discrete financial information for each of its segments, including measures of operating results. The segments are managed primarily on the basis of their results, which are measured on a ‘trading’ basis. The trading basis differs from the statutory basis as a result of the application of various adjustments. Management considers that the trading basis provides the most appropriate way of reviewing the performance of the business. The adjustments are:
> Reorganisation and other costs – These comprise implementation costs in relation to the cost reduction projects
including integration-related expenses, as well as certain remediation administration expenses. Management needs to understand the underlying drivers of the cost base that will remain after these exercises are complete, and does not want this view to be clouded by these costs, which are managed independently.
> Hedging and other variances - The Balance Sheet and Income Statement are subject to mark-to-market volatility, including that arising from the accounting for elements of derivatives deemed under IFRS rules to be ineffective as hedges. Volatility also arises on certain assets previously managed on a fair value basis, and hence classified as fair value through profit or loss under IFRS, that are now managed on an accruals basis. Where appropriate, such volatility is separately identified to enable management to view the underlying performance of the business. In addition, other variances include the reversal of coupon payments on certain equity instruments which are treated as an interest expense in the trading results but are reported below the profit after tax line for statutory purposes.
> Profit on part sale of subsidiaries – These profits are excluded from the results to allow management to understand the underlying performance of the business. In 2010, the profit on sale of certain businesses was excluded. In 2009, there were no such profits.
> Depreciation of operating lease assets - The operating lease businesses are managed as financing businesses and, therefore, management needs to see the margin earned on the businesses. Residual value risk is separately managed. As a result, the depreciation is netted against the related income.
> Capital and other charges – These primarily comprise internal nominal charges for capital invested in the Group’s businesses. Management implemented this charge to assess the effectiveness of capital investments.
30 June 2010
Retail Banking
£m
Corporate Banking
£m
Global Banking
& Markets £m
Private Banking
£m
Group Infrastructure
£m Total
£m Adjustments
£m
Group Total
£m Net interest income/(expense) 1,838 193 - 63 (246) 1,848 57 1,905 Non-interest income 330 74 221 6 8 639 66 705 Total trading income 2,168 267 221 69 (238) 2,487 123 2,610 Total trading expenses (699) (84) (62) (21) (109) (975) (48) (1,023) Impairment losses on loans and advances (356) (31) - - - (387) - (387) Provisions for other liabilities and charges - - - - - - (39) (39) Trading profit/(loss) before tax 1,113 152 159 48 (347) 1,125 36 1,161 Adjust for: - Reorganisation and other costs (53) - - - - (53) - Hedging and other variances (15) - - - 69 54 - Profit on part sale of subsidiaries - - - - 35 35 - Capital and other charges (105) (20) - 4 121 - Profit/(loss) before tax 940 132 159 52 (122) 1,161 Average number of staff 17,238 588 239 344 244 18,653

Financial Statements
Notes to the Condensed Financial Statements continued
74
Adjustments comprise:
Net interest income
£m
Non interest income
£m
Administration expenses
£m
Depreciation and
amortisation £m
Impairment on loans
and advances
£m
Provisions for other liabilities
and charges £m
Profit before
tax £m
Reorganisation and other costs - - 3 (17) - (39) (53) Hedging and other variances 57 (3) - - - - 54 Profit on part sale of subsidiaries - 35 - - - - 35 Depreciation on operating lease assets - 34 - (34) - - - 57 66 3 (51) - (39) 36
30 June 2009
Retail Banking
£m
Corporate Banking
£m
Global Banking
& Markets £m
Private Banking
£m
Group Infrastructure
£m Total
£m Adjustments
£m
Group total
£m Net interest income/(expense) 1,491 150 - 54 (73) 1,622 65 1,687 Non-interest income 346 87 262 6 28 729 (124) 605 Total trading income 1,837 237 262 60 (45) 2,351 (59) 2,291 Total trading expenses (732) (91) (45) (20) (88) (976) (66) (1,042) Impairment losses on loans and advances (365) (19) - (1) (20) (406) - (406) Trading profit/(loss) before tax 740 127 217 39 (154) 970 (125) 845 Adjust for: - Reorganisation and other costs (29) - - - - (29) - Hedging and other variances (6) - - - (89) (96) - Capital and other charges (83) (16) - 4 95 - Profit/(loss) before tax 622 111 217 43 (148) 845 Average number of staff 19,437 592 273 836 336 21,474
Adjustments comprise:
Net interest income
£m
Non interest income
£m
Administration expenses
£m
Depreciation and
amortisation £m
Impairment on loans
and advances
£m
Provisions for other liabilities
and charges £m
Profit before
tax £m
Reorganisation and other costs - - (12) (17) - - (29) Hedging and other variances 65 (161) - - - - (96) Depreciation on operating lease assets - 37 - (37) - - - 65 (124) (12) (54) - - (125) 3. Net trading and other income
Six months ended 30 June 2010
£m
Six months ended 30 June 2009
£m Net trading and funding of other items by the trading book 139 220 Income/(expense) on assets held at fair value through profit or loss 206 (258) Expense on liabilities held at fair value through profit or loss (102) (75) Gains on derivatives managed with assets and liabilities held at fair value through profit or loss 18 295 Income from operating lease assets 44 47 Profit on sale of fixed assets 1 - Hedge ineffectiveness and other (8) (28) Profit on sale of subsidiary undertakings 35 - 333 201
4. Taxation charge Interim period corporation tax is accrued based on the estimated average annual effective corporation tax rate for the year of 25% (2009: 24%). The standard rate of UK corporation tax was 28% (2009: 28%).
The Finance Act 2010, which provides for a reduction in the main rate of UK corporation tax from 28% to 27% effective from 1 April 2011, was substantively enacted on 21 July. As it was not substantively enacted at the balance sheet date, the rate reduction is not yet reflected in these financial statements in accordance with IAS 10, as it is a non-adjusting event occurring after the reporting period. The estimated effect of the rate reduction is not expected to be material.
The UK Government has also indicated that it intends to enact future reductions in the main tax rate of 1% each year down to 24% by 1 April 2014.

Financial Statements
Notes to the Condensed Financial Statements continued
75
5. Dividends No interim dividends were paid on Santander UK plc’s ordinary shares in issue during the period (2009: £nil). An interim dividend of £19m was paid on 24 May 2010 on the £300m fixed/floating rate non-cumulative callable preference shares issued by the Company on 28 April 2010. In addition, the annual dividend of £21m on the Step Up Callable Perpetual Reserve Capital Instruments was paid on 14 February 2010. 6. Trading assets
30 June 2010 £m
31 December 2009 £m
Loans and advances to banks 5,179 5,252 Loans and advances to customers 847 10,628 Debt securities 16,390 15,932 Equity securities 635 1,478 23,051 33,290
Debt securities can be analysed by type of issuer as follows:
30 June 2010 £m
31 December 2009 £m
Issued by public bodies: - Government securities 3,005 2,869 Issued by other issuers: - Bank and building society certificates of deposit: Government guaranteed - 205 - Bank and building society certificates of deposit: Other 1,710 1,730 - Floating rate notes: Government guaranteed 9,860 8,090 - Floating rate notes: Other 1,815 3,038 16,390 15,932
7. Derivative financial instruments 30 June 2010
Derivatives held for trading
Contract/notional amount £m
Fair value assets £m
Fair value liabilities £m
Exchange rate contracts: - Cross-currency swaps 57,612 3,189 638 - Foreign exchange swaps and forwards 43,080 672 467 100,692 3,861 1,105 Interest rate contracts: - Interest rate swaps 452,666 17,413 16,493 - Caps, floors and swaptions 72,268 2,663 2,552 - Futures (exchange traded) 70,004 - 11 - Forward rate agreements 72,981 14 26 667,919 20,090 19,082 Equity and credit contracts: - Equity index and similar products 39,006 843 1,804 - Equity index options (exchange traded) 49,244 394 20 - Credit default swaps and similar products 1,948 34 66 90,198 1,271 1,890 Total derivative assets and liabilities held for trading 858,809 25,222 22,077
30 June 2010
Derivatives held for fair value hedging
Contract/notional amount
£m
Fair value assets £m
Fair value liabilities £m
Exchange rate contracts: - Cross-currency swaps 3,074 718 - Interest rate contracts: - Interest rate swaps 60,707 1,957 2,571 Total derivative assets and liabilities held for fair value hedging 63,781 2,675 2,571 Total recognised derivative assets and liabilities 922,590 27,897 24,648

Financial Statements
Notes to the Condensed Financial Statements continued
76
31 December 2009 Derivatives held for fair value trading
Contract/notional amount £m
Fair value assets £m
Fair value liabilities £m
Exchange rate contracts: - Cross-currency swaps 113,036 3,101 409 - Foreign exchange swaps and forwards 22,496 164 112 135,532 3,265 521 Interest rate contracts: - Interest rate swaps 554,709 14,905 13,226 - Caps, floors and swaptions 80,075 1,767 737 - Futures (exchange traded) 89,379 4 - - Forward rate agreements 77,170 56 61 801,333 16,732 14,024 Equity and credit contracts: - Equity index and similar products 4,736 881 1,311 - Equity index options (exchange traded) 71,662 563 871 - Credit default swaps and similar products 3,737 31 48 80,135 1,475 2,230 Total derivative assets and liabilities held for trading 1,017,000 21,472 16,775
31 December 2009
Derivatives held for fair value hedging
Contract/notional amount £m
Fair value assets £m
Fair value liabilities £m
Exchange rate contracts: - Cross-currency swaps 6,515 860 - Interest rate contracts: - Interest rate swaps 45,093 495 2,185 Equity and credit contracts - Equity index and similar products - - 3 Total derivative assets and liabilities held for fair value hedging 51,608 1,355 2,188 Total recognised derivative assets and liabilities 1,068,608 22,827 18,963
Net gains/losses arising from hedges included in net trading and other income are presented below:
Six months ended 30 June 2010
£m
Six months ended 30 June 2009
£m Net gains/(losses): - on hedging instruments (156) (182) - on the hedged items attributable to hedged risk 164 90 8 (92)
8. Financial assets designated at fair value
30 June 2010 £m
31 December 2009 £m
Loans and advances to customers 6,188 6,379 Debt securities 690 5,979 6,878 12,358
9. Loans and advances to customers Movement in loan loss allowances:
30 June 2010
Loans secured on residential
property £m
Corporate
Loans £m
Finance
leases £m
Other secured
advances £m
Other unsecured advances
£m
Total £m
At 1 January 2010: - Individually assessed 313 185 1 50 341 890 - Collectively assessed 171 172 1 12 53 409 484 357 2 62 394 1,299 Charge/(release) to the income statement: - Individually assessed 104 69 2 21 186 382 - Collectively assessed 10 (39) - 1 37 9 114 30 2 22 223 391 Write offs (7) (17) (2) (8) (204) (238) At 30 June 2010: - Individually assessed 410 237 1 63 323 1,034 - Collectively assessed 181 133 1 13 90 418 591 370 2 76 413 1,452

Financial Statements
Notes to the Condensed Financial Statements continued
77
31 December 2009
Loans secured on residential
property £m
Corporate
Loans £m
Finance
leases £m
Other secured
advances £m
Other unsecured advances
£m
Total £m
At 1 January 2009 - Individually assessed 174 13 - 37 227 451 - Collectively assessed 184 289 1 11 65 550 358 302 1 48 292 1,001 Charge/(release) to the income statement: - Individually assessed 223 172 5 30 539 969 - Collectively assessed (13) (117) - 1 (12) (141) 210 55 5 31 527 828 Write offs (84) - (4) (17) (425) (530) At 31 December 2009: - Individually assessed 313 185 1 50 341 890 - Collectively assessed 171 172 1 12 53 409 484 357 2 62 394 1,299 10. Securitisation of assets In March 2010, the Group raised £1.4bn from a mortgage-backed securitisation through the Fosse Master Trust and, in June 2010, £6.5bn from additional mortgage-backed issuances. There were no such issuances in 2009. In addition, mortgage backed notes totalling £5.4bn (2009: £3.6bn) from previous programmes were redeemed during the first six months of the year. Of the redemptions, £0.5bn (2009:£1.6bn) were notes previously held by the Group for collateral purposes. 11. Available-for-sale securities
30 June 2010 £m
31 December 2009 £m
Debt securities 754 747 Equity securities 52 50 806 797
12. Loan and receivable securities
30 June 2010 £m
31 December 2009 £m
Loan and receivable securities 5,718 9,898 Detailed analysis of these securities is contained in the Risk Management Report. 13. Intangible assets a) Goodwill
30 June 2010 £m
Cost At 1 January and 30 June 1,285 Accumulated impairment At 1 January and 30 June 22 Net book value 1,263
31 December 2009 £m
Cost At 1 January 1,281 Acquisitions 4 At 31 December 1,285 Accumulated impairment At 1 January and 31 December 22 Net book value 1,263

Financial Statements
Notes to the Condensed Financial Statements continued
78
Impairment of goodwill During the period there was no impairment of goodwill (2009: £nil). Impairment testing in respect of goodwill is performed annually, more frequently if there are impairment indicators present, and comprises a comparison of the carrying amount of the cash-generating unit with its recoverable amount: the higher of the cash-generating unit’s fair value less costs to sell and its value in use. Value in use is calculated by discounting the expected future cash flows obtainable as a result of the asset’s continued use, including those resulting from its ultimate disposal, at a market based discount rate on a pre-tax basis.
The following cash-generating units include in their carrying values goodwill that comprises the goodwill reported by the Group. The cash-generating unit does not carry on its balance sheet any other intangible assets with indefinite useful lives.
30 June 2010 Business Division
Cash Generating Unit
Goodwill £m
Basis of valuation
Key assumptions
Discount rate
Growth rate
Retail Banking Santander UK 1,169 Value in use: cash flow 3 year plan 11.5% 10% Retail Banking Cater Allen Private Bank 90 Value in use: cash flow 3 year plan 11.5% 10% Retail Banking Other 4 Value in use: cash flow 3 year plan 11.5% 10% 1,263 In 2010, following the final integration of the Bradford & Bingley savings business with Santander UK plc, its income and expenses are no longer separately identified, reviewed or managed and are instead included in Santander UK plc’s Retail Banking cash generating unit. In addition, in 2010 as a result of the transfer of the assets and liabilities of Alliance & Leicester plc into Santander UK plc under Part VII of the Financial Services and Markets Act 2000, the income and expenses of the former Alliance & Leicester Retail Banking business are no longer separately identified, reviewed or managed and are instead included in Santander UK plc’s Retail Banking cash generating unit.
31 December 2009 Business Division
Cash Generating Unit
Goodwill £m
Basis of valuation
Key assumptions
Discount rate
Growth rate
Retail Banking Alliance & Leicester 774 Value in use: cash flow 3 year plan 10.1% 10% Retail Banking Bradford & Bingley 395 Value in use: cash flow 3 year plan 10.1% 5% Retail Banking Cater Allen Private Bank 90 Value in use: cash flow 3 year plan 10.1% 10% Retail Banking Other 4 Value in use: cash flow 3 year plan 10.1% 10% 1,263 b) Other intangibles 30 June 2010
£m Cost At 1 January 2010 212 Disposal of business (3) Additions 31 Disposals (1) At 30 June 2010 239 Accumulated amortisation / impairment At 1 January 2010 29 Charge for the period 14 At 30 June 2010 43 Net book value 196 31 December 2009
£m Cost At 1 January 2009 95 Additions 120 Disposals (3) At 31 December 2009 212 Accumulated amortisation / impairment At 1 January 2009 7 Charge for the year 22 At 31 December 2009 29 Net book value 183 Other intangible assets consist of computer software. 14. Property, plant and equipment (excluding operating lease assets) During the period, the Group spent approximately £9m (2009: £116m) on the refurbishment of its branches and its new office premises, £40m (2009: £19m) on additions to its office fixtures and equipment and £9m (2009: £3m) on computer software. The Group disposed of £19m (2009: £60m) of office fixtures and equipment during the period.

Financial Statements
Notes to the Condensed Financial Statements continued
79
15. Operating lease assets During the period, the Group spent approximately £37m (2009: £nil) on the acquisition of operating lease assets. The Group disposed of £37m (2009: £nil) of operating lease assets during the period. 16. Trading liabilities
30 June 2010 £m
31 December 2009 £m
Deposits by banks 31,769 40,824 Deposits by customers 3,317 4,115 Short positions in securities and unsettled trades 1,279 1,071 Debt securities in issue 18 142 36,383 46,152
17. Financial liabilities designated at fair value
30 June 2010 £m
31 December 2009 £m
Deposits by banks - 45 Deposits by customers 8 12 Debt securities in issue - US$ Euro Commercial Paper Programme 759 662
- US$20bn Euro Medium-Term Note Programme 4,641 3,577 - Other bonds 132 127
5,540 4,423 18. Debt securities in issue
30 June 2010 £m
31 December 2009 £m
Bonds and medium-term notes: - Euro 25bn Global Covered Bond Programme 7,151 5,355 - US$20bn Euro Medium-Term Note Programme 1,246 1,566 - US$40bn Euro Medium-Term Note Programme 4,996 5,876 - US$20bn Commercial Paper Programme 3,665 6,366 - Euro 2bn Structured Notes Programme 597 600 - Certificates of deposit in issue 11,086 9,188 28,741 28,951 Securitisation programmes: - Holmes 10,749 14,704 - Fosse 9,413 4,103 48,903 47,758 19. Other borrowed funds
30 June 2010 £m
31 December 2009 £m
£175m Fixed/Floating Rate Tier One Preferred Income Capital Securities 205 195 $1,000m Non-Cumulative Trust Preferred Securities 969 813 £325m Sterling Preference Shares 350 344 1,524 1,352
20. Subordinated liabilities On 20 April 2010, all of the outstanding £200m 5.25% Subordinated Notes 2015 were redeemed at a redemption price equal to 100% of the principal amount thereof, together with accrued interest thereon.
On 20 April 2010, all of the outstanding euro 500m Subordinated Floating Rate EURIBOR Notes 2015 were redeemed at a redemption price equal to 100% of the principal amount thereof, together with accrued interest thereon.

Financial Statements
Notes to the Condensed Financial Statements continued
80
21. Retirement benefit obligations The amounts recognised in the balance sheet were as follows:
30 June 2010 £m
31 December 2009 £m
Assets/(Liabilities) Funded defined benefit pension scheme 1 1 Funded defined benefit pension scheme (1,461) (1,048) Unfunded defined benefit pension scheme (13) (13) Net defined benefit obligation (1,473) (1,060) Post-retirement medical benefits (unfunded) (10) (10) Total net liabilities (1,483) (1,070)
Defined Contribution Pension schemes The Group operates a number of defined contribution pension schemes. The Stakeholder scheme introduced in 2001 was the principal scheme until 1 December 2009 when the Santander Retirement Plan, an occupational defined contribution scheme was introduced, into which eligible employees were enrolled automatically. From 1 April 1998, employees of the Alliance & Leicester group were eligible to join a defined contribution section of the Alliance & Leicester Pension Scheme.
The assets of the schemes are held and administered separately from those of the Company. In the case of the Stakeholder scheme the assets are held in an independently administered fund, and in the case of the Santander Retirement Plan and the Alliance & Leicester Pension Scheme, the assets are held in separate trustee-administered funds.
An expense of £14m (six months ended 30 June 2009: £9m) was recognised for defined contribution plans in the period, and is included in staff costs classified within administration expenses in the Income Statement. None of this amount was recognised in respect of key management personnel (2009: none). Defined Benefit Pension schemes The Group operates a number of defined benefit pension schemes. The Abbey National Amalgamated Pension Fund, Abbey National Group Pension Scheme, Abbey National Associated Bodies Pension Fund, the National & Provincial Building Society Pension Fund, the Scottish Mutual Assurance Staff Pension Scheme, the Scottish Provident Institution Staff Pension Fund and the Alliance & Leicester Pension Scheme are the principal pension schemes within the Group, covering 27% (2009: 27%) of the Group’s employees, and are all funded defined benefit schemes. All are closed schemes, and under the projected unit method, the current service cost when expressed as a percentage of pensionable salaries will gradually increase over time.
Formal actuarial valuations of the assets and liabilities of the schemes are carried out on a triennial basis (and currently a biennial basis for the Alliance & Leicester Pension Scheme) by an independent professionally qualified actuary and valued for accounting purposes at each balance sheet date. The latest formal actuarial valuation was made as at 31 March 2007 for the Abbey National Amalgamated Pension Fund, Abbey National Group Pension Scheme, Abbey National Associated Bodies Pension Fund and the National & Provincial Building Society Pension Fund; as at 31 December 2006 for the Scottish Mutual Assurance Staff Pension Scheme and the Scottish Provident Institution Staff Pension Fund; and as at 31 March 2008 for the Alliance & Leicester Pension Scheme. The latest formal actuarial valuations of the assets and liabilities of the schemes are expected to be completed in early 2011.
The total amount charged to the income statement, including amounts classified as redundancy costs, was determined as follows:
Six months ended 30 June 2010
£m
Six months ended 30 June 2009
£m
Current service cost 17 25 Past service cost 5 17 Expected return on pension scheme assets (157) (139) Interest cost 179 163 44 66 The net liability recognised in the balance sheet was determined as follows: 30 June 2010
£m 31 December 2009
£m Present value of defined benefit obligation (6,781) (6,308) Fair value of plan assets 5,308 5,248 Net defined benefit obligation (1,473) (1,060) Movements in the defined benefit obligations during the period were as follows:
2010 £m
Balance at 1 January (6,308) Current service cost (17) Interest cost (179) Employee contributions (10) Past service cost (5) Actuarial loss (376) Actual benefit payments 114 Balance at 30 June (6,781)

Financial Statements
Notes to the Condensed Financial Statements continued
81
2009 £m
Balance at 1 January (5,175) Current service cost (44) Interest cost (326) Employee contributions (11) Past service cost (50) Actuarial loss (935) Actual benefit payments 233 Balance at 31 December (6,308) Movements in the present value of fair value of scheme assets during the period were as follows:
2010 £m
Balance at 1 January 5,248 Expected return on scheme assets 157 Actuarial loss on scheme assets (42) Company contributions paid 49 Employee contributions 10 Actual benefit payments (114) Balance at 30 June 5,308
2009 £m
Balance at 1 January 4,372 Expected return on scheme assets 285 Actuarial gain on scheme assets 329 Company contributions paid 484 Employee contributions 11 Actual benefit payments (233) Balance at 31 December 5,248 The amounts recognised in the Consolidated Statement of Comprehensive Income for each of the six month periods indicated were as follows:
Six months ended 30 June 2010
£m
Six months ended 30 June 2009
£m Actuarial loss on scheme assets 42 83 Experience gain on scheme liabilities (90) (13) Loss from changes in actuarial assumptions 466 732 Actuarial loss on scheme liabilities 376 719 Total net actuarial loss 418 802 The actual gain/(loss) on scheme assets was £115m (2009: £614m) for the period. Cumulative net actuarial losses of £1,186m (2009: £768m) were recognised in the Consolidated Statement of Comprehensive Income. The Group’s pension schemes did not directly hold any equity securities of the Company or any of its related parties at 30 June 2010 and 31 December 2009. In addition, the Group does not hold insurance policies over the schemes, and has not entered into any significant transactions with the schemes.
The assets of the funded plans are held independently of the Group’s assets in separate trustee administered funds. The principal duty of the trustees is to act in the best interests of the members of the schemes. Ultimate responsibility for investment strategy rests with the trustees of the schemes who are required under the Pensions Act 2004 to prepare a statement of investment principles.
The trustees of the Group’s schemes have developed the following investment principles:
> To maintain a portfolio of suitable assets of appropriate quality, suitability and liquidity which will generate income and capital growth to meet, together with new contributions from members and the employers, the cost of current and future benefits which the pension scheme provides, as set out in the trust deed and rules.
> To limit the risk of the assets failing to meet the liabilities, over the long-term and on a shorter-term basis as required by prevailing legislation.
> To minimise the long-term costs of the pension scheme by maximising the return on the assets whilst having regard to the objectives shown above.
Asset allocation strategies were reviewed in 2009, and automatic rebalancing to the central benchmark positions was suspended as a result of the unprecedented volatility in asset markets during this period. Future allocation strategies will be set to allow for a more dynamic approach. Implementation of these strategies began in 2009 and continued during 2010 whilst taking into account market conditions.

Financial Statements
Notes to the Condensed Financial Statements continued
82
Previously, the statement of investment principles for the main schemes (other than the Alliance & Leicester Pension Scheme) had set the long-term target allocation of plan assets as 48% Equities, 30% Bonds and 22% Gilts. The statement of investment principles for the Alliance & Leicester Pension Scheme had set the long-term target allocation of plan assets at 25% Equities, 25% alternative return-seeking assets (including Property), 25% Bonds and 25% Gilts. Movement towards this long-term target continued during 2010.
The categories of assets in the scheme by value and as a percentage of total scheme assets, and the expected rates of return are as follows:
Fair value of scheme assets Expected rate
of return Fair value of scheme assets Expected rate
of return
30 June 2010 £m
30 June 2010 %
30 June 2010 %
31 December 2009 £m
31 December 2009 %
31 December 2009 %
UK equities 820 15 7.8 1,045 20 8.1 Overseas equities 1,006 19 8.2 1,027 20 8.5 Corporate bonds 1,420 27 5.2 1,503 29 6.2 Government Fixed Interest 782 15 4.5 686 13 3.9 Government Index Linked 693 13 4.5 664 13 3.9 Property funds 66 1 6.3 58 1 6.3 Cash 176 3 4.7 177 3 4.1 Other 345 7 8.0 88 1 8.3 5,308 100 6.1 5,248 100 6.4 Other assets consist of asset-backed securities, annuities, funds (including private equity funds) and derivatives that are used to protect against exchange rate, inflation and interest rate movements.
The expected return on plan assets is determined by considering the expected returns available on the assets underlying the current investment policy, as follows: > Equities Long-term median real rate of return experienced after considering projected movements
in asset indices. > Corporate bonds Gross redemption yields as at the balance sheet date, less a margin for default risk. > Government bonds Gross redemption yields as at the balance sheet date. > Property funds Average of returns for UK equities and government bonds. > Cash Expected long-term bank rate, after considering projected inflation rate. The following tables summarise the fair values at 30 June 2010 and 31 December 2009 of the financial asset classes accounted for at fair value, by the valuation methodology used by the investment managers of the schemes assets to determine their fair value. The tables also disclose the percentages that the recorded fair values of financial assets represent of the schemes’ total financial assets that are recorded at fair value. At 30 June 2010
Quoted prices in active markets Internal models based on market observable data
Total
Category of plan assets £m % £m % £m % UK equities 820 16 - - 820 16 Overseas equities 1,006 20 - - 1,006 20 Corporate bonds 1,420 28 - - 1,420 28 Government Fixed Interest 782 15 - - 782 15 Government Index Linked 693 13 - - 693 13 Property funds 66 1 - - 66 1 Other - - 345 7 345 7 Total 4,787 93 345 7 5,132 100 At 31 December 2009
Quoted prices in active markets Internal models based on market observable data
Total
Category of plan assets £m % £m % £m % UK equities 1,045 21 - - 1,045 21 Overseas equities 1,028 20 - - 1,028 20 Corporate bonds 1,503 30 - - 1,503 30 Government Fixed Interest 686 13 - - 686 13 Government Index Linked 663 13 - - 663 13 Property funds 58 1 - - 58 1 Other - - 88 2 88 2 Total 4,983 98 88 2 5,071 100 Plan assets are stated at fair value based upon quoted prices in active markets with the exception of those classified under “Other”. Of the assets in the “Other” category, investments in absolute return funds, and foreign exchange, equity and interest rate derivatives were valued by investment managers by reference to market observable data. Private equity funds were valued by reference to their latest published accounts whilst the insured annuities were valued by scheme actuaries based on the liabilities insured.

Financial Statements
Notes to the Condensed Financial Statements continued
83
The principal actuarial assumptions used for the Group’s defined benefit schemes were as follows:
30 June 2010 %
31 December 2009 %
To determine benefit obligations: - Discount rate for scheme liabilities 5.3 5.8 - General price inflation 3.3 3.4 - General salary increase 3.3 3.4 - Expected rate of pension increase 3.2 3.3 To determine net periodic benefit cost: - Discount rate 5.8 6.4 - Expected rate of pension increase 3.4 3.0 - Expected rate of return on plan assets 6.1 6.4 Medical cost trend rates: - Initial rate 5.5 5.5 - Ultimate rate 4.5 4.5 - Year of ultimate rate 2013 2013 Years Years Longevity at 60 for current pensioners, on the valuation date: - Males 27.6 27.6 - Females 30.0 30.0 Longevity at 60 for future pensioners currently aged 40, on the valuation date: - Males 29.7 29.7 - Females 31.3 31.3 The rate used to discount the retirement benefit obligation is determined to reflect duration of the liabilities based on the annual yield at 30 June of the sterling 15+ year AA Corporate Bond iBoxx Index, representing the market yield of high quality corporate bonds on that date, adjusted to match the terms of the scheme liabilities. The inflation assumption is set based on the Bank of England projected inflation rates over the duration of scheme liabilities weighted by projected scheme cash flows.
The mortality assumption used in preparation of the valuation was the Continuous Mortality Investigation Table PXA 92MCC 2009 with a future improvement underpin of 1% for males and 0.5% for females. The table above shows that a participant retiring at age 60 as at 30 June 2010 is assumed to live for, on average, 27.6 years in the case of a male and 30.0 years in the case of a female. In practice, there will be variation between individual members but these assumptions are expected to be appropriate across all participants. It is assumed that younger members will live longer in retirement than those retiring now. This reflects the expectation that mortality rates will continue to fall over time as medical science and standards of living improve. To illustrate the degree of improvement assumed the table also shows the life expectancy for members aged 40 now, when they retire in 20 years time at age 60.
The Group determined its expense measurements above based upon long-term assumptions taking into account target asset allocations of assets set at the beginning of the period, offset by actual returns during the period. Period-end obligation measurements are determined by reference to market conditions at the balance sheet date. Assumptions are set in consultation with third party advisors and in-house expertise.
The following table shows the effect of changes in actuarial assumptions on the principal pension schemes of the Group:
Increase/(decrease)
2010 £m
2009 £m
Discount rate Change in pension obligation at period end from a 25 bps increase (287) (345) Change in 2010 pension cost from a 25 bps increase (5) (6) General price inflation Change in pension obligation at period end from a 25 bps increase 276 332 Change in 2010 pension cost from a 25 bps increase 17 16 Expected rate of return on plan assets Change in 2010 pension cost from a 25 bps increase (10) (8) Mortality Change in pension obligation from each additional year of longevity
assumed 118 141
Participation of Group companies in the principal pension schemes is governed by the Pensions Acts 1995 and 2004. Under the 1995 Pensions Act, a company ceasing to participate in a pension scheme is required under section 75 to pay a deficit reduction contribution certified by the scheme actuary, of any deficit relating to its employees, assessed on the basis of the cost of securing accrued benefits with an insurance company unless other arrangements are agreed with the trustees.
As part of revised arrangements relating to the funding of the Group’s defined benefit pension schemes, £809m (2009: £814m) of securities and other assets have been pledged to cover the Group’s obligations.

Financial Statements
Notes to the Condensed Financial Statements continued
84
Post Retirement Medical Benefit Plans The Group also operates unfunded post retirement medical benefit plans for certain of its former employees. The post retirement medical benefit plans in operation are accounted for in the same manner as defined benefit pension plans.
Formal actuarial valuations of the liabilities of the schemes are carried out on a triennial basis by an independent professionally qualified actuary and updated for accounting purposes at each balance sheet date. The latest formal actuarial valuation was made as at 31 December 2006 and updated to 31 December 2009 by a qualified independent actuary.
Actuarial assumptions used for the Group’s post retirement medical benefit plans are the same as those used for the Group’s defined benefit pension schemes. There was an actuarial loss during the six months ended 30 June 2010 of £nil (2009: £1m) on the Group’s post-retirement medical benefits liability. A one percentage point movement in medical cost trends would increase or decrease the post-retirement medical benefit liability and interest cost by £1m (2009: £1m). 22. Contingent liabilities and commitments Financial Services Compensation Scheme The Financial Services Compensation Scheme (‘FSCS’), the UK’s statutory fund of last resort for customers of authorised financial services firms, pays compensation if a firm is unable to meet its obligations as they fall due. As a result of the failure of a number of deposit-taking institutions during the second half of 2008, the FSCS now stands as a creditor of Bradford & Bingley plc and the administrations of Heritable Bank, Kaupthing Singer & Friedlander and Landsbanki ‘Icesave’. The FSCS has borrowed from HM Treasury to fund the compensation costs associated with those failures. These borrowings are currently on an interest-only basis until 31 March 2012.
The FSCS fulfils its obligations by raising management expenses levies and compensation levies on the industry. In relation to compensation relating to protected deposits, each deposit-taking institution contributes towards these levies in proportion to their share of total protected deposits, subject to a threshold set by the Financial Services Authority establishing the maximum that FSCS can levy for compensation in any one year. The limit on the FSCS management expenses for the three years from September 2008 in relation to the above-mentioned failures has been capped at £1bn per annum. The FSCS has the power to raise levies on firms who have ceased to participate in the scheme and are in the process of ceasing to be authorised (so called ‘exit levies’) for the amount that the firm would otherwise have been asked to pay during the relevant levy year.
The proportion of the total FSCS management and compensation costs borne by a deposit taker in any FSA fee year is determined by the deposit taker’s share of protected deposits at the preceding 31 December. Consequently, the obligation to pay costs in relation to FSA fee year 1 April 2011 to 31 March 2012 is not incurred until 31 December 2010, and therefore no charge for FSCS costs for this period has been made in the accounts as at 30 June 2010. The Group has accrued for its share of management expenses levies for the 2009/10 and 2010/11 levy years in the amount of £101m (31 December 2009: £101m).
The FSCS will receive funds from asset sales, surplus cashflow, or other recoveries from each of the above-named banks. These recoveries will be used to reduce the principal amount outstanding on the FSCS’s borrowings. Only after the interest only period, which is expected to end on 31 March 2012, will a schedule for repayment of any remaining principal outstanding (after recoveries) on the borrowings be agreed between the FSCS and HM Treasury. It is expected that, from that point, the FSCS will begin to raise compensation levies (principal repayments) relating to the above-named banks. No provision for compensation levies, which could be significant, has been made in these Condensed Consolidated Financial Statements.
Overseas tax claim A claim was filed against Abbey National Treasury Services plc by tax authorities abroad in relation to the refund of certain tax credits and other associated amounts. Following modifications to the demand, its nominal amount stands at £69m at the balance sheet exchange rate (2009: £74m). At 30 June 2010, additional interest in relation to the demand could amount to £34m at the balance sheet exchange rate (2009: £34m). A favourable judgment was handed down at first instance in September 2006, which was appealed against by the tax authorities in January 2007. In June 2010, the Court ruled in favour of the tax authorities. Abbey National Treasury Services plc intends to file an appeal to the next stage. Regulatory The Group engages in discussion and fully co-operates with the UK Financial Services Authority in their enquiries, including those exercised under statutory powers, regarding its interaction with past and present customers and policyholders both as part of the UK Financial Services Authority's general thematic work and in relation to specific products and services. Other As part of the sale of subsidiaries, and as is normal in such circumstances, the Group has given warranties and indemnities to the purchasers. Appropriate provisions are maintained to cover the above matters.

Financial Statements
Notes to the Condensed Financial Statements continued
85
23. Share capital
30 June 2010 £m
31 December 2009 £m
Ordinary share capital 2,412 2,412 £300m fixed/floating rate non-cumulative callable preference shares 300 - £300m Innovative Tier 1 Capital Securities 297 - £300m Step-up Callable Perpetual Reserve Capital Instruments 297 297 3,306 2,709 £300m fixed/floating rate non-cumulative callable preference shares On 28 April 2010, the Company issued £300m fixed/floating rate non-cumulative callable preference shares (pursuant to a scheme of arrangement under Part 26 of the UK Companies Act 2006) on substantially similar terms to, and in exchange for, the £300m fixed/floating rate non-cumulative callable preference shares previously issued by Alliance & Leicester plc. The preference shares entitle the holders to a fixed non-cumulative dividend, at the discretion of the Company, of 6.22% per annum payable annually from 24 May 2010 until 24 May 2019 and quarterly thereafter at a rate of 1.13% per annum above three month sterling LIBOR. The preference shares are redeemable only at the option of the Company on 24 May 2019 or on each quarterly dividend payment date thereafter. No such redemption may be made without the consent of the UK Financial Services Authority. £300m Innovative Tier 1 Capital Securities The Tier 1 securities originally issued by Alliance & Leicester plc which have been transferred to the Company under the terms of the transfer under Part VII of the Financial Services and Markets Act 2000 are perpetual securities and pay a coupon on 22 March each year. At each payment date, the Company can decide whether to declare or defer the coupon indefinitely. If a coupon is deferred then the Company may not pay a dividend on any share until it next makes a coupon payment (including payment of any deferred coupons). The Company can be obliged to make payment in the event of winding up. The coupon is 5.827% per annum until 22 March 2016. Thereafter the coupon steps up to a rate, reset every five years, of 2.13% per annum above the gross redemption yield on a UK Government Treasury Security. The Tier 1 securities are redeemable at the option of the Company on 22 March 2016 or on each payment date thereafter. No such redemption may be made without the consent of the UK Financial Services Authority. In 2010 and 2009, the coupon was paid. 24. Non-controlling interests
30 June 2010 £m
31 December 2009 £m
Non-controlling interest in subsidiary 132 125 £300m Innovative Tier 1 Capital Securities - 297 £300m fixed/floating rate non-cumulative callable preference shares - 294 132 716 On 28 May 2010, under the terms of the transfer under Part VII of the Financial Services and Markets Act 2000, the issuer of the £300m Innovative Tier 1 Capital Securities changed from Alliance & Leicester plc to the Company. As a result, the instruments were reclassified in the Group’s consolidated financial statements from non-controlling interests to equity.
As further described in Note 23 above, on 28 April 2010, the £300m fixed/floating rate non-cumulative callable preference shares previously issued by Alliance & Leicester plc were exchanged for a new issue of preference shares by the Company on substantially similar terms.

Financial Statements
Notes to the Condensed Financial Statements continued
86
25. Cash flow statement a) Reconciliation of profit after tax to net cash inflow/(outflow) from operating activities:
Six months ended 30 June 2010
£m
Six months ended 30 June 2009
£m Profit for the period 868 643 Non-cash items included in net profit Depreciation and amortisation 143 128 Increase in prepayments and accrued income (186) (75) Increase/(decrease) in accruals and deferred income 534 (1,813) Provision for impairment, liabilities and charges 430 443 Profit on disposal of subsidiaries (35) - Other non-cash items 468 169 2,222 (505) Changes in operating assets and liabilities Net decrease/(increase) in trading assets 1,066 (1,924) Net (increase)/decrease in derivative assets (5,070) 9,777 Net (increase)/decrease in financial assets designated at fair value 5,504 (1,000) Net decrease in loans and advances to banks and customers 529 2,160 Net decrease in other assets 180 716 Net increase/(decrease) in deposits by banks and customers 3,720 (3,298) Net increase/(decrease) in derivative liabilities 5,685 (4,592) Net (decrease)/increase in trading liabilities (9,772) 9,910 Net increase/(decrease) in financial liabilities designated at fair value 1,119 (2,906) Net decrease in debt securities in issue (2,743) (3,184) Net increase/(decrease) in other liabilities 72 (977) Effects of exchange rate differences (499) (4,877) Net cash flow from/(used in) operating activities before tax before tax 2,013 (700) Income tax paid (35) (51) Net cash flow from/(used in) operating activities 1,978 (751)
b) Analysis of the balances of cash and cash equivalents in the balance sheet
30 June 2010 £m
31 December 2009
£m Cash and balances with central banks 22,493 4,163 Debt securities 2,792 1,966 Loans and advances to banks 2,862 4,881 Net trading other cash equivalents 784 8,827 Net non trading other cash equivalents 2,442 6,527 Cash and cash equivalents 31,373 26,364
26. Related party disclosures There have been no related party transactions, or changes to related party transactions, in the first six months of the current financial year which have materially affected the financial position or performance of the Group, except as described below: Banco Santander, S.A. and Banco Santander Totta, S.A. During the period, euro 3,265m (2009: euro 225m) of the Group’s holdings of AAA rated prime mortgage backed securities were sold to Banco Santander, S.A. (2009: sold to the issuer, Banco Santander Totta, S.A.). Although Banco Santander. S.A. and Banco Santander Totta, S.A. are related parties of the Group, the transactions are considered to be commercial deals, with a normal sharing of profits. 27. Events after the balance sheet date On 3 August 2010, Banco Santander S.A., through a wholly-owned Spanish-based subsidiary Santusa Holding, S.L., injected capital of £4,456m of equity capital into Santander UK plc, to support organic and inorganic growth as well as a planned reorganisation of Banco Santander, S.A. group companies in the UK.

Financial Statements
Notes to the Condensed Financial Statements continued
87
On 4 August 2010, the Company reached an agreement to acquire (subject to certain conditions) the parts of the banking businesses of the Royal Bank of Scotland Group (“RBS”) which are carried out through its RBS branches in England and Wales and its NatWest branches in Scotland. The consideration for the acquisition, subject to completion adjustments, comprises £350m of goodwill relative to a notional equity value of approximately £1.3bn as at 31 December 2009. The process of transferring the RBS and NatWest branches, together with associated customers and accounts, is expected to take place around the end of 2011 and will be undertaken in accordance with Part VII of the Financial Services and Markets Act 2000. The transfers will be subject to FSA support and Court sanction. As at 31 December 2009, the RBS business had £21.5bn of assets, £22.4bn of deposits and around 2 million customers. The acquisition, upon completion, is expected to include 311 RBS branches in England and Wales and seven NatWest branches in Scotland; 40 SME banking centres and more than 400 relationship managers; four corporate banking centres and three private banking centres; and around 5,000 employees. The acquisition is an important strategic step for Santander UK towards realising its goal to become a full-service commercial bank. It further strengthens its retail banking business, and significantly accelerates its plans in the small and medium-sized enterprises (SME) sector, increasing its market share from 3% to over approximately 8% (on an asset basis of SME businesses with turnover up to £25m per annum). 28. Financial Instruments Fair value valuation bases The following tables summarise the fair values at 30 June 2010 and 31 December 2009 of the asset and liability classes accounted for at fair value, by the valuation methodology used by the Group to determine their fair value. The tables also disclose the percentages that the recorded fair values of financial assets and liabilities represent of the total assets and liabilities, respectively, that are recorded at fair value in the balance sheet:
Internal models based on At 30 June 2010 Quoted prices in active markets
Market observable data
Significant unobservable data Total
Valuation technique
Balance sheet category £m % £m % £m % £m %
Assets
Trading assets Loans and advances to banks - - 5,179 9 - - 5,179 9 A Loans and advances to customers - - 847 1 - - 847 1 A Debt securities 16,390 28 - - - - 16,390 28 - Equity securities 632 1 - - 3 - 635 1 B Derivative assets Exchange rate contracts - - 4,537 8 42 - 4,579 8 A Interest rate contracts - - 22,047 38 - - 22,047 38 A & C Equity and credit contracts 205 - 938 2 128 - 1,271 2 B Financial assets at FVTPL Loans and advances to customers - - 6,138 10 50 - 6,188 10 A Debt securities - - 326 1 364 1 690 2 A Available-for-sale financial Debt securities 754 1 - - - - 754 1 - assets Equity securities 11 - 41 - - - 52 - B Total assets at fair value 17,993 30 40,053 69 587 1 58,632 100
Liabilities Trading liabilities Deposits by banks - - 31,769 48 - - 31,769 48 A Deposits by customers - - 3,317 5 - - 3,317 5 A Short positions 1,279 2 - - - - 1,279 2 - Debt securities in issue - - 18 - - - 18 - A Derivative liabilities Exchange rate contracts - - 1,105 1 - - 1,105 1 A Interest rate contracts - - 21,653 33 - - 21,653 33 A & C Equity and credit contracts - - 1,728 3 162 - 1,890 3 B Financial liabilities at FVTPL Deposits by customers - - 8 - - - 8 - A Debt securities in issue - - 5,435 8 97 - 5,532 8 A Total liabilities at fair value 1,279 2 65,033 98 259 - 66,571 100

Financial Statements
Notes to the Condensed Financial Statements continued
88
Internal models based on At 31 December 2009
Quoted prices in active markets
Market observable data
Significant unobservable data Total
Valuation technique
Balance sheet category £m % £m % £m % £m %
Assets
Trading assets Loans and advances to banks - - 5,252 8 - - 5,252 8 A Loans and advances to customers - - 10,628 15 - - 10,628 15 A Debt securities 15,932 23 - - - - 15,932 23 - Equity securities 1,471 2 - - 7 - 1,478 2 B Derivative assets Exchange rate contracts - - 4,088 6 37 - 4,125 6 A Interest rate contracts 4 - 17,223 25 - - 17,227 25 A & C Equity and credit contracts 258 - 1,060 2 157 - 1,475 2 B Financial assets at FVTPL Loans and advances to customers - - 6,116 9 263 - 6,379 9 A Debt securities - - 4,498 7 1,481 2 5,979 9 A Available-for-sale financial Debt securities 747 1 - - - - 747 1 -
Assets Equity securities 20 - 30 - - - 50 - B Total assets at fair value 18,432 26 48,895 72 1,945 2 69,272 100
Liabilities Trading liabilities Deposits by banks - - 40,824 59 - - 40,824 59 A Deposits by customers - - 4,115 6 - - 4,115 6 A Short positions 1,071 2 - - - - 1,071 2 - Debt securities in issue - - 142 - - - 142 - A Derivative liabilities Exchange rate contracts - - 521 1 - - 521 1 A Interest rate contracts - - 16,208 23 - - 16,208 23 A & C Equity and credit contracts 29 - 1,945 3 260 - 2,234 3 B Financial liabilities at FVTPL Deposits by banks - - 45 - - - 45 - A Deposits by customers - - 12 - - - 12 - A Debt securities in issue - - 4,257 6 109 - 4,366 6 A Total liabilities at fair value 1,100 2 68,069 98 369 - 69,538 100
The following tables presents the fair values at 30 June 2010 and 31 December 2009 of the above financial assets and liabilities by product, analysed by the valuation methodology used by the Group to determine their fair value. The tables also disclose the percentages that the recorded fair values of products represent of the total assets and liabilities, respectively, that are recorded at fair value in the balance sheet: 30 June 2010
Internal models based on
Product Quoted prices in active
markets Market
observable data Significant
unobservable data Total £m % £m % £m % £m % Assets Government and government-guaranteed debt securities 3,005 5 - - - - 3,005 5 Asset-backed securities - - 326 1 364 1 690 2 Floating rate notes 11,675 20 - - - - 11,675 20 Other debt securities 2,464 4 - - 50 - 2,514 5 UK Social housing association loans - - 6,138 10 - - 6,138 10 Term deposits and money market instruments - - 6,026 10 - - 6,026 10 Exchange rate derivatives - - 4,537 8 42 - 4,579 8 Interest rate derivatives - - 22,047 38 - - 22,047 37 Equity and credit derivatives 205 - 938 2 128 - 1,271 2 Ordinary shares and similar securities 643 1 41 - 3 - 687 1 17,992 30 40,053 69 587 1 58,632 100 Liabilities Exchange rate derivatives - - 1,105 1 - - 1,105 1 Interest rate derivatives - - 21,653 33 - - 21,653 33 Equity and credit derivatives - - 1,728 3 162 - 1,890 3 Deposits - - 40,547 61 - - 40,547 61 Debt securities in issue 1,279 2 - - 97 - 1,376 2 1,279 2 65,033 98 259 - 66,571 100

Financial Statements
Notes to the Condensed Financial Statements continued
89
At 31 December 2009 Internal models based on
Product Quoted prices in active
markets Market
observable data Significant
unobservable data Total £m % £m % £m % £m %
Assets Government and government-guaranteed debt securities 3,074 4 - - - - 3,074 4 Asset-backed securities - - 4,498 7 1,481 2 5,979 9 Floating rate notes 11,128 16 - - - - 11,128 16 Other debt securities 2,477 4 - - 263 - 2,740 4 UK Social housing association loans - - 6,116 9 - - 6,116 9 Term deposits and money market instruments - - 15,880 23 - - 15,880 23 Exchange rate derivatives - - 4,088 6 37 - 4,125 6 Interest rate derivatives 4 - 17,223 25 - - 17,227 25 Equity and credit derivatives 258 - 1,060 2 157 - 1,475 2 Ordinary shares and similar securities 1,491 2 30 - 7 - 1,528 2 18,432 26 48,895 72 1,945 2 69,272 100 Liabilities Exchange rate derivatives - - 521 1 - - 521 1 Interest rate derivatives - - 16,208 23 - - 16,208 23 Equity and credit derivatives 29 - 1,945 3 260 - 2,234 3 Deposits - - 49,395 71 - - 49,395 71 Debt securities in issue 1,071 2 - - 109 - 1,180 2 1,100 2 68,069 98 369 - 69,538 100
Valuation techniques The main valuation techniques employed in the Group’s internal models to measure the fair value of the financial instruments disclosed above at 30 June 2010 and 31 December 2009 are set out below. In substantially all cases, the principal inputs into these models are derived from observable market data. The Group did not make any material changes to the valuation techniques and internal models it used since the financial year ended 31 December 2009. A In the valuation of financial instruments requiring static hedging (for example interest rate and currency derivatives) and
in the valuation of loans and advances and deposits, the ‘present value’ method is used. Expected future cash flows are discounted using the interest rate curves of the applicable currencies. The interest rate curves are generally observable market data and reference yield curves derived from quoted interest rates in appropriate time bandings, which match the timings of the cashflows and maturities of the instruments.
B In the valuation of equity financial instruments requiring dynamic hedging (principally equity securities, options and other structured instruments), proprietary stochastic volatility models are used. These types of models are widely accepted in the financial services industry. Observable market inputs are used in these models to generate variables such as the bid-offer spread, foreign currency exchange rates, credit risk, volatility, correlation between indices and market liquidity as appropriate. In limited circumstances, other inputs may be used in these models that are based on data other than observable market data, such as the Halifax’s UK House Price Index (‘HPI’) volatility, HPI forward growth, HPI spot rate, and mortality.
C In the valuation of financial instruments exposed to interest rate risk that require either static or dynamic hedging (such as interest rate futures, caps and floors, and options), the present value method (futures), Black’s model (caps/floors) and the Markov functional model (Bermudan options) are used. These types of models are widely accepted in the financial services industry. The significant inputs used in these models are observable market data, including appropriate interest rate curves, volatilities, correlations and exchange rates. In limited circumstances, other inputs may be used in these models that are based on data other than observable market data, such as the Halifax’s UK House Price Index (‘HPI’) volatility, HPI forward growth, HPI spot rate, mortality, and the specific credit spread for that instrument.
Internal models based on observable market data During the six months ended 30 June 2010 and 2009, there were no transfers of financial instruments between the categories valued using “quoted prices in active markets” and “internal models based on observable data”.

Financial Statements
Notes to the Condensed Financial Statements continued
90
Internal models based on information other than market data The table below provides an analysis of financial instruments valued using internal models based on information other than market data together with the subsequent valuation technique used for each type of instrument. Each instrument is initially valued at transaction price:
Balance sheet value Amount recognised in income/(expense)
30 June 2010
31 December 2009
30 June 2010
30 June 2009
Balance sheet line item Category Financial instrument product type £m £m £m £m
1. Trading assets Equity securities Property unit trusts 3 7 - (1) 2. Derivative assets Exchange rate contracts Cross-currency swaps 42 37 (8) 14 3. Derivative assets Equity and credit contracts Reversionary property interests 75 73 2 (4) 4. Derivative assets Equity contracts Options and forwards 53 84 (32) (5) 5. FVTPL Loans and advances to
customers Roll-up mortgage portfolio 50 262 7 (36)
6. FVTPL Debt securities Reversionary property securities 270 263 10 (4) 7. FVTPL Debt securities Asset-backed securities 70 1,169 49 62 8. FVTPL Debt securities Collateralised synthetic obligations (CSOs) 24 50 - - 9. Derivative liabilities Equity contracts Options and forwards (162) (260) 98 (82) 10. FVTPL Debt securities in issue Non-vanilla debt securities (97) (109) (8) (23) Total net assets 328 1,576 - - Total income/(expense) - - 118 (79)
Unrecognised gains as a result of the use of valuation models using unobservable inputs (“Day One profits”) The table below shows the amount that has yet to be recognised in the income statement that relates to the difference between the transaction price (i.e. the fair value at initial recognition) and the amount that would have arisen had valuation models using unobservable inputs been used on initial recognition, less amounts subsequently recognised. This is calculated and reported on a portfolio basis:
2010 £m
2009 £m
At 1 January 92 55 New transactions 37 4 Amounts recognised in profit or loss during the period (77) (5) At 30 June 52 54 Reconciliation of fair value measurements in Level 3 of the fair value hierarchy (measured at fair value using a valuation technique with significant unobservable inputs) The following table provides a reconciliation of the movement between opening and closing balances of Level 3 financial instruments, measured at fair value using a valuation technique with significant unobservable inputs:
Assets Liabilities 30 June 2010 Trading
assets Derivatives Fair value
through P&L Total Derivatives Fair value
through P&L Total
£m £m £m £m £m £m £m At 1 January 2010 7 194 1,744 1,945 (260) (109) (369) Total gains/(losses) recognised in profit/(loss): - Fair value movements - (38) 66 28 98 (8) 90 - Foreign exchange and other movements - 14 (15) (1) - 15 15 Purchases/issues - - - - - - - Sales (4) - (1,244) (1,248) - - - Settlements - - (137) (137) - 5 5 At 30 June 2010 3 170 414 587 (162) (97) (259) Total gains/(losses) recognised in profit/(loss) relating to those assets and liabilities held at the end of the period
- (24) 51 27 98 7 105

Financial Statements
Notes to the Condensed Financial Statements continued
91
Assets Liabilities 31 December 2009
Trading assets
Derivatives Fair value through P&L
Total Derivatives Fair value through P&L
Total
£m £m £m £m £m £m £m At 1 January 2009 37 154 4,629 4,820 (169) (247) (416) Total gains/(losses) recognised in profit/(loss): - Fair value movements (1) 5 22 26 (82) (23) (105) - Foreign exchange and other movements (3) 43 (106) (66) (18) 5 (13) Purchases/issues - - 30 30 - - - Sales (26) - (121) (147) - - - Settlements - (8) (499) (507) 9 156 165 Transfers in - - 50 50 - - - Transfers out - - (2,261) (2,261) - - - At 31 December 2009 7 194 1,744 1,945 (260) (109) (369) Total gains/(losses) recognised in profit/(loss) relating to those assets and liabilities held at the end of the period
(4) 48 (84) (40) (100) (18) (118)
Financial instrument assets and liabilities at 30 June 2010 Financial instrument assets valued using internal models based on information other than market data were 1% (2009: 2%) of total assets measured at fair value and 0.2% (2009: 0.7%) of total assets at 30 June 2010 and 31 December 2009.
Trading assets valued using internal models based on information other than market data decreased in 2010 principally due to the sale of asset securities during the year.
Derivatives valued using internal models based on information other than market data decreased in 2010 principally due to losses reflecting changes in credit spreads and the HPI index.
Assets designated at fair value through profit or loss valued using internal models based on information other than market data decreased in 2010 principally due to sales and settlements. During the period, euro 1,172m (2009: euro 225m) of the Group’s holdings of AAA-rated prime mortgage backed securities were sold to Banco Santander, S.A. (2009: sold to the issuer, Banco Santander Totta, S.A.).
Financial instrument liabilities valued using internal models based on information other than market data were 0.3% (2009: 0.5%) of total liabilities measured at fair value and 0.1% (2009: 0.1%) of total liabilities at 30 June 2010.
Derivative liabilities valued using internal models based on information other than market data decreased in 2010 principally due to gains reflecting changes in credit spreads and the HPI index.
Liabilities designated at fair value through profit or loss valued using internal models based on information other than market data decreased in 2010 principally due to changes in foreign exchange rates and maturities of debt securities in issue.
Financial instrument assets and liabilities at 31 December 2009 Financial instrument assets valued using internal models based on information other than market data were 2% of total assets measured at fair value and 0.7% of total assets at 31 December 2009.
Trading assets valued using internal models based on information other than market data decreased in 2009 principally due to assets being sold.
Derivatives valued using internal models based on information other than market data increased in 2009 principally due to gains reflecting changes in foreign exchange rates.
Assets designated at fair value through profit or loss valued using internal models based on information other than market data decreased in 2009 principally due to settlements and transfers to Level 2. During December 2009, euro 190m of the Group’s holdings of AAA-rated prime mortgage-backed securities were sold to the issuer. As a result, the Group’s remaining positions in these securities as issued by the same issuer of £2,261m were transferred to Level 2. During 2009, there were acquisitions of £30m of financial instrument assets valued using internal models based on information other than market data.
Financial instrument liabilities valued using internal models based on information other than market data were 0.5% of total liabilities measured at fair value and 0.1% of total liabilities at 31 December 2009.
Derivative liabilities valued using internal models based on information other than market data increased in 2009 principally due to losses reflecting changes in credit spreads, the HPI index and foreign exchange rates.
Liabilities designated at fair value through profit or loss valued using internal models based on information other than market data decreased in 2009 principally due to maturities of debt securities in issue. Gains and losses for the six months ended 30 June 2010 Losses of £24m in respect of derivatives assets valued using internal models based on information other than market data principally reflected a combination of fair value and foreign exchange rates movements.
Gains of £51m in respect of assets designated at fair value through profit or loss valued using internal models based on information other than market data principally reflected changes in foreign exchange rates in the value of the prime securities due to movement in credit spreads of asset-backed and mortgage-backed securities.
Gains of £98m in respect of derivatives liabilities valued using internal models based on information other than market data principally reflected changes in credit spreads and the HPI index.
Gains of £7m in respect of liabilities designated at fair value through profit or loss valued using internal models based on information other than market data principally reflected changes in foreign exchange and interest rates. They are fully matched with derivatives.

Financial Statements
Notes to the Condensed Financial Statements continued
92
Gains and losses for the year ended 31 December 2009 Losses of £4m in respect of trading assets valued using internal models based on information other than market data principally reflected the lack of market liquidity during the year.
Gains of £48m in respect of derivatives assets valued using internal models based on information other than market data principally reflected movements in foreign exchange rates.
Losses of £84m in respect of assets designated at fair value through profit or loss valued using internal models based on information other than market data principally reflected changes in foreign exchange rates partly offset by an increase in the value of the prime securities due to tightening of credit spreads of asset-backed and mortgage-backed securities.
Losses of £100m in respect of derivatives liabilities valued using internal models based on information other than market data principally reflected changes in credit spreads, the HPI index and foreign exchange rates.
Losses of £18m in respect of liabilities designated at fair value through profit or loss valued using internal models based on information other than market data principally reflected changes in foreign exchange and interest rates. They are fully matched with derivatives. Gains and losses on assets and liabilities classified as held for trading are presented in the income statement under “Net trading and other income”. Fair value changes on long-term debt designated at fair value and related derivatives are presented in the income statement under ‘Changes in fair value of long-term debt issued and related derivatives’. The income statement line item ‘Net income/(expense) from other financial instruments designated at fair value’ captures fair value movements on all other financial instruments designated at fair value and related derivatives. Effect of changes in significant unobservable assumptions to reasonably possible alternatives As discussed above, the fair value of financial instruments are, in certain circumstances, measured using valuation techniques that incorporate assumptions that are not evidenced by prices from observable current market transactions in the same instrument and are not based on observable market data and, as such require the application of a degree of judgement. Changing one or more of the inputs to the valuation models to reasonably possible alternative assumptions would change the fair values significantly. The following table shows the sensitivity of these fair values to reasonably possible alternative assumptions.
Favourable and unfavourable changes are determined on the basis of changes in the value of the instrument as a result of varying the levels of the unobservable input as described in the table below. The potential effects do not take into effect any offsetting or hedged positions. At 30 June 2010 Reflected in income statement Balance sheet note line item and product Fair
value Assumptions Shift Favourable
changes Unfavourable
changes £m £m £m 1. Trading assets – Equity securities:
– Property unit trusts 3 Estimated discount to asset
value 10% 1 (1)
3. Derivative assets – Equity and credit contracts: – Reversionary property derivatives
75 HPI Forward growth rate HPI Spot rate Mortality rate
1% 10% 2 yrs
11 7 1
(11) (7) (1)
4. Derivative assets – Equity and credit contracts: – Options and forwards
53 HPI Forward growth rate HPI Spot rate HPI Volatility
1% 10% 1%
7 5 1
(7) (4) (1)
5. FVTPL – Loans and advances to customers: – Roll-up mortgage portfolio
50 HPI Forward growth rate HPI Spot rate HPI Volatility Mortality rate
1% 10% 1%
2 yrs
1 1 1 1
(1) (1) (1) (1)
6. FVTPL – Debt securities: – Reversionary property securities
270 HPI Forward growth rate HPI Spot rate Mortality rate
1% 10% 2 yrs
24 27 4
(24) (27) (5)
7. FVTPL – Debt securities: – Other asset-backed securities
70 Credit spread 75 bps 1 (1)
8. FVTPL – Debt securities: – Collateralised synthetic obligations (CSOs)
24 Probability of default 20% 12 (3)
9. Derivative liabilities - Equity and credit contracts: – Options and forwards
(162) HPI Forward growth rate HPI Spot rate HPI Volatility
1% 10% 1%
7 18 2
(7) (22) (2)

Financial Statements
Notes to the Condensed Financial Statements continued
93
At 31 December 2009 Reflected in income statement Balance sheet note line item and product Fair
value Assumptions Shift Favourable
changes Unfavourable
changes £m £m £m 1. Trading assets – Equity securities:
– Property unit trusts 7 Estimated discount to asset
value 10% 1 (1)
3. Derivative assets – Equity and credit contracts: – Reversionary property derivatives
73 HPI Forward growth rate HPI Spot rate Mortality rate
1% 10% 2 yrs
11 8 1
(11) (8) (1)
4. Derivative assets – Equity and credit contracts: – Options and forwards
84 HPI Forward growth rate HPI Spot rate HPI Volatility
1% 10% 1%
3 3 1
(3) (2) (1)
5. FVTPL – Loans and advances to customers: – Roll-up mortgage portfolio
262 HPI Forward growth rate HPI Spot rate HPI Volatility Mortality rate
1% 10% 1%
2 yrs
28 9 5 7
(28) (11) (5) (6)
6. FVTPL – Debt securities: – Reversionary property securities
263 HPI Forward growth rate HPI Spot rate Mortality rate
1% 10% 2 yrs
24 27 5
(24) (27) (5)
7. FVTPL – Debt securities: – Other asset-backed securities 1,169 Credit spread 75 bps 15 (15) 8. FVTPL – Debt securities: – Collateralised synthetic obligations (CSOs) 50 Probability of default 20% 24 (6)
9. Derivative liabilities - Equity and credit contracts: – Options and forwards
(260) HPI Forward growth rate HPI Spot rate HPI Volatility
1% 10% 1%
14 32 2
(14) (37) (2)
No sensitivities are presented for the FVTPL - debt securities in issue (instrument 10) and related exchange rate derivatives (instrument 2) per page 90, as the terms of these instruments are fully matched. As a result, any changes in the valuation of the debt securities in issue would be exactly offset by an equal and opposite change in the valuation of the exchange rate derivatives. 29. Capital management and resources This note reflects the transactions and amounts reported on a basis consistent with the Group’s regulatory filings. Capital management and capital allocation The Board is responsible for capital management strategy and policy and ensuring that capital resources are appropriately monitored and controlled within regulatory and internal limits. Authority for capital management flows to the Chief Executive and from him to specific individuals who are members of the Group’s Asset and Liability Management Committee (‘ALCO’).
ALCO adopts a centralised capital management approach that is driven by the Group’s corporate purpose and strategy. This approach takes into account the regulatory and commercial environment in which the Group operates, the Group’s risk appetite, the management strategy for each of the Group’s material risks (including whether or not capital provides an appropriate risk mitigant) and the impact of appropriate adverse scenarios and stresses on the Group’s capital requirements. This approach is reviewed annually as part of the Group’s Internal Capital Adequacy Assessment Process (‘ICAAP’).
The Group manages its capital requirements, debt funding and liquidity on the basis of policies and plans reviewed regularly at ALCO and as part of the ICAAP process. To support its capital and senior debt issuance programmes, the Group is rated on a stand alone basis.
On an ongoing basis, and in accordance with the latest ICAAP review, the Group forecasts its regulatory and internal capital requirements based on the approved capital volumes allocated to business units as part of the corporate planning process and the need to have access to a capital buffer. Capital allocation decisions are made as part of planning based on the relative returns on capital using both economic and regulatory capital measures. Capital allocations are reviewed in response to changes in risk appetite and risk management strategy, changes to the commercial environment, changes in key economic indicators or when additional capital requests are received.
This combination of regulatory and economic capital ratios and limits, internal buffers and restrictions, together with the relevant costs of differing capital instruments and a consideration of the various other capital management techniques are used to shape the most cost-effective structure to fulfil the Group’s capital needs. Capital adequacy From 1 January 2008, the Group has managed its capital on a Basel II basis. Throughout 2010 to date and 2009, the Group held capital over and above its regulatory requirements, and managed internal capital allocations and targets in accordance with its capital and risk management policies.

Financial Statements
Notes to the Condensed Financial Statements continued
94
Group Capital
30 June 2010 £m
31 December 2009 £m
Core Tier 1 capital 7,263 6,520 Deductions from Core Tier 1 capital (1,856) (1,941) Total Core Tier 1 capital after deductions 5,407 4,579 Other Tier 1 capital 2,109 1,859 Total Tier 1 capital after deductions 7,516 6,438 Tier 2 capital 5,443 5,832 Deductions from Tier 2 capital (401) (400) Total Tier 2 capital after deductions 5,042 5,432 Total Capital Resources 12,558 11,870 On 3 August 2010, Banco Santander S.A., through a wholly-owned Spanish-based subsidiary Santusa Holding, S.L., injected capital of £4,456m of equity capital into Santander UK plc, to support organic and inorganic growth as well as a planned reorganisation of Banco Santander, S.A. group companies in the UK.
Tier 1 includes profits for the six months ended 30 June 2010 and the year ended 31 December 2009 after adjustment to comply with the UK Financial Services Authority’s rules with the exception of the inclusion of unaudited profits.
On 9 January 2009, in order to optimise the capital, liquidity funding and overall financial efficiency of the enlarged Santander group, Banco Santander, S.A. transferred all of its Alliance & Leicester plc shares to the Company in exchange for 12,631,375,230 newly issued ordinary shares of the Company of £0.10 each.
Tier 1 deductions primarily relate to goodwill and expected losses. In addition, the Group has elected to deduct certain securitisation positions from capital rather than treat these exposures as a risk weighted asset.
The expected loss deduction represents the difference between expected loss calculated in accordance with the Group’s IRB models, and the impairment provisions calculated in accordance with IFRS. Details of the Group’s accounting policy for credit provisions are set out in the Accounting Policies Note on page 116 of the 2009 Annual Report. Expected losses are higher than the impairment provision as the expected loss amount includes all losses that are anticipated to arise over the twelve months following the balance sheet date, not just those incurred at the balance sheet date.
The increase in other Tier 1 capital primarily relates to fluctuations in exchange rates and accounting valuation adjustments.
Decreases in Tier 2 relate to redemptions of subordinated notes in April 2010 and the impact of fluctuations in exchange rates and accounting valuation adjustments. Deductions from Tier 2 represent expected losses and securitisation positions described above. 30. Consolidating financial information Under IAS 27, the Company and Abbey National Treasury Services plc (‘ANTS’) account for investments in their subsidiaries at cost subject to impairment. Rule 3-10 of Regulation S-X requires a company to account for its investments in subsidiaries using the equity method, which would increase/(decrease) the results for the period of the Company and ANTS in the information below by £(228)m and £21m, respectively (2009: £93m and £156m). The net assets of the Company and ANTS in the information below would also be increased by £355m and £339m, respectively (2009: £584m and £316m). Income statements
For the six months ended 30 June 2010 The Company
£m ANTS
£m Other
£m Adjustments
£m Consolidated
£m Net interest income 634 266 1,010 (5) 1,905 Fee, commission, trading, and other income 1,788 444 (768) (759) 705 Total operating income 2,422 710 242 (764) 2,610 Administration expenses (602) (84) (200) 6 (880) Depreciation and amortisation (92) (2) (48) (1) (143) Impairment and provisions (359) (35) (68) 36 (426) Profit/(loss) before tax 1,369 589 (74) (723) 1,161 Taxation (charge)/credit (317) (165) (3) 192 (293) Profit/(loss) for the period 1,052 424 (77) (531) 868
For the six months ended 30 June 2009 The Company
£m ANTS
£m Other
£m Adjustments
£m Consolidated
£m Net interest income 1,007 (65) 732 13 1,687 Fee, commission, trading, and other income 619 142 (444) 288 605 Total operating income 1,626 77 288 301 2,292 Administration expenses (563) (65) (290) 4 (914) Depreciation and amortisation (67) (2) (59) - (128) Impairment and provisions (276) (14) (173) 58 (405) Profit/(loss) before tax 720 (4) (234) 363 845 Taxation (charge)/credit (148) 39 36 (129) (202) Profit/(loss) for the period 572 35 (198) 234 643

Financial Statements
Notes to the Condensed Financial Statements continued
95
Balance sheets
At 30 June 2010 The Company
£m ANTS
£m Other
£m Adjustments
£m Consolidated
£m Cash and balances at central banks 19,004 3,485 4 - 22,493 Trading assets - 12,558 25,807 (15,314) 23,051 Derivative financial instruments 3,874 28,144 5,076 (9,197) 27,897 Financial assets designated at fair value 35,537 6,538 269 (35,466) 6,878 Loans and advances to banks 150,098 171,965 99,189 (415,440) 5,812 Loans and advances to customers 181,113 24,005 51,028 (66,468) 189,678 Available-for-sale securities 41 - 765 - 806 Loans and receivable securities 6,007 720 2,265 (3,274) 5,718 Macro hedge of interest rate risk 169 1,077 142 (38) 1,350 Investment in associated undertakings 76 - - 9 85 Investment in subsidiary undertakings 5,394 2,185 1,331 (8,910) - Intangible assets 1,436 7 90 (74) 1,459 Property, plant and equipment 632 6 133 101 872 Operating lease assets - - 278 - 278 Current tax assets 33 - 54 1 88 Deferred tax assets 722 21 127 297 1,167 Other assets 925 44 386 (305) 1,050 Total assets 405,061 250,755 186,944 (554,078) 288,682 Deposits by banks 179,729 160,231 23,237 (357,934) 5,263 Deposits by customers 199,563 12,102 61,904 (124,972) 148,597 Derivative financial instruments 2,574 29,138 2,209 (9,273) 24,648 Trading liabilities - 15,623 36,074 (15,314) 36,383 Financial liabilities designated at fair value 34 5,452 54 - 5,540 Debt securities in issue 4,997 24,731 54,972 (35,797) 48,903 Other borrowed funds 553 - 1,009 (38) 1,524 Subordinated liabilities 6,406 - 983 (2,146) 5,243 Other liabilities 2,125 248 237 (287) 2,323 Provisions 73 - 4 - 77 Current tax liabilities 253 220 180 - 653 Deferred tax liabilities 21 - 203 82 306 Retirement benefit obligations 1,483 - - - 1,483 Total liabilities 397,811 247,745 181,066 (545,679) 280,943 Total shareholders’ equity 7,250 3,010 5,878 (8,531) 7,607 Non-controlling interests - - - 132 132 Total liabilities and equity 405,061 250,755 186,944 (554,078) 288,682
At 31 December 2009 The Company
£m ANTS
£m Other
£m Adjustments
£m Consolidated
£m Cash and balances at central banks 3,266 448 449 - 4,163 Trading assets - 24,976 30,321 (22,007) 33,290 Derivative financial instruments 2,539 23,129 8,422 (11,263) 22,827 Financial assets designated at fair value 37,145 12,000 313 (37,100) 12,358 Loans and advances to banks 109,658 166,020 156,075 (422,602) 9,151 Loans and advances to customers 131,749 20,266 105,421 (70,632) 186,804 Available-for-sale securities 30 - 767 - 797 Loans and receivable securities 2 896 12,244 (3,244) 9,898 Macro hedge of interest rate risk - 682 504 (59) 1,127 Investment in associated undertakings 76 - - (1) 75 Investment in subsidiary undertakings 7,038 2,185 2,291 (11,514) - Intangible assets 552 8 132 754 1,446 Property, plant and equipment 561 6 270 101 938 Operating lease assets - - 313 (1) 312 Current tax assets - 3 82 - 85 Deferred tax assets 428 21 401 96 946 Other assets 651 67 548 (192) 1,074 Total assets 293,695 250,707 318,553 (577,664) 285,291 Deposits by banks 116,414 166,169 81,097 (357,869) 5,811 Deposits by customers 159,187 17,601 110,834 (143,729) 143,893 Derivative financial instruments 3,352 24,330 2,711 (11,430) 18,963 Trading liabilities - 13,315 47,159 (14,322) 46,152 Financial liabilities designated at fair value - 4,282 141 - 4,423 Debt securities in issue 1 21,631 63,888 (37,762) 47,758 Other borrowed funds 539 - 958 (145) 1,352 Subordinated liabilities 5,580 - 1,975 (1,958) 5,597 Other liabilities 1,611 135 762 (185) 2,323 Provisions 74 - 17 - 91 Current tax liabilities 92 57 151 - 300 Deferred tax liabilities - - 272 64 336 Retirement benefit obligations 922 - 148 - 1,070 Total liabilities 287,772 247,520 310,113 (567,336) 278,069 Total shareholders’ equity 5,923 3,187 8,440 (11,044) 6,506 Non-controlling interests - - - 716 716 Total liabilities and equity 293,695 250,707 318,553 (577,664) 285,291

Financial Statements
Notes to the Condensed Financial Statements continued
96
Cash flow statements
For the six months ended 30 June 2010 The Company
£m ANTS
£m Other
£m Adjustments
£m Consolidated
£m Net cash flow from/(used in) operating activities 2,626 3,963 (4,646) 35 1,978 Net cash flow from/(used in) investing activities (67) - 242 - 175 Net cash flow from/(used in) financing activities 310 1,946 1,492 (35) 3,713 Net increase/(decrease) in cash and cash equivalents 2,869 5,909 (2,912) - 5,866 Cash and cash equivalents at beginning of the period 55,398 49,327 (78,361) - 26,364 Effects of exchange rate changes on cash and cash equivalents - (747) (110) - (857) Cash and cash equivalents at end of the period 58,267 54,489 (81,383) - 31,373
For the six months ended 30 June 2009 The Company
£m ANTS
£m Other
£m Adjustments
£m Consolidated
£m Net cash flow from/(used in) operating activities (969) 6,033 (5,855) 40 (751) Net cash flow from/(used in) investing activities (102) 126 1,391 - 1,415 Net cash flow from/(used in) financing activities (512) - (4,408) (40) (4,960) Net increase/(decrease) in cash and cash equivalents (1,583) 6,159 (8,872) - (4,296) Cash and cash equivalents at beginning of the period 61,203 38,020 (71,548) - 27,675 Effects of exchange rate changes on cash and cash equivalents - (2,361) (233) - (2,594) Cash and cash equivalents at end of the period 59,620 41,818 (80,653) - 20,785

Shareholder Information
Glossary of Financial Services Industry Terms
97
Term used in the Interim Report US equivalent or brief description of meaning
Accounts Financial statements Allotted Issued Attributable profit Net income Balance sheet Statement of financial position Bills Notes Called up share capital Ordinary shares or common stock and preferred stock, issued and fully paid Capital allowances Tax depreciation allowances Combined Code UK-derived principles of good corporate governance and code of best practice Creditors Payables Current account Checking account Dealing Trading Debtors Receivables Deferred tax Deferred income tax Depreciation Write-down of tangible fixed assets over their estimated useful lives Fees and commissions payable Fees and commissions expense Fees and commissions receivable Fees and commissions income Finance lease Capital lease Freehold Ownership with absolute rights in perpetuity Interest payable Interest expense Interest receivable Interest income Loans and advances Lendings Loan capital Long-term debt Long-term assurance fund Long-term insurance fund Members Shareholders Articles of Association Bylaws Net asset value Book value Nominal value Par value One-off Non-recurring Ordinary shares Common stock Preference shares Preferred stock Premises Real estate Profit Income Provisions Allowances Share capital Ordinary shares, or common stock, and preferred stock Shareholders’ funds Stockholders’ equity Share premium account Additional paid-in capital Shares in issue Shares outstanding Tangible fixed assets Property, plant and equipment Undistributable reserves Restricted surplus Write-offs Charge-offs

Shareholder Information
Glossary of Financial Services Industry Terms continued
98
Term used in the Interim Report Definition Alt-A Loans regarded as lower risk than sub-prime, but with higher risk characteristics than lending under normal criteria.
Arrears
Customers are said to be in arrears when they are behind in fulfilling their obligations with the result that an outstanding loan is unpaid or overdue. Such a customer is also said to be in a state of delinquency. When a customer is in arrears, his entire outstanding balance is said to be delinquent, meaning that delinquent balances are the total outstanding loans on which payments are overdue. Corporate customers may also be considered non-performing prior to being behind in fulfilling their obligations. This can happen when a significant restructuring exercise begins.
Asset backed products
Asset backed products are debt and derivative products that are linked to the cash flow of a referenced asset. This category includes asset backed loans; collateralised debt obligations (CDOs); collateralised loan obligations (CLOs); asset backed credit derivatives (ABS CDS); asset backed and mortgage backed securities.
Asset Backed Securities (ABS) Securities that represent an interest in an underlying pool of referenced assets. The referenced pool can comprise any assets which attract a set of associated cash flows but are commonly pools of residential or commercial mortgages and, in the case of Collateralised Debt Obligations (CDOs), the referenced pool may be ABS or other classes of assets.
Average balances Average balances which make up the average balance sheet are based upon monthly averages.
Basis point One hundredth of a per cent (0.01%), so 100 basis points is 1%. Used in quoting movements in interest rates or yields on securities.
Collateralised Debt Obligation (CDO)
Securities issued by a third party which reference Asset Backed Securities (ABSs) (defined above) and/or certain other related assets purchased by the issuer.
Collateralised Loan Obligation (CLO)
A security backed by the repayments from a pool of commercial loans. The payments may be made to different classes of owners (in tranches).
Collateralised Synthetic Obligation (CSO)
A form of synthetic collateralised debt obligation (CDO) that does not hold assets like bonds or loans but invests in credit default swaps (CDSs) or other non-cash assets to gain exposure to a portfolio of fixed income assets.
Commercial Mortgage Backed Securities (CMBS)
Securities that represent interests in a pool of commercial mortgages. Investors in these securities have the right to cash received from future mortgage payments (interest and/or principal).
Commercial Real Estate Includes office buildings, industrial property, medical centres, hotels, malls, retail stores, shopping centres, farm land, multifamily housing buildings, warehouses, garages, and industrial properties. Commercial real estate loans are those backed by a package of commercial real estate assets.
Commercial Paper An unsecured promissory note issued to finance short-term credit needs. It specifies the face amount paid to investors on the maturity date.
Conduit A financial vehicle that holds asset-backed debt such as mortgages, vehicle loans and credit card receivables, all financed with short-term loans (generally commercial paper) that use the asset-backed debt as collateral. The profitability of a conduit depends on the ability to roll over maturing short-term debt at a cost that is lower than the returns earned from asset-backed securities held in the portfolio.
Core Tier 1 capital Called-up share capital and eligible reserves plus equity non-controlling interests, less intangible assets and deductions relating to the excess of expected loss over regulatory impairment allowance and securitisation positions as specified by the UK Financial Services Authority.
Core Tier 1 capital ratio Core Tier 1 capital as a percentage of risk weighted assets.
Cost:income ratio Operating expenses compared to total income.
Coverage ratio Impairment allowances as a percentage of total non-performing loans and advances.
Credit conversion factors (CCFs) The portion of an off-balance sheet commitment drawn in the event of a future default. The conversion factor is expressed as a percentage. The conversion factor is used to calculate the exposure at default (EAD).
Credit Default Swaps (CDS) A credit derivative is an arrangement whereby the credit risk of an asset (the reference asset) is transferred from the buyer to the seller of protection. A credit default swap is a contract where the protection seller receives premium or interest-related payments in return for contracting to make payments to the protection buyer in the event of a defined credit event. Credit events normally include bankruptcy, payment default on a reference asset or assets, or downgrades by a rating agency.
Credit market exposures Relates to commercial real estate and leveraged finance businesses that have been significantly impacted by the continued deterioration in the global credit markets. The exposures include positions subject to fair value movements in the Income Statement, positions that are classified as loans and advances and available for sale.
Credit spread The yield spread between securities with the same coupon rate and maturity structure but with different associated credit risks, with the yield spread rising as the credit rating worsens. It is the premium over the benchmark or risk-free rate required by the market to accept a lower credit quality.
Customer deposits Money deposited by all individuals and companies that are not credit institutions. Such funds are recorded as liabilities in the Group’s balance sheet under Deposits by Customers, Trading Liabilities or Financial Liabilities designated at Fair Value.
Debt restructuring This occurs when the terms and provisions of outstanding debt agreements are changed. This is often done in order to improve cash flow and the ability of the borrower to repay the debt. It can involve altering the repayment schedule as well as reducing the debt or interest charged on the loan.
Delinquency See ‘Arrears’.
Economic capital An internal measure of the minimum equity and preference capital required for the Group to maintain its credit rating based upon its risk profile.

Shareholder Information
Glossary of Financial Services Industry Terms continued
99
Term used in the Interim Report Definition Equity products These products are linked to equity markets. This category includes listed equities, exchange traded derivatives, equity
derivatives, preference shares and contract for difference (CFD) products.
Equity structural hedge An interest rate hedge which functions to reduce the impact of the volatility of short-term interest rate movements on equity positions on the balance sheet that do not reprice with market rates.
Expected loss The Group measure of anticipated loss for exposures captured under an internal ratings based credit risk approach for capital adequacy calculations. It is measured as the Group-modelled view of anticipated loss based on Probability of Default (PD), Loss Given Default (LGD) and Exposure at Default (EAD), with a one-year time horizon.
Exposure at default (EAD) The estimation of the extent to which the Group may be exposed to a customer or counterparty in the event of, and at the time of, that counterparty’s default. At default, the customer may not have drawn the loan fully or may already have repaid some of the principal, so that exposure is typically less than the approved loan limit.
First/Second Charge First charge (also known as first lien): debt that places its holder first in line to collect compensation from the sale of the underlying collateral in the event of a default on the loan. Second charge (also known as second lien): debt that is issued against the same collateral as higher charge debt but that is subordinate to it. In the case of default, compensation for this debt will only be received after the first charge has been repaid and thus represents a riskier investment than the first charge.
Full time equivalent Full time equivalent employee units are the on-job hours paid for employee services divided by the number of ordinary-time hours normally paid for a full-time staff member when on the job (or contract employee where applicable).
Funded/unfunded Exposures where the notional amount of the transaction is either funded or unfunded. Represents exposures where a commitment to provide future funding has been made and the funds have been released/not released.
FX products These products are derivatives linked to the foreign exchange market. This category includes FX spot and forward contracts; FX swaps; FX options.
Gain on acquisition The amount by which the acquirer’s interest in the net fair value of the identifiable assets, liabilities and contingent liabilities, recognised in a business combination, exceeds the cost of the combination.
Home Loans A loan to purchase a residential property which is then used as collateral to guarantee repayment of the loan. The borrower gives the lender a lien against the property, and the lender can foreclose on the property if the borrower does not repay the loan per the agreed terms. Also known as a residential mortgage.
Impaired loans Loans where individual identified impairment allowance has been raised and also include loans which are fully collateralised or where indebtedness has already been written down to the expected realisable value. The impaired loan category may include loans, which, while impaired, are still performing.
Impairment allowances A provision held on the balance sheet as a result of the raising of a charge against profit for the incurred loss inherent in the lending book. An impairment allowance may either be identified or unidentified and individual or collective.
Individually/Collectively Assessed Impairment is measured individually for assets that are individually significant, and collectively where a portfolio comprises homogenous assets and where appropriate statistical techniques are available.
Interest rate products Products with a payoff linked to interest rates. This category includes interest rate swaps, swaptions, caps and exotic interest rate derivatives.
Investment grade A debt security, treasury bill or similar instrument with a credit rating measured by external agencies of AAA to BBB.
Jaws The difference between the growth in cost and the growth in income.
Leveraged Finance Loans or other financing agreements provided to companies whose overall level of debt is high in relation to their cash flow (net debt: EBITDA) typically arising from private equity sponsor led acquisitions of the businesses concerned.
Liquidity and Credit enhancements Credit enhancement facilities are used to enhance the creditworthiness of financial obligations and cover losses due to asset default. Two general types of credit enhancement are third-party loan guarantees and self-enhancement through over collateralization. Liquidity enhancement makes funds available if required, for other reasons than asset default, e.g. to ensure timely repayment of maturing commercial paper.
Loan loss rate Defined as total credit impairment charge (excluding available for sale assets and reverse repurchase agreements) divided by gross loans and advances to customers and banks (at amortised cost).
Loan to deposit ratio The ratio of the book value of the Group’s commercial assets (i.e. retail, corporate and private banking assets) divided by its commercial liabilities (i.e. retail, corporate and private banking deposits, and shareholders’ funds).
Loan to value ratio (LTV) The amount of a first mortgage charge as a percentage of the total appraised value of real property. The LTV ratio is used in determining the appropriate level of risk for the loan and therefore the price of the loan to the borrower. LTV ratios may be expressed in a number of ways, including origination LTV and indexed LTV. Origination LTVs use the current outstanding loan balance and the value of the property at origination of the loan. Indexed LTVs use the current outstanding loan value and the current value of the property (which is estimated using one or more external house price indices).
Loans past due Loans are past due when a counterparty has failed to make a payment when contractually due.
Loss Given Default (LGD) The fraction of Exposure at Default (EAD) (defined above) that will not be recovered following default. LGD comprises the actual loss (the part that is not expected to be recovered), together with the economic costs associated with the recovery process.

Shareholder Information
Glossary of Financial Services Industry Terms continued
100
Term used in the Interim Report Definition Medium Term Notes (MTNs) Corporate notes continuously offered by a company to investors through a dealer. Investors can choose from differing
maturities, ranging from nine months to 30 years.
Monoline An entity which specialises in providing credit protection to the holders of debt instruments in the event of default by a debt security counterparty. This protection is typically held in the form of derivatives such as credit default swaps (CDS) referencing the underlying exposures held.
Monoline Wrapped Debt instruments for which credit enhancement or protection by a monoline insurer has been obtained. The wrap is credit protection against the notional and principal interest cash flows due to the holders of debt instruments in the event of default in payment of these by the underlying counterparty. Therefore, if a security is monoline wrapped its payments of principal and interest are guaranteed by a monoline insurer.
Mortgage Backed Securities (MBS) Securities that represent interests in a group of mortgages. Investors in these securities have the right to cash received from future mortgage payments (interest and/or principal).
Mortgage vintage The year the mortgage was issued.
Mortgage related securities Securities which are referenced to underlying mortgages. See RMBS, CMBS and MBS.
Net Equity The change in shareholders’ equity between one period and another.
Net Interest Income The difference between interest received on assets and interest paid on liabilities.
Non-asset backed debt instruments These products are debt instruments. This category includes government bonds; US agency bonds; corporate bonds; commercial paper; certificates of deposit; convertible bonds; corporate bonds and issued notes.
Non-investment grade A debt security, treasury bill or similar instrument with a credit rating measured by external agencies of BB+ or below.
Non-performing loans In the Retail Banking business, loans and advances are classified as non-performing typically when the counterparty fails to make payments when contractually due for three months or longer. In the Corporate Banking business, loans and advances are classified as non-performing either when payments are more than three months past due or where there are reasonable doubts about full repayment (principal and interest) under the contractual terms.
Notional Collateral Collateral based on the notional amount of a financial instrument.
Overdraft A line of credit established through a customer’s bank account and contractually repayable on demand.
Over the counter derivatives (OTC) Contracts that are traded (and privately negotiated) directly between two parties, without going through an exchange or other intermediary. They offer flexibility because, unlike standardised exchange-traded products, they can be tailored to fit specific needs.
Own Credit The effect of the Group’s own credit standing on the fair value of financial liabilities.
Prime Loans of a higher credit quality and those which would be expected to satisfy the criteria for inclusion into Government programmes.
Principal transactions Principal transactions comprise net trading income and net investment income.
Private equity investments Private equity is equity securities in operating companies not quoted on a public exchange. Investment in private equity often involves the investment of capital in private companies or the acquisition of a public company that results in the delisting of public equity. Capital for private equity investment is raised by retail or institutional investors and used to fund investment strategies such as leveraged buyouts, venture capital, growth capital, distressed investments and mezzanine capital.
Probability of default (PD) The likelihood that a loan will not be repaid and will fall into default. PD may be calculated for each client who has a loan (normally applicable to wholesale customers/clients) or for a portfolio of clients with similar attributes (normally applicable to retail customers). To calculate PD, the Group assesses the credit quality of borrowers and other counterparties and assigns them an internal risk rating. Multiple rating methodologies may be used to inform the rating decision on individual large credits, such as internal and external models, rating agency ratings, and for wholesale assets market information such as credit spreads. For smaller credits, a single source may suffice such as the result from an internal rating model.
Renegotiated loans Loans and advances are generally renegotiated either as part of an ongoing customer relationship or in response to an adverse change in the circumstances of the borrower. In the latter case renegotiation can result in an extension of the due date of payment or repayment plans under which the Group offers a concessionary rate of interest to genuinely distressed borrowers. This will result in the asset continuing to be overdue and will be individually impaired where the renegotiated payments of interest and principal will not recover the original carrying amount of the asset. In other cases, renegotiation will lead to a new agreement, which is treated as a new loan.
Repo/Reverse repo A repurchase agreement that allows a borrower to use a financial security as collateral for a cash loan at a fixed rate of interest. In a repo, the borrower agrees to sell a security to the lender subject to a commitment to repurchase the asset at a specified price on a given date. For the party selling the security (and agreeing to repurchase it in the future) it is a repo; for the party on the other end of the transaction (buying the security and agreeing to sell in the future) it is a reverse repurchase agreement or reverse repo.
Residential Mortgage Backed Securities (RMBS)
Securities that represent interests in a group of residential mortgages. Investors in these securities have the right to cash received from future mortgage payments (interest and/or principal).
Restructured loans Loans where, for economic or legal reasons related to the debtor’s financial difficulties, a concession has been granted to the debtor that would not otherwise be considered. Where the concession results in the expected cash flows discounted at the original effective interest rate being less than the loan’s carrying value, an impairment allowance will be raised.

Shareholder Information
Glossary of Financial Services Industry Terms continued
101
Term used in the Interim Report Definition Retail Loans Loans to individuals rather than institutions. This includes both secured and unsecured loans such as mortgages and credit
card balances.
Return on average shareholders’ equity
Calculated as profit for the year attributable to equity holders of the Parent divided by the average shareholders’ equity for the year, excluding non-controlling interests.
Risk asset ratio A measure of the risk attached to the assets of a business using definitions of capital and risk weightings established in accordance with the Basel Capital Accord as implemented by the UK Financial Services Authority.
Risk weighted assets A measure of a bank’s assets adjusted for their associated risks. Risk weightings are established in accordance with the Basel Capital Accord as implemented by the UK Financial Services Authority.
Securitisation A process by which debt instruments are aggregated into a pool, which is used to back new securities. A company sells assets to an SPV (special purpose vehicle) who then issues securities backed by the assets based on their value. This allows the credit quality of the assets to be separated from the credit rating of the original company and transfers risk to external investors.
Special Purpose Entities (SPEs) or Special Purpose Vehicles (SPVs)
Entities that are created to accomplish a narrow and well defined objective. There are often specific restrictions or limits around their ongoing activities. Transactions with SPEs/SPVs take a number of forms, including: – The provision of financing to fund asset purchases, or commitments to provide finance for future purchases. – Derivative transactions to provide investors in the SPE/SPV with a specified exposure. – The provision of liquidity or backstop facilities which may be drawn upon if the SPE/SPV experiences future funding
difficulties. – Direct investment in the notes issued by SPEs/SPVs.
Structured Investment Vehicles (SIVs)
SPEs (Special Purpose Entities) which invest in diversified portfolios of interest earning assets to take advantage of the spread differentials between the assets in the SIV and the funding cost.
Structural liquidity The liquidity available from current positions – principally unpledged marketable assets and holdings of term liabilities with long remaining lives.
Structured finance/notes A structured note is an investment tool which pays a return linked to the value or level of a specified asset or index and sometimes offers capital protection if the value declines. Structured notes can be linked to equities, interest rates, funds, commodities and foreign currency.
Subordination The state of prioritising repayments of principal and interest on debt to a creditor lower than repayments to other creditors by the same debtor. That is, claims of a security are settled by a debtor to a creditor only after the claims of securities held by other creditors of the same debtor have been settled.
Subordinated liabilities Liabilities which, in the event of insolvency or liquidation of the issuer, are subordinated to the claims of depositors and other creditors of the issuer.
Sub-Prime Defined as loans to borrowers typically having weakened credit histories that include payment delinquencies and potentially more severe problems such as court judgments and bankruptcies. They may also display reduced repayment capacity as measured by credit scores, high debt-to-income ratios, or other criteria indicating heightened risk of default.
Tier 1 capital A measure of a bank's financial strength defined by the UK Financial Services Authority. It captures Core Tier 1 capital plus other Tier 1 securities in issue, but is subject to a deduction in respect of material holdings in financial companies. ‘Tier 1 capital ratio’ The ratio expresses Tier 1 capital as a percentage of risk weighted assets.
Tier 2 capital Defined by the UK Financial Services Authority. Broadly, it includes qualifying subordinated debt and other Tier 2 securities in issue, eligible collective impairment allowances, unrealised available for sale equity gains and revaluation reserves. It is subject to deductions relating to the excess of expected loss over regulatory impairment allowance, securitisation positions and material holdings in financial companies.
Total shareholder return Defined as the value created for shareholders through share price appreciation, plus reinvested dividend payments.
Value at Risk (VaR) An estimate of the potential loss which might arise from market movements under normal market conditions, if the current positions were to be held unchanged for one business day, measured to a confidence level.
Write-Down After an advance has been identified as impaired and is subject to an impairment allowance, the stage may be reached whereby it is concluded that there is no realistic prospect of further recovery. Write-downs will occur when, and to the extent that, the whole or part of a debt is considered irrecoverable.

Shareholder Information
Directors’ Responsibility Statement
102
We confirm that to the best of our knowledge:
(a) the condensed set of financial statements has been prepared in accordance with IAS 34 ‘Interim Financial Reporting’;
(b) the interim management report includes a fair review of the information required by DTR 4.2.7R (indication of important events during the first six months and description of principal risks and uncertainties for the remaining six months of the year); and
(c) the interim management report includes a fair review of the information required by DTR 4.2.8R (disclosure of related party transactions and changes therein).
By Order of the Board
Antonio Lorenzo Chief Financial Officer 26 August 2010