santee cooper - scstatehouse.gov · • pamela williams - senior vice president, corporate services...
TRANSCRIPT

Santee CooperVC Summer Nuclear Project Review Committee
South Carolina Senate
October 11, 2017
®
2
Mission
To be the state’s
leading resource
for improving the
quality of life
for the people of
South Carolina
Jefferies Hydro,
1942

®
3
Board of Directors
W. Leighton Lord III, Chairman - Columbia
William A. Finn, 1st Vice Chair – 1st Congressional District (Mount Pleasant)
Barry D. Wynn, 2nd Vice Chair – 4th Congressional District (Spartanburg)
Kristofer Clark – 3rd Congressional District (Easley)
Merrell W. Floyd – 7th Congressional District (Conway)
J. Calhoun Land IV – 6th Congressional District (Manning)
Stephen H. Mudge – At Large (Clemson)
Peggy H. Pinnell – Berkeley County (Moncks Corner)
Dan J. Ray – Georgetown County (Pawleys Island)
David F. Singleton – Horry County (Myrtle Beach)
Jack F. Wolfe Jr. – 2nd Congressional District (Chapin)
Vacancy – 5th Congressional District
®
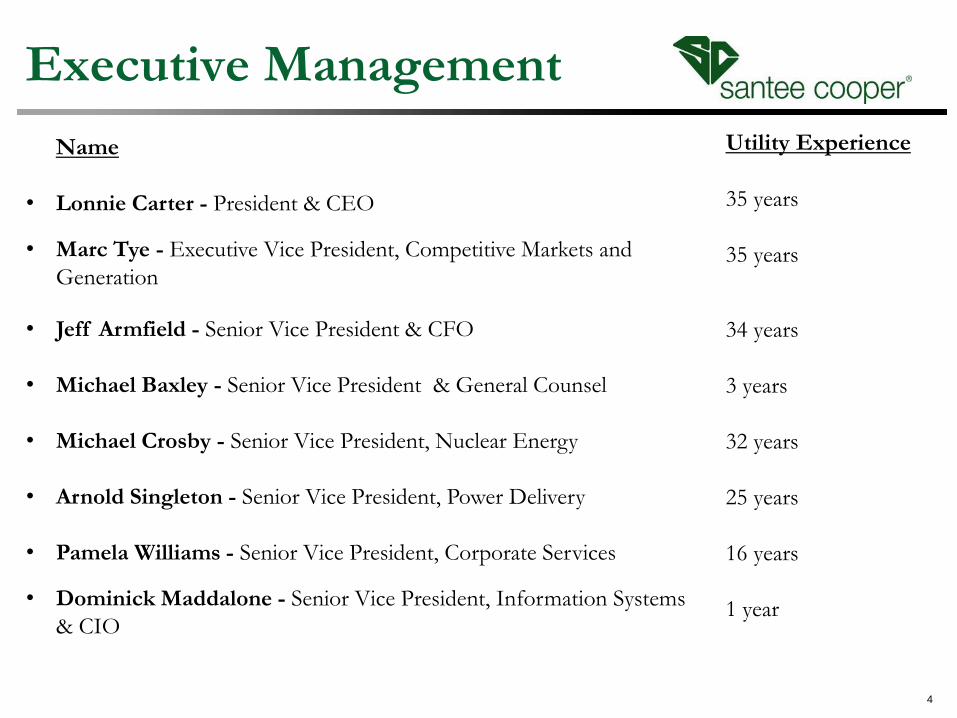
Executive Management
Name
• Lonnie Carter - President & CEO
• Marc Tye - Executive Vice President, Competitive Markets and
Generation
• Jeff Armfield - Senior Vice President & CFO
• Michael Baxley - Senior Vice President & General Counsel
• Michael Crosby - Senior Vice President, Nuclear Energy
• Arnold Singleton - Senior Vice President, Power Delivery
• Pamela Williams - Senior Vice President, Corporate Services
• Dominick Maddalone - Senior Vice President, Information Systems
& CIO
4
Utility Experience
35 years
35 years
34 years
3 years
32 years
25 years
16 years
1 year
®
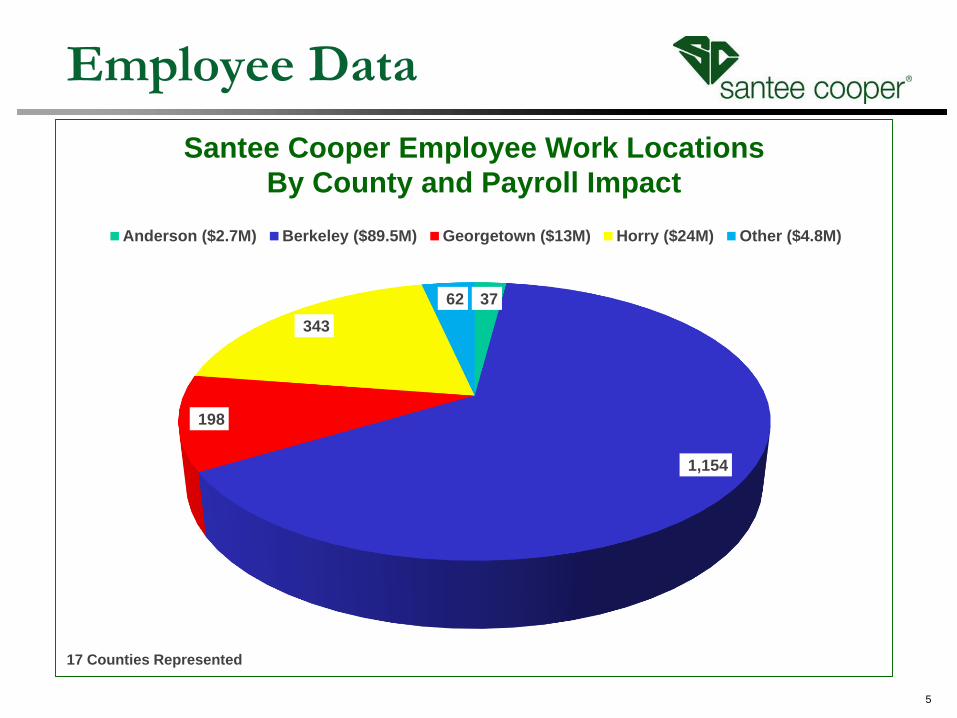
Employee Data
37
1,154
198
343
62
Santee Cooper Employee Work Locations
By County and Payroll Impact
Anderson ($2.7M) Berkeley ($89.5M) Georgetown ($13M) Horry ($24M) Other ($4.8M)
17 Counties Represented
date-unit no-pr5
®
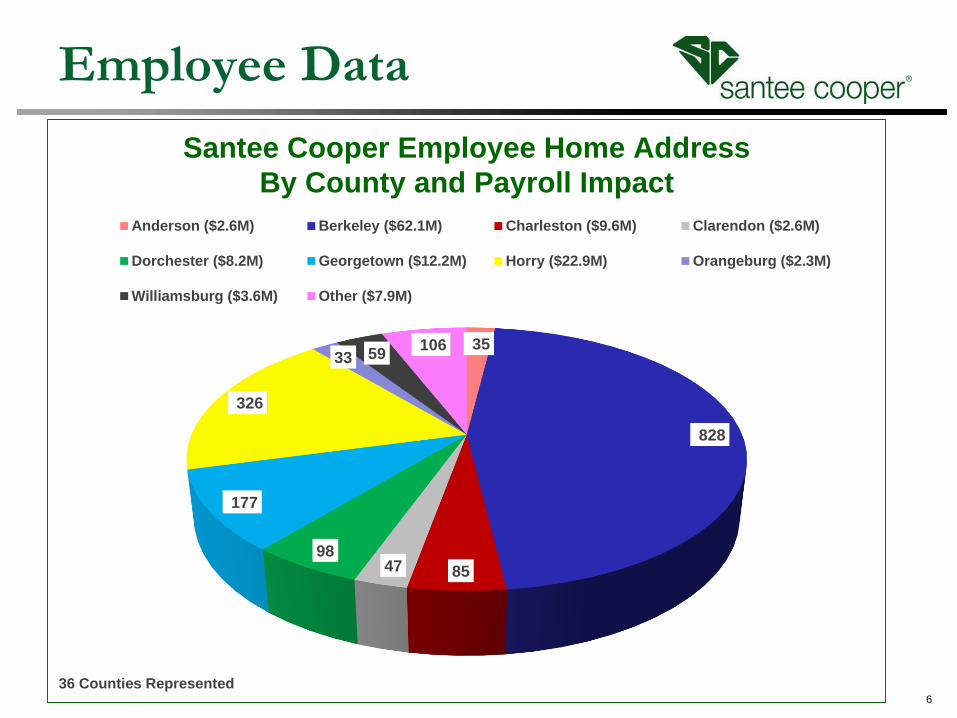
Employee Data
35
828
854798
177
326
33 59106
Santee Cooper Employee Home Address
By County and Payroll Impact
Anderson ($2.6M) Berkeley ($62.1M) Charleston ($9.6M) Clarendon ($2.6M)
Dorchester ($8.2M) Georgetown ($12.2M) Horry ($22.9M) Orangeburg ($2.3M)
Williamsburg ($3.6M) Other ($7.9M)
36 Counties Represented6

®
Operational Overview
7

®
Statewide Transmission System
8

®
Hilton Head
Jefferies
Myrtle Beach
Horry County
Grainger
V.C. Summer
Richland County
Lee County
Rainey Anderson County
Buzzard’s Roost
WinyahCross
Santee Spillway
Coal
Hydro
Oil
Nat Gas
Nuclear
LF Gas
Fuel MixGeorgetown
Moncks Corner
Generating Stations
9

®
Energy Sales by Fuel Type
10

®
11
Renewables: 106 MWs
Green Power – reached 1 million MWH milestone in August 2015• Landfill generation
– 6 stations– 28 MWs
• Solar and wind– Grand Strand Solar Station– Green Power Solar Schools– CCU, Technical College of
Lowcountry, Center for Hydrogen Research, CAT’s, TTC-Berkeley
– NMB wind turbine
Other renewables• Biomass – 73.6 MWs
– Domtar– Allendale, Dorchester
• Colleton Solar Farm– State’s 1st Community Solar project

®
Customer Overview
• Central Electric Power Cooperative, Inc.
20 South Carolina Electric Cooperatives
• 3 Municipalities: Cities of Georgetown, Bamberg, and Seneca (with Blue Ridge
Electric Cooperative)
• 3 Other Wholesale Customers: AMEA, PMPA*, & the Town of Waynesville
* - PMPA Cities: Abbeville, Clinton, Easley, Gaffney, Greer, Laurens, Newberry, Rock Hill,
Union, and Westminster.
• 179,845 Retail Customers – Horry, Georgetown and Berkeley County
• 26 Large Industrial and Military Customers
All told, more than 2 million South Carolinians use Santee Cooper power.
date-unit no-p12

®
Customer Overview
13
Sales of Electricity – Customer Classes
2016 Total Sales: 23,700 GWh
Central: 61%
Off System Sales: 1%
Military & Large Industrial: 19%
Commercial, Small Industrial & Other: 10%
Residential: 8%
Municipal: 1%
®Customer Overview
14
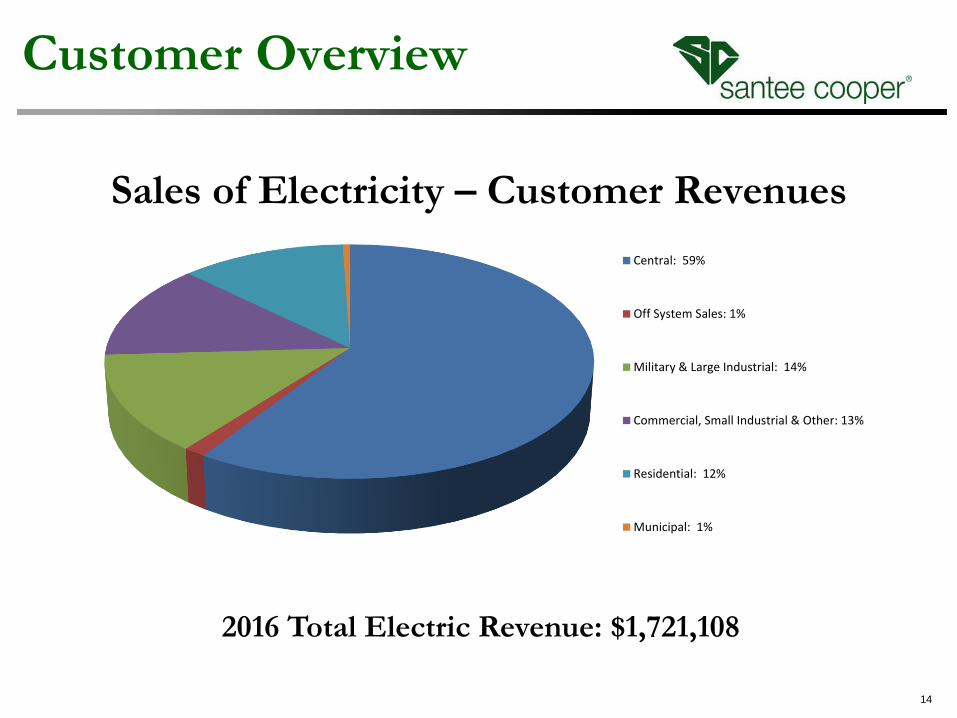
2016 Total Electric Revenue: $1,721,108
Sales of Electricity – Customer Revenues
Central: 59%
Off System Sales: 1%
Military & Large Industrial: 14%
Commercial, Small Industrial & Other: 13%
Residential: 12%
Municipal: 1%
®
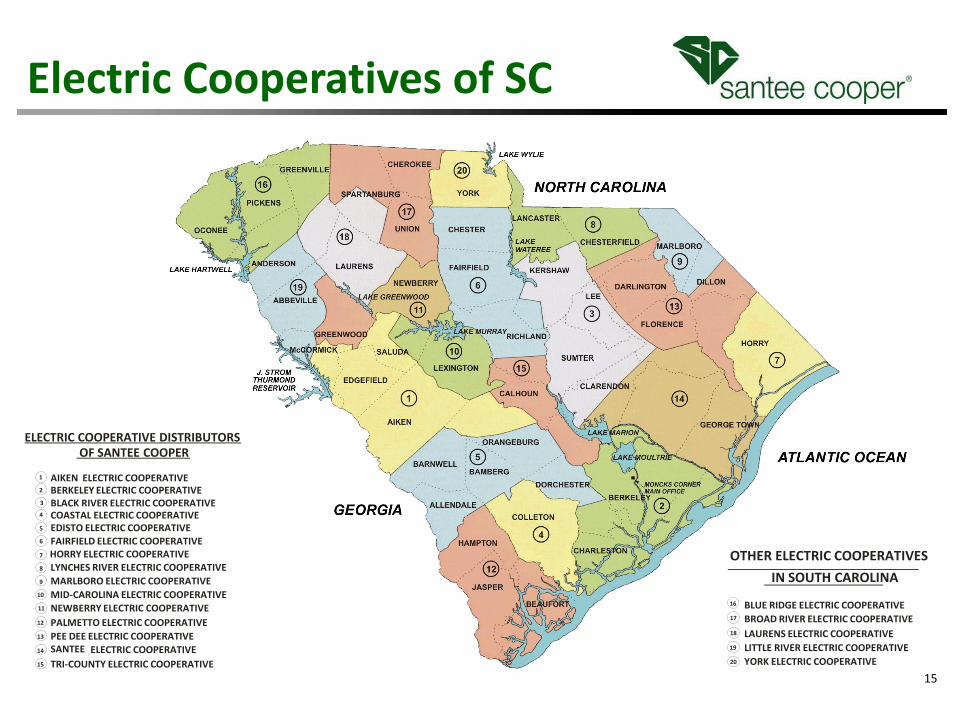
ELECTRIC COOPERATIVE DISTRIBUTORSOF SANTEE COOPER
16
17
18
20
BLUE RIDGE ELECTRIC COOPERATIVE
BROAD RIVER ELECTRIC COOPERATIVE
LAURENS ELECTRIC COOPERATIVE
LITTLE RIVER ELECTRIC COOPERATIVE
YORK ELECTRIC COOPERATIVE
OTHER ELECTRIC COOPERATIVES
IN SOUTH CAROLINA
1
2
3
4
5
6
7
8
9
10
11
12
13
14
AIKEN ELECTRIC COOPERATIVEBERKELEY ELECTRIC COOPERATIVEBLACK RIVER ELECTRIC COOPERATIVECOASTAL ELECTRIC COOPERATIVE
FAIRFIELD ELECTRIC COOPERATIVEHORRY ELECTRIC COOPERATIVELYNCHES RIVER ELECTRIC COOPERATIVE
MARLBORO ELECTRIC COOPERATIVE
MID-CAROLINA ELECTRIC COOPERATIVE
NEWBERRY ELECTRIC COOPERATIVE
PALMETTO ELECTRIC COOPERATIVE
PEE DEE ELECTRIC COOPERATIVESANTEE
TRI-COUNTY ELECTRIC COOPERATIVE
ELECTRIC COOPERATIVE
EDISTO ELECTRIC COOPERATIVE
15
19
Electric Cooperatives of SC
15

®
Customers: Cooperatives
• Coordination Agreement Background– Entered into December 31, 1980
– Amended in 1988 “1988 Amendment”
– Amended in 2013
• Central agreed to extend their rights to terminate the agreement until
December 31, 2058.
• Full requirements agreement
• Cost of service based
• Joint planning and operating committees coordinate
future resources and transmission planning
• Central has right to pass through Santee Cooper’s
industrial rate menu and energy efficiency retail
programs 16

®
Customers: Cooperatives
$0.0730 $0.0734 $0.0706
$-
$0.0200
$0.0400
$0.0600
$0.0800
$0.1000
2014 2015 2016
$/kWh
Central's Actual Cost of Service Rate
date-unit 1917

®
Water Systems Overview
18
Lake Marion
Regional Water System
®
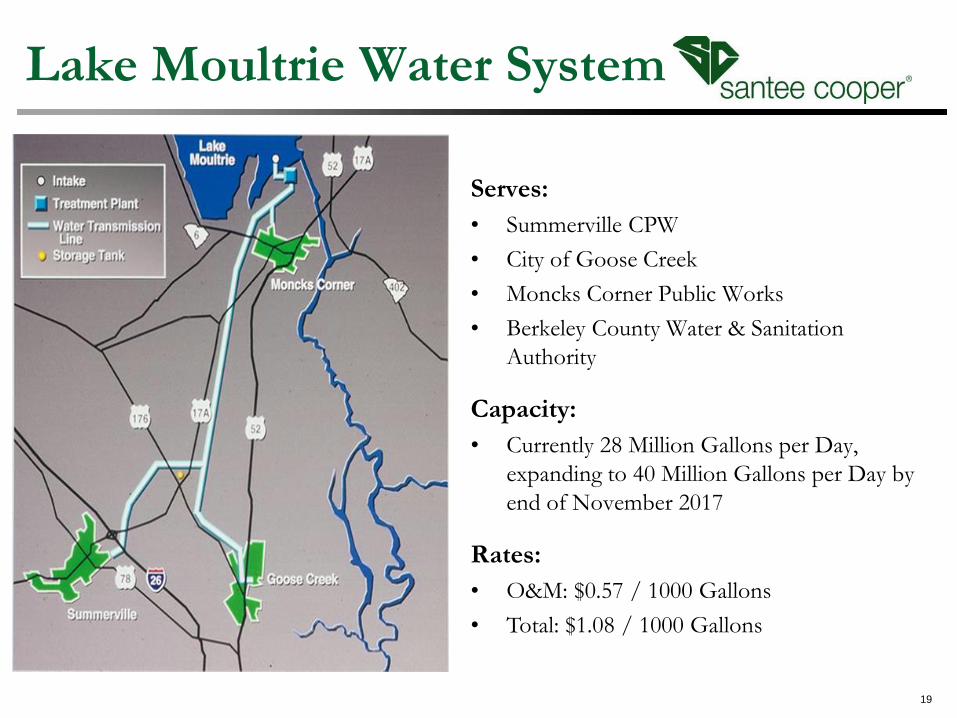
Lake Moultrie Water System
date-unit 19
Serves:
• Summerville CPW
• City of Goose Creek
• Moncks Corner Public Works
• Berkeley County Water & Sanitation
Authority
Capacity:
• Currently 28 Million Gallons per Day,
expanding to 40 Million Gallons per Day by
end of November 2017
Rates:
• O&M: $0.57 / 1000 Gallons
• Total: $1.08 / 1000 Gallons
®
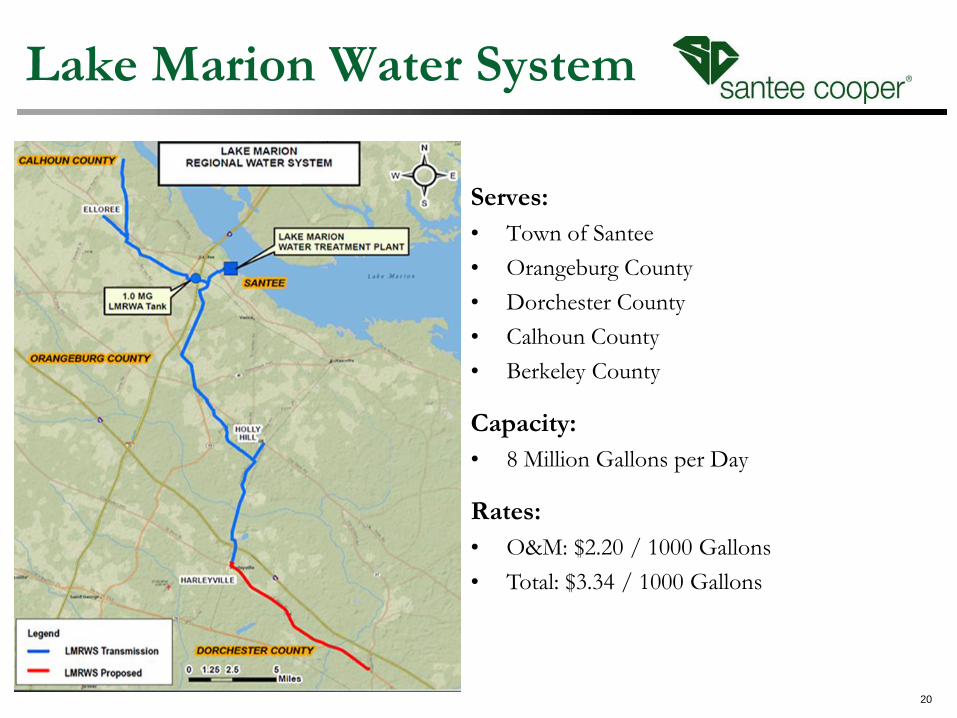
Lake Marion Water System
date-unit 20
Serves:
• Town of Santee
• Orangeburg County
• Dorchester County
• Calhoun County
• Berkeley County
Capacity:
• 8 Million Gallons per Day
Rates:
• O&M: $2.20 / 1000 Gallons
• Total: $3.34 / 1000 Gallons

®
21
Property Management

®
Santee Cooper Lakes
22
®
23
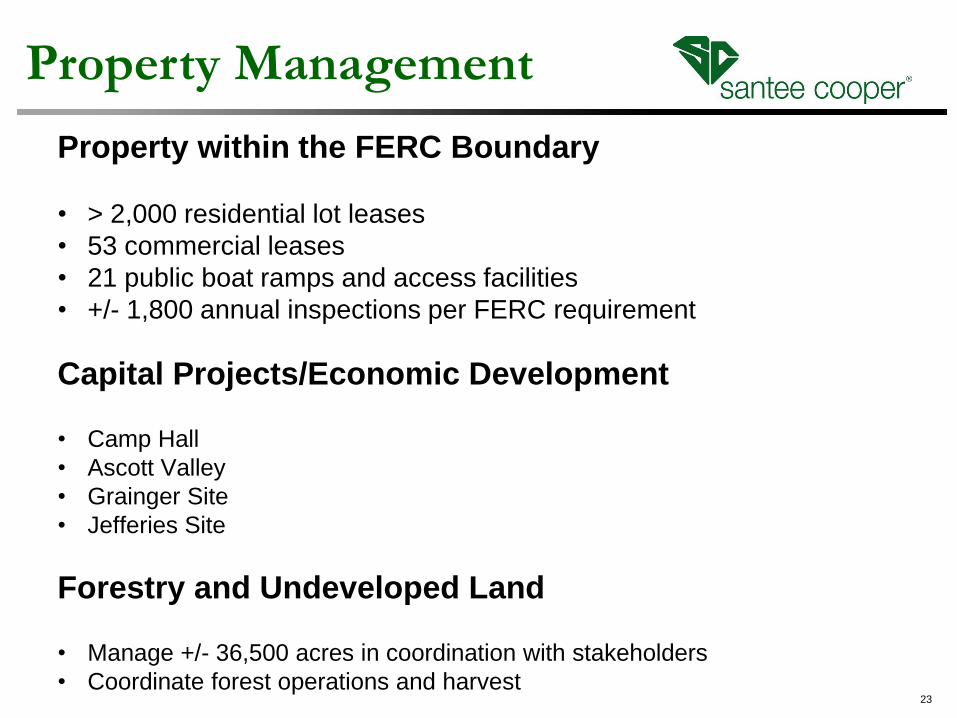
Property Management
Property within the FERC Boundary
• > 2,000 residential lot leases
• 53 commercial leases
• 21 public boat ramps and access facilities
• +/- 1,800 annual inspections per FERC requirement
Capital Projects/Economic Development
• Camp Hall
• Ascott Valley
• Grainger Site
• Jefferies Site
Forestry and Undeveloped Land
• Manage +/- 36,500 acres in coordination with stakeholders
• Coordinate forest operations and harvest
®
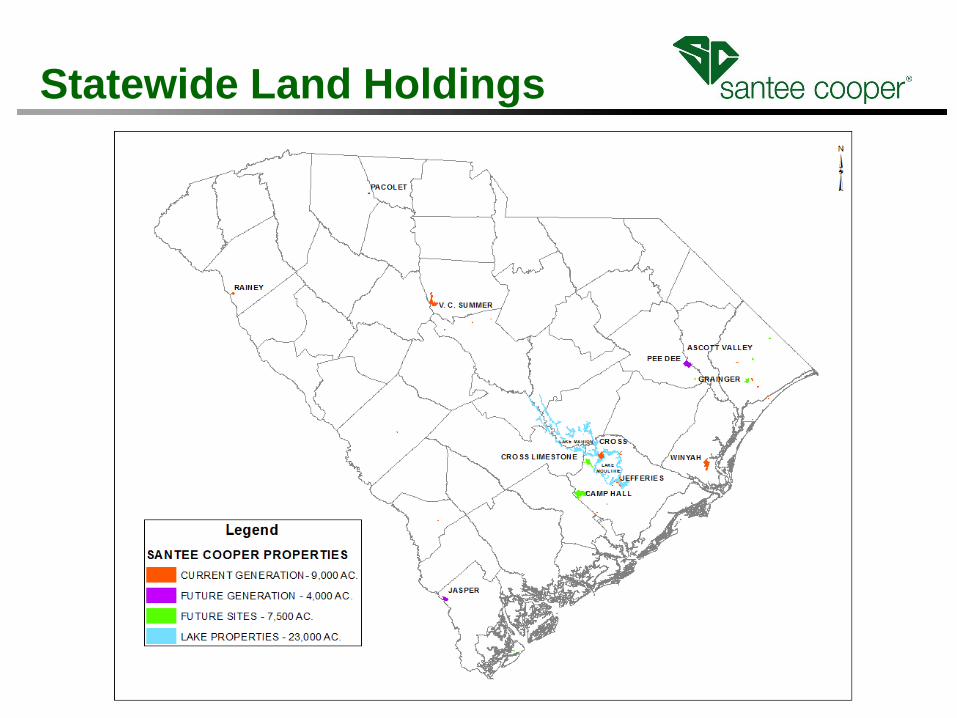
Statewide Land Holdings

®
Financial Overview
25
®
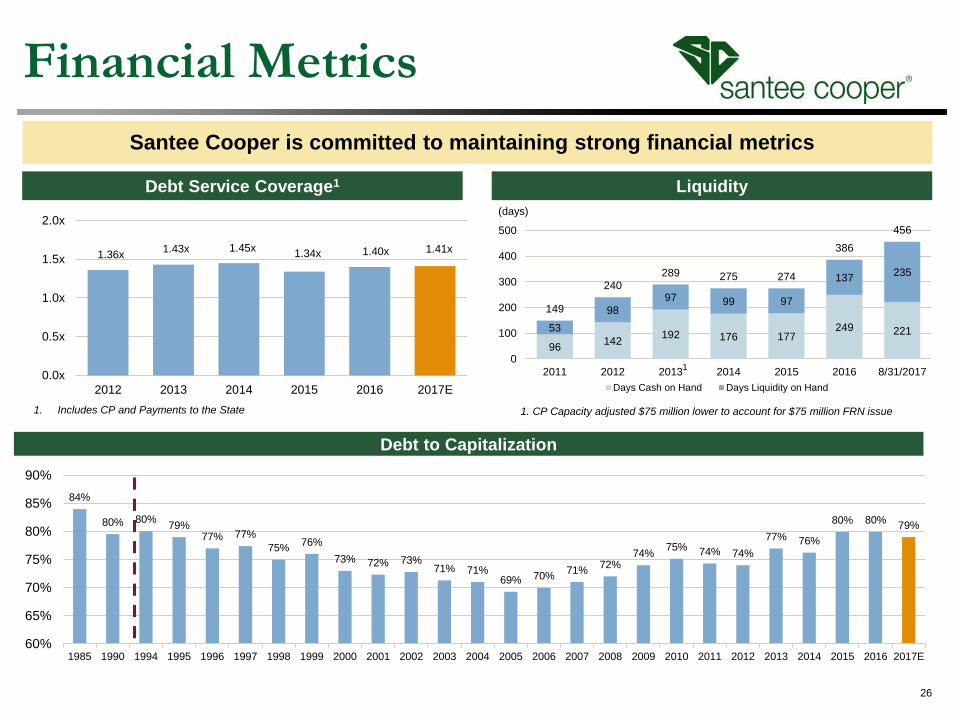
84%
80% 80%79%
77% 77%
75%76%
73% 72% 73%71% 71%
69% 70%71%
72%74%
75% 74% 74%
77% 76%
80% 80%79%
60%
65%
70%
75%
80%
85%
90%
1985 1990 1994 1995 1996 1997 1998 1999 2000 2001 2002 2003 2004 2005 2006 2007 2008 2009 2010 2011 2012 2013 2014 2015 2016 2017E
Santee Cooper is committed to maintaining strong financial metrics
Financial Metrics
Debt Service Coverage1 Liquidity
Debt to Capitalization
1.36x1.43x 1.45x
1.34x 1.40x 1.41x
0.0x
0.5x
1.0x
1.5x
2.0x
2012 2013 2014 2015 2016 2017E
96142
192 176 177249 22153
98
97 99 97
137235
149
240289 275 274
386
456
0
100
200
300
400
500
2011 2012 2013 2014 2015 2016 8/31/2017
(days)
Days Cash on Hand Days Liquidity on Hand
1. Includes CP and Payments to the State
1
1. CP Capacity adjusted $75 million lower to account for $75 million FRN issue
26
26
®
Balance Sheet
27
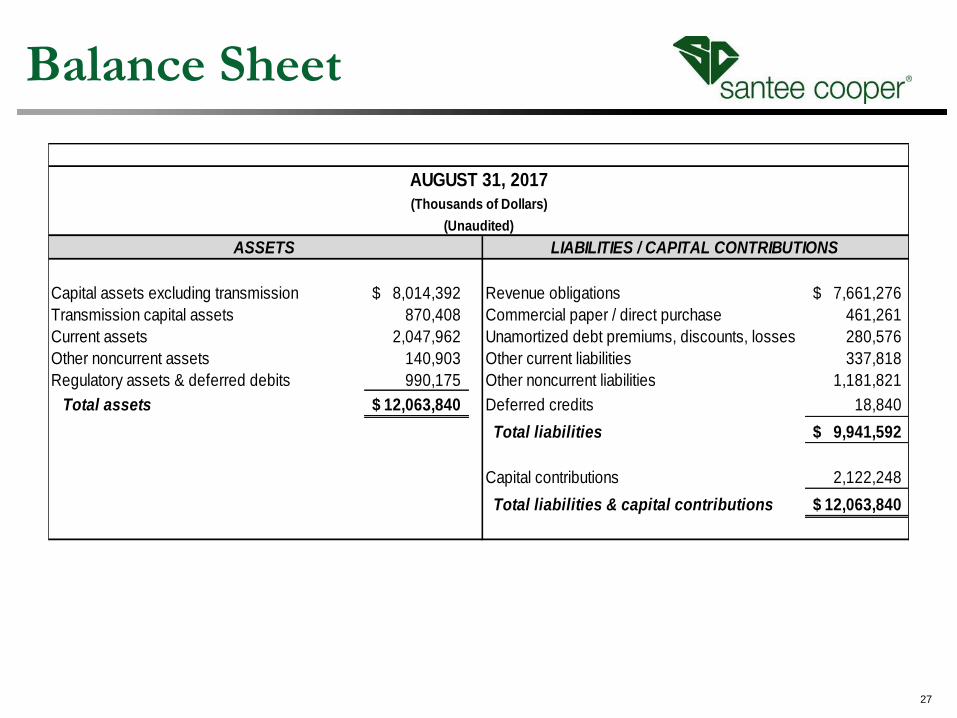
AUGUST 31, 2017
(Thousands of Dollars)
(Unaudited)
ASSETS LIABILITIES / CAPITAL CONTRIBUTIONS
Capital assets excluding transmission 8,014,392$ Revenue obligations 7,661,276$
Transmission capital assets 870,408 Commercial paper / direct purchase 461,261
Current assets 2,047,962 Unamortized debt premiums, discounts, losses 280,576
Other noncurrent assets 140,903 Other current liabilities 337,818
Regulatory assets & deferred debits 990,175 Other noncurrent liabilities 1,181,821
Total assets 12,063,840$ Deferred credits 18,840
Total liabilities 9,941,592$
Capital contributions 2,122,248
Total liabilities & capital contributions 12,063,840$
®
28
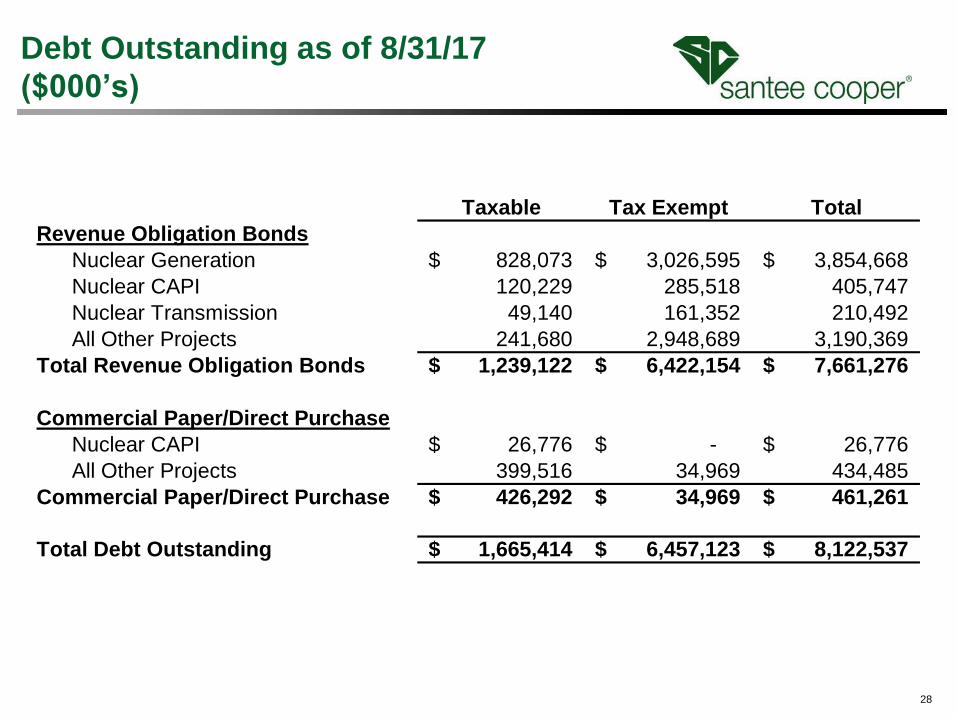
Debt Outstanding as of 8/31/17
($000’s)
Taxable Tax Exempt Total
Revenue Obligation Bonds
Nuclear Generation 828,073$ 3,026,595$ 3,854,668$
Nuclear CAPI 120,229 285,518 405,747
Nuclear Transmission 49,140 161,352 210,492
All Other Projects 241,680 2,948,689 3,190,369
Total Revenue Obligation Bonds 1,239,122$ 6,422,154$ 7,661,276$
Commercial Paper/Direct Purchase
Nuclear CAPI 26,776$ -$ 26,776$
All Other Projects 399,516 34,969 434,485
Commercial Paper/Direct Purchase 426,292$ 34,969$ 461,261$
Total Debt Outstanding 1,665,414$ 6,457,123$ 8,122,537$
®
29
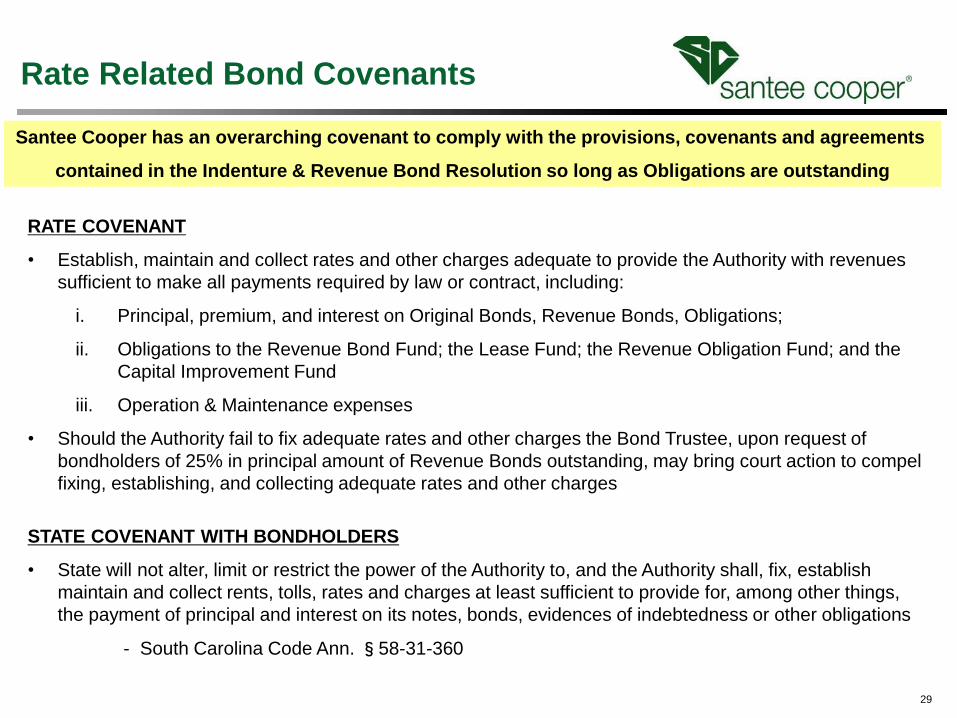
Rate Related Bond Covenants
Santee Cooper has an overarching covenant to comply with the provisions, covenants and agreements
contained in the Indenture & Revenue Bond Resolution so long as Obligations are outstanding
RATE COVENANT
• Establish, maintain and collect rates and other charges adequate to provide the Authority with revenues
sufficient to make all payments required by law or contract, including:
i. Principal, premium, and interest on Original Bonds, Revenue Bonds, Obligations;
ii. Obligations to the Revenue Bond Fund; the Lease Fund; the Revenue Obligation Fund; and the
Capital Improvement Fund
iii. Operation & Maintenance expenses
• Should the Authority fail to fix adequate rates and other charges the Bond Trustee, upon request of
bondholders of 25% in principal amount of Revenue Bonds outstanding, may bring court action to compel
fixing, establishing, and collecting adequate rates and other charges
STATE COVENANT WITH BONDHOLDERS
• State will not alter, limit or restrict the power of the Authority to, and the Authority shall, fix, establish
maintain and collect rents, tolls, rates and charges at least sufficient to provide for, among other things,
the payment of principal and interest on its notes, bonds, evidences of indebtedness or other obligations
- South Carolina Code Ann. §58-31-360

®Credit Ratings
Santee Cooper Compared to Other Utilities Senior Secured Debt Rating (10/10/17)
date-unit no-pre30

®
Note: Rates are calculated by dividing annual revenues by kWh sold for each customer class.
Santee Cooper South-Atlantic Region National AverageSouth Carolina
Santee Cooper’s retail rates remain competitive
Santee Cooper has maintained its
competitiveness with regional utilities and
continues to remain below the national
average, even with all the change in the
industry: economy, fuel market, and
supply strategy
Santee Cooper has dedicated programs
to deliver efficiencies and cost reductions.
Projected rates are expected to remain
competitive.
Rate Competitiveness
2016 Residential Rate Comparison
2016 Commercial Rate Comparison
2016 Industrial Rate Comparison
31
31
11.612.4
11.612.6
0.00
5.00
10.00
15.00
9.510.1 9.3
10.4
0.00
5.00
10.00
15.00
5.26.0 6.4 6.8
0.00
5.00
10.00

®
1% Payment to the State
$0
$5,000,000
$10,000,000
$15,000,000
$20,000,000
$25,000,000
$30,000,000
2012 2013 2014 2015 2016 2017
$19,617,000 $20,394,000 $20,659,000
$20,116,000 $19,192,000
$17,751,000
date-unit 32Note: 1% of Project Revenues

®
Operational Highlights
33
®
34
System Ratings
• Transmission Reliability:
99.9976%
• Transmission Lines:
5,039 miles
• Distribution Reliability:
99.9965%
• Distribution Lines:
2,806 miles
®
Economic Development Incentives
35
Economic Development Revolving Loan Program
$71,192,071 in loans approved as of September 30, 2017
Site Readiness Grants – established in 2014
$6 million/year for 5 years in electric cooperative service territory
$27,109,000 in grants committed as of September 30, 2017
$25,316,127 in grants paid as of September 30, 2017
$2.5 million/year for 5 years in municipal customer territory
$6,325,954 in grants committed as of September 30, 2017
$4,725,954 in grants paid as of September 30, 2017
Santee Cooper Economic Development Investment Funds
Closing Funds
$16,375,500 in grants committed from this program since January 1, 2012
$5,094,504 in grants paid from this program since January 1, 2012

®
Economic Development
36
• Incentive Rate
• Power Team – Nearly $12 billion in
capital investment
– 69,000 jobs
– Since 1988
• 177 Announcements
since 2012
• Volvo, Sigmatex,
Startek, Google,
Wyman-Gordon,
Samsung

Santee Cooper