santos - paragonfg.com.au · macquarie research santos 23 october 2015 2 value on offer sto advised...
TRANSCRIPT

Please refer to page 9 for important disclosures and analyst certification, or on our website
www.macquarie.com/research/disclosures.
AUSTRALIA
STO AU Outperform
Price (at 05:44, 22 Oct 2015 GMT) A$6.32
Valuation A$ 11.96 - DCF (WACC 9.0%, beta 1.3, ERP 5.0%, RFR 3.8%)
12-month target A$ 7.50
12-month TSR % +23.6
Volatility Index High
GICS sector Energy
Market cap A$m 6,560
30-day avg turnover A$m 54.1
Number shares on issue m 1,038
Investment fundamentals Year end 31 Dec 2014A 2015E 2016E 2017E
Revenue m 4,037.0 3,314.5 4,245.3 4,904.0 EBIT m 845.0 537.0 1,216.5 1,694.8 Reported profit m -935.0 127.0 485.9 883.8 Adjusted profit m 533.0 122.0 485.9 883.8 Gross cashflow m 1,777.0 1,429.2 1,846.5 2,344.3 CFPS ¢ 182.3 143.8 174.9 207.8
CFPS growth % 11.9 -21.1 21.6 18.8 PGCFPS x 3.5 4.4 3.6 3.0 PGCFPS rel x 0.42 0.49 0.42 0.39 EPS adj ¢ 54.7 12.2 45.8 78.3 EPS adj growth % 5.4 -77.6 275.0 70.8 PER adj x 11.6 51.7 13.8 8.1 PER rel x 0.78 3.32 0.92 0.60
Total DPS ¢ 35.0 30.0 31.5 34.7 Total div yield % 5.5 4.7 5.0 5.5 Franking % 100 100 100 100 ROA % 3.9 2.3 5.1 7.2 ROE % 5.4 1.4 5.6 9.2 EV/EBITDA x 7.1 8.2 6.1 5.0
Net debt/equity % 79.4 123.8 112.8 70.2 P/BV x 0.7 0.8 0.8 0.7
STO AU vs ASX 100, & rec history
Note: Recommendation timeline - if not a continuous line, then there was no Macquarie coverage at the time or there was an embargo period.
Source: FactSet, Macquarie Research, October 2015
(all figures in AUD unless noted)
Analyst(s) Kirit Hira +61 2 8232 9692 [email protected]
23 October 2015 Macquarie Securities (Australia) Limited
Santos Value on offer Event
STO advised that it has rejected an indicative, highly conditional and non-
binding proposal from Scepter Partners to acquire the company for a cash
consideration of A$6.88/sh (representing a 26% premium to last close and a
more material 29% premium to 1 month VWAP).
Impact
A fairly opportunistic offer: At A$6.88/sh, we estimate this implies an oil
price discounted by core and risked NAV of ~U$59/bbl and U$54/bbl, which
compares to longer-term futures curve at U$64/bbl and our LT normalised
assumption of U$80/bbl. Indeed STO also suggested that it did not reflect the
"fair value of the asset base", let alone a premium for control. While offers for
OSH would likely attract a premium vs. STO (given the differing quality of
assets, growth prospects, balance sheet position, etc), a comparison of
Scepter’s offer vs. WPL initial offer for OSH perhaps highlights the
opportunistic nature of the Scepter proposal. Indeed we estimate that the
pricing terms imply a 15-50% discount to WPL’s offer for OSH (based on 1
month VWAP prior to the disturbed price) based on various valuation metrics.
Conditions could have also proved challenging: Despite the Board’s
quick decision to reject the offer, we believe that this decision would have
been better communicated if the formal conditions were also released (as was
the case with WPL’s offer for OSH). Nonetheless, it would be fair to assume
that the conditions included the typical “no shop, no talk”, exclusivity, subject
to financing and due diligence provisions. While the bidder appears well
funded, any clauses surrounding exclusivity could hamper ongoing asset
sales over an extended due diligence process. With no guarantees
surrounding a potential transaction post due diligence, agreeing to the offer
would significantly narrow STO’s options and leave the company exposed.
Asset sales appear the preferred option: With indicative offers for asset-
levels also likely received (with the press reporting that initial offers could be
announced in early November), we believe that the Board’s decision reflects
the level of interest that has been received regarding specific assets. In our
recent note, STO - No assets are sacred, we highlighted those potential asset
scenarios and how the residual business could look. With the industry willing
to buy assets at the forward curve and with STO reportedly receiving plenty of
interest in asset sales, we continue to see this as the more favourable option
to expose the value of STO’s asset base. That said, if Scepter were to
increase their offer by a mere 10% to ~A$7.58/sh, we believe such an offer
could not as easily be dismissed as opportunistic by the STO Board
(particularly if concessions were made surrounding specific conditions).
Earnings and target price revision
No change
Price catalyst
12-month price target: A$7.50 based on a DCF methodology.
Catalyst: STO reports 3Q15 operating results on 23 October and we expect
will announce initial asset sales in early-to-mid November.
Action and recommendation
Maintain an Outperform rating and a A$7.50/sh target.
Macquarie Research Santos
23 October 2015 2
Value on offer
STO advised that it has rejected an indicative, highly conditional and non-binding proposal from
Scepter Partners to acquire the company for a cash consideration of A$6.88/sh, representing a
26% premium to last close and a more material 39% premium to 1 month VWAP (which compares
to WPL’s offer for OSH at a ~26% premium on a similar basis).
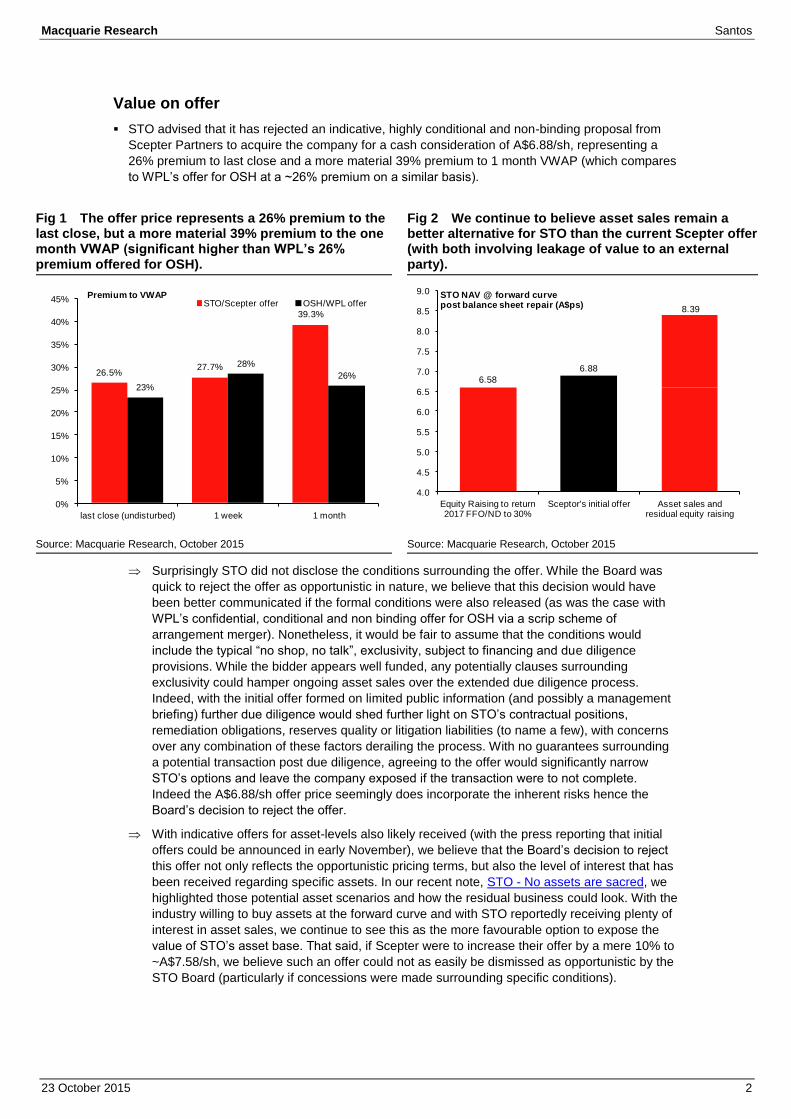
Fig 1 The offer price represents a 26% premium to the last close, but a more material 39% premium to the one month VWAP (significant higher than WPL’s 26% premium offered for OSH).
Fig 2 We continue to believe asset sales remain a better alternative for STO than the current Scepter offer (with both involving leakage of value to an external party).
Source: Macquarie Research, October 2015 Source: Macquarie Research, October 2015
Surprisingly STO did not disclose the conditions surrounding the offer. While the Board was
quick to reject the offer as opportunistic in nature, we believe that this decision would have
been better communicated if the formal conditions were also released (as was the case with
WPL’s confidential, conditional and non binding offer for OSH via a scrip scheme of
arrangement merger). Nonetheless, it would be fair to assume that the conditions would
include the typical “no shop, no talk”, exclusivity, subject to financing and due diligence
provisions. While the bidder appears well funded, any potentially clauses surrounding
exclusivity could hamper ongoing asset sales over the extended due diligence process.
Indeed, with the initial offer formed on limited public information (and possibly a management
briefing) further due diligence would shed further light on STO’s contractual positions,
remediation obligations, reserves quality or litigation liabilities (to name a few), with concerns
over any combination of these factors derailing the process. With no guarantees surrounding
a potential transaction post due diligence, agreeing to the offer would significantly narrow
STO’s options and leave the company exposed if the transaction were to not complete.
Indeed the A$6.88/sh offer price seemingly does incorporate the inherent risks hence the
Board’s decision to reject the offer.
With indicative offers for asset-levels also likely received (with the press reporting that initial
offers could be announced in early November), we believe that the Board’s decision to reject
this offer not only reflects the opportunistic pricing terms, but also the level of interest that has
been received regarding specific assets. In our recent note, STO - No assets are sacred, we
highlighted those potential asset scenarios and how the residual business could look. With the
industry willing to buy assets at the forward curve and with STO reportedly receiving plenty of
interest in asset sales, we continue to see this as the more favourable option to expose the
value of STO’s asset base. That said, if Scepter were to increase their offer by a mere 10% to
~A$7.58/sh, we believe such an offer could not as easily be dismissed as opportunistic by the
STO Board (particularly if concessions were made surrounding specific conditions).
26.5%27.7%
39.3%
23%
28%
26%
0%
5%
10%
15%
20%
25%
30%
35%
40%
45%
last close (undisturbed) 1 week 1 month
STO/Scepter offer OSH/WPL offerPremium to VWAP
6.58
6.88
8.39
4.0
4.5
5.0
5.5
6.0
6.5
7.0
7.5
8.0
8.5
9.0
Equity Raising to return 2017 FFO/ND to 30%
Sceptor's initial offer Asset sales and residual equity raising
STO NAV @ forward curvepost balance sheet repair (A$ps)

Macquarie Research Santos
23 October 2015 3
At A$6.88/sh, we estimate this implies an oil price discounted by core and risked NAV of
~U$59/bbl and U$54/bbl, which compares to longer-term futures curve at U$64/bbl and our LT
normalised assumption of U$80/bbl. Indeed STO also suggested that it did not reflect the "fair
value of the asset base", let alone a premium for control. While offers for OSH would likely
attract a premium vs. STO (given the differing quality of assets, growth prospects, balance
sheet position, etc), a comparison of Scepter’s offer vs. WPL initial offer for OSH perhaps
highlights the opportunistic nature of the Scepter proposal. Indeed we estimate that the pricing
terms imply a 15-50% discount to WPL’s offer for OSH (based on 1 month VWAP prior to the
disturbed price) based on various valuation metrics.
Fig 3 Scepter’s offer seemingly looks even more opportunistic than WPL’s offer for OSH, with the implied discount on various valuation metrics ranging from 15-50%.
WPL/OSH Scepter/STO Discount
Oil price discounted U$/bbl ~U$65/bbl ~U$54/bbl (15.6%) 2017 EV/prod U$/kboepd $116,355 $99,512 (14.5%) 2017 EV/EBITDA x 7.0 x 4.9 x (29.7%) 2017 EV/EBIT x 13.0 x 9.2 x (29.6%) EV/1P U$/boe $26.7 $21.2 (20.4%) EV/2P U$/boe $20.1 $10.6 (47.1%) EV/2P+2C U$/boe $9.1 $4.5 (51.0%)
Source: Macquarie Research, October 2015
Who is the bidder?
The bidder, Scepter Partners, is a Bermuda-based merchant bank and direct investment syndicate
for sovereign wealth led by the former Blackstone Advisor Partners Asian team. The group sponsors
the acquisition of large cap strategic assets with a focus on natural resources, infrastructure, real
estate and media/telecom (STO seems to tick two of these boxes).The core stakeholders include
high net worth senior members of Asian and Gulf-based ruling families (reportedly include ruling
families in Brunei and UAE). Scepter highlights that it invests with a long-term horizon, providing
businesses with capital to realise growth potential – indeed STO are seemingly in need of both.
With funds only recently allocated to the bidding party from high net worth individuals we
would expect that Scepter Partners remain keen to impress their key stakeholders with their
foundation transaction. Furthermore, with the key stakeholders supporting Scepter well known
(and publicised), we would suspect that management of Scepter (including Anthony Steains
the current CEO) would be keen to highlight their transaction experience to these
stakeholders. Consequently we do believe this is a creditable (albeit conditional) offer.
In mid-September the Board of Scepter stakeholders (led by HH Price Abdul Ali Kabier of
Brunei) allocated U$14b of discretionary assets. Scepter also claim that its key stakeholders
have net worth in excess of A$100bn, suggesting that the bidder is well funded.
STO always screened as the most obvious takeover target
In our recent note, Australian Energy Sector - The next M&A cycle set to commence, we painted a
picture of growing M&A against the backdrop of lower-for-longer oil prices. While we did not
necessarily believe that any of the locally listed large-cap E&P stocks were takeover targets in their
own right, we have now seen offers for two of the three stocks, namely STO and OSH. That said we
have always screened STO as the most obvious takeover target from a valuation perspective, albeit
there were stock specific challenges (namely the long-tail of assets).

Macquarie Research Santos
23 October 2015 4
Fig 4 Adopting average EV/2P transaction metrics for gas-weighted assets over the last 5 years and adjusting for sunk development costs, STO screened as the only possible takeover target
WPL STO OSH
Market EV/2P US$/bbl $8.26 $8.26 $8.26 5 year average of global gas focused transactions Developed EA gas mmboe 136 EV/2P U$/boe $10.00 Developed reserves justify slight premium Undeveloped EA gas mmboe 344 EV/2P U$/boe $2.07 25% of global avg EV/2P multiple Enterprise Value US$bn $0.00 $2.07 $0.00 Developed 2P Reserves mmboe 761 510 411 EV/2P U$/boe $14.46 $14.46 $14.46 Average capital intensity of Pluto, PNG LNG Undeveloped 2P Reserves mmboe 577 256 132 EV/2P U$/boe $8.26 $8.26 $8.26 5 year average of global gas focused transactions Enterprise Value US$bn $15.77 $9.48 $7.04 2C Resources mmboe 1,743 1,424 770 EV/2C U$/boe $1.65 $1.65 $1.65 20% of global avg EV/2P multiple Enterprise Value US$bn $2.88 $2.35 $1.27
Total Enterprise Value US$bn $18.65 $13.91 $8.31 Net Debt $3.82 $5.95 -$0.77 Excludes project financing for PNG LNG
Implied Market Cap A$ps $18.09 $11.01 $11.07 Issued shares 824 1,009 1,523
Implied share price $21.96 $10.91 $7.27
Premium to current share price -29% 73% -2%
Source: Macquarie Research, October 2015
Adopting average transaction metrics for gas-weighted transactions over the last five years
and making adjustments for the developed reserves base we estimate that the average
implied takeover premium vs. current share prices for Australian Energy stocks is merely 14%
- barely enough to build in a control premium. Indeed, as has historically been the case, STO
appears the only plausible takeover with the implied takeover price 70% above the current
share price.
STO continues to have a long-tail of assets which has historically dissuaded potential suitors
attracted to specific assets. However, with the offer price ascribing value for only STO’s five
most valuable assets under Macquarie assumptions (but closer to 20 assets under the
forward curve) and with the A&D market becoming more liquid, a risk-seeking buyer (such as
Scepter) could back itself to restructure STO’s portfolio (whether it be through asset sales or
carve-outs), leaving it with the most valuable assets.
Fig 5 STO has the largest portion of undeveloped reserves and largest resource-to-reserves ratio
Fig 6 While STO has a long-tail of assets, the most valuable 8 assets underpin the current enterprise value
Source: Company Data, Macquarie Research, August 2015 Source: Macquarie Research, August 2015
0
500
1,000
1,500
2,000
2,500
3,000
3,500
WPL STO OSH
Developed 2P Undeveloped 2P 2C2P+2C (mmboe)
0
2,000
4,000
6,000
8,000
10,000
12,000
14,000
16,000
18,000
20,000
GL
NG
PN
G L
NG
Co
op
er
Re
ind
ee
rK
ipp
er
Ch
im S
ao
Spar
Da
rwin
L
NG
NAV @ MRE assumptions
NAV @ Forward Curve
Offer EV
Enterprise Value (A$m)

Macquarie Research Santos
23 October 2015 5
Asset sales still the preferred option
With indicative offers for asset-levels also likely received (with the press reporting that initial offers
could be announced in early November), we believe that the Board’s decision to reject this offer not
only reflects the opportunistic pricing terms, but also the level of interest that has been received
regarding specific assets. In our recent note, STO - No assets are sacred, we highlighted those
potential asset scenarios and how the residual business could look. With the industry willing to buy
assets at the forward curve and with STO reportedly receiving plenty of interest in asset sales, we
continue to see this as the more favourable option to expose the value of STO’s asset base.
Focusing on NAV and FCF yields even adjusting for the additional equity required in instances
where there is a funding shortfall, we estimate that the implied TERP is at up to a 9% discount
to post asset sale/equity raising core NAV or 25% discount to risked NAV, with a sale of PNG
LNG delivering the largest discount. Nonetheless a sale of the highest margin businesses
(PNG LNG and WA&NT) hits 2017 FCF yields, despite the limited additional equity required
with 2017 yields falling to 11.3% and 10.6% respectively
Fig 7 Assuming each asset sale in isolation (and any equity issuance to resolve the shortfall) we estimate the TERP is still at up to a 25% discount to our post asset sale/equity issuance risked NAV
Fig 8 However minimising the requirement for equity through asset sales comes at a cost in term of FCF yields (albeit with STO still offering healthy yields on a post asset sale & post money basis)
Source: Macquarie Research, October 2015 Source: Macquarie Research, October 2015
Sale of producing assets will have an obvious impact on pro-forma production, EBITDA,
NPAT and FCF. While this could rebase the size of the business lower, as the executive
chairman Peter Coates has articulated, the focus of the strategic review is to “restore and
maximise shareholder value” not preserve production for the sake of maximising the scale of
the business. Indeed we would argue that the market is far more focused on STO’s balance
sheet and preserving the value of the asset base, rather than retaining a production base.
Fig 9 Assuming assets sales and a shortfall raising the STO business will look difference, however the focus should remain on the balance sheet and value creation, not necessarily headline production and earnings
2017 forecasts Base Case (A$2bn
raising)
PNG LNG sale
WA&NT sale
Moomba infrastructure
sale
SE Asia (ex PNG LNG)
sale
GLNG pipeline sale
Production mmboe 67.4 56.4 51.9 67.7 62.5 67.7 Sales mmboe 75.7 67.7 62.7 78.2 73.0 78.2 Revenue A$m 4,072 3,369 3,338 4,092 3,840 4,096 EBITDA A$m 2,474 1,942 1,955 2,395 2,303 2,448 EBIT A$m 1,028 695 723 943 923 996 NPAT A$m 467 320 289 417 405 447 EPS Acps 29 29 25 32 31 31 Operating Cash Flow A$m 2,293 1,879 1,796 2,225 2,100 2,265 Free Cash Flow A$m 1,156 777 773 1,201 1,019 1,152 EV/EBITDA x 7.2 x 7.1 x 7.3 x 6.3 x 6.6 x 6.4 x PER x 21.5 x 21.6 x 25.4 x 19.9 x 20.7 x 20.3 x FCF Yield % 11.6% 11.3% 10.6% 14.5% 12.2% 12.8% * Forecasts assume the forward curve and spot fx. Based upon TERP assuming a the equity shortfall is raised at a 30% discount to closing price on 22 Oct(A$6.32/sh)
Source: Macquarie Research, September 2015
-30%
-25%
-20%
-15%
-10%
-5%
0%
4
5
5
6
6
7
7
8
8
9
9
Base Case (A$2bn
raise)
PNG LNG sale
WA / NT sale
Moomba sale
SE Asia sale
GLNG pipeline
sale
Core NAV
Risked NAV
TERP discount to Core NAV [RHS]
STO NAV (A$/sh) %
1.4%
0.3%
3.4%
1.6%
2.8%
11.3%10.6%
14.5%
12.2%12.8%
0%
2%
4%
6%
8%
10%
12%
14%
16%
18%
PNG LNG sale
WA / NT sale Moomba sale SE Asia sale GLNG pipeline sale
2016 2017
Post asset sale and equity raising FCF Yield (based on TERP)

Macquarie Research Santos
23 October 2015 6
Fig 10 Santos financials
Source: Company data, Macquarie Research, October 2015
Santos (STO-AU) Share Price: A$6.32
Outperform Shares: 1004.4m
Profit & Loss 1H15A 2H15E 2014A 2015E 2016E 2017E Price Assumptions 1H15A 2H15E 2014A 2015E 2016E 2017E
Sales revenue A$m 1,611 1,711 4,037 3,322 4,245 4,904 US$/A$ ¢ 0.77 0.69 0.89 0.73 0.63 0.67
add other income A$m 44 43 81 87 81 76 Domestic gas A$/GJ 4.00 4.44 3.53 4.22 6.52 6.97
Total revenue A$m 1,655 1,753 4,118 3,408 4,326 4,980 Oil-Brent US$/bbl 57.53 52.00 100.08 54.76 58.25 67.00
less operating costs A$m (717) (829) (2,029) (1,546) (1,749) (1,825)
EBITDAX A$m 938 924 2,089 1,862 2,577 3,155 Production 1H15A 2H15E 2014A 2015E 2016E 2017E
less exploration expensed A$m (194) (90) (256) (284) (136) (140) Natural gas PJ 88.6 90.3 178.8 178.8 181.9 183.0
EBITDA A$m 744 834 1,833 1,578 2,441 3,015 Crude mmbbl 3.8 4.2 9.6 8.1 6.8 5.9
less dep. & amort. A$m (480) (543) (988) (1,023) (1,225) (1,320) Condensate mmbbl 1.9 2.0 3.2 3.9 3.9 3.9
less other non-cash costs A$m (13) - - (13) - - LPG k tonnes 74.3 91.3 167.4 165.6 180.0 183.9
EBIT A$m 251 291 845 542 1,217 1,695 LNG k tonnes 660.7 704.7 826.7 1365.4 1926.3 2367.7
less net interest A$m (125) (149) (97) (274) (444) (369) Total production mmboe 29.1 28.4 54.1 58.4 63.3 67.4
Pre-tax operating profit A$m 126 142 748 268 772 1,325 Third party sales mmboe 6.5 4.4 12.5 8.4 11.7 12.8
less tax expense (incl PRRT) A$m (94) (52) (215) (146) (286) (441) Total sales mmboe 34.8 31.0 63.7 64.8 70.8 75.7
Net operating profit A$m 32 90 533 122 486 884
add non-recurring items A$m 5 - (1,468) 5 - -
Reported profit A$m 37 90 (935) 127 486 884
add (goodw ill amm - pref div) A$m - - - - - -
Adjusted profit A$m 32 90 533 122 486 884
0% 0% 0%
EPS (Adjusted) Acps 3.3 9.0 54.7 12.3 46.1 80.1
EPS Grow th % -88% 177% 5% -78% 276% 74%
DPS (Ordinary & Special) Acps 15 15 35 30 32 35
Franking % 100% 100% 100% 100% 100% 100%
EFPOWA shares on issue m 984 1,004 975 994 1,050 1,103
Cashflow Analysis 1H15A 2H15E 2014A 2015E 2016E 2017E Reserves 2014A 2015E 2016E 2017E
Cash receipts from operations A$m 1,825 1,754 4,577 3,579 4,318 5,172 Natural gas PJ 6,786 6,607 6,425 6,242
less operating costs A$m (1,031) (833) (2,371) (1,864) (2,217) (1,771) Oil mmbbl 62 54 47 41
less gross interest paid A$m (83) (126) (49) (209) (389) (321) Condensate mmbbl 63 59 55 51
less tax paid A$m (77) (34) (164) (111) (111) (163) LPG k tonnes 3,022 2,856 2,676 2,492
Cashflow from operations A$m 634 761 1,993 1,395 1,601 2,917 Total 2P reserves mmboe 1,245 1,186 1,123 1,056
less development & exploration A$m (1,288) (1,160) (3,714) (2,448) (1,051) (1,138) Contingent resources mmbbl 1,721 1,721 1,721 1,721
less acq./inv. A$m (125) - (48) (125) - - Total reserves & resources mmboe 2,966 2,907 2,844 2,777
add divestment A$m 47 45 1 92 - -
less dividends paid A$m (107) (151) (196) (258) (315) (364) 2P reserve life years 23.1 20.3 17.7 15.7
add debt movements A$m 334 27 2,081 361 (150) (1,765) EV/ 1P reserves A$/boe 22.20 24.50 27.60 31.88
add equity movements/other A$m 106 151 10 257 315 364 EV / 2P reserves A$/boe 11.11 11.65 12.31 13.10
Net cashflow A$m (399) (327) 127 (726) 400 14 EV / Total resources A$/boe 4.66 4.76 4.86 4.98
add exchange rate adj. A$m 23 - 4 23 - - EV/ 1P reserves US$/boe 17.32 19.11 21.52 24.87
Increase in cash A$m (376) (327) 131 (703) 400 14 EV / 2P reserves US$/boe 8.66 9.09 9.60 10.21
Net debt at year end A$m 8,600 10,421 7,477 10,421 9,952 7,355 EV / Total resources US$/boe 3.64 3.71 3.79 3.88
Balance Sheet 1H15A 2H15E 2014A 2015E 2016E 2017E Per Barrel Statistics 1H15A 2H15E 2014A 2015E 2016E 2017E
Cash & cash eq. A$m 399 72 775 72 472 486 Sales revenue / boe US$/boe 56.63 57.04 66.44 41.31 42.43 48.95
Current assets A$m 1,662 1,340 2,065 1,340 1,751 1,582 EBIT / boe US$/boe 8.82 9.71 13.91 6.74 12.16 16.92
Fixed assets A$m 21,851 22,417 20,280 22,417 22,106 21,743 Profit / boe US$/boe 1.12 3.01 8.77 1.52 4.86 8.82
Total assets A$m 23,513 23,757 22,345 23,757 23,857 23,325 Opex/boe US$/boe 11.92 11.10 16.44 11.53 9.40 9.22
Current liabilities A$m 1,578 1,395 1,946 1,395 2,563 2,553 Capex/boe US$/boe 34.67 26.61 61.13 30.45 10.50 11.36
Total liabilities A$m 13,800 15,336 12,932 15,336 15,032 12,840 DDA/boe US$/boe 16.62 17.87 16.26 12.54 12.09 13.04
Shareholder equity A$m 9,713 8,421 9,413 8,421 8,824 10,485 Cash flow /boe US$/boe 22.29 25.37 32.80 17.35 16.00 29.12
Ratio Analysis 1H15A 2H15E 2014A 2015E 2016E 2017E NPV @ WACC of 9.0%
ND/ND+E % 47% 55% 44% 55% 53% 41% Producing assets A$m A$ps %
Interest cover x 2.1 x 2.5 x 8.7 x 2.0 x 2.7 x 4.6 x Cooper Basin Area 2,647 2.62
Dividend payout ratio % 461% 167% -37% 235% 68% 43% Onshore Queensland CSG Assets 79 0.08
ROA % 1% 1% 4% 2% 5% 7% Otw ay Gas 245 0.24
ROE % 0% 1% 5% 1% 6% 9% WA Gas 1,484 1.47
ROIC % 0% 0% 4% 2% 4% 6% WA Oil 522 0.52
Effective tax rate % 76% 33% 34% 53% 32% 31% South East Asia 868 0.86
EBITDA margin % 46% 49% 45% 48% 58% 61% Bayu-Undan 376 0.37
EBIT margin % 16% 17% 21% 16% 29% 35% PNG LNG trains 1 & 2 risked valuation @ 100% 2,964 2.94
Free cash f low A$m (607) (354) (1,720) (961) 550 1,779 Developing assets
Kipper risked valuation @ 100% 634 0.63
Valuation 1H15A 2H15E 2014A 2015E 2016E 2017E Glastone LNG train 1&2 risked valuation @ 100% 5,262 5.21
EV/EBITDAX ratio x 17.4 x 15.0 x 6.6 x 7.4 x 5.4 x 4.4 x Cooper Basin - 2C risked valuation @ 50% 509 0.50
EV/DACF ratio x 22.4 x 18.0 x 7.6 x 9.2 x 7.0 x 5.6 x PNG LNG debottleneck risked valuation @ 75% 124 0.12
P/E ratio x 242.2 x 70.2 x 11.6 x 51.6 x 13.7 x 7.9 x Static assets & exploration
P/CFPS ratio x 22.0 x 17.5 x 3.5 x 4.4 x 3.6 x 3.0 x PNG LNG train 3 risked valuation @ 75% 449 0.45
FCF yield % nmf nmf nmf nmf 8.2% 25.6% Discoveries 687 0.68
Dividend yield % 1.9% 2.4% 5.5% 4.7% 5.0% 5.5% Exploration 990 0.98
Financial assets
Sensitivities (Adjusted Earnings) Valuation 2014A 2015E 2016E 2017E Corporate/tariffs/other 185 0.18
Oil price (+US$1/bbl) A$m 12.11 533 144 524 942 Cash & Investments 444 0.44
delta 0.15 0 21 38 58 Debt (6,395) (6.34)
1.3% 0.0% 17.5% 7.8% 6.6% Risked NPV 12,074 11.96
Currency (+1c) A$m 11.69 533 122 469 871 Shareprice prem/(disc) to NPV -47%
delta (0.27) 0 (0) (17) (13) - core NPV per share (A$) 10.03
-2.3% 0.0% -0.4% -1.7% -1.2% - risked NPV per share (A$) 11.96
- unrisked NPV per share (A$) 15.34
0
10
20
30
40
50
60
70
80
2000
2001
2002
2003
2004
2005
2006
2007
2008
2009
2010
2011
2012
2013
2014
2015
2016
2017
2018
2019
2020
Gas Crude Condensate LPG LNGmmboe

Macquarie Research Santos
23 October 2015 7
Fig 11 Santos NAV breakdown
Source: Macquarie Research, October 2015
Producing Assets Interest Unrisked Unrisked Risk Risked Risked USD/boe A$ps A$ps % NPV Sensitivity
mmmboe AUD (m) mmmboe AUD (m) risked unrisked -$10 Base +$10
Cooper Basin - 2P 63.0% 212 2,647 100% 212 2,647 9.4 2.62 2.62 22% 1.38 2.62 2.33
Surat / Denison various 6 68 100% 6 68 8.9 0.07 0.07 1% 0.08 0.07 0.08
Fairview 30.0% 1 11 100% 1 11 11.0 0.01 0.01 0% - 0.01 -
Casino & Henry 50.0% 16 224 100% 16 224 10.8 0.22 0.22 2% 0.25 0.22 0.25
Minerva 10.0% 2 21 100% 2 21 6.5 0.02 0.02 0% 0.02 0.02 0.02
Bayu-Undan 11.5% 19 376 100% 19 376 14.6 0.37 0.37 3% 0.29 0.37 0.48
John Brookes 45.0% 47 328 100% 47 328 5.3 0.33 0.33 3% 0.27 0.33 0.28
Spar/Halyard (Aus) 45.0% 32 409 100% 32 409 9.6 0.41 0.41 3% 0.49 0.41 0.52
Reindeer/Carabou 45.0% 35 746 100% 35 746 15.9 0.74 0.74 6% 0.74 0.74 0.96
Barrow Island 28.6% 4 141 100% 4 141 26.9 0.14 0.14 1% 0.12 0.14 0.16
Stag 66.7% 6 238 100% 6 238 27.6 0.24 0.24 2% 0.20 0.24 0.28
Mutineer / Exeter 41.6% 1 30 100% 1 30 32.6 0.03 0.03 0% 0.02 0.03 0.03
Fletcher/Finucane 44.0% 3 113 100% 3 113 26.7 0.11 0.11 1% 0.08 0.11 0.12
Maleo & Peluang 67.5% 6 194 100% 6 194 26.5 0.19 0.19 2% 0.22 0.19 0.22
SE Gobe 9.4% 0 6 100% 0 6 27.4 0.01 0.01 0% 0.00 0.01 0.01
Chim Sao & Dua (Vietnam) 31.9% 13 599 100% 13 599 35.2 0.59 0.59 5% 0.56 0.59 0.79
Oyong & Wortel 45.0% 6 69 100% 6 69 9.3 0.07 0.07 1% 0.07 0.07 0.07
PNG LNG trains 1 & 2 13.5% 234 2,964 100% 234 2,964 9.5 2.94 2.94 25% 2.25 2.94 3.42
Sub Total 642 9,185 642 9,185 10.7 9.10 9.10 76% 7.04 9.10 10.04
Developing Assets
Gladstone LNG train 1&2 30.0% 451 5,262 100% 451 5,262 8.7 5.21 5.21 44% 3.64 5.21 5.43
PNG LNG debottleneck 13.5% 1 166 75% 0 124 239.6 0.12 0.16 1% 0.24 0.12 0.29
Kipper 35.0% 45 634 100% 45 634 10.6 0.63 0.63 5% 0.63 0.63 0.67
Cooper Basin - 2C 63.0% 212 1,017 50% 106 509 3.6 0.50 1.01 4% 0.00 0.50 0.37
Mereenie - 2P 50.0% 14 149 100% 14 149 8.2 0.15 0.15 1% 0.14 0.15 0.16
Gunnedah Basin (2P) 80.0% 133 736 20% 27 147 4.2 0.15 0.73 1% 0.16 0.15 0.16
Sub Total 855 7,964 643 6,825 8.0 6.76 7.89 57% 4.81 6.76 7.08
Static Assets
PNG LNG expansion train(s) 11.5% 66 599 75% 49 449 6.8 0.45 0.59 4% 0.37 0.45 0.54
Ande Ande Lumut - K-sand 50.0% 51 121 75% 38 91 7.4 0.09 0.12 1% 0.04 0.09 0.12
Sole - 2C 50.0% 18 30 75% 14 22 8.3 0.02 0.03 0% 0.04 0.02 0.04
Mereenie - 2C 50.0% 14 115 15% 2 17 6.4 0.02 0.11 0% 0.02 0.02 0.02
Caldita/Barossa 25.0% 125 666 30% 38 200 4.0 0.20 0.66 2% 0.09 0.20 0.28
Petrel/Tern 40.0% 152 202 30% 46 61 1.0 0.06 0.20 1% 0.06 0.06 0.06
Sub Total 273 1,530 141 779 4.2 0.83 1.52 6% 0.56 0.77 1.00
Exploration
Zola (Contingent) 24.8% 21 56 50% 10 28 3.0 0.03 0.06 0% 0.03 0.03 0.03
Bianchi (Prospective) 24.8% 12 20 50% 6 10 3.0 0.01 0.02 0% 0.01 0.01 0.01
Zola (Prospective) 24.8% 84 309 20% 17 62 3.0 0.06 0.31 1% 0.06 0.06 0.06
Burnside-1 (Aus) 47.8% 120 268 25% 30 67 2.0 0.07 0.27 1% 0.06 0.07 0.06
Winchester-1 (Aus) 75.0% 167 728 50% 83 364 3.5 0.36 0.72 3% 0.33 0.36 0.33
Crow n-1 (Aus) 30.0% 118 284 50% 59 142 2.0 0.14 0.28 1% 0.13 0.14 0.13
Lasseter-1 (Aus) 30.0% 144 353 50% 72 176 2.0 0.17 0.35 1% 0.16 0.17 0.16
Bestari-1 Block R PSC (Malay) 20.0% 40 245 50% 20 123 5.0 0.12 0.24 1% 0.11 0.12 0.11
Gunnedah Basin (2C) 50.0% 108 233 5% 5 12 1.8 0.01 0.23 0% 0.01 0.01 0.01
Cooper Basin - Shale 63.0% 26 69 10% 3 7 2.0 0.01 0.07 0% 0.01 0.01 0.01
Sub total 840 2,565 306 990 2.4 0.98 2.54 8% 0.82 0.98 0.82
Financial & Corporate
Cash & investments 444 0.44 0.44 4% 0.81 0.44 0.81
Debt & hybrid (6,395) (6.34) (6.34) -53% (5.92) (6.34) (5.92)
Base business carbon - - - 0% - - -
LNG projects carbon - - - - 0% - - -
ORR, Tariffs 440 0.44 0.44 4% 0.44 0.44 0.44
Third Party Sales 189 0.19 0.19 2% 0.25 0.19 0.25
Corporate overheads (445) (0.44) (0.44) -4% (0.50) (0.44) (0.50)
Sub Total (5,767) (5.71) (5.71) -48% (4.92) (5.71) (4.92)
Overall total 2,610 mmboe 12,013 AUDm 11.96 15.34 99% 8.36 11.96 14.07
-core NPV per share (A$) 833 10.03 6.69 10.03 11.91
-risked NPV per share (A$) 1,731 11.96 8.36 11.96 14.07
-unrisked NPV per share (A$) 2,610 15.34 11.86 15.34 18.47
Diluted number of shares (m) 1,009.3
Ordinary Shares on Issue (m) 1,004.4
In-the-money options outstanding (m) 4.9
Exchange Rate 0.75
WACC (post tax) 9.0%
Share Price 6.32
Price premium (discount) to NPV -47%
Proportion of NAV from LNG 75%
Franking credits (risked at 50% - A$ps) 0.40

Macquarie Research Santos
23 October 2015 8
Macquarie Quant View
The quant model currently holds a strong negative view on Santos. The
strongest style exposure is Growth, indicating this stock has good historic
and/or forecast growth. Growth metrics focus on both top and bottom line
items. The weakest style exposure is Price Momentum, indicating this
stock has had weak medium to long term returns which often persist into
the future.
Displays where the
company’s ranked based on
the fundamental consensus
Price Target and
Macquarie’s Quantitative
Alpha model.
Two rankings: Local market
(Australia & NZ) and Global
sector (Energy)
536/574 Global rank in
Energy
% of BUY recommendations 62% (8/13)
Number of Price Target downgrades 6
Number of Price Target upgrades 1
Macquarie Alpha Model ranking Factors driving the Alpha Model
A list of comparable companies and their Macquarie Alpha model score
(higher is better).
For the comparable firms this chart shows the key underlying styles and their
contribution to the current overall Alpha score.
Macquarie Earnings Sentiment Indicator Drivers of Stock Return
The Macquarie Sentiment Indicator is an enhanced earnings revisions
signal that favours analysts who have more timely and higher conviction
revisions. Current score shown below.
Breakdown of 1 year total return (local currency) into returns from dividends, changes
in forward earnings estimates and the resulting change in earnings multiple.
What drove this Company in the last 5 years How it looks on the Alpha model
Which factor score has had the greatest correlation with the company’s
returns over the last 5 years.
A more granular view of the underlying style scores that drive the alpha (higher is
better) and the percentile rank relative to the sector and market.
Source (all charts): FactSet, Thomson Reuters, and Macquarie Research. For more details on the Macquarie Alpha model or for more customised analysis and screens, please contact the Macquarie Global Quantitative/Custom Products Group ([email protected])
Fu
nd
am
en
tals
Quant
Local market rank Global sector rank
Attractive
-2.7
-2.6
-1.3
-0.9
-0.3
0.3
-3.0 -2.0 -1.0 0.0 1.0 2.0 3.0
Beach Energy
Santos
WorleyParsons
Oil Search
Woodside Petroleum
Caltex Australia
-100% -80% -60% -40% -20% 0% 20% 40% 60% 80% 100%
Beach Energy
Santos
WorleyParsons
Oil Search
Woodside Petroleum
Caltex Australia
Valuations Growth Profitability Earnings
Momentum
Price
Momentum
Quality
-0.6
-1.0
-0.5
-0.7
-0.2
0.6
-3.0 -2.0 -1.0 0.0 1.0 2.0 3.0
Beach Energy
Santos
WorleyParsons
Oil Search
Woodside Petroleum
Caltex Australia
-70% -50% -30% -10% 10% 30% 50% 70%
Beach Energy
Santos
WorleyParsons
Oil Search
Woodside Petroleum
Caltex Australia
Dividend Return Multiple Return Earnings Outlook 1Yr Total Return
-31%
-31%
-21%
-20%
31%
31%
32%
34%
-40% -20% 0% 20% 40%
⇐ Negatives Positives ⇒
Operating Leverage NTM
PEG Ratio Inverted
Operating Leverage Inc.
EPS Growth FY1
Operating Margin NTM
EPS Growth 5yr Historic
Interest Cover
EV/EBITDA FY0
0 1
Technicals & TradingRisk
LiquidityCapital & Funding
QualityPrice Momentum
Earnings MomentumProfitability
Growth
ValuationAlpha Model Score
-0.11-1.40
-1.19 0.01
-0.73-1.62
-0.41-0.41-0.03
-1.09-2.59
0 1
Normalized
Score
0 50 100
Percentile relative
to sector(/574)
0 50 100
Percentile relative
to market(/395)

Macquarie Research Santos
23 October 2015 9
Important disclosures:
Recommendation definitions
Macquarie - Australia/New Zealand Outperform – return >3% in excess of benchmark return Neutral – return within 3% of benchmark return Underperform – return >3% below benchmark return Benchmark return is determined by long term nominal GDP growth plus 12 month forward market dividend yield
Macquarie – Asia/Europe Outperform – expected return >+10% Neutral – expected return from -10% to +10% Underperform – expected return <-10%
Macquarie First South - South Africa Outperform – expected return >+10% Neutral – expected return from -10% to +10% Underperform – expected return <-10%
Macquarie - Canada Outperform – return >5% in excess of benchmark return Neutral – return within 5% of benchmark return Underperform – return >5% below benchmark return
Macquarie - USA Outperform (Buy) – return >5% in excess of Russell 3000 index return Neutral (Hold) – return within 5% of Russell 3000 index return Underperform (Sell)– return >5% below Russell 3000 index return
Volatility index definition*
This is calculated from the volatility of historical price movements. Very high–highest risk – Stock should be expected to move up or down 60–100% in a year – investors should be aware this stock is highly speculative. High – stock should be expected to move up or down at least 40–60% in a year – investors should be aware this stock could be speculative. Medium – stock should be expected to move up or down at least 30–40% in a year. Low–medium – stock should be expected to move up or down at least 25–30% in a year. Low – stock should be expected to move up or down at least 15–25% in a year. * Applicable to Asia/Australian/NZ/Canada stocks only
Recommendations – 12 months Note: Quant recommendations may differ from Fundamental Analyst recommendations
Financial definitions
All "Adjusted" data items have had the following adjustments made: Added back: goodwill amortisation, provision for catastrophe reserves, IFRS derivatives & hedging, IFRS impairments & IFRS interest expense Excluded: non recurring items, asset revals, property revals, appraisal value uplift, preference dividends & minority interests EPS = adjusted net profit / efpowa* ROA = adjusted ebit / average total assets ROA Banks/Insurance = adjusted net profit /average total assets ROE = adjusted net profit / average shareholders funds Gross cashflow = adjusted net profit + depreciation *equivalent fully paid ordinary weighted average number of shares All Reported numbers for Australian/NZ listed stocks are modelled under IFRS (International Financial Reporting Standards).
Recommendation proportions – For quarter ending 30 September 2015
AU/NZ Asia RSA USA CA EUR
Outperform 48.87% 59.96% 35.63% 42.13% 59.44% 42.11% (for US coverage by MCUSA, 3.54% of stocks followed are investment banking clients)
Neutral 33.44% 25.00% 39.08% 52.55% 37.06% 38.42% (for US coverage by MCUSA, 5.05% of stocks followed are investment banking clients)
Underperform 17.68% 15.04% 25.29% 5.32% 3.50% 19.47% (for US coverage by MCUSA, 0.51% of stocks followed are investment banking clients)
STO AU vs ASX 100, & rec history
(all figures in AUD currency unless noted)
Note: Recommendation timeline – if not a continuous line, then there was no Macquarie coverage at the time or there was an embargo period.
Source: FactSet, Macquarie Research, October 2015
12-month target price methodology
STO AU: A$7.50 based on a DCF methodology
Company-specific disclosures: STO AU: Macquarie and its affiliates collectively and beneficially own or control 1% or more of any class of Santos Limited's equity securities. Important disclosure information regarding the subject companies covered in this report is available at www.macquarie.com/disclosures.
Date Stock Code (BBG code) Recommendation Target Price 09-Sep-2015 STO AU Outperform A$7.50 14-Aug-2015 STO AU Outperform A$9.00 15-Apr-2015 STO AU Outperform A$10.00 09-Mar-2015 STO AU Outperform A$11.00 09-Dec-2014 STO AU Outperform A$12.00 02-Dec-2014 STO AU Outperform A$14.50 08-Oct-2014 STO AU Outperform A$15.50 27-Jun-2014 STO AU Outperform A$17.00 16-May-2014 STO AU Outperform A$16.50 16-Aug-2013 STO AU Outperform A$17.00 23-Feb-2013 STO AU Outperform A$16.50
Target price risk disclosures: STO AU: Any inability to compete successfully in their markets may harm the business. This could be a result of many factors which may include geographic mix and introduction of improved products or service offerings by competitors. The results of operations may be materially affected by global economic conditions generally, including conditions in financial markets. The company is exposed to market risks, such as changes in interest rates, foreign exchange rates and input prices. From time to time, the company will enter into transactions, including transactions in derivative instruments, to manage certain of these exposures.
Analyst certification: We hereby certify that all of the views expressed in this report accurately reflect our personal views about the subject company or companies and its or their securities. We also certify that no part of our compensation was, is or will be, directly or indirectly, related to the specific recommendations or views expressed in this report. The Analysts responsible for preparing this report receive compensation from Macquarie that is based upon various factors including Macquarie Group Ltd total revenues, a portion of which are generated by Macquarie Group’s Investment Banking activities. General disclaimers:

Macquarie Research Santos
23 October 2015 10
Macquarie Securities (Australia) Ltd; Macquarie Capital (Europe) Ltd; Macquarie Capital Markets Canada Ltd; Macquarie Capital Markets North America Ltd; Macquarie Capital (USA) Inc; Macquarie Capital Securities Ltd and its Taiwan branch; Macquarie Capital Securities (Singapore) Pte Ltd; Macquarie Securities (NZ) Ltd; Macquarie First South Securities (Pty) Limited; Macquarie Capital Securities (India) Pvt Ltd; Macquarie Capital Securities (Malaysia) Sdn Bhd; Macquarie Securities Korea Limited and Macquarie Securities (Thailand) Ltd are not authorized deposit-taking institutions for the purposes of the Banking Act 1959 (Commonwealth of Australia), and their obligations do not represent deposits or other liabilities of Macquarie Bank Limited ABN 46 008 583 542 (MBL) or MGL. MBL does not guarantee or otherwise provide assurance in respect of the obligations of any of the above mentioned entities. MGL provides a guarantee to the Monetary Authority of Singapore in respect of the obligations and liabilities of Macquarie Capital Securities (Singapore) Pte Ltd for up to SGD 35 million. This research has been prepared for the general use of the wholesale clients of the Macquarie Group and must not be copied, either in whole or in part, or distributed to any other person. If you are not the intended recipient you must not use or disclose the information in this research in any way. If you received it in error, please tell us immediately by return e-mail and delete the document. We do not guarantee the integrity of any e-mails or attached files and are not responsible for any changes made to them by any other person. MGL has established and implemented a conflicts policy at group level (which may be revised and updated from time to time) (the "Conflicts Policy") pursuant to regulatory requirements (including the FCA Rules) which sets out how we must seek to identify and manage all material conflicts of interest. Nothing in this research shall be construed as a solicitation to buy or sell any security or product, or to engage in or refrain from engaging in any transaction. In preparing this research, we did not take into account your investment objectives, financial situation or particular needs. Macquarie salespeople, traders and other professionals may provide oral or written market commentary or trading strategies to our clients that reflect opinions which are contrary to the opinions expressed in this research. Macquarie Research produces a variety of research products including, but not limited to, fundamental analysis, macro-economic analysis, quantitative analysis, and trade ideas. Recommendations contained in one type of research product may differ from recommendations contained in other types of research, whether as a result of differing time horizons, methodologies, or otherwise. Before making an investment decision on the basis of this research, you need to consider, with or without the assistance of an adviser, whether the advice is appropriate in light of your particular investment needs, objectives and financial circumstances. There are risks involved in securities trading. The price of securities can and does fluctuate, and an individual security may even become valueless. International investors are reminded of the additional risks inherent in international investments, such as currency fluctuations and international stock market or economic conditions, which may adversely affect the value of the investment. This research is based on information obtained from sources believed to be reliable but we do not make any representation or warranty that it is accurate, complete or up to date. We accept no obligation to correct or update the information or opinions in it. Opinions expressed are subject to change without notice. No member of the Macquarie Group accepts any liability whatsoever for any direct, indirect, consequential or other loss arising from any use of this research and/or further communication in relation to this research. Clients should contact analysts at, and execute transactions through, a Macquarie Group entity in their home jurisdiction unless governing law permits otherwise. The date and timestamp for above share price and market cap is the closed price of the price date. #CLOSE is the final price at which the security is traded in the relevant exchange on the date indicated. Country-specific disclaimers: Australia: In Australia, research is issued and distributed by Macquarie Securities (Australia) Ltd (AFSL No. 238947), a participating organisation of the Australian Securities Exchange. New Zealand: In New Zealand, research is issued and distributed by Macquarie Securities (NZ) Ltd, a NZX Firm. Canada: In Canada, research is prepared, approved and distributed by Macquarie Capital Markets Canada Ltd, a participating organisation of the Toronto Stock Exchange, TSX Venture Exchange & Montréal Exchange. Macquarie Capital Markets North America Ltd., which is a registered broker-dealer and member of FINRA, accepts responsibility for the contents of reports issued by Macquarie Capital Markets Canada Ltd in the United States and sent to US persons. Any US person wishing to effect transactions in the securities described in the reports issued by Macquarie Capital Markets Canada Ltd should do so with Macquarie Capital Markets North America Ltd. The Research Distribution Policy of Macquarie Capital Markets Canada Ltd is to allow all clients that are entitled to have equal access to our research. United Kingdom: In the United Kingdom, research is issued and distributed by Macquarie Capital (Europe) Ltd, which is authorised and regulated by the Financial Conduct Authority (No. 193905). Germany: In Germany, this research is issued and/or distributed by Macquarie Capital (Europe) Limited, Niederlassung Deutschland, which is authorised and regulated by the UK Financial Conduct Authority (No. 193905). and in Germany by BaFin. France: In France, research is issued and distributed by Macquarie Capital (Europe) Ltd, which is authorised and regulated in the United Kingdom by the Financial Conduct Authority (No. 193905). Hong Kong & Mainland China: In Hong Kong, research is issued and distributed by Macquarie Capital Securities Ltd, which is licensed and regulated by the Securities and Futures Commission. In Mainland China, Macquarie Securities (Australia) Limited Shanghai Representative Office only engages in non-business operational activities excluding issuing and distributing research. Only non-A share research is distributed into Mainland China by Macquarie Capital Securities Ltd. Japan: In Japan, research is Issued and distributed by Macquarie Capital Securities (Japan) Limited, a member of the Tokyo Stock Exchange, Inc. and Osaka Exchange, Inc. (Financial Instruments Firm, Kanto Financial Bureau (kin-sho) No. 231, a member of Japan Securities Dealers Association). India: In India, research is issued and distributed by Macquarie Capital Securities (India) Pvt. Ltd. (CIN: U65920MH1995PTC090696), formerly known as Macquarie Capital (India) Pvt. Ltd., 92, Level 9, 2 North Avenue, Maker Maxity, Bandra Kurla Complex, Bandra (East), Mumbai – 400 051, India, which is a SEBI registered Research Analyst having registration no. INH000000545. Malaysia: In Malaysia, research is issued and distributed by Macquarie Capital Securities (Malaysia) Sdn. Bhd. (Company registration number: 463469-W) which is a Participating Organisation of Bursa Malaysia Berhad and a holder of Capital Markets Services License issued by the Securities Commission. Taiwan: In Taiwan, research is issued and distributed by Macquarie Capital Securities Ltd, Taiwan Branch, which is licensed and regulated by the Financial Supervisory Commission. No portion of the report may be reproduced or quoted by the press or any other person without authorisation from Macquarie. Nothing in this research shall be construed as a solicitation to buy or sell any security or product. Research Associate(s) in this report who are registered as Clerks only assist in the preparation of research and are not engaged in writing the research. Thailand: In Thailand, research is produced, issued and distributed by Macquarie Securities (Thailand) Ltd. Macquarie Securities (Thailand) Ltd. is a licensed securities company that is authorized by the Ministry of Finance, regulated by the Securities and Exchange Commission of Thailand and is an exchange member of the Stock Exchange of Thailand. The Thai Institute of Directors Association has disclosed the Corporate Governance Report of Thai Listed Companies made pursuant to the policy of the Securities and Exchange Commission of Thailand. Macquarie Securities (Thailand) Ltd does not endorse the result of the Corporate Governance Report of Thai Listed Companies but this Report can be accessed at: http://www.thai-iod.com/en/publications.asp?type=4. South Korea: In South Korea, unless otherwise stated, research is prepared, issued and distributed by Macquarie Securities Korea Limited, which is regulated by the Financial Supervisory Services. Information on analysts in MSKL is disclosed at http://dis.kofia.or.kr/websquare/index.jsp?w2xPath=/wq/fundMgr/DISFundMgrAnalystStut.xml&divisionId=MDIS03002001000000&serviceId=SDIS03002001000. South Africa: In South Africa, research is issued and distributed by Macquarie First South Securities (Pty) Limited, a member of the JSE Limited. Singapore: In Singapore, research is issued and distributed by Macquarie Capital Securities (Singapore) Pte Ltd (Company Registration Number: 198702912C), a Capital Markets Services license holder under the Securities and Futures Act to deal in securities and provide custodial services in Singapore. Pursuant to the Financial Advisers (Amendment) Regulations 2005, Macquarie Capital Securities (Singapore) Pte Ltd is exempt from complying with sections 25, 27 and 36 of the Financial Advisers Act. All Singapore-based recipients of research produced by Macquarie Capital (Europe) Limited, Macquarie Capital Markets Canada Ltd, Macquarie First South Securities (Pty) Limited and Macquarie Capital (USA) Inc. represent and warrant that they are institutional investors as defined in the Securities and Futures Act. United States: In the United States, research is issued and distributed by Macquarie Capital (USA) Inc., which is a registered broker-dealer and member of FINRA. Macquarie Capital (USA) Inc, accepts responsibility for the content of each research report prepared by one of its non-US affiliates when the research report is distributed in the United States by Macquarie Capital (USA) Inc. Macquarie Capital (USA) Inc.’s affiliate’s analysts are not registered as research analysts with FINRA, may not be associated persons of Macquarie Capital (USA) Inc., and therefore may not be subject to FINRA rule restrictions on communications with a subject company, public appearances, and trading securities held by a research analyst account. Information regarding futures is provided for reference purposes only and is not a solicitation for purchases or sales of futures. Any persons receiving this report directly from Macquarie Capital (USA) Inc. and wishing to effect a transaction in any security described herein should do so with Macquarie Capital (USA) Inc. Important disclosure information regarding the subject companies covered in this report is available at www.macquarie.com/research/disclosures, or contact your registered representative at 1-888-MAC-STOCK, or write to the Supervisory Analysts, Research Department, Macquarie Securities, 125 W.55th Street, New York, NY 10019. © Macquarie Group

Macquarie Research Santos
23 October 2015 11
Auckland
Tel: (649) 377 6433
Jakarta Tel: (62 21) 515 1818
Munich Tel: (089) 2444 31800
Sydney Tel: (612) 8232 9555
Bangkok
Tel: (662) 694 7999
Johannesburg Tel: (2711) 583 2000
New York Tel: (1 212) 231 2500
Taipei Tel: (886 2) 2734 7500
Calgary
Tel: (1 403) 294 9541
Kuala Lumpur Tel: (60 3) 2059 8833
Paris Tel: (33 1) 7842 3823
Tokyo Tel: (81 3) 3512 7900
Denver
Tel: (303) 952 2800
London Tel: (44 20) 3037 2000
Perth Tel: (618) 9224 0888
Toronto Tel: (1 416) 848 3500
Frankfurt
Tel: (069) 509 578 000
Manila Tel: (63 2) 857 0888
Seoul Tel: (82 2) 3705 8500
Vancouver Tel: (1 604) 605 3944
Geneva
Tel: (41) 22 818 7777
Melbourne Tel: (613) 9635 8139
Shanghai Tel: (86 21) 6841 3355
Hong Kong
Tel: (852) 2823 3588
Mumbai Tel: (91 22) 6653 3000
Singapore Tel: (65) 6601 1111
Available to clients on the world wide web at www.macquarieresearch.com and through Thomson Financial, FactSet, Reuters, Bloomberg, and CapitalIQ.

Research
Head of Equity Research
Peter Redhead (Global) (852) 3922 4836
Paul Checchin (Australia & NZ) (612) 8232 4197
Retail / Consumer / Food & Bev
Bryan Raymond (612) 8232 2740
Energy
Kirit Hira (612) 8232 9692
ESG
Deana Mitchell (612) 8232 4576
Financials
Banks
Brendan Carrig (612) 8237 6043
Anita Stanley (Maternity leave) (612) 8232 9869
Insurance & Diversified Financials
Tim Lawson (612) 8237 7332
Bryan Raymond (612) 8232 2740
Andrew Buncombe (612) 8232 0629
Healthcare
Dr Craig Collie (612) 8232 4130
Industrials
Capital Goods
John Purtell (612) 8232 8633
Niraj Shah (612) 8237 0750
Infrastructure
Ian Myles (612) 8232 4157
Transportation
Sam Dobson (612) 8232 9986
Chemicals, D&C, Packaging, Builders, Steel
John Purtell (612) 8232 8633
Niraj Shah (612) 8237 0750
Peter Steyn (612) 8232 5144
Resources
Hayden Bairstow (618) 9224 0838
Ben Crowley (618) 9224 0839
Andrew Hodge (612) 8237 0321
Real Estate
Paul Checchin (612) 8232 4197
Rob Freeman (612) 8237 1152
Telcos / Media / Tourism & Leisure
Andrew Levy (612) 8232 5165
Andrew Russell (612) 8232 9390
Utilities
Ian Myles (612) 8232 4157
Commodities & Precious Metals
Colin Hamilton (Global) (44 20) 3037 4061
Jim Lennon (London) (44 20) 3037 4271
New Zealand
Stephen Hudson (649) 363 1414
Warren Doak (649) 363 1416
Daniel Frost (649) 363 1474
Nick Mar (649) 363 1476
Andrew Levy (Telecommunications) (612) 8232 5165
Emerging Leaders – Industrials
Adam Simpson (612) 8232 4439
Andrew Wackett (618) 9224 0867
Jodie Bannan (612) 8232 2999
Jennifer Kruk (612) 8232 6422
Michael Higgins (612) 8232 3208
Quantitative
Gurvinder Brar (Global) (44 20) 3037 4036
John Conomos (Australia) (612) 8232 5157
Jeremy Lamplaugh (612) 8232 1060
Data Services
Sheridan Duffy (612) 8232 9786
Economics and Strategy
Jason Todd (612) 8237 3134
James McIntyre (Australia) (612) 8232 8930
Find our research at
Macquarie: www.macquarie.com.au/research
Thomson: www.thomson.com/financial
Reuters: www.knowledge.reuters.com
Bloomberg: MAC GO
Factset: http://www.factset.com/home.aspx
CapitalIQ www.capitaliq.com
Contact Gareth Warfield for access (612) 8232 3207
See and hear our analysts at www.macquarie.com.au/macquariedigital
Toll free from overseas
Canada 1800 989 8159
Hong Kong 800 96 2049
Japan 0053 161 6437
New York 1888 622 7862
Singapore 800 616 1037
Email addresses
Sales Equities
Dan Ritchie (Australia) (612) 8232 3124
Dave Roberton (New Zealand) (649) 363 1498
Sales
Kristen Edmond (Desk Head – Sydney) (612) 8232 3111
Gavin Maher (Australia) (612) 8232 4151
Nick Rehak (Australia) (612) 8232 4053
Charlotte Edelman (Australia) (612) 8232 4565
Kurt Dalton (Australia) (612) 8232 5943
Mike Johnson (Desk Head – Hong Kong & International Sales) (852) 3922 2050
Adam Millhouse (Hong Kong) (852) 3922 2055
Dan Pittorino (Desk Head - London) (44 20) 3037 4831
Andrew Haigh (London) (44 20) 3037 4843
Clare McCartney (London) (44 20) 3037 4833
Brendan Waller (Desk Head - Melbourne) (613) 9635 8177
Leighton Patrick (Desk Head - New York) (1 212) 231 2552
Rowly Hirst (New York) (1 212) 231 2553
Michael McNair (New York) (1 212) 231 2571
Sales Trading
Ben Clifford (Head of Sales Trading) (612) 8232 4012
Sam Molina (Sydney) (612) 8232 5935
John Ogle (Sydney) (612) 8232 3118
Francis Sarks (Sydney) (612) 8232 4458
Antony Kirwan (Sydney) (612) 8232 4003
Ben McIntyre (Sydney) (612) 8237 2833
Philip Sellaroli (Sydney) (612) 8232 2029
John Alessi (Melbourne) (613) 9635 9183
Andrew Donald (Melbourne) (613) 9635 8270
Natalie Rachele (Melbourne) (613) 9635 8595
Jon Holland (Auckland) (649) 363 1471
Mike Keen (London) (44 20) 3037 4905
Electronic Execution
Valerie Kingsmill (612) 8237 2230
Darren Miller (612) 8232 8261
James Giarratano (612) 8237 0878
Portfolio Trading
Garth Leslie (612) 8232 9982
Kathryn Koutouzis (612) 8237 5456
Block Trading
Tim Shaw (Desk Head – Sydney). (612) 8232 4386
Specialist Sales
Julia Thomas (Property) (613) 9635 9323
Phil Zammit (Emerging Leaders) (612) 8232 3122
Owen Johnston (Emerging Leaders) (612) 8232 3328
Alternative Strategies
Greg Mann (Equity Finance) (612) 8232 1820
Shannon Donohoe (Stock Borrow & Loan) (612) 8232 6997
Syndication
Paul Staines (612) 8232 7781
Angus Firth (612) 8232 4039
Tiffany Ward (612) 8232 5151
Corporate Access
Julie Loring (612) 8232 7543
Asha Walsh (612) 8237 8464
Transition Management & Portfolio Solutions
Mick Larkin (612) 8232 0639
David Goodman (612) 8232 5245
Scott Macaulay (612) 8232 4782