sap lumira: what’s new · pdf filesap lumira what’s new ... simple to deploy and...
TRANSCRIPT

© 2015 SAP SE or an SAP affiliate company. All rights reserved.
SAP LumiraWhat’s New
Arturo SánchezSolution Center Principal, Analytics Solutions
@arsanchez59

This presentation and SAP‘s strategy and possible future developments are subject to change and may be changed by SAP at any time for any reason without notice. This document is provided without a warranty of any kind, either express or implied, including but not limited to, the implied warranties of merchantability, fitness for a particular purpose , or non-infringement. © 2015 SAP SE or an SAP affiliate company. All rights reserved.
The information in this presentation is confidential and proprietary to SAP and may not be disclosed without the permission of SAP. This presentation is not subject to
your license agreement or any other service or subscription agreement with SAP. SAP has no obligation to pursue any course of business outlined in this document or
any related presentation, or to develop or release any functionality mentioned therein. This document, or any related present ation and SAP's strategy and possible
future developments, products and or platforms directions and functionality are all subject to change and may be changed by SAP at any time for any reason without
notice. The information in this document is not a commitment, promise or legal obligation to deliver any material, code or functionality. This document is provided
without a warranty of any kind, either express or implied, including but not limited to, the implied warranties of merchantability, fitness for a particular purpose, or
non-infringement. This document is for informational purposes and may not be incorporated into a contract. SAP assumes no responsibility for errors or omissions in
this document, except if such damages were caused by SAP´s willful misconduct or gross negligence.
All forward-looking statements are subject to various risks and uncertainties that could cause actual results to differ material ly from expectations. Readers are
cautioned not to place undue reliance on these forward-looking statements, which speak only as of their dates, and they should not be relied upon in making
purchasing decisions.
Legal disclaimer

3© 2015 SAP SE or an SAP affiliate company. All rights reserved.
Reportes
Descubrimiento y Análisis
Tableros de Control & Aplicaciones
Integración con MS Office
Crystal ReportsWeb IntelligenceDesktop Intelligence (IMS)
Crystal ReportsWeb Intelligence
Predictive AnalysisLumiraSet AnalysisExplorerAnalysis for OLAP
Design StudioDashboards
Analysis for OfficeLive OfficeBI WidgetsEPM Addin
Lumira
Design Studio
Analysis for Office
Inte
rop
era
bili
ty
Convergencia de Casos de Uso de SAP BIMismos Casos de uso, Menos Software, Sin migraciones Forzadas

© 2015 SAP SE or an SAP affiliate company. All rights reserved.
Business
Fast
Get started in 10 minutes
Engaging
Beautiful visual discovery and analysis
Share your Vision
Effectively communicate your story
IT Department
Self Service
Reduced reliance on IT
Simple to Deploy and Manage
Flexible, and scalable options
Connect to your Platform
Protect your investments, and align enterprise standards
SAP Lumira, product overview

5© 2015 SAP SE or an SAP affiliate company. All rights reserved.
SAP Lumira, interoperability
Lumira Edge (Velocity)
Lumira Server (HANA)
Lumira Cloud(HCP)
Lumira Desktop
Manipulate Data, Visualize, Design Infographics
Administer,Manage, Audit
Analysts
Explore,Visualize, Edit Story
IT Decision Makers
BI 4.1
Lumira Server for BI (In-memory with Velocity Engine)
Share Access

© 2015 SAP SE or an SAP affiliate company. All rights reserved.
Customers want:
AGILITY for business users
+The ability to SCALE and GOVERN
BI standards strategically
+Protect existing INVESTMENTS
Ag
ility fo
r Bu
sine
ss Use
rs
Enterprise scale and governance
Excel
DataDiscovery
Enterprise BI
Trusted Data
Discovery
Customer
SAP Lumira, trusted data discovery

© 2015 SAP SE or an SAP affiliate company. All rights reserved.
Powerful, open, extensible visualizationsExpressions like running totals, % of, difference from
YoY, QoQ, branch to branch comparisons
Time and DateTime support
Support multiple HANA views
New crosstab control replaces the table
Enhanced chart appearance and color palette support
Rich library of charts, trellis, and tables
Conditional formatting on charts and table
SDK for custom visualizations and extensions based on D3
Geospatial analyticsGeo bubble, choropleth, pie charts
Esri ArcGIS online base maps including streets views
Interactive user experienceDrag-and-drop chart creation
Animate data movements
Easily copy, re-order, email, print visualizations
SAP Lumira, visualizations

© 2015 SAP SE or an SAP affiliate company. All rights reserved.
Personal dataMicrosoft Excel, CSV, Text files
Copy web data from clipboard
Import MS Excel crosstab without manual reformatting
Enterprise dataSAP BW 7.0, 7.01, 7.02, 7.30, 7.31, 7.4
SAP HANA 82-85
SAP HANA 90-97 (non production use only)
SAP ECC6
BusinessObjects Universe both UNV and UNX
SAP Sybase IQ, SQL Anywhere, ASE
Many databases JDBC with SQL (DB2, Teradata, Netezza, etc..)
Salesforce.com
SAP HANA, SAP BW
Add custom data through extension
Big dataApache Hadoop Hive and Cloudera Impala support with sampling and
transformations on full Hadoop cluster
Amazon EMR Hive
Customer
SAP Lumira, data acquisition

© 2015 SAP SE or an SAP affiliate company. All rights reserved.
Visualization Extensions
• Improved charting functionality
• Advanced and custom chart types
• LOB / Industry specific visualizations
• Business and Design Methodologies
Data Access Extensions
• New cloud and local data sources
• Simplified UIs for data access
• Connect to niche or custom DBs
INCREMENTAL VALUE FOR END USERS
A custom enhancement, built with SDK’s on top of the SAP Lumira Platform,
that extends existing, and/or delivers new, functionality.
SAP Lumira, extensions explained
© 2015 SAP SE or an SAP affiliate company. All rights reserved.
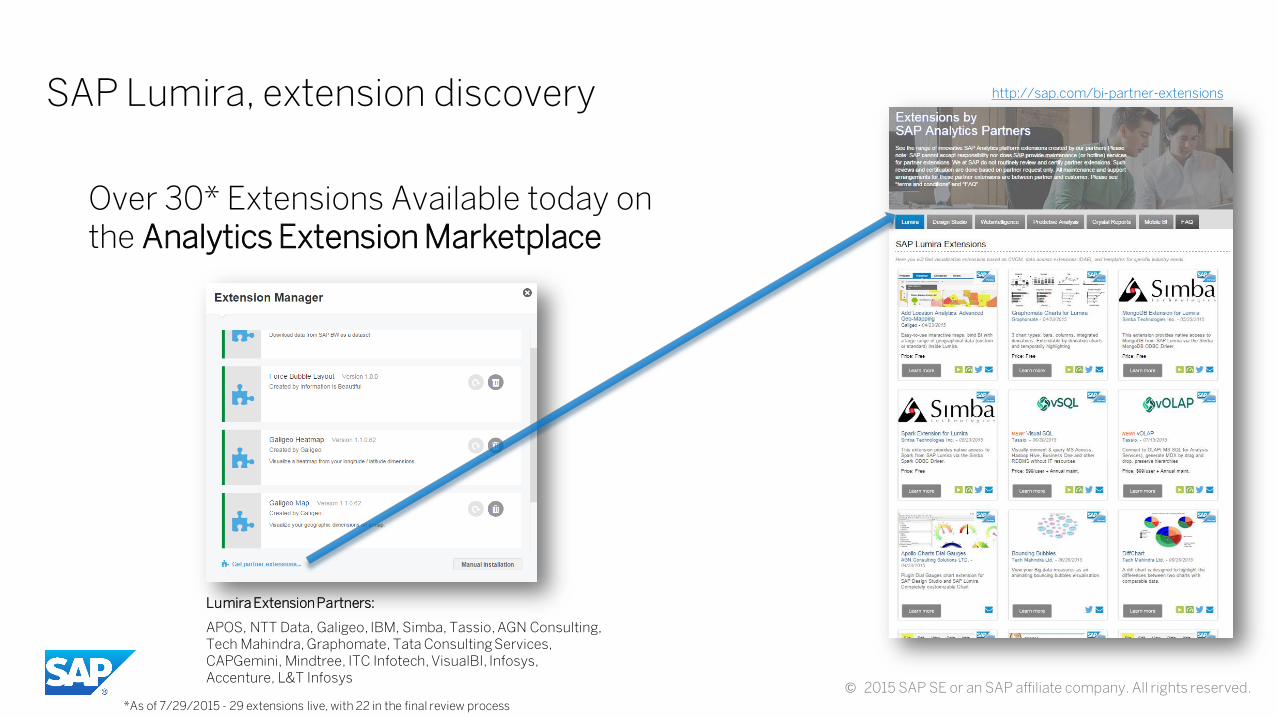
Over 30* Extensions Available today onthe Analytics Extension Marketplace
http://sap.com/bi-partner-extensionsSAP Lumira, extension discovery
Lumira Extension Partners:
APOS, NTT Data, Galigeo, IBM, Simba, Tassio, AGN Consulting, Tech Mahindra, Graphomate, Tata Consulting Services, CAPGemini, Mindtree, ITC Infotech, VisualBI, Infosys,Accenture, L&T Infosys
*As of 7/29/2015 - 29 extensions live, with 22 in the final review process

11© 2015 SAP SE or an SAP affiliate company. All rights reserved.
SAP Lumira 1.27
Genius Trusted Beautiful

12© 2015 SAP SE or an SAP affiliate company. All rights reserved.
Trusted data discovery end-to-end
SAP BW acquisition
Acquire data directly from BW queries or managed OLAP connections in BI platform
Combine* BW data with non-BW data and enrich
Use variable prompts to filter data
Visualize data, build stories and share insights to Lumira Server (all editions) and Lumira Cloud
* Combining data by merge (joined to one dataset) is done on Lumira Desktop. Blending (linking on the fly) can be done on Lumira Server, for BI platform, Lumira Server, for teams, and Lumira Desktop. See next for more on Blending
13© 2015 SAP SE or an SAP affiliate company. All rights reserved.
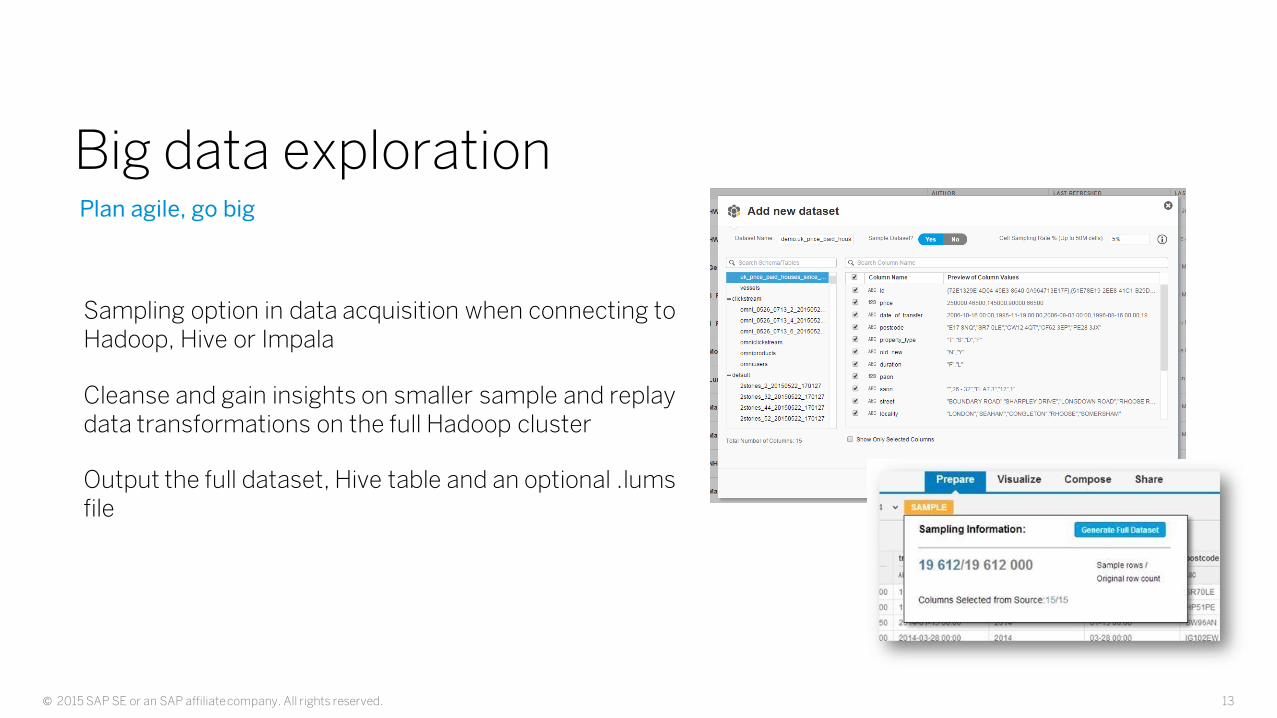
Plan agile, go big
Big data exploration
Sampling option in data acquisition when connecting to Hadoop, Hive or Impala
Cleanse and gain insights on smaller sample and replay data transformations on the full Hadoop cluster
Output the full dataset, Hive table and an optional .lumsfile

14© 2015 SAP SE or an SAP affiliate company. All rights reserved.
Combine your data on the fly from server or desktop
Blending acquired data
Link data from Lumira Server, for BI platform, Lumira Server, for teams, and Lumira Desktop
Any acquired data sources including SAP BW data
Does not require a unique key or a physical merge
Combine with new calculations for powerful analysis

15© 2015 SAP SE or an SAP affiliate company. All rights reserved.
Analyze performance trends
Difference From
Perform value comparison on different subsets of the measure values (eg. YoY, QoQ, MoM, branch to branch)
Compare growth or decline between different time periods
Options for Base Value, Base Dimension and % display
Combine with Blending to analyze across two datasets

16© 2015 SAP SE or an SAP affiliate company. All rights reserved.
With more flexibility
Running and Moving calculations
Option to reset the value at a specified level
Option to exclude empty values in Running Count and Running Average
Easier access and management of calculations from toolbar and chart feeder panel

17© 2015 SAP SE or an SAP affiliate company. All rights reserved.
Analyze distribution
Percentage of
Show a measure’s value as % of a specific parent level (the subtotal) in the row or column hierarchy
Perform calculations on a trellis total and grand total

18© 2015 SAP SE or an SAP affiliate company. All rights reserved.
Explore in hours, minutes, and seconds
Time and Datetime
New line chart optimized for time-based hierarchies and dimensions with a continuous time scale
Enrich data to time and datetime (timestamp) format
Time hierarchies down to hours, minutes, seconds
Calculated dimensions using time and datetime

19© 2015 SAP SE or an SAP affiliate company. All rights reserved.
Refresh with ease
Data mapping
Detects changes to the underlying data structure change on refresh
Intuitive user interface to map column changes
Re-map or remove deleted columns

20© 2015 SAP SE or an SAP affiliate company. All rights reserved.
Multiple HANA views and label support
HANA online enhancements
* HANA views must come from the same HANA instance
Create visualizations and stories from multiple HANA views*
HANA label support on variables
21© 2015 SAP SE or an SAP affiliate company. All rights reserved.
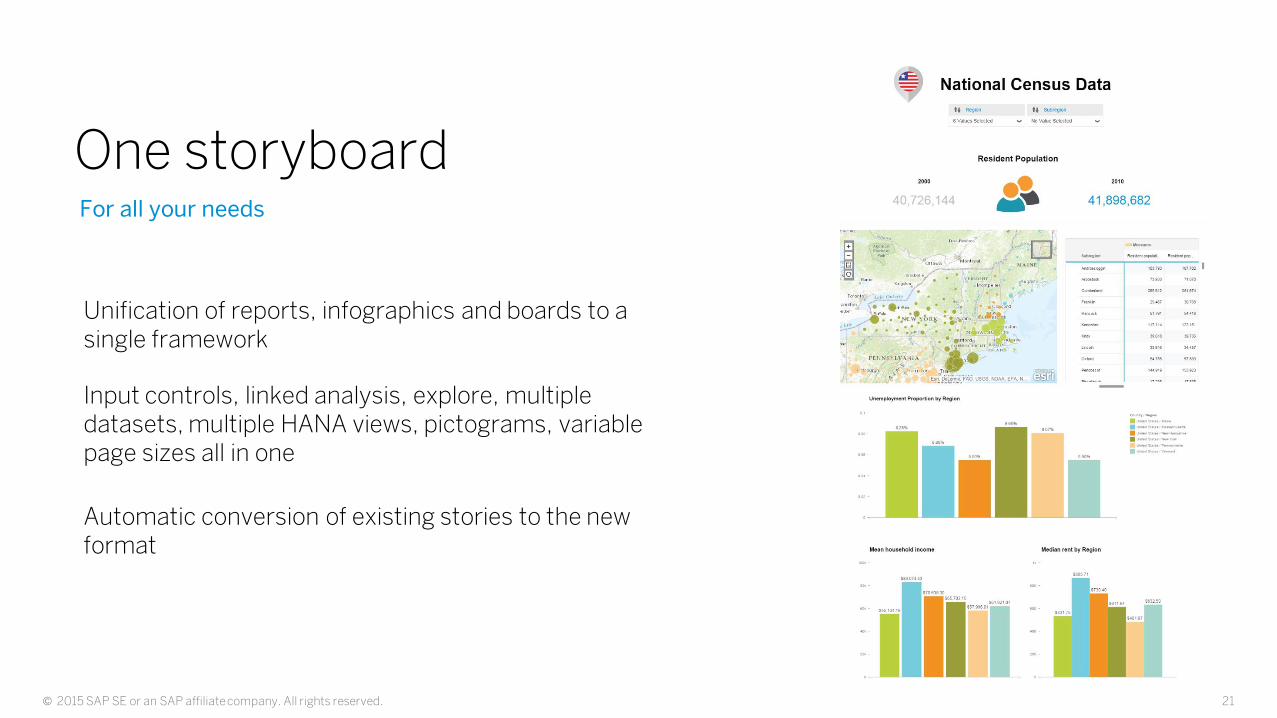
For all your needs
One storyboard
Unification of reports, infographics and boards to a single framework
Input controls, linked analysis, explore, multiple datasets, multiple HANA views, pictograms, variable page sizes all in one
Automatic conversion of existing stories to the new format

22© 2015 SAP SE or an SAP affiliate company. All rights reserved.
Linked Analysis and Explore
Interactive stories
Filter on data points and update all visualizations on the page
Drill up and down hierarchy on a chart and update visualizations on the page
Drill or filter on a common dimension across multiple datasets
Explore a particular visualization in view time

23© 2015 SAP SE or an SAP affiliate company. All rights reserved.
Optimize space
Enhanced input control
Apply across multiple datasets
Specify the scope when multiple datasets are used
Page filter indicator per chart
Overlay input control on top of other elements
Combo box, single and multiple selection, and resizing support

24© 2015 SAP SE or an SAP affiliate company. All rights reserved.
Data behind the visualizations
Export detailed records
Export for one value or a selection of aggregated values
Output records with .csv or.xlsx file formats
Respects filters applied
Perform workflow while editing or exploring a visualization*
* Visualize, Compose, Consumption and Explore modes

25© 2015 SAP SE or an SAP affiliate company. All rights reserved.
Arrange multiple visualizations with precision
Chart alignment
Clean layout of charts of similar sizes
Default alignment of axis with manual resizing option
More space for labels and other texts

26© 2015 SAP SE or an SAP affiliate company. All rights reserved.
Save time
Copy and paste page elements
Copy and paste elements within the same story
Use keyboard shortcut (Ctrl+C/Ctrl+V)
* Within the infographics compose mode only
27© 2015 SAP SE or an SAP affiliate company. All rights reserved.
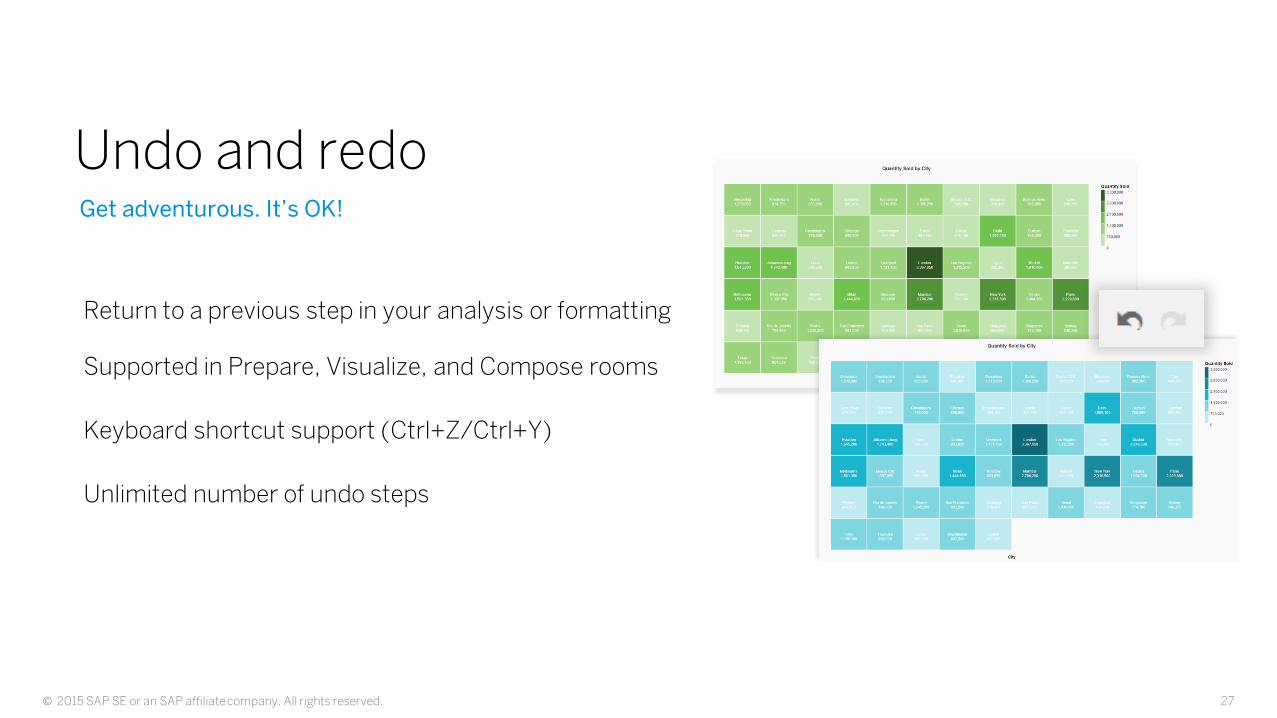
Get adventurous. It’s OK!
Undo and redo
Return to a previous step in your analysis or formatting
Supported in Prepare, Visualize, and Compose rooms
Keyboard shortcut support (Ctrl+Z/Ctrl+Y)
Unlimited number of undo steps

28© 2015 SAP SE or an SAP affiliate company. All rights reserved.
More with less
One table control
Table control converted to Crosstab
Measures added to the crosstab columns and dimensions added to the rows
Conditional formatting rules applied
Adjust column sizes with the mouse control

29© 2015 SAP SE or an SAP affiliate company. All rights reserved.
Monitor your performance
Conditional formatting on charts
Specify and manage your KPI rules
Supported for bar and column charts

30© 2015 SAP SE or an SAP affiliate company. All rights reserved.
Apply new colors to your charts as you build
Color palette enhancements
Enhanced chart style settings in File > Preferences > Charts on Lumira Desktop
Color palettes for measure based coloring (eg. heat maps, tree maps, geographic charts*)
New chart settings apply to newly created charts
Assign palettes per chart from the Visualize room
* Not supported for Esri geo maps in this release

31© 2015 SAP SE or an SAP affiliate company. All rights reserved.
Beautiful from the start
Chart improvements
Default font styling and positioning of chart elements
Size and shape of color indicators in legends
Angled display of long axis labels
Improved appearance of axis line and tick marks

32© 2015 SAP SE or an SAP affiliate company. All rights reserved.
Quickly focus on data of your interest
Filter enhancements
Tokenized values for easy selection and removal
Add values not in the dataset (‘phantom values’)
Paste in comma separated values into the filter dialog
Note that ‘Canada’ is not in the List of Values

33© 2015 SAP SE or an SAP affiliate company. All rights reserved.
For BI platform and for teams
SAP Lumira Server
SAP BW support
• View acquired data and visualizations
• Update visualizations and stories published from Lumira Desktop
Administration:
• BI 4.1 SP6 support
• Full and Update installers

© 2015 SAP AG. All rights reserved.
Thank you!
Presentation contact
Arturo Sánchez Solution Center Specialist for Analytics

35© 2015 SAP SE or an SAP affiliate company. All rights reserved.
Key links for more informationFor customers and partners
Key links
• SAP Lumira http://saplumira.com
• Road maps on SAP Service Marketplace http://service.sap.com/saproadmaps
• SAP Community Network http://scn.sap.com/
• SAP Lumira tutorials and recording http://scn.sap.com/docs/DOC-26507
• Official tutorials for SAP BI http://sap.com/learnbi
• IT Planning Resources https://service.sap.com/~sapidb/011000358700001160122012E
• Lumira Sizing Guide http://scn.sap.com/docs/DOC-53374
• Product Documentation http://help.sap.com/
• Product Availability Matrix https://support.sap.com/release-upgrade-maintenance/pam.html
Where to go to provide product feedback and ideas
• SAP Idea Place https://ideas.sap.com
• Influence programs http://service.sap.com/influence
• SAP User Groups http://www.sapusergroups.com/

36© 2015 SAP SE or an SAP affiliate company. All rights reserved.
© 2015 SAP SE or an SAP affiliate company. All rights reserved.
No part of this publication may be reproduced or transmitted in any form or for any purpose without the express permission of SAP AG or an
SAP affiliate company.
SAP and other SAP products and services mentioned herein as well as their respective logos are trademarks or registered trademarks of SAP AG
(or an SAP affiliate company) in Germany and other countries. Please see http://global12.sap.com/corporate-en/legal/copyright/index.epx for additional trademark information and notices.
Some software products marketed by SAP AG and its distributors contain proprietary software components of other software vendors.
National product specifications may vary.
These materials are provided by SAP AG or an SAP affiliate company for informational purposes only, without representation or warranty of any kind, and SAP AG or its affiliated companies shall not be liable for errors or
omissions with respect to the materials. The only warranties for SAP AG or
SAP affiliate company products and services are those that are set forth in the express warranty statements accompanying such products and
services, if any. Nothing herein should be construed as constituting an additional warranty.
In particular, SAP AG or its affiliated companies have no obligation to pursue any course of business outlined in this document or any related presentation, or to develop or release any functionality mentioned therein. This
document, or any related presentation, and SAP AG’s or its affiliated companies’ strategy and possible future developments, products, and/or platform directions and functionality are all subject to change and may be
changed by SAP AG or its affiliated companies at any time for any reason without notice. The information in this document is not a commitment, promise, or legal obligation to deliver any material, code, or functionality. All
forward-looking statements are subject to various risks and uncertainties that could cause actual results to differ materially from expectations. Readers are cautioned not to place undue reliance on these forward-looking
statements, which speak only as of their dates, and they should not be relied upon in making purchasing decisions.

37© 2015 SAP SE or an SAP affiliate company. All rights reserved.
© 2015 SAP AG oder ein SAP-Konzernunternehmen. Alle Rechte vorbehalten.
Weitergabe und Vervielfältigung dieser Publikation oder von Teilen daraus sind, zu welchem Zweck und in welcher Form auch immer, ohne die ausdrückliche schriftliche Genehmigung durch SAP AG oder ein SAP-Konzernunternehmen nicht gestattet.
SAP und andere in diesem Dokument erwähnte Produkte und Dienstleistungen von SAP sowie die dazugehörigen Logos sind Marken oder eingetragene Marken der SAP AG (oder von einem SAP-Konzernunternehmen) in Deutschland und verschiedenen anderen Ländern weltweit.Weitere Hinweise und Informationen zum Markenrecht finden Sie unter http://global.sap.com/corporate-de/legal/copyright/index.epx.
Die von SAP AG oder deren Vertriebsfirmen angebotenen Softwareprodukte können Softwarekomponenten auch anderer Softwarehersteller enthalten.
Produkte können länderspezifische Unterschiede aufweisen.
Die vorliegenden Unterlagen werden von der SAP AG oder einem SAP-Konzernunternehmen bereitgestellt und dienen ausschließlich zu Informations-zwecken. Die SAP AG oder ihre Konzernunternehmen übernehmen keinerlei Haftung oder Gewährleistung für Fehler oder Unvollständigkeiten in dieser Publikation. Die SAP AG oder ein SAP-Konzernunternehmen steht lediglich für Produkte und Dienstleistungen nach der Maßgabe ein, die in der Vereinbarung über die jeweiligen Produkte und Dienstleistungen ausdrücklich geregelt ist. Keine der hierin enthaltenen Informationen ist als zusätzliche Garantie zu interpretieren.
Insbesondere sind die SAP AG oder ihre Konzernunternehmen in keiner Weise verpflichtet, in dieser Publikation oder einer zugehörigen Präsentation dargestellte Geschäftsabläufe zu verfolgen oder hierin wiedergegebene Funktionen zu entwickeln oder zu veröffentlichen. Diese Publikation oder eine zugehörige Präsentation, die Strategie und etwaige künftige Entwicklungen, Produkte und/oder Plattformen der SAP AG oder ihrer Konzern-unternehmen können von der SAP AG oder ihren Konzernunternehmen jederzeit und ohne Angabe von Gründen unangekündigt geändert werden.Die in dieser Publikation enthaltenen Informationen stellen keine Zusage, kein Versprechen und keine rechtliche Verpflichtung zur Lieferung von Material, Code oder Funktionen dar. Sämtliche vorausschauenden Aussagen unterliegen unterschiedlichen Risiken und Unsicherheiten, durch die die tatsächlichen Ergebnisse von den Erwartungen abweichen können. Die vorausschauenden Aussagen geben die Sicht zu dem Zeitpunkt wieder, zu dem sie getätigt wurden. Dem Leser wird empfohlen, diesen Aussagen kein übertriebenes Vertrauen zu schenken und sich bei Kaufentscheidungen nicht auf sie zu stützen.