sapm asignment
TRANSCRIPT

8/4/2019 sapm asignment
http://slidepdf.com/reader/full/sapm-asignment 1/11
ASSIGNMENT OF SAPM ON
FUNDAMENTAL ANALYSIS OF SUN TV
SUBMITTED TO SUBMITTED BY MRS PALLAVI DAWRA SALONI SOOD
MBA-2c

8/4/2019 sapm asignment
http://slidepdf.com/reader/full/sapm-asignment 2/11
INTRODUCTION ABT INDUSTRY
The media and entertainment industry is one of the fastest growing
industries in theworld. The components of M&E industry are film, television,
advertising, print mediaand music. The rapid growth of the television
industry has made it the most significantcomponent, of M&E in value
termsIts status as the preferred mode ofentertainment of the people is
obvious from the fact that it now contributes more than 60percent of the
entertainment industry's revenues. Television the major contributor to
theoverall industry revenue is estimated to grow at a stable rate over the
next five yearsresulting in increased viewership having wider range of
channels to select from
PERFORMANCE
The industry has suffered a great deal during the economic recession, with
U.S. top media companies managing flat revenues in 2009 and a 5%
contraction in 2010 according to Ad Age reports. Many players, dominated by
those in the media industry, have plunged into bankruptcy, primarily due to
the shrinking revenues coupled with massive debt loads taken on in the
market boom. Though certain digital media firms fared well.
Growth Potential
The Indian entertainment and media sector is one of the fastest growing
sectors in the economy, and its segments have all witnessed tremendous
double digit growth in the last few years. The past 2 years were tumultuous,
especially due to poor liquidity in the system for financing big projects for
the big and small screen. However, with global indicators realigning
themselves once again, the Indian media and entertainment industry too
looks poised to resume where it left earlier.
Future Prospects
The greatest opportunities naturally lie in those sub-areas that are expected
to grow the fastest over the next few years, namely, in the development of
digital distribution platforms for TV such as DTH, digital music platforms,
digital media advertising (internet, mobile and digital signage) and global
cinema content.
8/4/2019 sapm asignment
http://slidepdf.com/reader/full/sapm-asignment 3/11
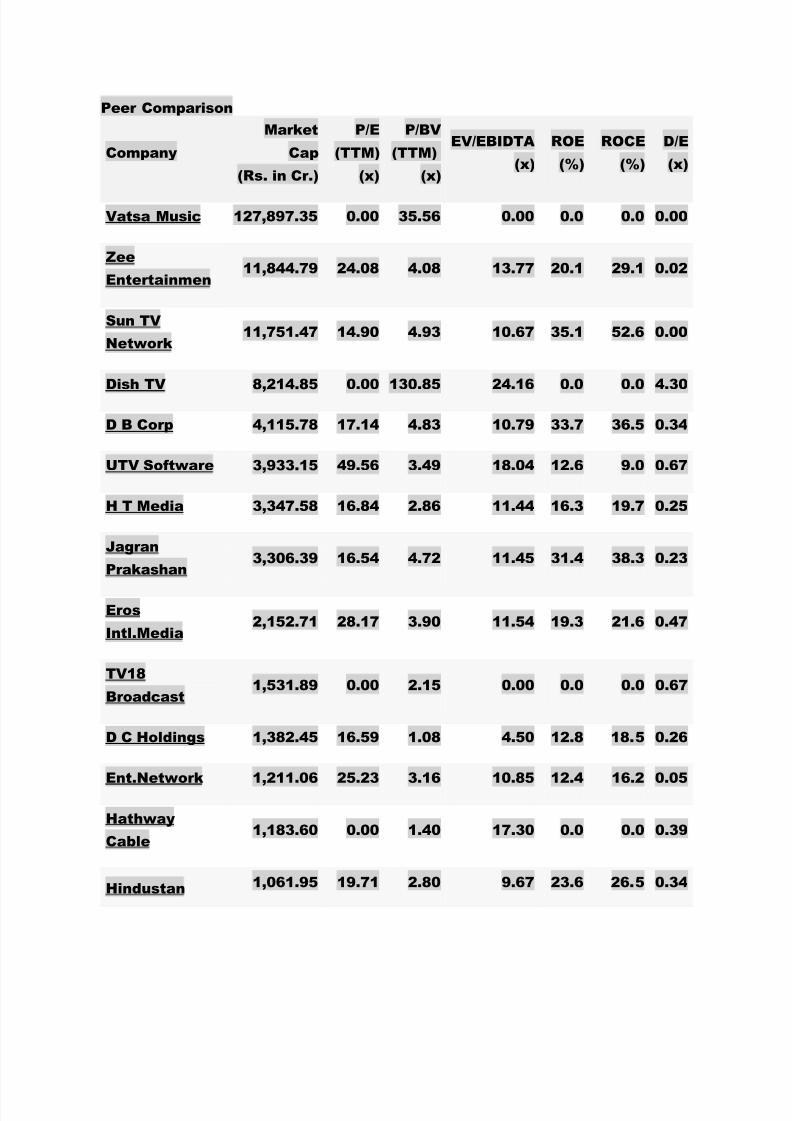
Peer Comparison
Company
Market
Cap
(Rs. in Cr.)
P/E
(TTM)
(x)
P/BV
(TTM)
(x)
EV/EBIDTA
(x)
ROE
(%)
ROCE
(%)
D/E
(x)
Vatsa Music 127,897.35 0.00 35.56 0.00 0.0 0.0 0.00
Zee
Entertainmen11,844.79 24.08 4.08 13.77 20.1 29.1 0.02
Sun TV
Network11,751.47 14.90 4.93 10.67 35.1 52.6 0.00
Dish TV 8,214.85 0.00 130.85 24.16 0.0 0.0 4.30
D B Corp 4,115.78 17.14 4.83 10.79 33.7 36.5 0.34
UTV Software 3,933.15 49.56 3.49 18.04 12.6 9.0 0.67
H T Media 3,347.58 16.84 2.86 11.44 16.3 19.7 0.25
Jagran
Prakashan
3,306.39 16.54 4.72 11.45 31.4 38.3 0.23
Eros
Intl.Media2,152.71 28.17 3.90 11.54 19.3 21.6 0.47
TV18
Broadcast1,531.89 0.00 2.15 0.00 0.0 0.0 0.67
D C Holdings 1,382.45 16.59 1.08 4.50 12.8 18.5 0.26
Ent.Network 1,211.06 25.23 3.16 10.85 12.4 16.2 0.05
Hathway
Cable1,183.60 0.00 1.40 17.30 0.0 0.0 0.39
Hindustan 1,061.95 19.71 2.80 9.67 23.6 26.5 0.34

8/4/2019 sapm asignment
http://slidepdf.com/reader/full/sapm-asignment 4/11
Media
Prime Focus 843.12 48.56 2.79 13.00 6.2 5.4 1.82
Sun TV Network Limited (Sun Network) maintains its dominant position in
the southernstates of India as one of the largest television and radio
entertainment Company in Indiawith a portfolio of 20 channels spread
across four languages and in six genres of GEC,news, music, movies, kids
and comedy. Sun Network also has a large network pan India inthe FM
Radio broadcasting segment with 44 FM licenses along with its
subsidiaries. SunNetwork continues to capitalize on its leadership position,
built over the years, byfortifying its hold over key aspects of pricing and
access to quality content. Sun Networkhas a distinct advantage in the
southern regional markets on account of its strongunderstanding of the
flavor and with key competitive strengths including that of a largemovie
library of regional languages. Sun Network is the preferred choice for
contentproviders as it is the only player with maximum reach in the areas it
operates.
Income Statemen of SUN TV NETWORK LTD.
For the year ended 31.3.2011
Particulars Mar-11 Mar-10 Mar-09 Mar-08 Mar-07 Mar-06
INCOME :
Sales Turnover 1,923.71 1,395.01 1,008.20 861.06 676.95 321.91
Excise Duty 0.00 0.00 0.00 0.00 0.00 0.00
Net Sales 1,923.71 1,395.01 1,008.20 861.06 676.95 321.91
Other Income 46.79 42.51 83.32 64.93 49.45 16.44
Stock Adjustments 0.00 0.00 0.00 0.00 0.00 0.00

8/4/2019 sapm asignment
http://slidepdf.com/reader/full/sapm-asignment 5/11
Total Income 1,970.50 1,437.52 1,091.52 925.99 726.40 338.35
EXPENDITURE :
Raw Materials 0.00 0.00 0.00 0.00 0.00 0.00
Power & Fuel Cost 11.86 7.33 6.37 5.61 4.38 2.53
Employee Cost 45.21 41.85 27.87 26.39 22.84 8.65
Other
Manufacturing
Expenses
114.27 100.57 91.86 70.64 84.30 32.66
Selling andAdministration
Expenses
166.73 100.83 98.91 81.31 57.96 26.26
Miscellaneous
Expenses27.75 33.88 11.60 55.23 25.64 47.59
Less: Pre-operative
Expenses
Capitalised
0.00 0.00 0.00 0.00 0.00 0.00
Total Expenditure 365.82 284.46 236.61 239.18 195.12 117.69
Operating Profit 1,604.68 1,153.06 854.91 686.81 531.28 220.66
Interest 1.98 1.20 3.89 5.56 3.09 6.50
Gross Profit 1,602.70 1,151.86 851.02 681.25 528.19 214.16
Depreciation 447.38 285.44 184.92 113.03 119.29 14.66
Profit Before Tax 1,155.32 866.42 666.10 568.22 408.90 199.50
Tax 376.03 291.23 203.40 190.80 150.29 70.60
8/4/2019 sapm asignment
http://slidepdf.com/reader/full/sapm-asignment 6/11
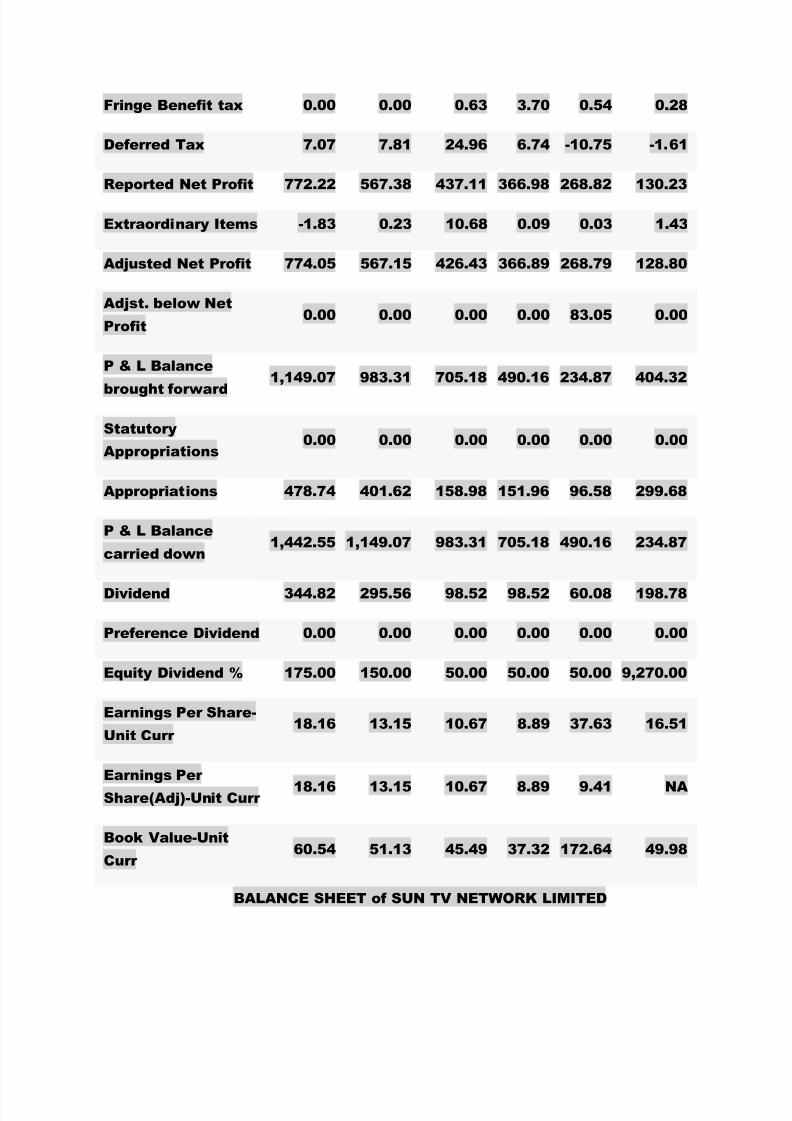
Fringe Benefit tax 0.00 0.00 0.63 3.70 0.54 0.28
Deferred Tax 7.07 7.81 24.96 6.74 -10.75 -1.61
Reported Net Profit 772.22 567.38 437.11 366.98 268.82 130.23
Extraordinary Items -1.83 0.23 10.68 0.09 0.03 1.43
Adjusted Net Profit 774.05 567.15 426.43 366.89 268.79 128.80
Adjst. below Net
Profit0.00 0.00 0.00 0.00 83.05 0.00
P & L Balance
brought forward
1,149.07 983.31 705.18 490.16 234.87 404.32
Statutory
Appropriations0.00 0.00 0.00 0.00 0.00 0.00
Appropriations 478.74 401.62 158.98 151.96 96.58 299.68
P & L Balance
carried down1,442.55 1,149.07 983.31 705.18 490.16 234.87
Dividend 344.82 295.56 98.52 98.52 60.08 198.78
Preference Dividend 0.00 0.00 0.00 0.00 0.00 0.00
Equity Dividend % 175.00 150.00 50.00 50.00 50.00 9,270.00
Earnings Per Share-
Unit Curr 18.16 13.15 10.67 8.89 37.63 16.51
Earnings Per
Share(Adj)-Unit Curr 18.16 13.15 10.67 8.89 9.41 NA
Book Value-Unit
Curr 60.54 51.13 45.49 37.32 172.64 49.98
BALANCE SHEET of SUN TV NETWORK LIMITED

8/4/2019 sapm asignment
http://slidepdf.com/reader/full/sapm-asignment 7/11
As on 31.3.2011
Particulars Mar-11 Mar-10 Mar-09 Mar-08 Mar-07 Mar-06
SOURCES OFFUNDS :
Share Capital 197.04 197.04 197.04 197.04 68.89 62.00
Reserves Total 2,188.67 1,817.97 1,595.47 1,273.63 1,120.43 247.90
Total
Shareholders
Funds
2,385.71 2,015.01 1,792.51 1,470.67 1,189.32 309.90
Secured Loans 0.00 0.00 0.00 0.00 0.00 70.01
Unsecured Loans 0.00 0.00 0.00 0.00 0.00 163.30
Total Debt 0.00 0.00 0.00 0.00 0.00 233.31
Total Liabilities 2,385.71 2,015.01 1,792.51 1,470.67 1,189.32 543.21
APPLICATION OF
FUNDS :
Gross Block 2,328.05 1,590.93 1,198.37 821.66 572.67 332.63
Less :
Accumulated
Depreciation
1,332.72 905.95 627.87 460.22 348.29 196.07
Less:Impairment
of Assets0.00 0.00 0.00 0.00 0.00 0.00
Net Block 995.33 684.98 570.50 361.44 224.38 136.56
Lease Adjustment 0.00 0.00 0.00 0.00 0.00 0.00
Capital Work in
Progress17.06 311.39 151.87 131.92 43.49 4.21
8/4/2019 sapm asignment
http://slidepdf.com/reader/full/sapm-asignment 8/11
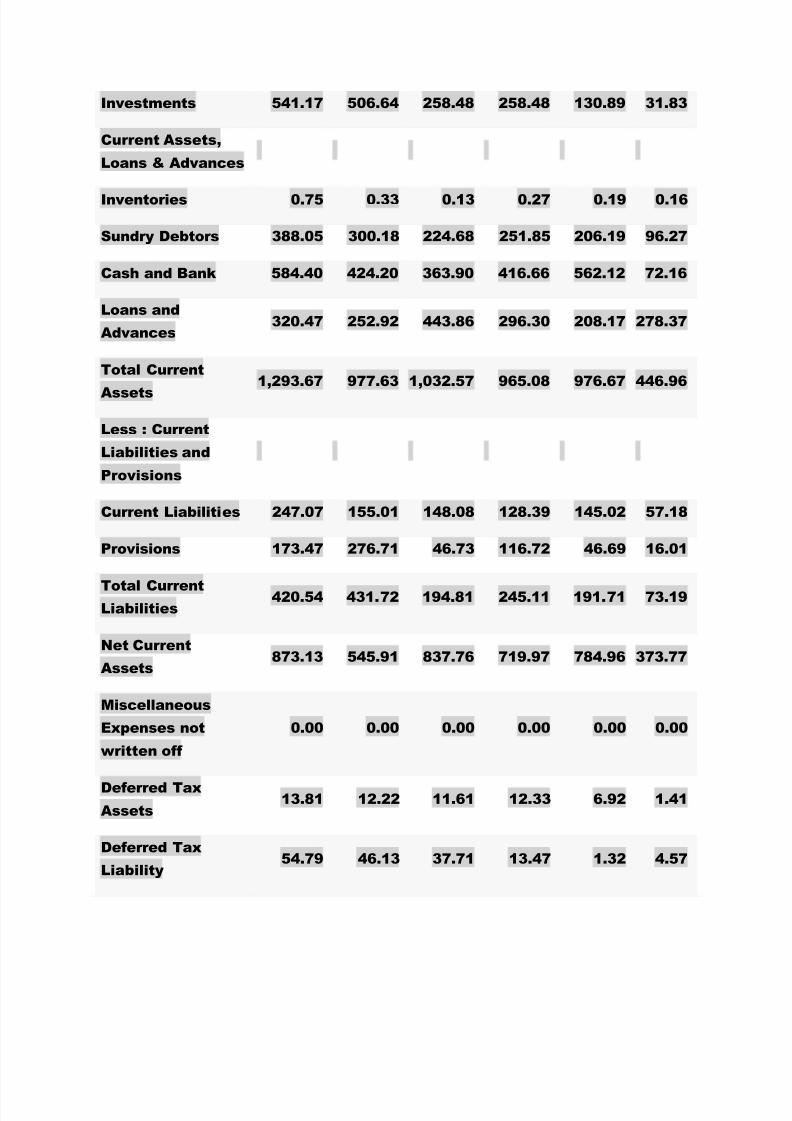
Investments 541.17 506.64 258.48 258.48 130.89 31.83
Current Assets,
Loans & Advances
Inventories 0.75 0.33 0.13 0.27 0.19 0.16
Sundry Debtors 388.05 300.18 224.68 251.85 206.19 96.27
Cash and Bank 584.40 424.20 363.90 416.66 562.12 72.16
Loans and
Advances320.47 252.92 443.86 296.30 208.17 278.37
Total Current
Assets
1,293.67 977.63 1,032.57 965.08 976.67 446.96
Less : Current
Liabilities and
Provisions
Current Liabilities 247.07 155.01 148.08 128.39 145.02 57.18
Provisions 173.47 276.71 46.73 116.72 46.69 16.01
Total CurrentLiabilities
420.54 431.72 194.81 245.11 191.71 73.19
Net Current
Assets873.13 545.91 837.76 719.97 784.96 373.77
Miscellaneous
Expenses not
written off
0.00 0.00 0.00 0.00 0.00 0.00
Deferred Tax
Assets13.81 12.22 11.61 12.33 6.92 1.41
Deferred Tax
Liability54.79 46.13 37.71 13.47 1.32 4.57
8/4/2019 sapm asignment
http://slidepdf.com/reader/full/sapm-asignment 9/11
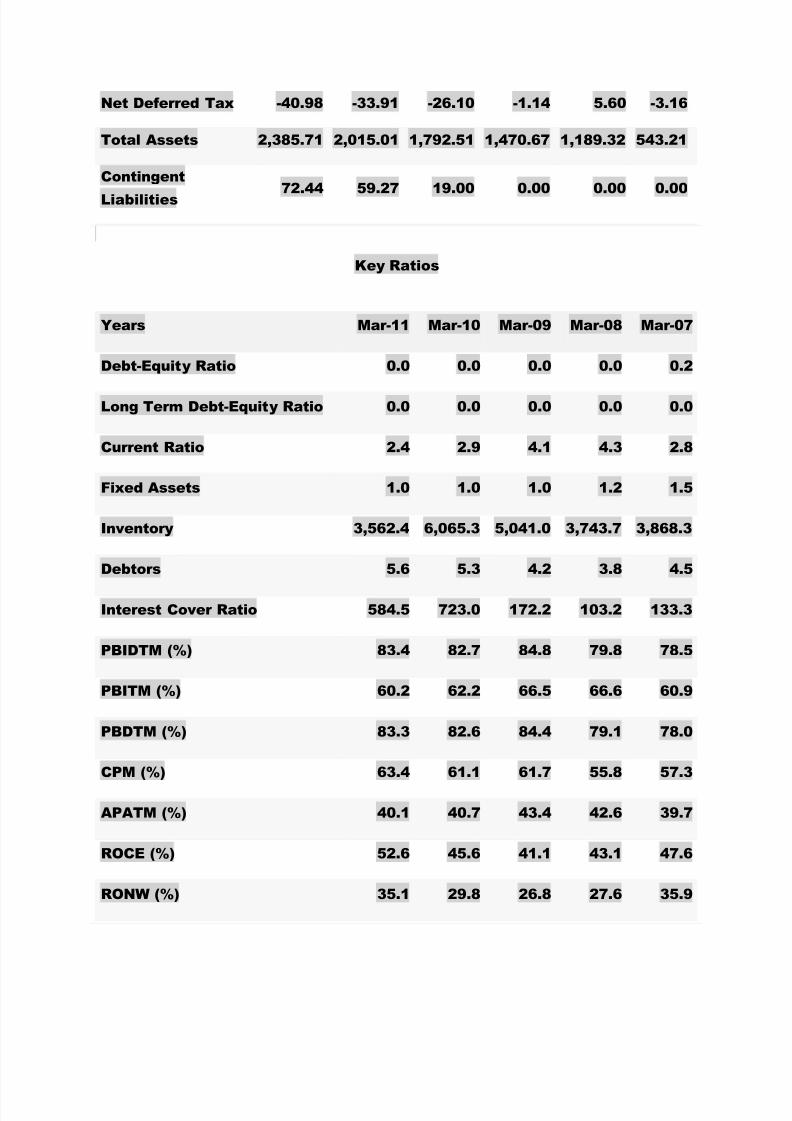
Net Deferred Tax -40.98 -33.91 -26.10 -1.14 5.60 -3.16
Total Assets 2,385.71 2,015.01 1,792.51 1,470.67 1,189.32 543.21
Contingent
Liabilities72.44 59.27 19.00 0.00 0.00 0.00
Key Ratios
Years Mar-11 Mar-10 Mar-09 Mar-08 Mar-07
Debt-Equity Ratio 0.0 0.0 0.0 0.0 0.2
Long Term Debt-Equity Ratio 0.0 0.0 0.0 0.0 0.0
Current Ratio 2.4 2.9 4.1 4.3 2.8
Fixed Assets 1.0 1.0 1.0 1.2 1.5
Inventory 3,562.4 6,065.3 5,041.0 3,743.7 3,868.3
Debtors 5.6 5.3 4.2 3.8 4.5
Interest Cover Ratio 584.5 723.0 172.2 103.2 133.3
PBIDTM (%) 83.4 82.7 84.8 79.8 78.5
PBITM (%) 60.2 62.2 66.5 66.6 60.9
PBDTM (%) 83.3 82.6 84.4 79.1 78.0
CPM (%) 63.4 61.1 61.7 55.8 57.3
APATM (%) 40.1 40.7 43.4 42.6 39.7
ROCE (%) 52.6 45.6 41.1 43.1 47.6
RONW (%) 35.1 29.8 26.8 27.6 35.9
8/4/2019 sapm asignment
http://slidepdf.com/reader/full/sapm-asignment 10/11
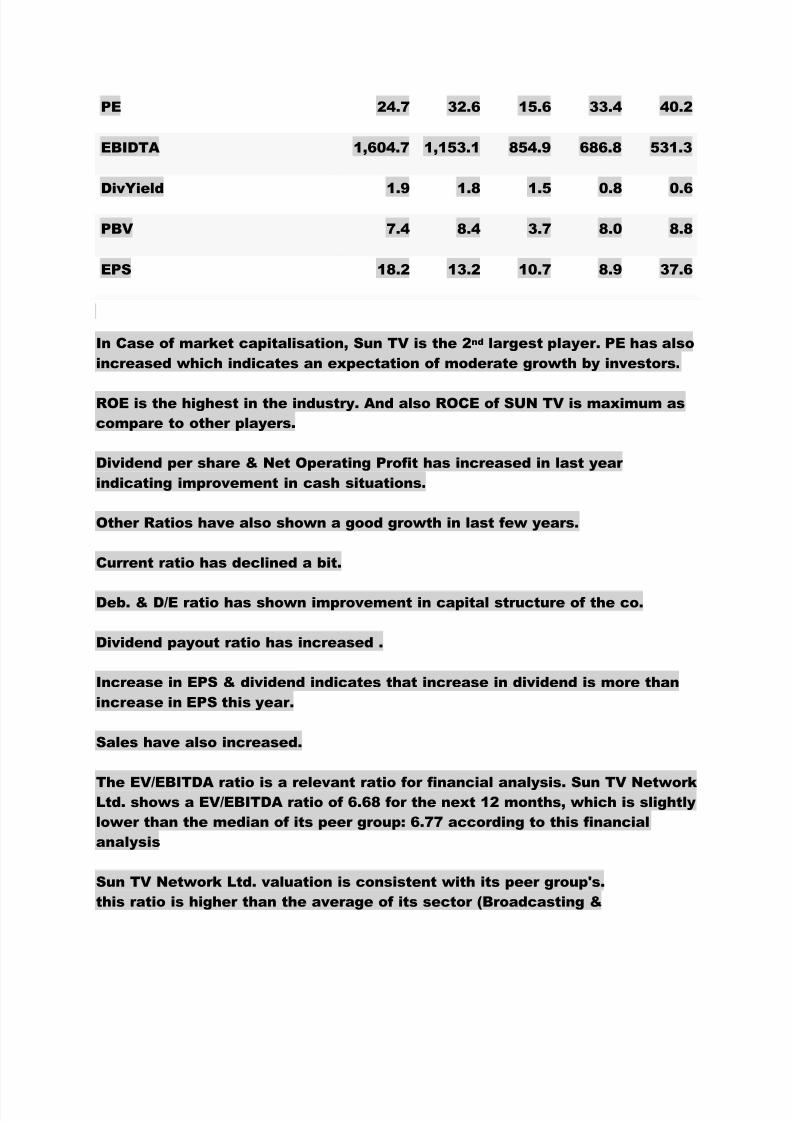
PE 24.7 32.6 15.6 33.4 40.2
EBIDTA 1,604.7 1,153.1 854.9 686.8 531.3
DivYield 1.9 1.8 1.5 0.8 0.6
PBV 7.4 8.4 3.7 8.0 8.8
EPS 18.2 13.2 10.7 8.9 37.6
In Case of market capitalisation, Sun TV is the 2nd largest player. PE has also
increased which indicates an expectation of moderate growth by investors.
ROE is the highest in the industry. And also ROCE of SUN TV is maximum as
compare to other players.
Dividend per share & Net Operating Profit has increased in last year
indicating improvement in cash situations.
Other Ratios have also shown a good growth in last few years.
Current ratio has declined a bit.
Deb. & D/E ratio has shown improvement in capital structure of the co.
Dividend payout ratio has increased .
Increase in EPS & dividend indicates that increase in dividend is more than
increase in EPS this year.
Sales have also increased.
The EV/EBITDA ratio is a relevant ratio for financial analysis. Sun TV NetworkLtd. shows a EV/EBITDA ratio of 6.68 for the next 12 months, which is slightly
lower than the median of its peer group: 6.77 according to this financial
analysis
Sun TV Network Ltd. valuation is consistent with its peer group's.
this ratio is higher than the average of its sector (Broadcasting &

8/4/2019 sapm asignment
http://slidepdf.com/reader/full/sapm-asignment 11/11
Entertainment) 6.10 according to this financial analysis Sun TV Network Ltd.
valuation is above its sector.
The total income for the year ended 31st March 2011 registered a handsome
growth of 37.08% at Rs. 19,705.0 millions as against Rs.14,375.2 millions
during the previous year ended 31st March 2010. Profit before taxes grew by
33.34% at Rs. 11,553.2 million as against Rs. 8,664.2 millions in the previous
year. The Profit after tax was higher by 36.10% at Rs.7,722.2 million as
against Rs. 5673.8 million in the previous year after providing for a higher
provision towards income tax and defered tax of Rs. 3831.0 million for the
year ended 31 st March 2011 inline with higher profits. Company continued to
maintain its leadership position in the market, supported by highly popular
content and a well - diversified mix of clients (national, regional and local)
cutting across a broad spectrum of products and services resulting in the
continuous growth of advertising and subscription revenue.