sar freeze/thaw v2 product guide - epic
TRANSCRIPT

0
ESA DUE Permafrost
SAR Freeze/Thaw
v2 product guide
Vienna University of Technology
Institute of Photogrammetry and Remote
Sensing
Gamma Remote Sensing
Department of Geography and Environmen-
tal Management
Faculty of Environment
University of Waterloo
Friedrich-Schiller-Universität Jena
Institute of Geography
Department of Remote Sensing
Alfred Wegener Institute for Polar and Ma-
rine Research
2012 January

i
This document is the Product Guide for the version 2 release of the 1 km
regional Freeze/Thaw product. It was compiled for the DUE Permafrost
project (ESRIN Contract No. 22185/09/I-OL), a project of the Data User
Element initiative of the European Space Agency.
Prime contractor:
Institute of Photogrammetry and Remote Sensing (I.P.F.)
Remote Sensing Group
Vienna University of Technology
Gusshausstrasse 27-29/E122
1040 Vienna, Austria
www.ipf.tuwien.ac.at/permafrost
ESA Technical officer: Frank Martin Seifert
Status: Version 1.0
Authors: Daniel Sabel, Annett Bartsch
Circulation: TUWien, Gamma, UW, FSU, AWI, ESA, Users
Amendments:
Issue Date Details Editor
2012-01-18 Annett Bartsch

ii
Contents
Contents ............................................................................................................ ii 1 Product overview .......................................................................................... 3 2 Improvements relative version 1 .................................................................. 5 3 Product specification .................................................................................... 6 4 Known issues .............................................................................................. 10
4.1 Limited ENVISAT ASAR GM data coverage ................................... 10 4.2 Influence of sub-pixel water bodies ................................................... 10 4.3 Map artifacts ...................................................................................... 10
5 Data access and contact information .......................................................... 11 6 References .................................................................................................. 12

3
1 Product overview
The Synthetic Aperture Radar (SAR) Freeze/Thaw (F/T) product is derived
from data acquired by the ENVISAT ASAR sensor operating in Global Moni-
toring (GM) mode (Park et al. 2010).
The SAR F/T product represents timing (day of year) of ground surface
freeze-up and thawing at a resolution of 1 km. The version 2 release of the da-
ta covers the years 2005 through 2010 for the regional sites Ob Estuary, Alas-
ka, Mackenzie, Laptev Sea Coast and Central Yakutia. Product quality and
geographical coverage is strongly dependent on the availability of ASAR GM
data.
Figure 1
Flowchart for the prod-
uct retrieval of the 1 km
SAR Freeze/Thaw prod-
uct
An overview of the product retrieval process is given in Figure 1. The pro-
cessing steps (1 to 5) are explained below:
1. ASAR GM level 1b datasets are radiometrically calibrated and ge-
ocoded with a terrain-correction approach (Pathe et al. 2009). The
SRTM30 Digital Elevation Model was used. DORIS orbit files
were used in order to improve on the state vectors included in the
ASAR GM data.

4
2. The geocoded data were then transferred from image format to a
database format in order to allow efficient time series analysis of
the data. This was done in the resampling step by means of bilinear
interpolation of the sigma nought values in the linear domain. Also
the co-located local incidence angle images were resampled to the
database.
3. Due to the side-looking geometry of SAR sensors, the recorded
backscatter is in general dependent on the incidence angle, with a
decrease in backscatter with increasing incidence angle. This de-
pendency is normalised before comparing backscatter measure-
ments acquired over the same area but under different incidence
angles. The normalisation is carried out by fitting the time series of
sigma nought and local incidence angles to a linear model and then
reverting the backscatter to a reference local incidence angle of 30
degrees.
4. The retrieval of the yearly F/T estimates was carried out by fitting
a piecewise step function to the time series of normalised backscat-
ter measurements for each year (Park et al. 2010). The output of
this step consisted of image tiles of estimates of timing of ground
freeze-up and thawing.
5. A masking was then applied to product pixels believed to contain
unreliable estimates. Product pixels for which less than 52 ASAR
GM acquisitions per annum were available for product retrieval
were masked out as less than weekly SAR measurements are be-
lieved to render a poor product quality. In addition, pixels fulfilling
the following product component specific criteria were masked
out:
• Thawing maps: DOY<90 (~Apr. 1) or DOY>180 (~Jun. 30)
• Freeze-up maps: DOY<227 (~Aug. 15) or DOY>287 (~Oct.
15)
Finally, the masked product tiles were mosaicked to full-extent
maps and converted to the GeoTIFF format.

5
2 Improvements relative version 1
The improvements of the F/T product version 2 relative version 1 are:
Extending coverage to include the Laptev Sea Coast and Central
Yakutia regional sites.
Including year 2010.
Some artifacts, resulting from SAR processing or ASAR level 1b
product issues, could be eliminated through manual inspection fol-
lowed by removal and re-processing.
Applied masking (see Product overview section) to remove esti-
mates expected to be unreliable.

6
3 Product specification
The SAR Freeze/Thaw (F/T) parameters represent timing (in units of day
of year, DOY) of ground surface freeze-up and thawing. Due mainly to the
limited availability of ASAR data and its relatively high radiometric noise, the
exact interpretation of the timing parameters is not straightforward. Roughly,
“freeze-up” refers to the beginning of soil surface freeze-up and “thawing” re-
fers to end of spring snow thaw.
The v2 product consists of yearly freeze-up and thaw maps for the years
2005 through 2010 for the regional sites of Alaska, Mackenzie and Ob Estu-
ary, Laptev Sea Coast and Central Yakutia (the Permafrost project regional
sites, see Table 3–3). The product specification is given in Table 3–1.
Table 3–1
Product specification.
Subject Specification
Variables Timing of thawing (day of year, files
named *tha.tif).
Timing of freezing (day of year, files
named *fre.tif).
Number of measurements used in pa-
rameter retrieval (files named *num.tif).
Units Day of year (DOY)
Coverage Regional sites: Ob Estuary, Mackenzie,
Alaska, Laptev Sea Coast and Central
Yakutia.
Time period 2005-2010
Temporal frequency Yearly
Coordinate system Plate Carée map projection, WGS84
datum
Spatial resolution 1 km
Spatial sampling 15 arc-seconds
Geometric accuracy <500 m
Thematic accuracy Thawing1: ±2 weeks (with 80% proba-
bility) ±1 week (with 60% probability)
Freezing: to be determined (higher ac-
curacy than thawing)
Data format GeoTIFF
Other data codes -1 for missing or masked data
1 Preliminary estimate over the Ob Estuary site for the year 2009, with on average weekly ASAR ob-
servations. The estimation was generated through a comparison with a coarse spatial but high temporal resolution snowmelt product from QuikScat (Bartsch et al. 2007).

7
For each region and year, the product consists of three maps (GeoTIFF
format), namely the freeze-up and thawing maps and a quality indicator map
containing the number of ASAR GM measurements that were used in the re-
trieval of the F/T parameters for each product pixel. Note that pixels for which
less than 52 ASAR measurements per annum were available for product re-
trieval have been masked out (i.e. set to the default no-data value).
The product files are named according to the following pattern:
OOO_SSSSS_PPP_VVV_vvv_yyyymmdd_hhmmss-
YYYYMMDD_HHMMSS_RRR_DDD.EEE
The filename syntax is specified in Table 3–2.
The value of the “Region of Interest” field, specified in Table 3–3 follows
the definition in the Permafrost Observation Strategy document (“Service
Case Areas”).
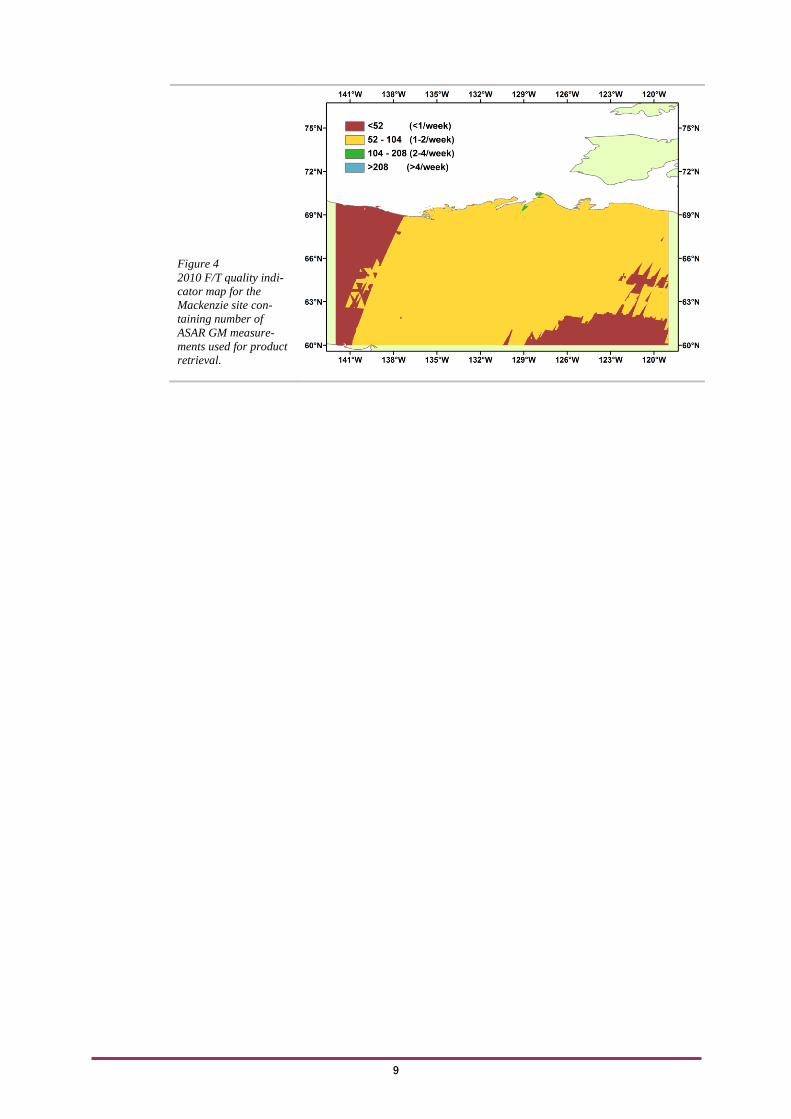
An example of the 2010 F/T product for the Mackenzie site is shown in
Figure 2 (thaw map), Figure 3 (freeze-up map) and Figure 4 (quality indica-
Table 3–2
Product filename
syntax specification.
Product filename field Field description F/T v2 value
OOO Organisation "TUW"
SSSSS Sensor and Mode "ASAGM"
PPP Product "FTH"
VVV Product/software
version
"002"
vvv Processing index "001"
YYYYMMDD_HHMMSS Start Date/Time Always Jan. 1 at 00:00:00, e.g.
"20100101_000000"
yyyymmdd_hhmmss End Date/Time Always Dec. 31 at 23:59:59,
e.g., "20101231_235959"
RRR Region of Interest E.g. "001" (see Table 3–3)
DDD Parameter "fre" (freeze-up data), "tha"
(thawing data) and "num"
(quality parameter)
EEE Extension "tif"
Table 3–3
Definitions for the “Region
of Interest” field in the
product file name, following
the Permafrost project Ser-
vice Case Areas.
Permafrost Regional site “Region of Interest” field
Alaska 001
Mackenzie 002
Laptev Sea Coast 003
Central Yakutia 004
Ob Estuary 005

8
tor). Please note that the color scheme and map/legend layout is not included
in the product.
Figure 3
2010 freeze-up map for
the Mackenzie site.
Units in day of year
(DOY).
Figure 2
2010 thaw map for the
Mackenzie site. Units
in day of year (DOY).
9
Figure 4
2010 F/T quality indi-
cator map for the
Mackenzie site con-
taining number of
ASAR GM measure-
ments used for product
retrieval.
10
4 Known issues
4.1 Limited ENVISAT ASAR GM data coverage
The quality of the derived timings for freezing and thawing is dependent on
the revisit time between ASAR observations. In general, to reach a reason-
able thematic accuracy, at least weekly ASAR acquisitions for the entire
year are required (pixels with lower data coverage have been masked out).
ASAR data coverage varies both spatially and temporally. Ob Estuary is
the most problematic region in this aspect, with up to about 50% of the ar-
ea masked out due to low data coverage (with exception for 2010 for which
the product has very little area masked out). The Alaska site exhibited suf-
ficient ASAR coverage for all years except for 2005, for which only re-
trievals for the coastal region could be provided. For the Mackenzie site, up
to about 20% of region was masked due to low coverage during 2005, 2006
and 2010. The Laptev Sea Coast and Central Yakutia sites exhibited suffi-
cient ASAR data coverage at all times.
4.2 Influence of sub-pixel water bodies
The occurrence of lakes in arctic environments may have an impact on the
product as (1) lake ice can last longer than the snow cover and (2) the op-
posite backscatter behavior occurs (if ice does not freeze to ground): lower
backscatter in summer than in winter. This issue has not been explicitly ac-
counted for. However, the masking of pixels expected to contain unreliable
results mitigates its influence on the product quality.
4.3 Map artifacts
There are artifacts in the form of sudden (unnatural) jumps in the estima-
tions of the freeze-up and thawing timing. Through manual data inspection
and testing of the processing software, it was concluded that these artifacts
did not arise from any particular erroneous ASAR datasets or through
software issues. Rather, they arise from a combination of the temporal
sampling of the ASAR acquisitions in combinations with thaw/re-freeze

11
events to which the retrieval algorithm is sensitive. This has been chiefly
observed in some of the thaw maps.
There are also artifacts in the shape of lines transecting the maps along the
azimuthal directions of some ASAR swaths. These artifacts stem from a
SAR processing issue with the NEST software.
5 Data access and contact information
The SAR Freeze/Thaw (F/T) product version 2 can be accessed via PANGAEA (http://doi.pangaea.de/10.1594/PANGAEA.780111) and should be cited as:
Sabel, Daniel; Park, Sang-Eun; Bartsch, Annett; Schlaffer, Stefan; Klein,
Jean-Pierre; Wagner, Wolfgang (2012): Regional surface soil moisture and freeze/thaw timing remote sensing products with links to geotiff images, Insti-tute of Photogrammetry and Remote Sensing, TU Vienna, doi:10.1594/PANGAEA.779658
In: DUE Permafrost Project Consortium (2012): ESA Data User Element (DUE) Permafrost: Circumpolar Remote Sensing Service for Permafrost (Full Product Set) with links to datasets. doi:10.1594/PANGAEA.780111
The product is alternatively stored on the Institute of Photogrammetry and
Remote Sensing (TU Wien) FTP server which can be accessed via the DUE Permafrost data portal (www.ipf.tuwien.ac.at/permafrost). The dataportal in-cludes a WebGIS for visualization. Login information is available on request.
For login access to the dataportal, contact [email protected]. For questions about the product, contact [email protected] or An-
[email protected]. For ESA’s technical officer, contact [email protected]. Additional information on the ESA DUE Permafrost project can be found
at the web‐site: http://www.ipf.tuwien.ac.at/permafrost

12
6 References
Sabel, Daniel; Bartalis, Zoltan; Wagner, Wolfgang; Doubkova, Marcela; Klein, Jean-Pierre (2012): Development of a Global Backscatter Model in support to the Sentinel-1 mission design. Remote Sensing of Environment, 120, 102-112.
Park, Sang-Eun; Bartsch, Annett; Sabel, Daniel; Wagner, Wolfgang; Naeimi, Vahid; Yamaguchi, Yoshio (2011): Monitoring freeze/thaw cycles us-ing ENVISAT ASAR Global Mode. Remote Sensing of Environment, 115(12).
Park, S.-E., Bartsch, A., Sabel, D. and Wagner, W. (2010, 25-30 July 2010). Monitoring of thawing process using ENVISAT ASAR global mode data. Paper presented at the Geoscience and Remote Sensing Symposium (IGARSS), 2010 IEEE International.