saratoga county regional traffic study - malta town
TRANSCRIPT
November 2015
Submi ed by:
in associa on with:
The Chazen Companies HDR
Fitzgerald & Halliday, Inc.
DRAFT Report
S a r a t o g a C o u n t y R e g i o n a l T r a f f i c S t u d y i
Table of Contents
1. Introduction ..................................................................................................................... 1-1 A. Overview .................................................................................................................................... 1-1 B. Study Area ................................................................................................................................ 1-2 C. Project Evolution and Regional Plans..................................................................................... 1-4
2. Existing Transportation Conditions ............................................................................. 2-1 A. Study Area Traffic Volumes ..................................................................................................... 2-1
Daily Traffic Volumes ............................................................................................................ 2-1 Traffic Distribution Patterns ................................................................................................ 2-3
B. Pedestrian/Bicycle Accommodation and Environment ....................................................... 2-4 C. Transit ...................................................................................................................................... 2-6 D. Freight ...................................................................................................................................... 2-8 E. Operations and Level of Service ........................................................................................... 2-10 F. Existing Land Use, Zoning, and Planned Development ...................................................... 2-14
Land Use .............................................................................................................................. 2-14 Zoning .................................................................................................................................. 2-15 Growth and Development ................................................................................................... 2-15
G. Public Involvement ................................................................................................................. 2-16
3. Forecasts and Null Conditions ..................................................................................... 3-1 A. Land Use Forecasts ................................................................................................................. 3-1 B. Trip Generation and Traffic Assignment ............................................................................... 3-2 C. Screenline Growth Evaluation ................................................................................................ 3-4 D. Programmed Projects ............................................................................................................ 3-6 E. Future Null Conditions ............................................................................................................ 3-7
4. Assessment and Mitigation Measures........................................................................ 4-1 A. Roadway Network .................................................................................................................... 4-1
Network Capacity .................................................................................................................. 4-1 Interchange 11A .................................................................................................................... 4-3 Local Connections ................................................................................................................ 4-7
B. Travel Demand Management (TDM) ..................................................................................... 4-10 Policy ..................................................................................................................................... 4-11 Transit .................................................................................................................................. 4-12 Bicycle and Pedestrian Transportation ............................................................................. 4-14
C. Capacity Evaluations .............................................................................................................. 4-17 Intersection Capacity ........................................................................................................... 4-17 Intersection Crash Review ................................................................................................. 4-18 Environmental Screening.................................................................................................. 4-20 Cost ..................................................................................................................................... 4-22
D. Safety and Education ............................................................................................................. 4-23 Roundabouts ...................................................................................................................... 4-23 Pedestrians and Bicyclists ................................................................................................ 4-26
E. Freight Impacts ..................................................................................................................... 4-29
5. Recommendations and Implementation .................................................................... 5-1
ii S a r a t o g a C o u n t y R e g i o n a l T r a f f i c S t u d y
A. Traffic Volume Monitoring ....................................................................................................... 5-1 B. TDM .......................................................................................................................................... 5-3 C. Education ................................................................................................................................. 5-4 D. Implementation ....................................................................................................................... 5-5
Public Funding ..................................................................................................................... 5-5 Generic Environmental Impact Statement ......................................................................... 5-7
List of Figures Figure 1: Study Area Intersections ......................................................................................................... 1-3
Figure 2: Trails and Bike Routes ........................................................................................................... 2-5
Figure 3: Transit...................................................................................................................................... 2-7
Figure 4: Freight ..................................................................................................................................... 2-9
Figure 5: Existing AM Peak Hour Levels of Service ........................................................................... 2-12
Figure 6: Existing PM Peak Hour Levels of Service ........................................................................... 2-13
Figure 7: PM Peak Hour Screenline Growth Analysis ......................................................................... 3-5
Figure 8: Intersections Identified for Additional Analysis .................................................................. 3-10
Figure 9: Intersections Identified for Additional Analysis with Exit 11A ............................................. 4-7
Figure 10: Potential Ruhle Road Connection......................................................................................... 4-9
List of Tables Table 2.1 – Study Area Intersections ....................................................................................................... 2-1
Table 2.2 – Regional Distribution Pattern .............................................................................................. 2-4
Table 2.3 – Existing Levels of Service Summary ................................................................................. 2-10
Table 2.4 – Building Permits (units) 2004-2013 .................................................................................... 2-15
Table 3.1 – Planned and Aggressive Development ............................................................................... 3-2
Table 3.2 – Peak Hour Trip Generation .................................................................................................. 3-3
Table 3.3 – PM Peak Hour Screenline Growth Comparison ................................................................ 3-6
Table 3.4 – Programmed Intersection Modifications............................................................................ 3-7
Table 3.5 – Null Conditions Peak Hour LOS .......................................................................................... 3-8
Table 4.1 – CDTC Roadway Segment Thresholds .................................................................................. 4-2
Table 4.2 – PM Peak Hour Capacity Screenline Analysis ..................................................................... 4-3
Table 4.3 – Interchange 11A Traffic Volume Change ............................................................................. 4-5
Table 4.4 – Intersections Below LOS E/F Threshold ............................................................................ 4-5
Table 4.5 – TDM Strategies .................................................................................................................... 4-10
Table 4.6 – Intersection Capacity Modifications ................................................................................... 4-17
Table 4.7 – Mitigated Peak Hour LOS ................................................................................................... 4-18
Table 4.8 – Crash Data Review .............................................................................................................. 4-19
Table 4.9 – Potential Environmental Impacts ....................................................................................... 4-21
S a r a t o g a C o u n t y R e g i o n a l T r a f f i c S t u d y iii
Table 4.10 – Capacity Modification Cost Estimates .............................................................................. 4-22
Table 4.11 – Pedestrian/Bicycle Crash Summary ................................................................................ 4-26
Table 4.12 – HDM Minimum Design Standards (feet) ......................................................................... 4-28
Table 4.13 – Minimum Roadway Widths for Reconstruction Projects ............................................... 4-29
Table 5.1 – PM Peak Hour Traffic Volume Monitoring .......................................................................... 5-2
Table 5.2 – Building Permit Monitoring ................................................................................................. 5-2
Table 5.3 – Federal Aid Highway Eligibility ........................................................................................... 5-5
List of Appendices Appendix A ........................................................................................................ Review of Existing Studies Appendix B ................................................................................ SCRTS – Development Project Summary Appendix C .................................................................................................... Public and Stakeholder Input Appendix D ................................................................................................ Future Development Summary Appendix E .................................................................................................... Roadway Capacity Evaluation Appendix F ............................................................................................................................. Concept Plans Appendix G .......................................................................................................... Environmental Screening Appendix H ............................................................................................................................ Cost Estimates

S a r a t o g a C o u n t y R e g i o n a l T r a f f i c S t u d y 1-1
1. Introduction
Overview The primary purpose of this study is to address traffic and transportation concerns in Saratoga County, NY in an area focused around the Adirondack Northway (I-87) Exits 11 and 12 in the Towns of Malta, Stillwater, Village of Round Lake, and including other areas impacted by economic growth and development associated with the Luther Forest Technology Campus (LFTC). The LFTC itself employs thousands and has the potential for significant additional growth, which has been the subject of several Generic Environmental Impact Statements (GEIS) and traffic analyses outlining expected growth and project related transportation mitigation. This study goes beyond the LFTC and takes an expanded view of transportation needs covering more regional traffic growth influences and a broader context. The study examines the latest LFTC information, area wide safety concerns, bicycle and pedestrian needs, freight movement, and community input to determine deficiencies and mitigation alternatives needed within the next 10 years. Although this study does not focus solely on the LFTC, it recognizes that LFTC will be a significant driver of future transportation needs and explores the need for a potential new Interchange on the Adirondack Northway (I-87 Interchange 11A).
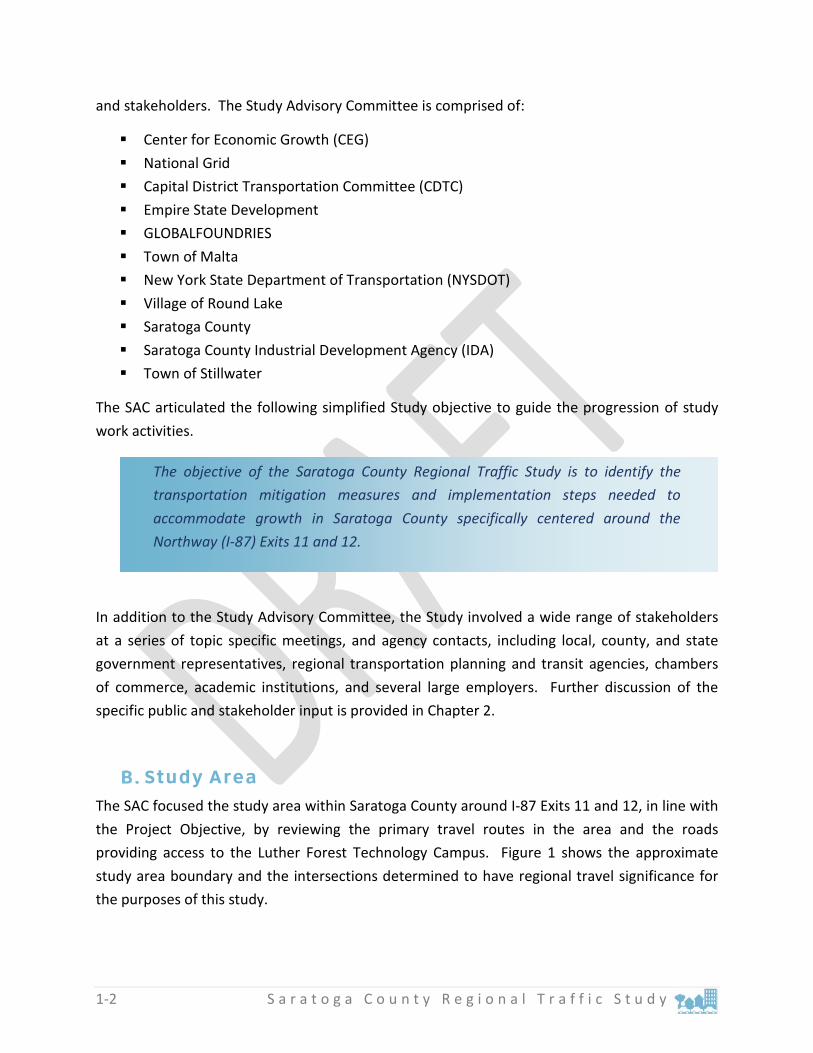
This study was administered by the Center for Economic Growth (CEG) with project management and technical assistance from the Capital District Transportation Committee (CDTC). National Grid funded $250,000 of the study through its Strategic Economic Development grant program with the remaining monies from CDTC, Saratoga County, the Town of Malta, the Town of Stillwater, Global Foundries, and the Saratoga County IDA.
A Study Advisory Committee (SAC) was established to meet regularly and to guide the Study. The committee monitored the progress, reviewed Study products and provided a two-way information conduit between the project and the general public
1-2 S a r a t o g a C o u n t y R e g i o n a l T r a f f i c S t u d y
and stakeholders. The Study Advisory Committee is comprised of:
Center for Economic Growth (CEG) National Grid Capital District Transportation Committee (CDTC) Empire State Development GLOBALFOUNDRIES Town of Malta New York State Department of Transportation (NYSDOT) Village of Round Lake Saratoga County Saratoga County Industrial Development Agency (IDA) Town of Stillwater
The SAC articulated the following simplified Study objective to guide the progression of study work activities.
In addition to the Study Advisory Committee, the Study involved a wide range of stakeholders at a series of topic specific meetings, and agency contacts, including local, county, and state government representatives, regional transportation planning and transit agencies, chambers of commerce, academic institutions, and several large employers. Further discussion of the specific public and stakeholder input is provided in Chapter 2.
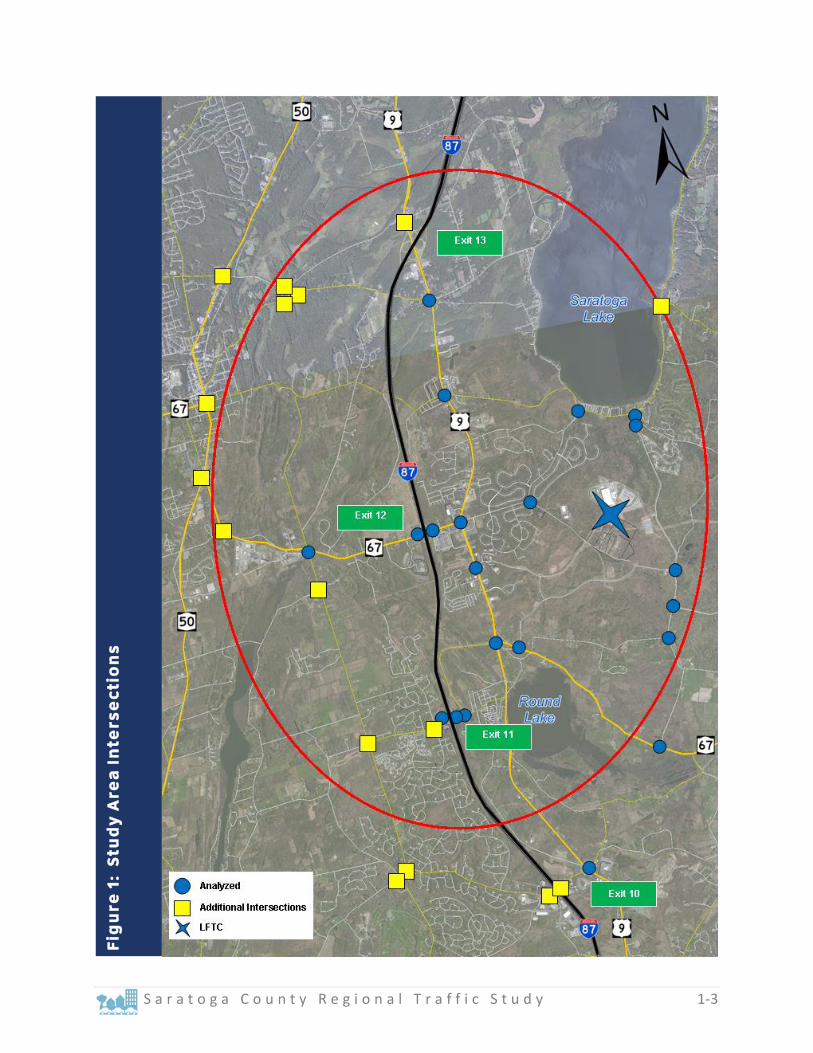
Study Area The SAC focused the study area within Saratoga County around I-87 Exits 11 and 12, in line with the Project Objective, by reviewing the primary travel routes in the area and the roads providing access to the Luther Forest Technology Campus. Figure 1 shows the approximate study area boundary and the intersections determined to have regional travel significance for the purposes of this study.
The objective of the Saratoga County Regional Traffic Study is to identify the transportation mitigation measures and implementation steps needed to accommodate growth in Saratoga County specifically centered around the Northway (I-87) Exits 11 and 12.
S a r a t o g a C o u n t y R e g i o n a l T r a f f i c S t u d y 1-3
Fig
ure
1:
Stu
dy
Are
a I
nte
rse
ctio
ns
1-4 S a r a t o g a C o u n t y R e g i o n a l T r a f f i c S t u d y
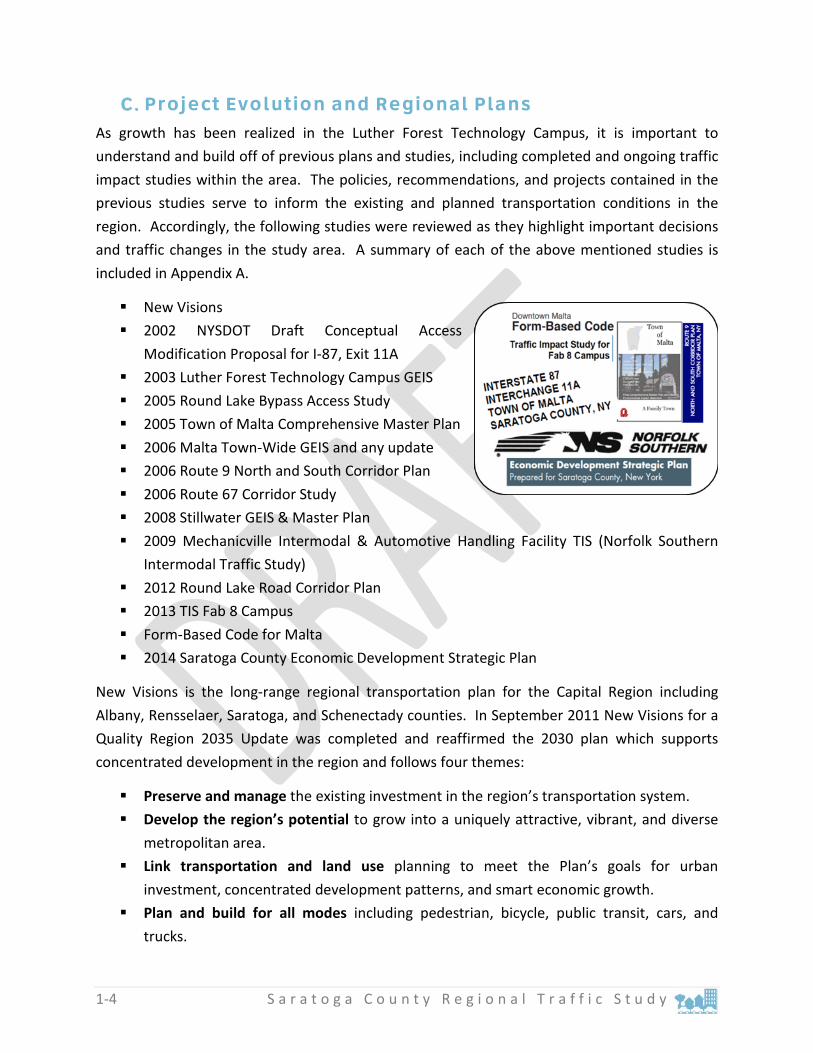
Project Evolution and Regional Plans As growth has been realized in the Luther Forest Technology Campus, it is important to understand and build off of previous plans and studies, including completed and ongoing traffic impact studies within the area. The policies, recommendations, and projects contained in the previous studies serve to inform the existing and planned transportation conditions in the region. Accordingly, the following studies were reviewed as they highlight important decisions and traffic changes in the study area. A summary of each of the above mentioned studies is included in Appendix A.
New Visions 2002 NYSDOT Draft Conceptual Access
Modification Proposal for I-87, Exit 11A 2003 Luther Forest Technology Campus GEIS 2005 Round Lake Bypass Access Study 2005 Town of Malta Comprehensive Master Plan 2006 Malta Town-Wide GEIS and any update 2006 Route 9 North and South Corridor Plan 2006 Route 67 Corridor Study 2008 Stillwater GEIS & Master Plan 2009 Mechanicville Intermodal & Automotive Handling Facility TIS (Norfolk Southern
Intermodal Traffic Study) 2012 Round Lake Road Corridor Plan 2013 TIS Fab 8 Campus Form-Based Code for Malta 2014 Saratoga County Economic Development Strategic Plan
New Visions is the long-range regional transportation plan for the Capital Region including Albany, Rensselaer, Saratoga, and Schenectady counties. In September 2011 New Visions for a Quality Region 2035 Update was completed and reaffirmed the 2030 plan which supports concentrated development in the region and follows four themes:
Preserve and manage the existing investment in the region’s transportation system. Develop the region’s potential to grow into a uniquely attractive, vibrant, and diverse
metropolitan area. Link transportation and land use planning to meet the Plan’s goals for urban
investment, concentrated development patterns, and smart economic growth. Plan and build for all modes including pedestrian, bicycle, public transit, cars, and
trucks.

S a r a t o g a C o u n t y R e g i o n a l T r a f f i c S t u d y 1-5
The current update (New Visions 2040) maintains the four themes while placing an emphasis on public participation, land use planning, and multi-modal transportation.
While New Visions provides planning principles and four over-arching themes for the Capital Region, the other studies provide a more focused analysis and plan for the study area. The common themes and key issues identified in these studies include:
Capacity and safety of the Route 9/Route 67/Dunning Street intersection Construction of an I-87 Exit 11A with construction of two Fabs at LFTC Capacity and delay at the I-87 Exit 11 ramp intersections with Round Lake Road Individual intersection capacity modifications Additional roadway connections to mitigate delay Desire to maintain a “downtown” in Malta Multi-modal access and accommodations in all areas
The I-87 Exit 11A interchange was identified as a mitigation measure after construction of two Fabs in the FGEIS for LFTC dated October 16, 2003. The Malta Town-Wide GEIS identified intersection improvements at the US Route 9/NY Route 67/Dunning Street intersection and the I-87 Exit 11 Northbound Ramp/Round Lake Road intersection with the assumption that construction of Exit 11A would alleviate traffic volumes at these intersections in the future. The LFTC FGEIS is more than a decade old and transportation conditions and business plans for LFTC have changed. The fundamental assumption that Exit 11A is needed after construction of two Fabs, which was carried through the Malta Town-Wide GEIS, requires additional investigation. The trip generating potential of LFTC was included in a number of the planning studies reviewed, as construction and operation of the first Fab continues, the trip generating potential of the site can be reviewed and updated as needed to confirm the specific recommendations in the reviewed studies. The most recent evaluation for GLOBALFOUNDRIES completed in 2013 determined that additional development, beyond two Fabs, could occur at the site without construction of Exit 11A.


S a r a t o g a C o u n t y R e g i o n a l T r a f f i c S t u d y 2-1
2. Existing Transportation Conditions
The study area is served through a network of local, county, and state maintained roadways. Regional north/south access to the study area is provided via Interstate 87 (the Northway). US Route 9 and NY Route 50 parallel the Northway to the east and west creating access to the study area from local origins. There are two primary east/west roadways in the study area connecting NY Route 50 and US Route 9 and traversing the Northway: NY Route 67 at Exit 12 and Round Lake Road (CR 80) at Exit 11. Secondary east/west roadway connections in the study area are Old Post Road and Malta Avenue (CR 63) near Exit 13 and Ushers Road near Exit 10. Table 2.1 identifies the study area intersections by number.
Table 2.1 – Study Area Intersections No. Intersection No. Intersection 1 NY Rt 50/Ballston Ave/Northline Rd 20 Round Lake Rd/Ruhle Rd/Raylinsky Rd 2 Old Post Rd/Northline Rd 21 Round Lake Rd/I-87 Exit 11 Southbound 3 Old Post Rd/Malta Ave 22 Round Lake Rd/I-87 Exit 11 Northbound 4 Northline Rd/Malta Ave 23 Round Lake Bypass/Curry Ave 5 US Rt 9/Cherry Choke Rd/Old Post Rd 24 US Rt 9/George Ave 6 US Rt 9/Malta Ave 25 Longkill Rd/McElroy Rd/Hatlee Rd/Main St 7 US Rt 9/NY Rt 9P 26 Longkill Rd/Ushers Rd 8 NY Rt 67/NY Rt 50/E High St/Milton Ave 27 Ushers Rd/I-87 Exit 10 Southbound 9 NY Rt 67/NY Rt 50/Ballston Ave/Saratoga Rd 28 Ushers Rd/I-87 Exit 10 Northbound 10 NY Rt 67/Brookline Rd 29 US Rt 9/Ushers Rd 11 NY Rt 67/Eastline Rd 30 NY Rt 9P/NY Rt 423 12 NY Rt 67/I-87 Exit 12 Southbound 31 NY Rt 9P/Plains Rd 13 NY Rt 67/I-87 Exit 12 Northbound 32 NY Rt 9P/Lake Rd 14 US Rt 9/NY Rt 67/Dunning St 33 Lake Rd/Cold Springs Rd 15 Dunning St/Hermes Rd/Plains Rd 34 Cold Springs Rd/Cordero Blvd 16 US Rt 9/Stonebreak Rd 35 Cold Springs Rd/Elmore Robinson Rd 17 US Rt 9/NY Rt 67/Round Lake Bypass 36 Cold Springs Rd/Fitch Rd/Joyce Rd 18 Luther Forest Blvd/NY Rt 67 37 NY Rt 67/Farley Rd 19 Eastline Rd/Round Lake Rd 38 Eastline Rd/Lake Rd
Study Area Traffic Volumes Daily Traffic Volumes Existing roadway and intersection traffic volumes were determined using data available through NYSDOT, Saratoga County, local municipalities, previously completed studies, and new traffic data where needed. The traffic volume data includes daily traffic volumes to identify peaking characteristics on study area roadways and intersection turning movement counts which are used to identify intersection operational conditions.
2-2 S a r a t o g a C o u n t y R e g i o n a l T r a f f i c S t u d y
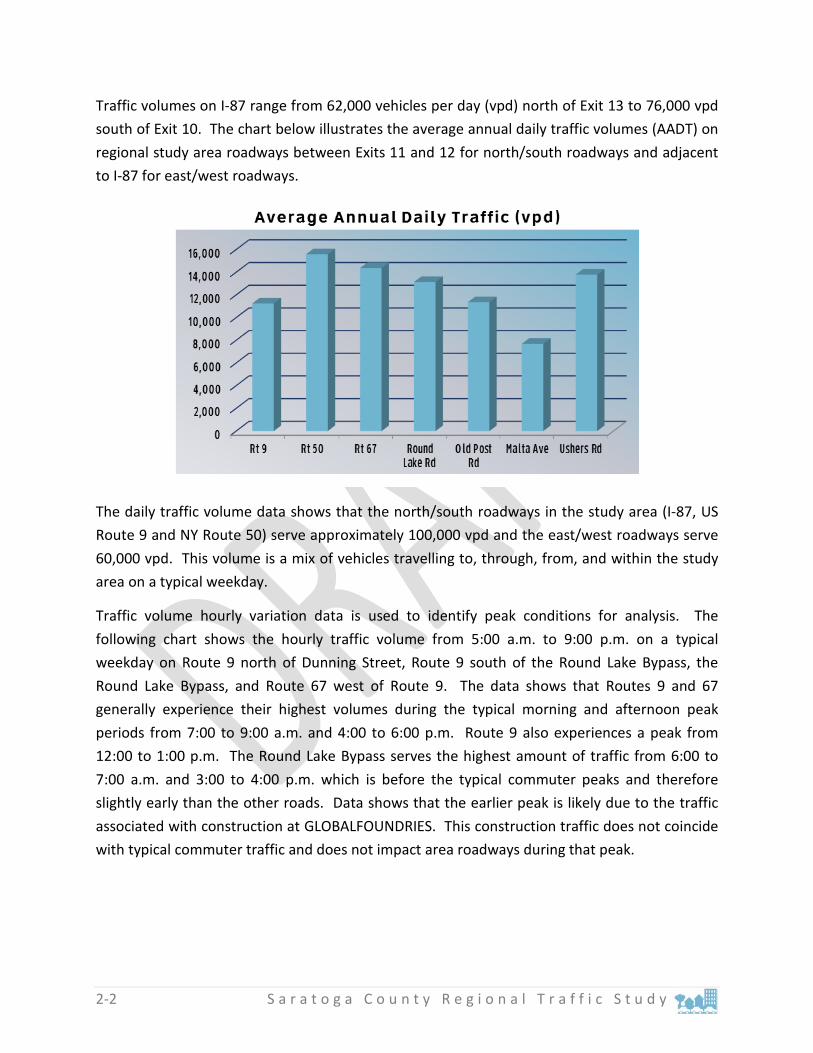
Traffic volumes on I-87 range from 62,000 vehicles per day (vpd) north of Exit 13 to 76,000 vpd south of Exit 10. The chart below illustrates the average annual daily traffic volumes (AADT) on regional study area roadways between Exits 11 and 12 for north/south roadways and adjacent to I-87 for east/west roadways.
The daily traffic volume data shows that the north/south roadways in the study area (I-87, US Route 9 and NY Route 50) serve approximately 100,000 vpd and the east/west roadways serve 60,000 vpd. This volume is a mix of vehicles travelling to, through, from, and within the study area on a typical weekday.
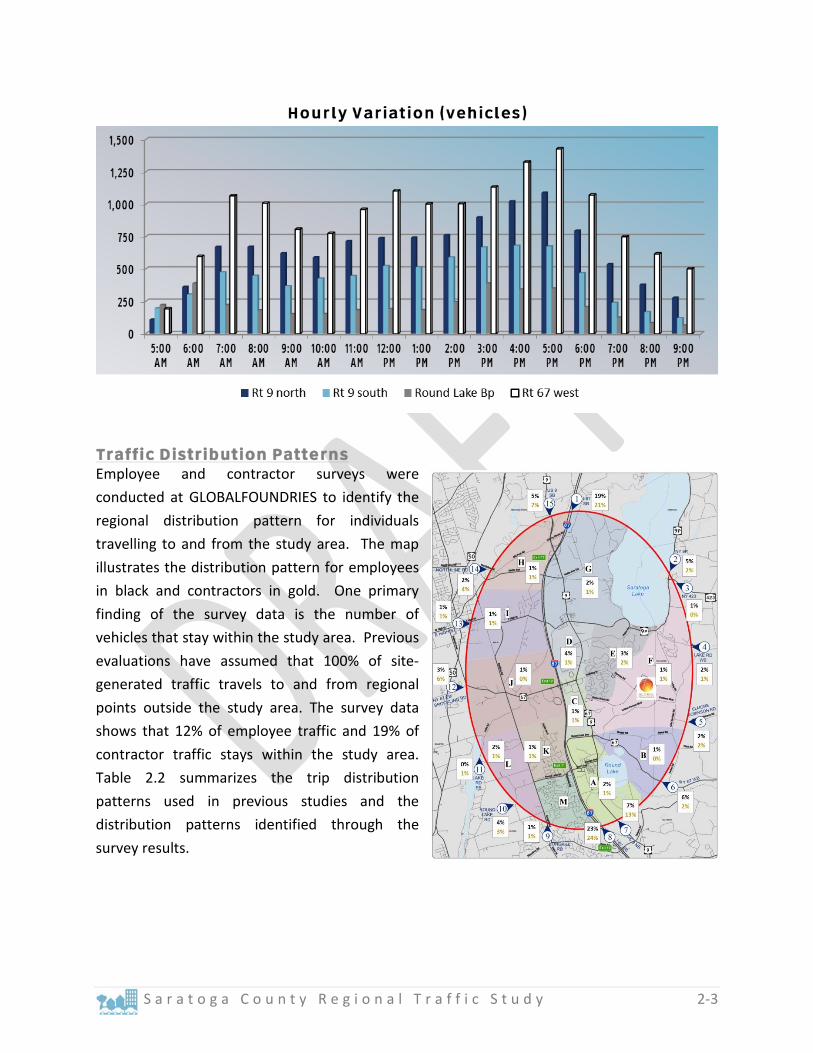
Traffic volume hourly variation data is used to identify peak conditions for analysis. The following chart shows the hourly traffic volume from 5:00 a.m. to 9:00 p.m. on a typical weekday on Route 9 north of Dunning Street, Route 9 south of the Round Lake Bypass, the Round Lake Bypass, and Route 67 west of Route 9. The data shows that Routes 9 and 67 generally experience their highest volumes during the typical morning and afternoon peak periods from 7:00 to 9:00 a.m. and 4:00 to 6:00 p.m. Route 9 also experiences a peak from 12:00 to 1:00 p.m. The Round Lake Bypass serves the highest amount of traffic from 6:00 to 7:00 a.m. and 3:00 to 4:00 p.m. which is before the typical commuter peaks and therefore slightly early than the other roads. Data shows that the earlier peak is likely due to the traffic associated with construction at GLOBALFOUNDRIES. This construction traffic does not coincide with typical commuter traffic and does not impact area roadways during that peak.
S a r a t o g a C o u n t y R e g i o n a l T r a f f i c S t u d y 2-3
Traffic Distribution Patterns Employee and contractor surveys were conducted at GLOBALFOUNDRIES to identify the regional distribution pattern for individuals travelling to and from the study area. The map illustrates the distribution pattern for employees in black and contractors in gold. One primary finding of the survey data is the number of vehicles that stay within the study area. Previous evaluations have assumed that 100% of site-generated traffic travels to and from regional points outside the study area. The survey data shows that 12% of employee traffic and 19% of contractor traffic stays within the study area. Table 2.2 summarizes the trip distribution patterns used in previous studies and the distribution patterns identified through the survey results.
2-4 S a r a t o g a C o u n t y R e g i o n a l T r a f f i c S t u d y
Table 2.2 – Regional Distribution Pattern Direction Previous Evaluations 2014 GF Survey
2003 GEIS 2013 TIS Employee Contractor North 39% 39% 30% 29% South 24% 25% 38% 31% East 15% 14% 5% 11% West 22% 22% 15% 10% Internal 0% 0% 12% 19% Total 100% 100% 100% 100%
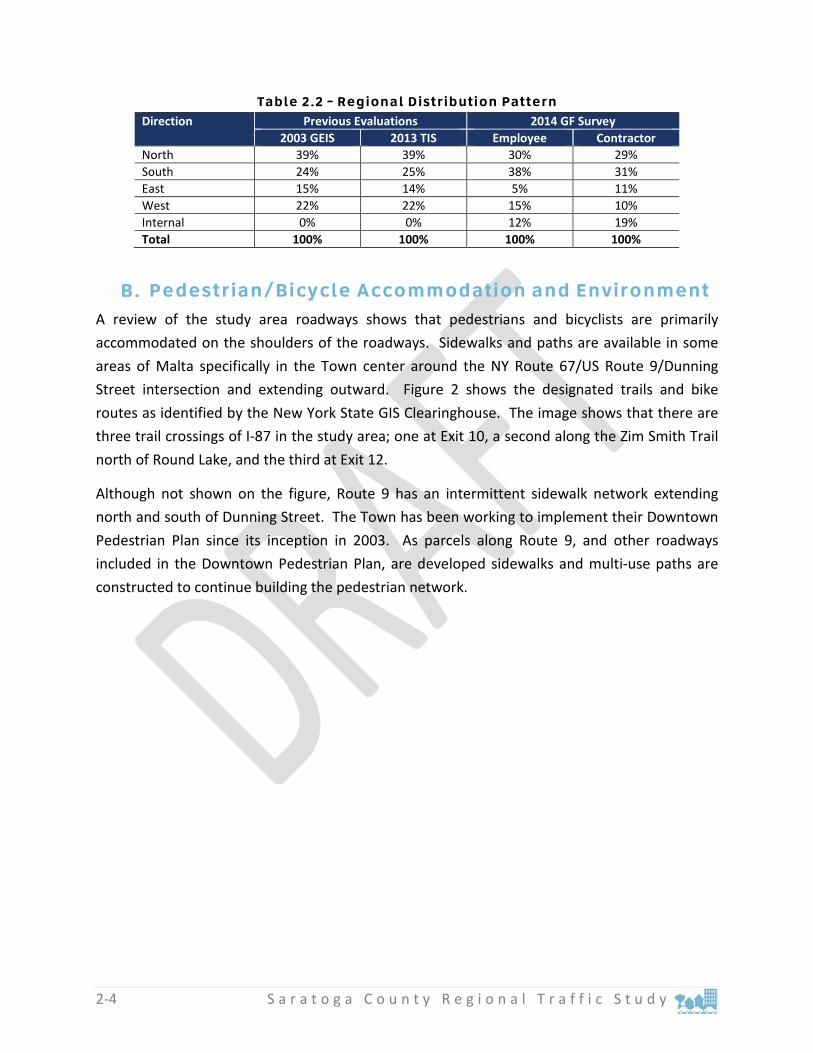
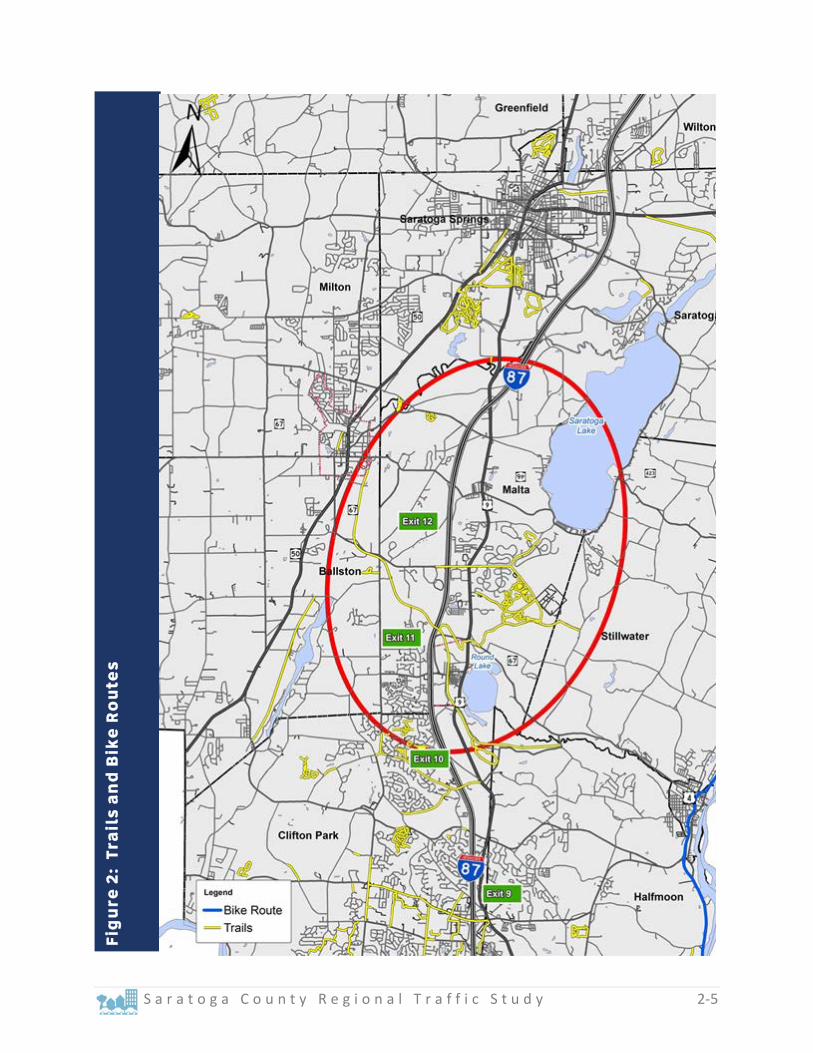
Pedestrian/Bicycle Accommodation and Environment A review of the study area roadways shows that pedestrians and bicyclists are primarily accommodated on the shoulders of the roadways. Sidewalks and paths are available in some areas of Malta specifically in the Town center around the NY Route 67/US Route 9/Dunning Street intersection and extending outward. Figure 2 shows the designated trails and bike routes as identified by the New York State GIS Clearinghouse. The image shows that there are three trail crossings of I-87 in the study area; one at Exit 10, a second along the Zim Smith Trail north of Round Lake, and the third at Exit 12.
Although not shown on the figure, Route 9 has an intermittent sidewalk network extending north and south of Dunning Street. The Town has been working to implement their Downtown Pedestrian Plan since its inception in 2003. As parcels along Route 9, and other roadways included in the Downtown Pedestrian Plan, are developed sidewalks and multi-use paths are constructed to continue building the pedestrian network.
S a r a t o g a C o u n t y R e g i o n a l T r a f f i c S t u d y 2-5
Fig
ure
2:
Tra
ils
an
d B
ike
Ro
ute
s
2-6 S a r a t o g a C o u n t y R e g i o n a l T r a f f i c S t u d y
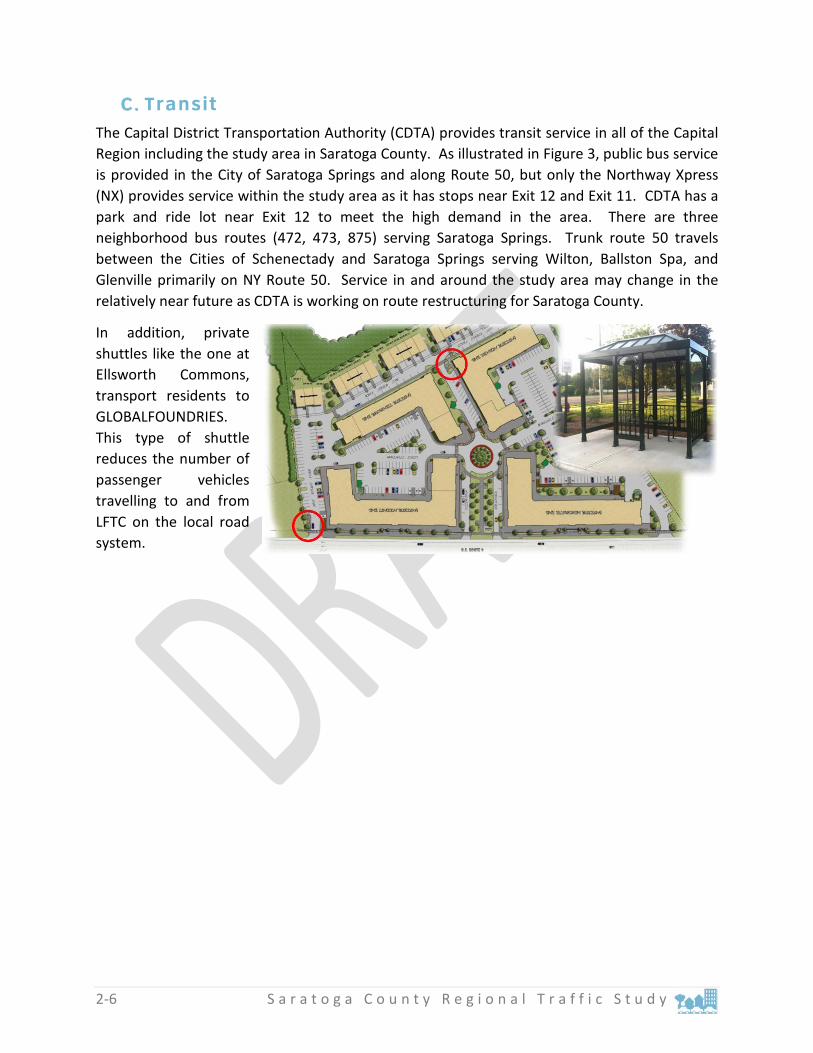
Transit The Capital District Transportation Authority (CDTA) provides transit service in all of the Capital Region including the study area in Saratoga County. As illustrated in Figure 3, public bus service is provided in the City of Saratoga Springs and along Route 50, but only the Northway Xpress (NX) provides service within the study area as it has stops near Exit 12 and Exit 11. CDTA has a park and ride lot near Exit 12 to meet the high demand in the area. There are three neighborhood bus routes (472, 473, 875) serving Saratoga Springs. Trunk route 50 travels between the Cities of Schenectady and Saratoga Springs serving Wilton, Ballston Spa, and Glenville primarily on NY Route 50. Service in and around the study area may change in the relatively near future as CDTA is working on route restructuring for Saratoga County.
In addition, private shuttles like the one at Ellsworth Commons, transport residents to GLOBALFOUNDRIES. This type of shuttle reduces the number of passenger vehicles travelling to and from LFTC on the local road system.

S a r a t o g a C o u n t y R e g i o n a l T r a f f i c S t u d y 2-7
Fig
ure
3:
Tra
nsi
t
2‐8 S a r a t o g a C o u n t y R e g i o n a l T r a f f i c S t u d y
Freight
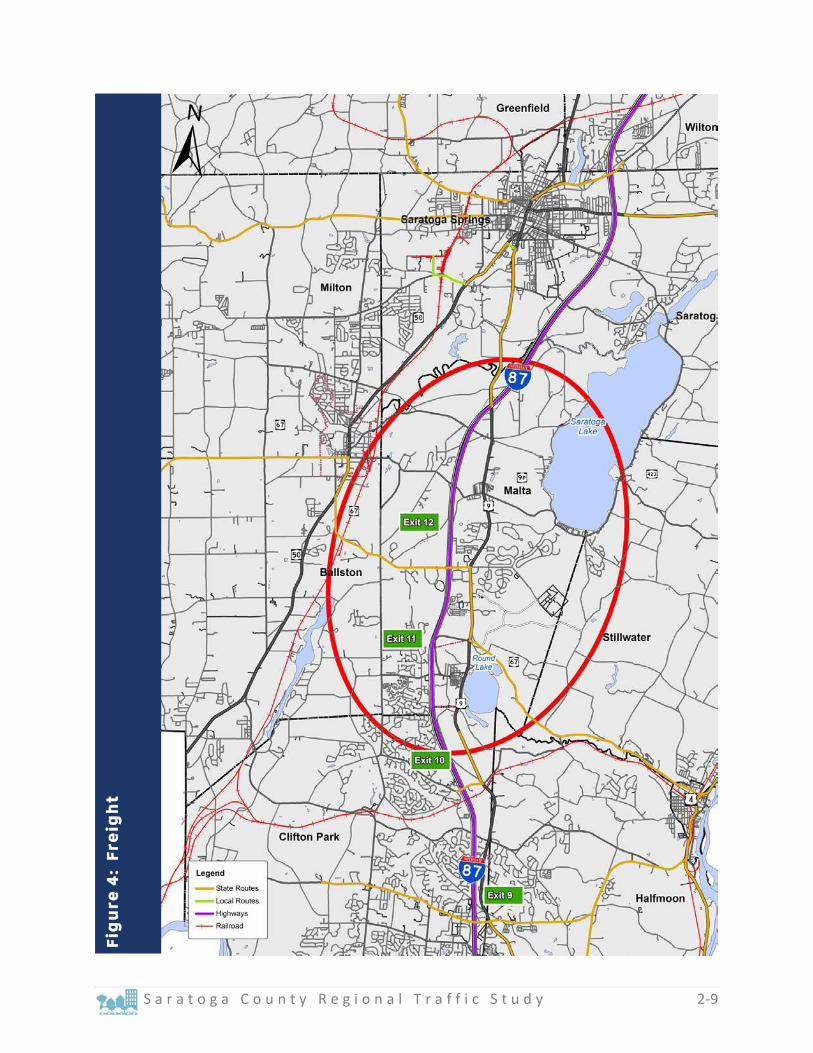
Freight traffic in the study area includes both rail and truck travel. I‐87, Route 67, and portions of Route 9 are designated truck routes in the study area as shown on Figure 4. Construction of the Norfolk‐Southern Mechanicville Intermodal & Automotive Handling Facility has increased heavy vehicle traffic on Route 67 between Mechanicville and I‐87 Exit 11 and construction materials destined for GLOBALFOUNDRIES are contributing to general heavy vehicle traffic on study area roadways, especially between I‐87 and the LFTC. Review of available data shows that heavy vehicle traffic accounts for more than 14% of daily traffic between Route 9 and Mechanicville. Heavy vehicle traffic on roadways accessing LFTC ranges from a low of 3.5% of daily traffic on Hermes Road to a high of 10.5% of daily traffic on Luther Forest Boulevard.
It is noted that the CDTC has established the Freight Advisory Committee to guide its freight planning efforts to help decision makers better understand freight movement complexities and to more effectively guide public investment in the transportation infrastructure. CDTC is currently managing The Regional Freight & Goods Movement Study which will provide analysis and recommendations to inform the freight section of the CDTC’s 2040 New Visions Plan update. The study is expected to address a number of issues including the following that may affect the study area:
Minimize conflicts caused by the proximity of incompatible land uses near major freight facilities or generators (ex: safety issues, noise pollution, conflicting movements between passenger vehicles and heavy trucks, heavy wear on roadways in residential streets, increased burden for freight delivery, etc.)
Minimize heavy truck impacts on traffic congestion during peak commute periods, particularly through the urban core;
Minimize conflicts between freight modes, including cooperation of intra‐ and intermodal partners and competitors;
Protect and enhance local delivery access for trucks, particularly in urban areas of rapid urbanization or areas experiencing development;
Identify opportunities to enhance freight activity at major generators or intermodal facilities to support further economic development.
S a r a t o g a C o u n t y R e g i o n a l T r a f f i c S t u d y 2-9
Fi
gu
re 4
: Fr
eig
ht
2-10 S a r a t o g a C o u n t y R e g i o n a l T r a f f i c S t u d y
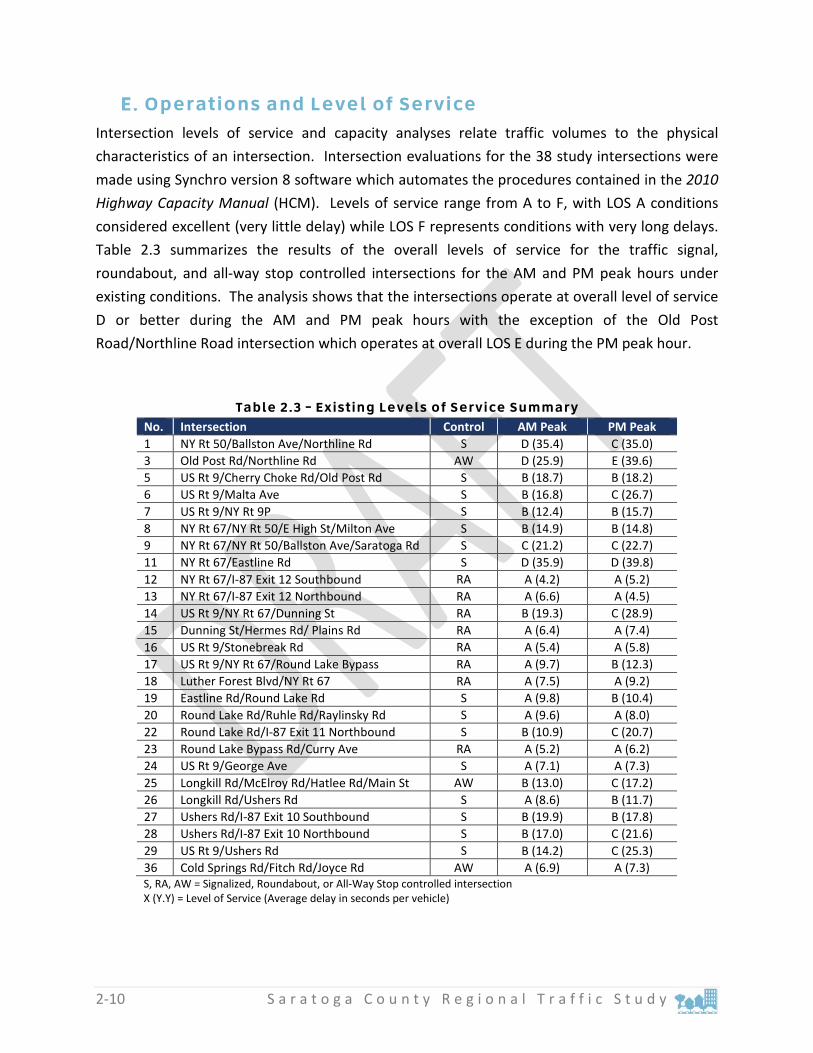
Operations and Level of Service Intersection levels of service and capacity analyses relate traffic volumes to the physical characteristics of an intersection. Intersection evaluations for the 38 study intersections were made using Synchro version 8 software which automates the procedures contained in the 2010 Highway Capacity Manual (HCM). Levels of service range from A to F, with LOS A conditions considered excellent (very little delay) while LOS F represents conditions with very long delays. Table 2.3 summarizes the results of the overall levels of service for the traffic signal, roundabout, and all-way stop controlled intersections for the AM and PM peak hours under existing conditions. The analysis shows that the intersections operate at overall level of service D or better during the AM and PM peak hours with the exception of the Old Post Road/Northline Road intersection which operates at overall LOS E during the PM peak hour.
Table 2.3 – Existing Levels of Service Summary No. Intersection Control AM Peak PM Peak 1 NY Rt 50/Ballston Ave/Northline Rd S D (35.4) C (35.0) 3 Old Post Rd/Northline Rd AW D (25.9) E (39.6) 5 US Rt 9/Cherry Choke Rd/Old Post Rd S B (18.7) B (18.2) 6 US Rt 9/Malta Ave S B (16.8) C (26.7) 7 US Rt 9/NY Rt 9P S B (12.4) B (15.7) 8 NY Rt 67/NY Rt 50/E High St/Milton Ave S B (14.9) B (14.8) 9 NY Rt 67/NY Rt 50/Ballston Ave/Saratoga Rd S C (21.2) C (22.7) 11 NY Rt 67/Eastline Rd S D (35.9) D (39.8) 12 NY Rt 67/I-87 Exit 12 Southbound RA A (4.2) A (5.2) 13 NY Rt 67/I-87 Exit 12 Northbound RA A (6.6) A (4.5) 14 US Rt 9/NY Rt 67/Dunning St RA B (19.3) C (28.9) 15 Dunning St/Hermes Rd/ Plains Rd RA A (6.4) A (7.4) 16 US Rt 9/Stonebreak Rd RA A (5.4) A (5.8) 17 US Rt 9/NY Rt 67/Round Lake Bypass RA A (9.7) B (12.3) 18 Luther Forest Blvd/NY Rt 67 RA A (7.5) A (9.2) 19 Eastline Rd/Round Lake Rd S A (9.8) B (10.4) 20 Round Lake Rd/Ruhle Rd/Raylinsky Rd S A (9.6) A (8.0) 22 Round Lake Rd/I-87 Exit 11 Northbound S B (10.9) C (20.7) 23 Round Lake Bypass Rd/Curry Ave RA A (5.2) A (6.2) 24 US Rt 9/George Ave S A (7.1) A (7.3) 25 Longkill Rd/McElroy Rd/Hatlee Rd/Main St AW B (13.0) C (17.2) 26 Longkill Rd/Ushers Rd S A (8.6) B (11.7) 27 Ushers Rd/I-87 Exit 10 Southbound S B (19.9) B (17.8) 28 Ushers Rd/I-87 Exit 10 Northbound S B (17.0) C (21.6) 29 US Rt 9/Ushers Rd S B (14.2) C (25.3) 36 Cold Springs Rd/Fitch Rd/Joyce Rd AW A (6.9) A (7.3)
S, RA, AW = Signalized, Roundabout, or All-Way Stop controlled intersection X (Y.Y) = Level of Service (Average delay in seconds per vehicle)
S a r a t o g a C o u n t y R e g i o n a l T r a f f i c S t u d y 2-11
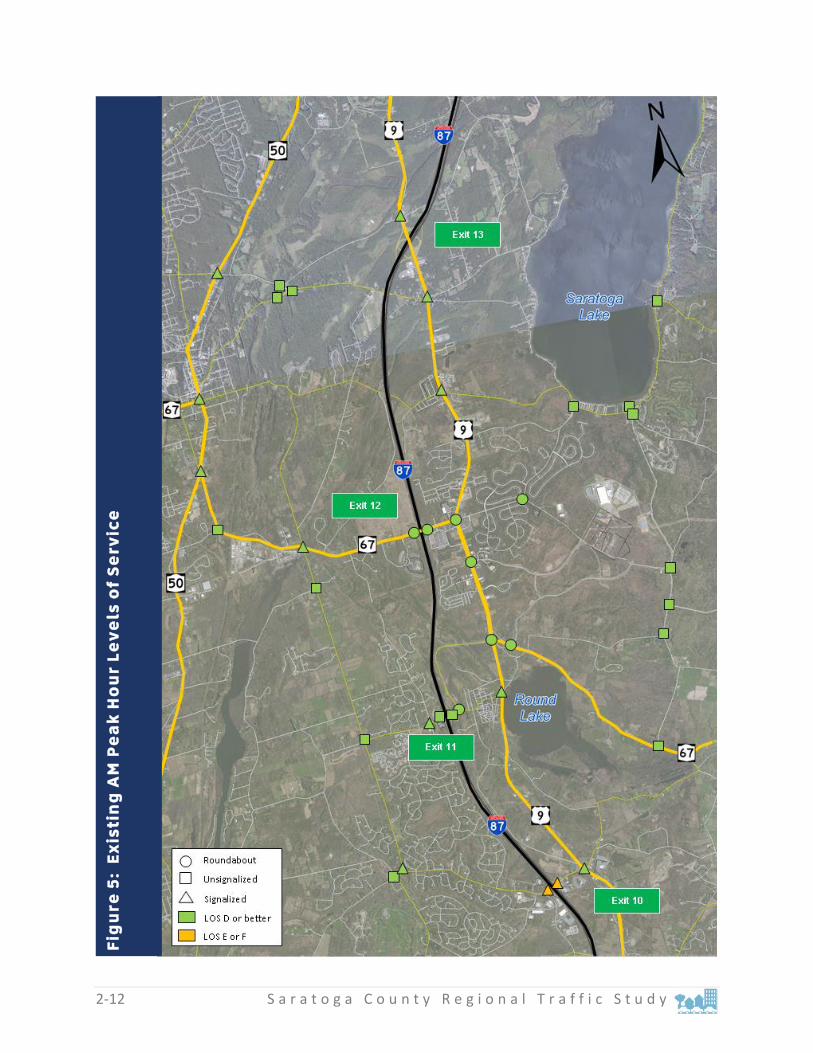
Figures 5 and 6 illustrate the overall or controlled approach levels of service for all study intersections. The figures also identify the intersections that have intersection approaches or movements that operate at level of service E or F even though the overall intersection may operate at overall level of service D or better.
2-12 S a r a t o g a C o u n t y R e g i o n a l T r a f f i c S t u d y
Fig
ure
5:
Ex
isti
ng
AM
Pe
ak
Ho
ur
Lev
els
of
Se
rvic
e

S a r a t o g a C o u n t y R e g i o n a l T r a f f i c S t u d y 2-13
Fig
ure
6:
Ex
isti
ng
PM
Pe
ak
Ho
ur
Lev
els
of
Se
rvic
e

2-14 S a r a t o g a C o u n t y R e g i o n a l T r a f f i c S t u d y
Figures 5 and 6 show that the following intersections have level of service E or F operations for particular movements:
Old Post Road/Northline Road – eastbound and westbound on Northline Road during the PM peak hour
Round Lake Road/Exit 11 Southbound Ramp – southbound ramp during the PM peak hour
Ushers Road/Exit 10 Southbound Ramp – southbound ramp during the AM and PM peak hours
Ushers Road/Exit 10 Northbound Ramp – northbound ramp during the PM peak hour
Since these locations operate below level of service D under existing conditions, mitigation measures will be evaluated in Chapter 3 of this study. It is noted that the Old Post Road/Northline Road and Round Lake Road/Exit 11 Southbound Ramp intersections have been identified in previous studies and analysis for intersection capacity modifications.
Existing Land Use, Zoning, and Planned Development It is important to understand existing land use, zoning, and development trends to forecast future growth affecting the study area. The growth potential is evaluated to determine future traffic volumes and transportation deficiencies and needs in the study area.
Land Use Saratoga County represents a mix of very low to medium density residential, agricultural, vacant, and commercial land uses. Data presented on the Saratoga PLAN website shows more than half of the land cover in Saratoga County is Woods and Shrubland and only 21% is Developed. Of the 21% of the developed land, the majority is residential. There are corridors of commercial use located proximate to Routes 9, 50, and 67 and isolated industrial land uses. The construction and operation of GLOBALFOUNDRIES has increased the number of

S a r a t o g a C o u n t y R e g i o n a l T r a f f i c S t u d y 2-15
commercial and industrial uses in Saratoga County since the 2010 census.
Zoning Each of the study area communities has zoning laws used to guide and frame growth within their municipal borders. The zoning and form-based codes have become increasingly important to positively shape development and strengthen the study area communities, as growth occurs.
Growth and Development Information published by the Capital District Regional Planning Commission (CDRPC), utilizing United State census data, shows that the population in the Capital District increased by approximately 44,000 people from 2000 to 2010. Of the 44,000 increase, 19,000 (~43%) is attributed to population growth in Saratoga County. While Saratoga County is experiencing the largest population growth in the region, of the 110,000 workers in the county, almost 47% leave the county to work.
Historical building permit data was collected from CDRPC from 2004 through 2013 to identify how Saratoga County has been developing over the last decade. This period represents both pre- and post-recession periods and includes entries for the number of buildings as well as units permitted. Table 2.4 summarizes the building permit totals, annual average, and annual high for each of the study area communities. The detailed information is included in Appendix B.
Table 2.4 – Building Permits (units) 2004-2013 Community Total Annual Average Annual High Town of Ballston 652 65 124 Town of Clifton Park 877 88 213 Town of Halfmoon 2,059 206 337 Town of Malta 693 69 105 Town of Milton* 204 68 95 Town of Saratoga 171 17 37 City of Saratoga Springs 1,512 151 309 Town of Stillwater 346 35 75 Town of Wilton 1,209 121 426 Total 7,723 820 1,721
*Note – Data reported for the Town of Milton is limited to 2011 through 2013 due to lack of data
Table 2.4 shows that over the data evaluation period, a total of 7,723 units were built at an average rate of 820 units per year.
In addition to the historical data, representatives from each of the communities surrounding the study area were interviewed to identify existing development projects that have been approved or are in the approval process with the local municipality, i.e. known developments that are “on the books”. The research identified 6,432 residential units remaining to be built
2-16 S a r a t o g a C o u n t y R e g i o n a l T r a f f i c S t u d y
and 3.75 million square feet (SF) of commercial development that has been approved or is currently undergoing the approval process. When comparing the existing planned development to growth over the last decade, this rate of anticipated growth is higher than the previous decade as identified by the CDRPC.
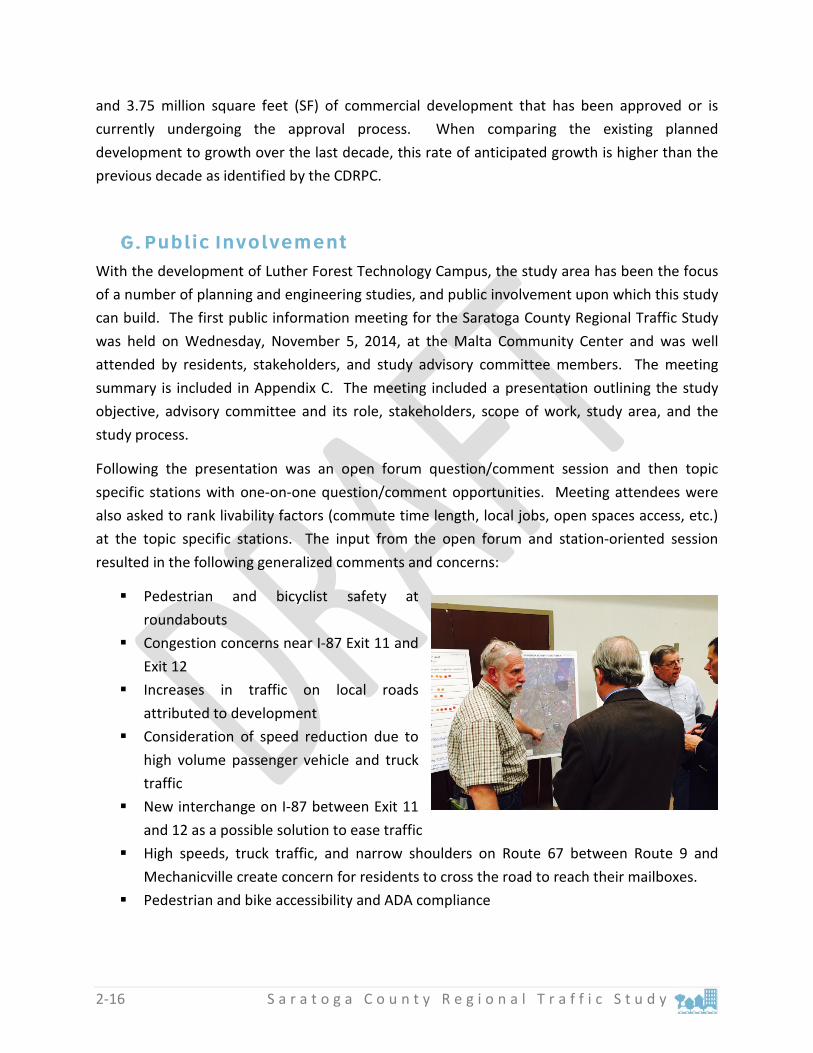
Public Involvement With the development of Luther Forest Technology Campus, the study area has been the focus of a number of planning and engineering studies, and public involvement upon which this study can build. The first public information meeting for the Saratoga County Regional Traffic Study was held on Wednesday, November 5, 2014, at the Malta Community Center and was well attended by residents, stakeholders, and study advisory committee members. The meeting summary is included in Appendix C. The meeting included a presentation outlining the study objective, advisory committee and its role, stakeholders, scope of work, study area, and the study process.
Following the presentation was an open forum question/comment session and then topic specific stations with one-on-one question/comment opportunities. Meeting attendees were also asked to rank livability factors (commute time length, local jobs, open spaces access, etc.) at the topic specific stations. The input from the open forum and station-oriented session resulted in the following generalized comments and concerns:
Pedestrian and bicyclist safety at roundabouts
Congestion concerns near I-87 Exit 11 and Exit 12
Increases in traffic on local roads attributed to development
Consideration of speed reduction due to high volume passenger vehicle and truck traffic
New interchange on I-87 between Exit 11 and 12 as a possible solution to ease traffic
High speeds, truck traffic, and narrow shoulders on Route 67 between Route 9 and Mechanicville create concern for residents to cross the road to reach their mailboxes.
Pedestrian and bike accessibility and ADA compliance
S a r a t o g a C o u n t y R e g i o n a l T r a f f i c S t u d y 2-17
The comments and concerns raised by the public will be considered when identifying the appropriate mitigation in the study area, as discussed in later chapters.
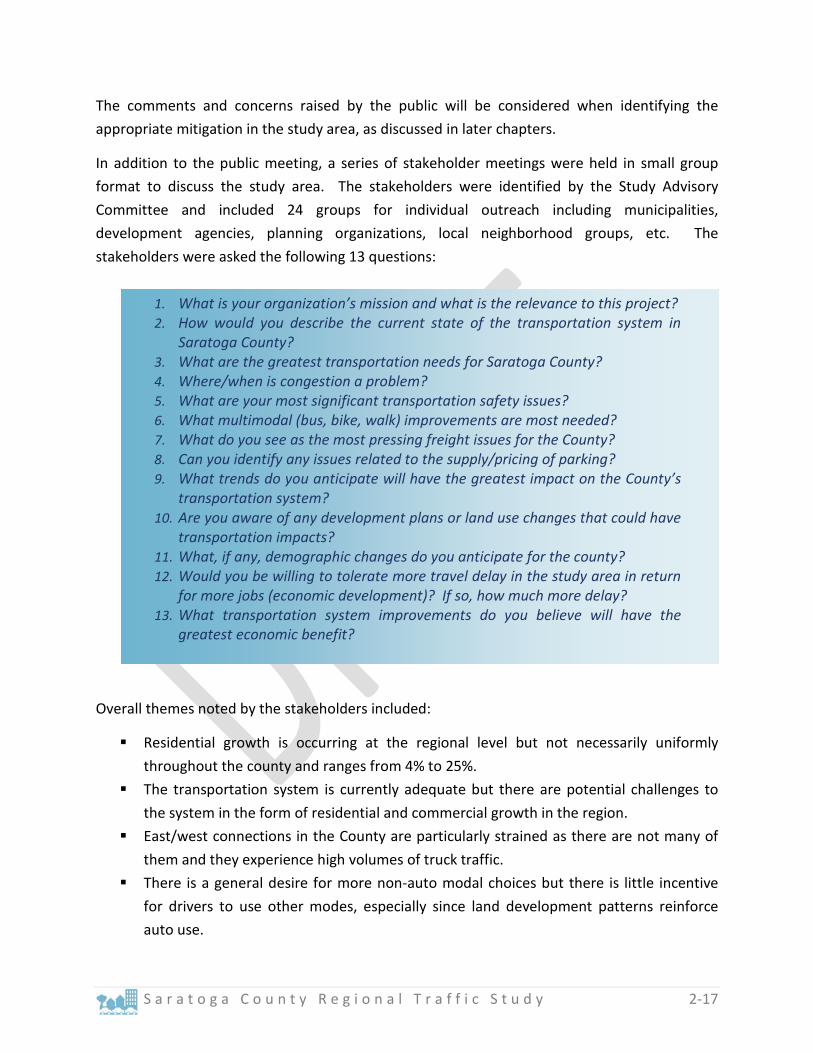
In addition to the public meeting, a series of stakeholder meetings were held in small group format to discuss the study area. The stakeholders were identified by the Study Advisory Committee and included 24 groups for individual outreach including municipalities, development agencies, planning organizations, local neighborhood groups, etc. The stakeholders were asked the following 13 questions:
Overall themes noted by the stakeholders included:
Residential growth is occurring at the regional level but not necessarily uniformly throughout the county and ranges from 4% to 25%.
The transportation system is currently adequate but there are potential challenges to the system in the form of residential and commercial growth in the region.
East/west connections in the County are particularly strained as there are not many of them and they experience high volumes of truck traffic.
There is a general desire for more non-auto modal choices but there is little incentive for drivers to use other modes, especially since land development patterns reinforce auto use.
1. What is your organization’s mission and what is the relevance to this project? 2. How would you describe the current state of the transportation system in
Saratoga County? 3. What are the greatest transportation needs for Saratoga County? 4. Where/when is congestion a problem? 5. What are your most significant transportation safety issues? 6. What multimodal (bus, bike, walk) improvements are most needed? 7. What do you see as the most pressing freight issues for the County? 8. Can you identify any issues related to the supply/pricing of parking? 9. What trends do you anticipate will have the greatest impact on the County’s
transportation system? 10. Are you aware of any development plans or land use changes that could have
transportation impacts? 11. What, if any, demographic changes do you anticipate for the county? 12. Would you be willing to tolerate more travel delay in the study area in return
for more jobs (economic development)? If so, how much more delay? 13. What transportation system improvements do you believe will have the
greatest economic benefit?

2-18 S a r a t o g a C o u n t y R e g i o n a l T r a f f i c S t u d y
One of the goals of this study is to address this public input during the development of recommendations. More detailed comments are included in the Public Input Summary in Appendix C.

S a r a t o g a C o u n t y R e g i o n a l T r a f f i c S t u d y 3-1
3. Forecasts and Null Conditions
Land use and traffic forecasts were developed to examine the sufficiency of the transportation network and the need for future mitigation. In consultation with the SAC and study area communities, the forecasts were prepared for two scenarios – “Planned’ and “Aggressive”. The Planned scenario includes projects that have some form of approval status, are currently under construction, and/or have been approved but not fully built out. This scenario also includes construction of GLOBALFOUNDARIES Fab 8.2. The Aggressive scenario includes growth associated with the Planned scenario and the speculative projects identified during community interviews. This scenario takes into account construction of another fab (similar in size to Fab 8.2) and additional development in the NYSERDA campus area.
Land Use Forecasts Community representatives were interviewed to identify planned growth in their municipalities (projects on the books). In addition to the planned growth the interviews identified future speculative or potential growth beyond those projects currently with approvals or in the approval process. Review of this data identified existing plans for approximately 6,400 additional residential units and 3.7 million SF of commercial growth. The Aggressive scenario would add another 3,100 residential units and 3.6 million SF of commercial development. The detailed list of all the future land development projects and full-size map of the figure to the right are included in Appendix D and summarized in Table 3.1.
3-2 S a r a t o g a C o u n t y R e g i o n a l T r a f f i c S t u d y
Table 3.1 – Planned and Aggressive Development
Community
Growth Scenario Planned Aggressive Total
Residential (Units)
Commercial (SF)
Residential (Units)
Commercial (SF)
Residential (Units)
Commercial (SF)
Town of Ballston 442 85,000 514 277,000 956 362,000 Town of Clifton Park 334 115,3175 194 928,00 528 1,245,975 Town of Halfmoon 1,313 630,026 787 1,427,850 2,100 2,057,876 Town of Malta 1,939 1,494,600 997 1,780,000 2,936 3,274,600 Town of Milton 523 3,000 - - 523 3,000 Town of Saratoga 109 - 35 - 144 - City of Saratoga Springs 731 309,152 - - 731 309,152 Town of Stillwater 186 8,400 556 - 742 8,400 Town of Wilton 845 71,516 50 - 895 71,516 Total 6,422 3,754,869 3,133 3,577,650 9,555 7,332,519
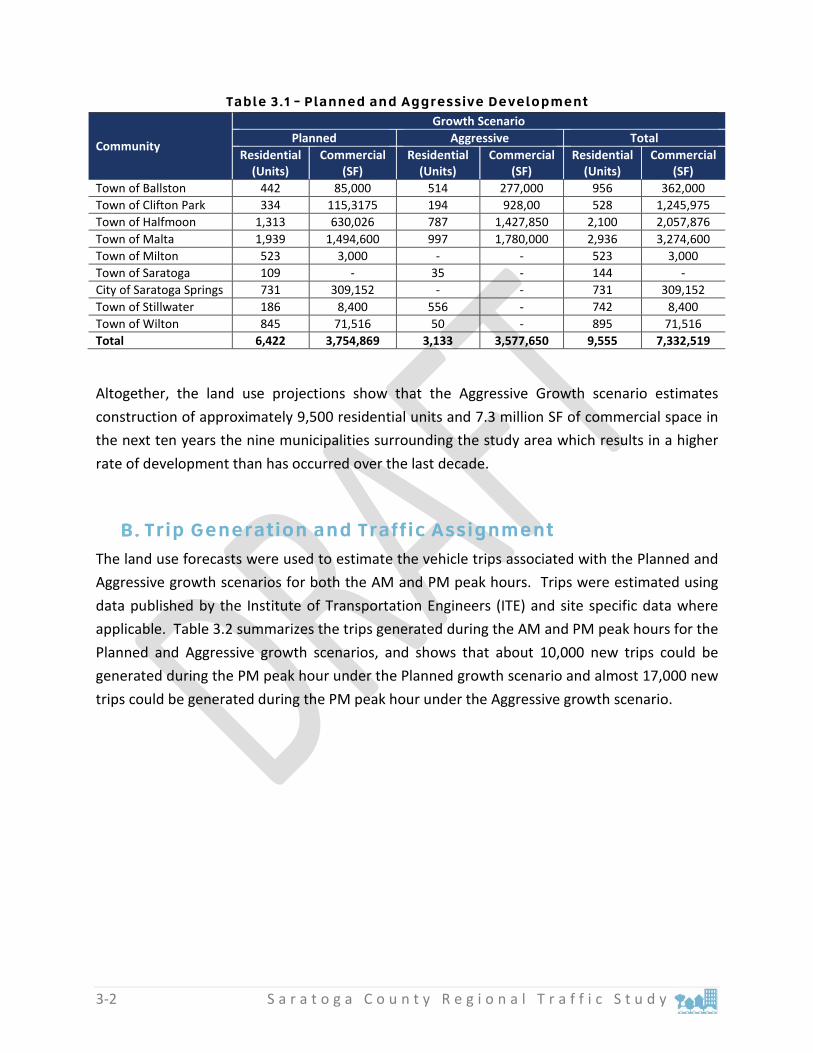
Altogether, the land use projections show that the Aggressive Growth scenario estimates construction of approximately 9,500 residential units and 7.3 million SF of commercial space in the next ten years the nine municipalities surrounding the study area which results in a higher rate of development than has occurred over the last decade.
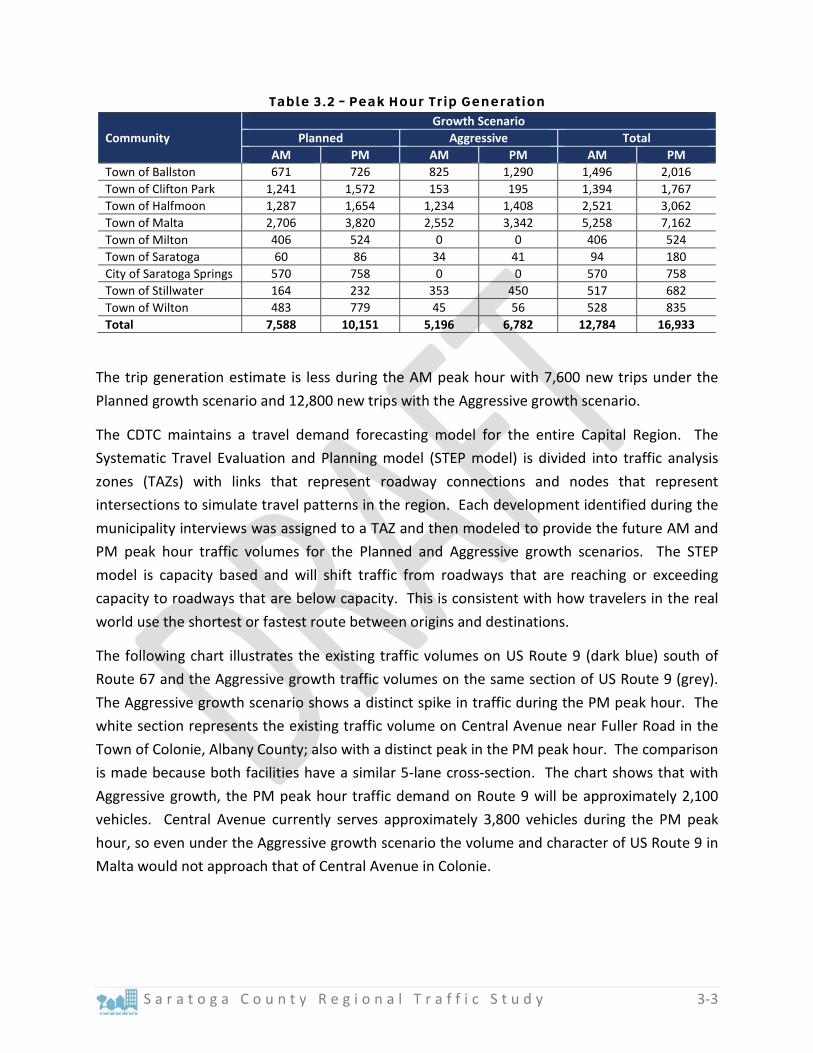
Trip Generation and Traffic Assignment The land use forecasts were used to estimate the vehicle trips associated with the Planned and Aggressive growth scenarios for both the AM and PM peak hours. Trips were estimated using data published by the Institute of Transportation Engineers (ITE) and site specific data where applicable. Table 3.2 summarizes the trips generated during the AM and PM peak hours for the Planned and Aggressive growth scenarios, and shows that about 10,000 new trips could be generated during the PM peak hour under the Planned growth scenario and almost 17,000 new trips could be generated during the PM peak hour under the Aggressive growth scenario.
S a r a t o g a C o u n t y R e g i o n a l T r a f f i c S t u d y 3-3
Table 3.2 – Peak Hour Trip Generation
Community Growth Scenario
Planned Aggressive Total AM PM AM PM AM PM
Town of Ballston 671 726 825 1,290 1,496 2,016 Town of Clifton Park 1,241 1,572 153 195 1,394 1,767 Town of Halfmoon 1,287 1,654 1,234 1,408 2,521 3,062 Town of Malta 2,706 3,820 2,552 3,342 5,258 7,162 Town of Milton 406 524 0 0 406 524 Town of Saratoga 60 86 34 41 94 180 City of Saratoga Springs 570 758 0 0 570 758 Town of Stillwater 164 232 353 450 517 682 Town of Wilton 483 779 45 56 528 835 Total 7,588 10,151 5,196 6,782 12,784 16,933
The trip generation estimate is less during the AM peak hour with 7,600 new trips under the Planned growth scenario and 12,800 new trips with the Aggressive growth scenario.
The CDTC maintains a travel demand forecasting model for the entire Capital Region. The Systematic Travel Evaluation and Planning model (STEP model) is divided into traffic analysis zones (TAZs) with links that represent roadway connections and nodes that represent intersections to simulate travel patterns in the region. Each development identified during the municipality interviews was assigned to a TAZ and then modeled to provide the future AM and PM peak hour traffic volumes for the Planned and Aggressive growth scenarios. The STEP model is capacity based and will shift traffic from roadways that are reaching or exceeding capacity to roadways that are below capacity. This is consistent with how travelers in the real world use the shortest or fastest route between origins and destinations.
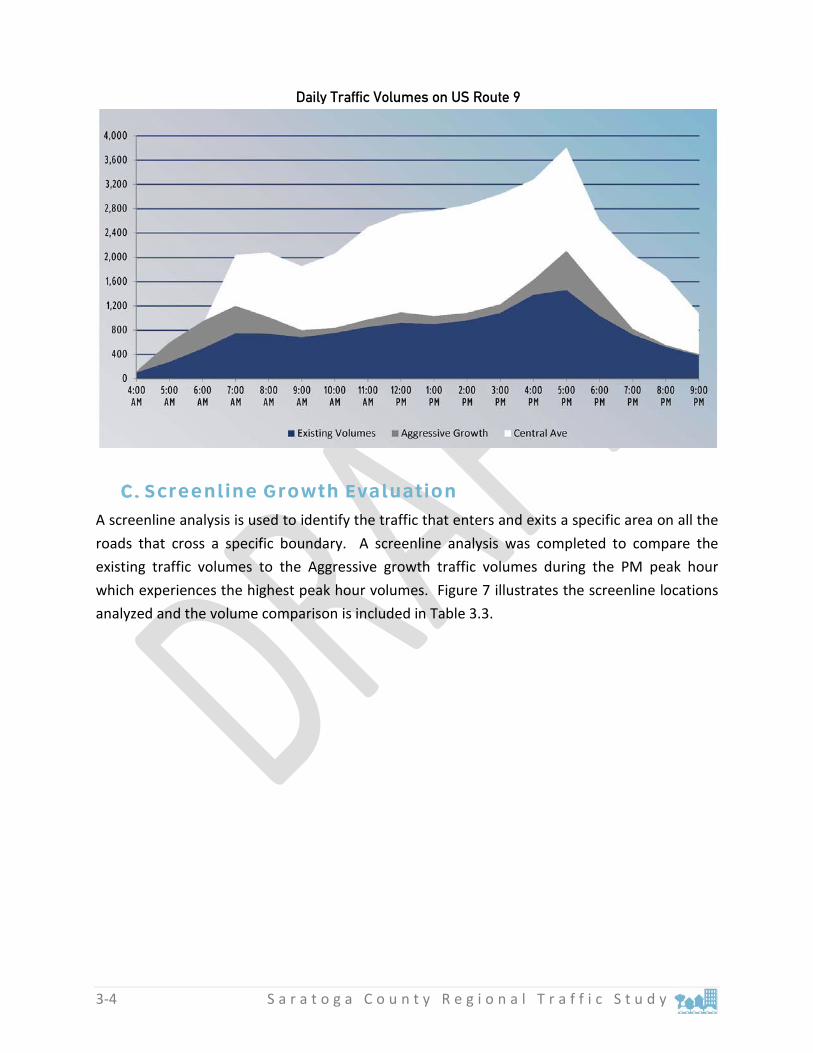
The following chart illustrates the existing traffic volumes on US Route 9 (dark blue) south of Route 67 and the Aggressive growth traffic volumes on the same section of US Route 9 (grey). The Aggressive growth scenario shows a distinct spike in traffic during the PM peak hour. The white section represents the existing traffic volume on Central Avenue near Fuller Road in the Town of Colonie, Albany County; also with a distinct peak in the PM peak hour. The comparison is made because both facilities have a similar 5-lane cross-section. The chart shows that with Aggressive growth, the PM peak hour traffic demand on Route 9 will be approximately 2,100 vehicles. Central Avenue currently serves approximately 3,800 vehicles during the PM peak hour, so even under the Aggressive growth scenario the volume and character of US Route 9 in Malta would not approach that of Central Avenue in Colonie.
3-4 S a r a t o g a C o u n t y R e g i o n a l T r a f f i c S t u d y
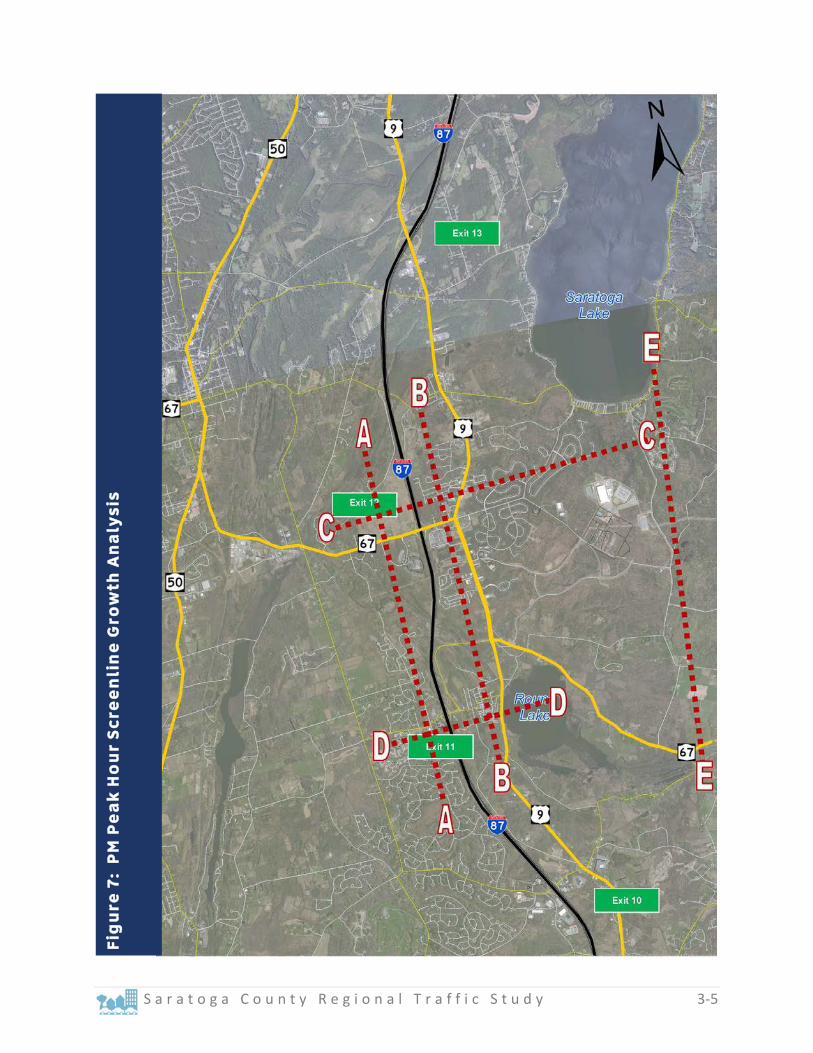
Screenline Growth Evaluation A screenline analysis is used to identify the traffic that enters and exits a specific area on all the roads that cross a specific boundary. A screenline analysis was completed to compare the existing traffic volumes to the Aggressive growth traffic volumes during the PM peak hour which experiences the highest peak hour volumes. Figure 7 illustrates the screenline locations analyzed and the volume comparison is included in Table 3.3.
Daily Traffic Volumes on US Route 9
S a r a t o g a C o u n t y R e g i o n a l T r a f f i c S t u d y 3-5
Fig
ure
7:
PM
Pe
ak
Ho
ur
Scr
ee
nli
ne
Gro
wth
An
aly
sis

3-6 S a r a t o g a C o u n t y R e g i o n a l T r a f f i c S t u d y
As shown in Figure 7, screenlines A and B evaluate the east-west traffic volumes and screenlines C and D evaluate the north-south traffic volumes.
Table 3.3 – PM Peak Hour Screenline Growth Comparison
Screenline
Traffic Volume (PM Peak Hour) Volume Increase Existing Planned Aggressive Existing to
Planned Existing to Aggressive
Total Annual Total Annual A: West of Northway 3,155 3,548 3,732 12% 1.1% 18% 1.7% B: West of US Route 9 2,527 3,054 3,831 21% 1.9% 52% 4.2% C: North of Exit 12 4,027 4,668 5,060 16% 1.5% 26% 2.3% D: South of Exit 11 2,030 2,583 3,008 27% 2.4% 48% 4% E: East of Cold Springs Rd 1247 1672 1802 34% 3% 45% 3.8%
The screenline analysis shows that over the ten year analysis period, the planned growth scenario results in annual average growth rates of approximately 1% to 2.5%. With aggressive growth over the same time period, traffic volumes could grow by approximately 1.5% to 4% per year. The largest growth is expected west of US Route 9 (screenline B), south of Exit 11 (screenline D), and east of Cold Springs Road (screenline E).
Programmed Projects A number of roadway projects are already programmed or under construction in the study area. These intersection modifications are associated with three projects including GLOBALFOUNDARIES Fab 8, the XAR Development, and Round Lake Road corridor modifications. Table 3.4 summarizes the programmed modifications at the eight intersections.

S a r a t o g a C o u n t y R e g i o n a l T r a f f i c S t u d y 3-7
Table 3.4 – Programmed Intersection Modifications Study Intersection (No.) Modification Traffic Impact Study for XAR Development (August 22, 2007) US Rt 9/Ushers Rd (#29) Add southbound right-turn lane
Round Lake Traffic and Mobility Improvement Project PIN 1757.54 (April 2014)
Round Lake Rd/Ruhle Rd/ Raylinsky Rd (#20) Single-lane roundabout
Round Lake Rd/Exit 11 SB Ramp (#21)
Install traffic signal and coordinate with northbound ramp
Traffic Impact Study for Fab 8 Campus (February 27, 2013)
NY Rt 67/Eastline Rd (#11) Construct northbound and southbound left-turn lanes
US Rt 9/NY Rt 67/Round Lake Bypass (#17) Construct eastbound left-turn lane
US Rt 9/Malta Ave (#6) Construct eastbound right-turn lane NY Rt 9P/Lake Rd (#32) Install traffic signal
US Rt 9/NY Rt 67/ Dunning St (#14)
1) Improve deflection and provide two eastbound and westbound through lanes 2) Separate northbound and westbound right-turn lanes OR provide roadway connections on all quadrants
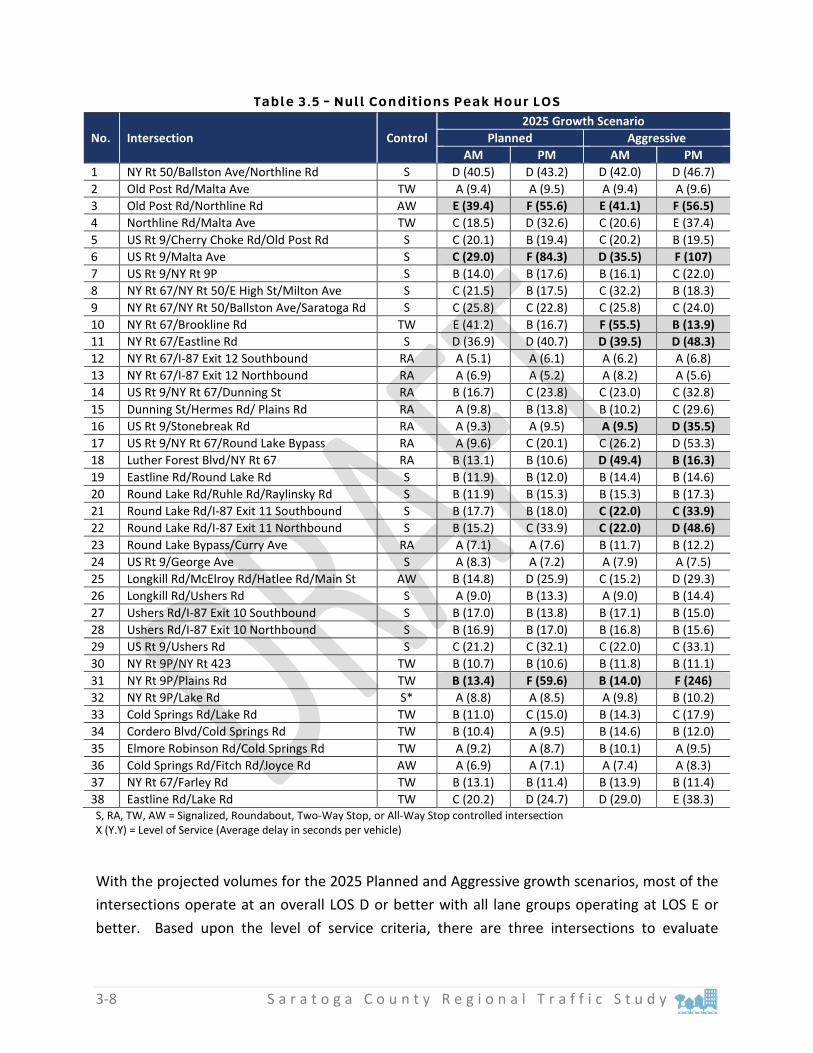
Future Null Conditions Intersection evaluations were completed for all study area intersections for the future Planned and Aggressive growth scenario volumes for the AM and PM peak hours with implementation of the of the programmed intersection modifications. These analyses represent the Null conditions in the study area. Overall levels of service are reported for the traffic signal, roundabout, and all-way stop controlled intersections. The worst-case level of service for the controlled approach at intersections operating under two-way stop control is also reported. Table 3.5 summarizes the level of service results for all 38 intersections.
To determine which intersections to evaluate for mitigation, acceptable intersection operations were identified. Consistent with CDTC guidelines and in agreement with the SAC, intersections operating at overall LOS E/F should be evaluated further. In addition, intersections with approach lanes (lane groups) operating at level of service F should also be investigated for capacity modifications. These criteria are illustrated in the adjacent figure. Intersection operations that fall below the level of service thresholds are identified highlighted in Table 3.5.
3-8 S a r a t o g a C o u n t y R e g i o n a l T r a f f i c S t u d y
Table 3.5 – Null Conditions Peak Hour LOS
No. Intersection Control 2025 Growth Scenario
Planned Aggressive AM PM AM PM
1 NY Rt 50/Ballston Ave/Northline Rd S D (40.5) D (43.2) D (42.0) D (46.7) 2 Old Post Rd/Malta Ave TW A (9.4) A (9.5) A (9.4) A (9.6) 3 Old Post Rd/Northline Rd AW E (39.4) F (55.6) E (41.1) F (56.5) 4 Northline Rd/Malta Ave TW C (18.5) D (32.6) C (20.6) E (37.4) 5 US Rt 9/Cherry Choke Rd/Old Post Rd S C (20.1) B (19.4) C (20.2) B (19.5) 6 US Rt 9/Malta Ave S C (29.0) F (84.3) D (35.5) F (107) 7 US Rt 9/NY Rt 9P S B (14.0) B (17.6) B (16.1) C (22.0) 8 NY Rt 67/NY Rt 50/E High St/Milton Ave S C (21.5) B (17.5) C (32.2) B (18.3) 9 NY Rt 67/NY Rt 50/Ballston Ave/Saratoga Rd S C (25.8) C (22.8) C (25.8) C (24.0) 10 NY Rt 67/Brookline Rd TW E (41.2) B (16.7) F (55.5) B (13.9) 11 NY Rt 67/Eastline Rd S D (36.9) D (40.7) D (39.5) D (48.3) 12 NY Rt 67/I-87 Exit 12 Southbound RA A (5.1) A (6.1) A (6.2) A (6.8) 13 NY Rt 67/I-87 Exit 12 Northbound RA A (6.9) A (5.2) A (8.2) A (5.6) 14 US Rt 9/NY Rt 67/Dunning St RA B (16.7) C (23.8) C (23.0) C (32.8) 15 Dunning St/Hermes Rd/ Plains Rd RA A (9.8) B (13.8) B (10.2) C (29.6) 16 US Rt 9/Stonebreak Rd RA A (9.3) A (9.5) A (9.5) D (35.5) 17 US Rt 9/NY Rt 67/Round Lake Bypass RA A (9.6) C (20.1) C (26.2) D (53.3) 18 Luther Forest Blvd/NY Rt 67 RA B (13.1) B (10.6) D (49.4) B (16.3) 19 Eastline Rd/Round Lake Rd S B (11.9) B (12.0) B (14.4) B (14.6) 20 Round Lake Rd/Ruhle Rd/Raylinsky Rd S B (11.9) B (15.3) B (15.3) B (17.3) 21 Round Lake Rd/I-87 Exit 11 Southbound S B (17.7) B (18.0) C (22.0) C (33.9) 22 Round Lake Rd/I-87 Exit 11 Northbound S B (15.2) C (33.9) C (22.0) D (48.6) 23 Round Lake Bypass/Curry Ave RA A (7.1) A (7.6) B (11.7) B (12.2) 24 US Rt 9/George Ave S A (8.3) A (7.2) A (7.9) A (7.5) 25 Longkill Rd/McElroy Rd/Hatlee Rd/Main St AW B (14.8) D (25.9) C (15.2) D (29.3) 26 Longkill Rd/Ushers Rd S A (9.0) B (13.3) A (9.0) B (14.4) 27 Ushers Rd/I-87 Exit 10 Southbound S B (17.0) B (13.8) B (17.1) B (15.0) 28 Ushers Rd/I-87 Exit 10 Northbound S B (16.9) B (17.0) B (16.8) B (15.6) 29 US Rt 9/Ushers Rd S C (21.2) C (32.1) C (22.0) C (33.1) 30 NY Rt 9P/NY Rt 423 TW B (10.7) B (10.6) B (11.8) B (11.1) 31 NY Rt 9P/Plains Rd TW B (13.4) F (59.6) B (14.0) F (246) 32 NY Rt 9P/Lake Rd S* A (8.8) A (8.5) A (9.8) B (10.2) 33 Cold Springs Rd/Lake Rd TW B (11.0) C (15.0) B (14.3) C (17.9) 34 Cordero Blvd/Cold Springs Rd TW B (10.4) A (9.5) B (14.6) B (12.0) 35 Elmore Robinson Rd/Cold Springs Rd TW A (9.2) A (8.7) B (10.1) A (9.5) 36 Cold Springs Rd/Fitch Rd/Joyce Rd AW A (6.9) A (7.1) A (7.4) A (8.3) 37 NY Rt 67/Farley Rd TW B (13.1) B (11.4) B (13.9) B (11.4) 38 Eastline Rd/Lake Rd TW C (20.2) D (24.7) D (29.0) E (38.3) S, RA, TW, AW = Signalized, Roundabout, Two-Way Stop, or All-Way Stop controlled intersection X (Y.Y) = Level of Service (Average delay in seconds per vehicle)
With the projected volumes for the 2025 Planned and Aggressive growth scenarios, most of the intersections operate at an overall LOS D or better with all lane groups operating at LOS E or better. Based upon the level of service criteria, there are three intersections to evaluate

S a r a t o g a C o u n t y R e g i o n a l T r a f f i c S t u d y 3-9
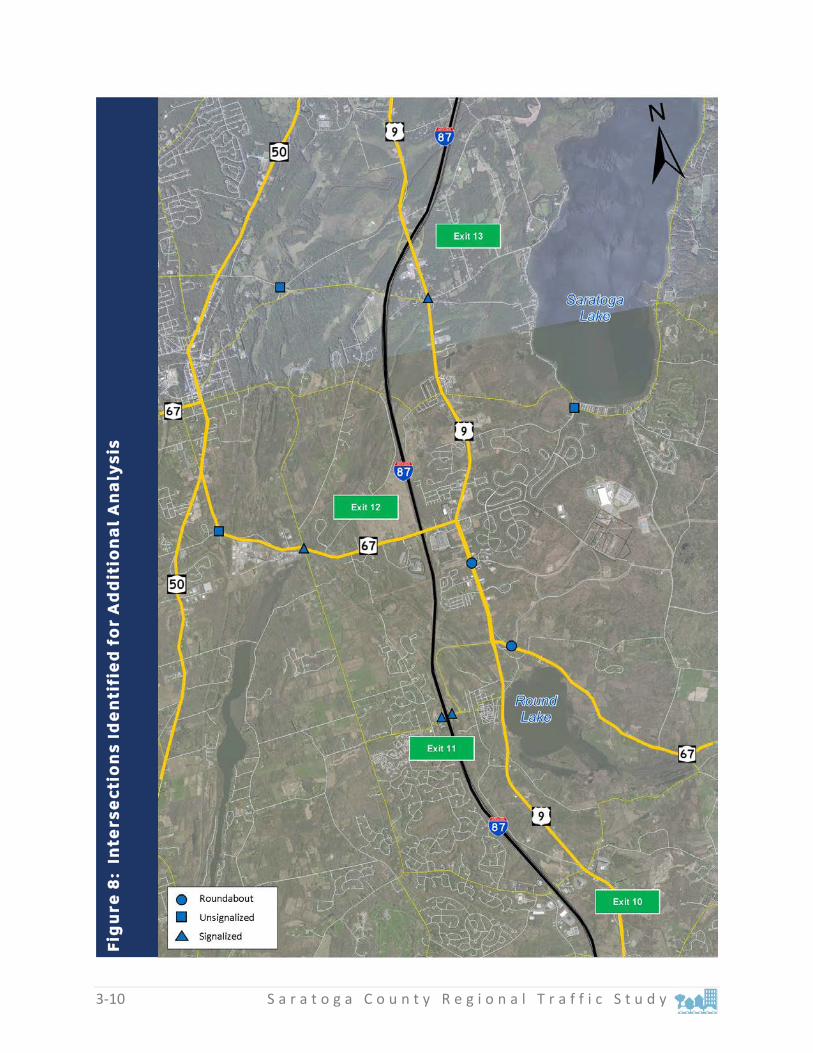
further for mitigation to accommodate the forecast volumes for the 2025 Planned growth scenario and six additional intersections for the 2025 Aggressive growth scenario. The nine intersections identified for further evaluation include:
3 – Old Post Rd/Northline Rd 6 – US Rt 9/Malta Ave 10 – NY Rt 67/Brookline Rd (Aggressive only) 11 – NY Rt 67/Eastline Rd (Aggressive only) 16 – US Rt 9/Stonebreak Rd (Aggressive only) 18 – Luther Forest Blvd/NY Rt 67 (Aggressive only) 21 – Round Lake Rd/I-87 Exit 11 NB ramps (Aggressive only) 22 – Round Lake Rd/I-87 Exit 11 SB ramps (Aggressive only) 31 – NY Rt 9P/Plains Rd
Figure 8 illustrates the intersections identified for further analyses. The additional evaluations are included in Chapter 4.
3-10 S a r a t o g a C o u n t y R e g i o n a l T r a f f i c S t u d y
Fig
ure
8:
Inte
rse
ctio
ns
Ide
nti
fie
d f
or
Ad
dit
ion
al
An
aly
sis
S a r a t o g a C o u n t y R e g i o n a l T r a f f i c S t u d y 4-1
4. Assessment and Mitigation Measures
The objective of this study is “to identify the transportation mitigation measures and implementation steps needed to accommodate growth in Saratoga County specifically centered around the Northway (I-87) Exits 11 and 12”. This chapter summarizes the analyses and mitigation measures that can accommodate the Planned and Aggressive growth scenarios. These mitigation measures include both the built network and planning/policy/decision making opportunities. It is noted that to provide the maximum benefit, the identified mitigation measures have to include the “Four E’s”:
Engineering the appropriate scale roadway network and intersection modifications that meet current design standards and operational concerns.
Educating the walking, bicycling, and driving public to properly use the built environment for maximum safety and health benefit and local decision makers to plan for the preferred future
Enforcing proper implementation of zoning laws and planning documents to create the preferred future and correct use of facilities for greater compliance with traffic laws to maximize safety
Encouraging greater use of multi-modal facilities, transportation options, and planning tools through programs and incentives
The mitigation measures evaluated include construction of Exit 11A, additional roadway connections, intersection and roadway modifications, Travel Demand Management strategies, multi-modal facilities, education, safety considerations and addressing freight concerns.
Roadway Network Network Capacity The study area provides a limited roadway network for regional travel and public comments have reflected concerns about the ability to travel east-west. Primary north-south routes include I-87 and Route 9. East-west routes leading to the Northway include Route 67 (Exit 12) and Round Lake Road and the Round Lake Bypass (Exit 11). Concerns about regional travel options are not uncommon in suburban areas as development and traffic growth, over time, funnel traffic to the few roadways that provide regional mobility and access.
4-2 S a r a t o g a C o u n t y R e g i o n a l T r a f f i c S t u d y
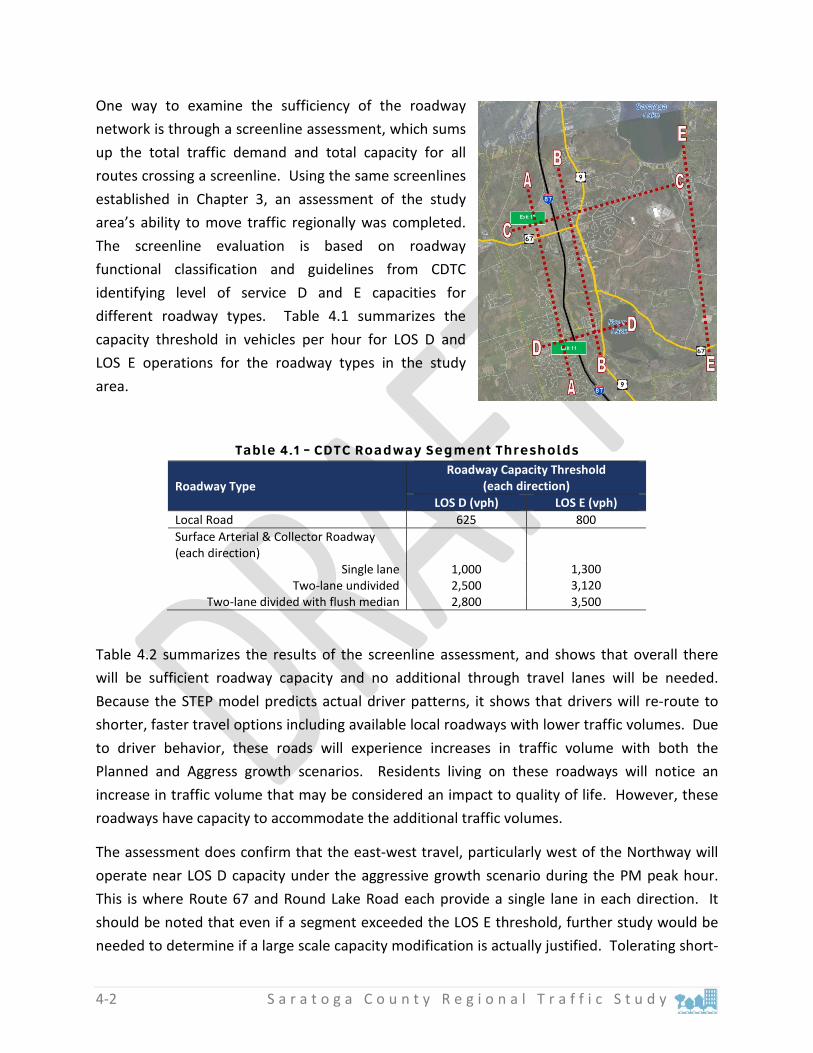
One way to examine the sufficiency of the roadway network is through a screenline assessment, which sums up the total traffic demand and total capacity for all routes crossing a screenline. Using the same screenlines established in Chapter 3, an assessment of the study area’s ability to move traffic regionally was completed. The screenline evaluation is based on roadway functional classification and guidelines from CDTC identifying level of service D and E capacities for different roadway types. Table 4.1 summarizes the capacity threshold in vehicles per hour for LOS D and LOS E operations for the roadway types in the study area.
Table 4.1 – CDTC Roadway Segment Thresholds
Roadway Type Roadway Capacity Threshold
(each direction) LOS D (vph) LOS E (vph)
Local Road 625 800 Surface Arterial & Collector Roadway (each direction)
Single lane 1,000 1,300 Two-lane undivided 2,500 3,120
Two-lane divided with flush median 2,800 3,500
Table 4.2 summarizes the results of the screenline assessment, and shows that overall there will be sufficient roadway capacity and no additional through travel lanes will be needed. Because the STEP model predicts actual driver patterns, it shows that drivers will re-route to shorter, faster travel options including available local roadways with lower traffic volumes. Due to driver behavior, these roads will experience increases in traffic volume with both the Planned and Aggress growth scenarios. Residents living on these roadways will notice an increase in traffic volume that may be considered an impact to quality of life. However, these roadways have capacity to accommodate the additional traffic volumes.
The assessment does confirm that the east-west travel, particularly west of the Northway will operate near LOS D capacity under the aggressive growth scenario during the PM peak hour. This is where Route 67 and Round Lake Road each provide a single lane in each direction. It should be noted that even if a segment exceeded the LOS E threshold, further study would be needed to determine if a large scale capacity modification is actually justified. Tolerating short-
S a r a t o g a C o u n t y R e g i o n a l T r a f f i c S t u d y 4-3
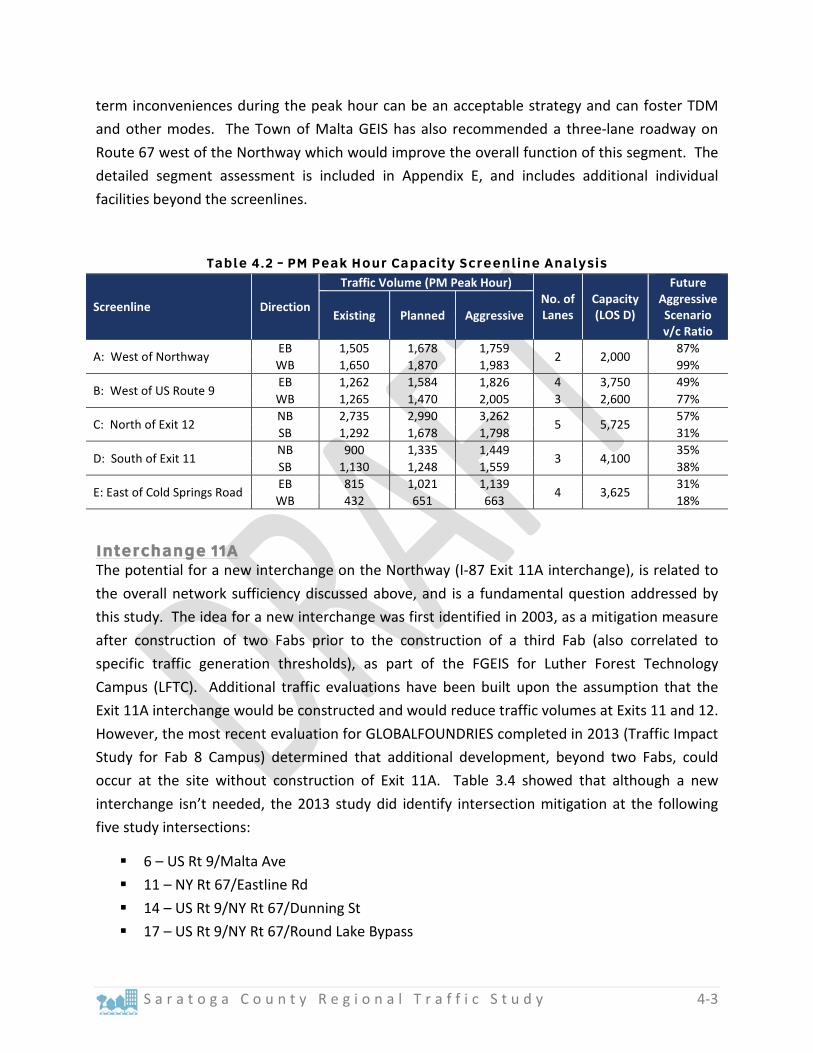
term inconveniences during the peak hour can be an acceptable strategy and can foster TDM and other modes. The Town of Malta GEIS has also recommended a three-lane roadway on Route 67 west of the Northway which would improve the overall function of this segment. The detailed segment assessment is included in Appendix E, and includes additional individual facilities beyond the screenlines.
Table 4.2 – PM Peak Hour Capacity Screenline Analysis
Screenline Direction
Traffic Volume (PM Peak Hour) No. of Lanes
Capacity (LOS D)
Future Aggressive Scenario v/c Ratio
Existing Planned Aggressive
A: West of Northway EB 1,505 1,678 1,759
2 2,000 87%
WB 1,650 1,870 1,983 99%
B: West of US Route 9 EB 1,262 1,584 1,826 4 3,750 49% WB 1,265 1,470 2,005 3 2,600 77%
C: North of Exit 12 NB 2,735 2,990 3,262
5 5,725 57%
SB 1,292 1,678 1,798 31%
D: South of Exit 11 NB 900 1,335 1,449
3 4,100 35%
SB 1,130 1,248 1,559 38%
E: East of Cold Springs Road EB 815 1,021 1,139
4 3,625 31%
WB 432 651 663 18%
Interchange 11A The potential for a new interchange on the Northway (I-87 Exit 11A interchange), is related to the overall network sufficiency discussed above, and is a fundamental question addressed by this study. The idea for a new interchange was first identified in 2003, as a mitigation measure after construction of two Fabs prior to the construction of a third Fab (also correlated to specific traffic generation thresholds), as part of the FGEIS for Luther Forest Technology Campus (LFTC). Additional traffic evaluations have been built upon the assumption that the Exit 11A interchange would be constructed and would reduce traffic volumes at Exits 11 and 12. However, the most recent evaluation for GLOBALFOUNDRIES completed in 2013 (Traffic Impact Study for Fab 8 Campus) determined that additional development, beyond two Fabs, could occur at the site without construction of Exit 11A. Table 3.4 showed that although a new interchange isn’t needed, the 2013 study did identify intersection mitigation at the following five study intersections:
6 – US Rt 9/Malta Ave 11 – NY Rt 67/Eastline Rd 14 – US Rt 9/NY Rt 67/Dunning St 17 – US Rt 9/NY Rt 67/Round Lake Bypass
4-4 S a r a t o g a C o u n t y R e g i o n a l T r a f f i c S t u d y
32 – NY Rt 9P/Lake Rd
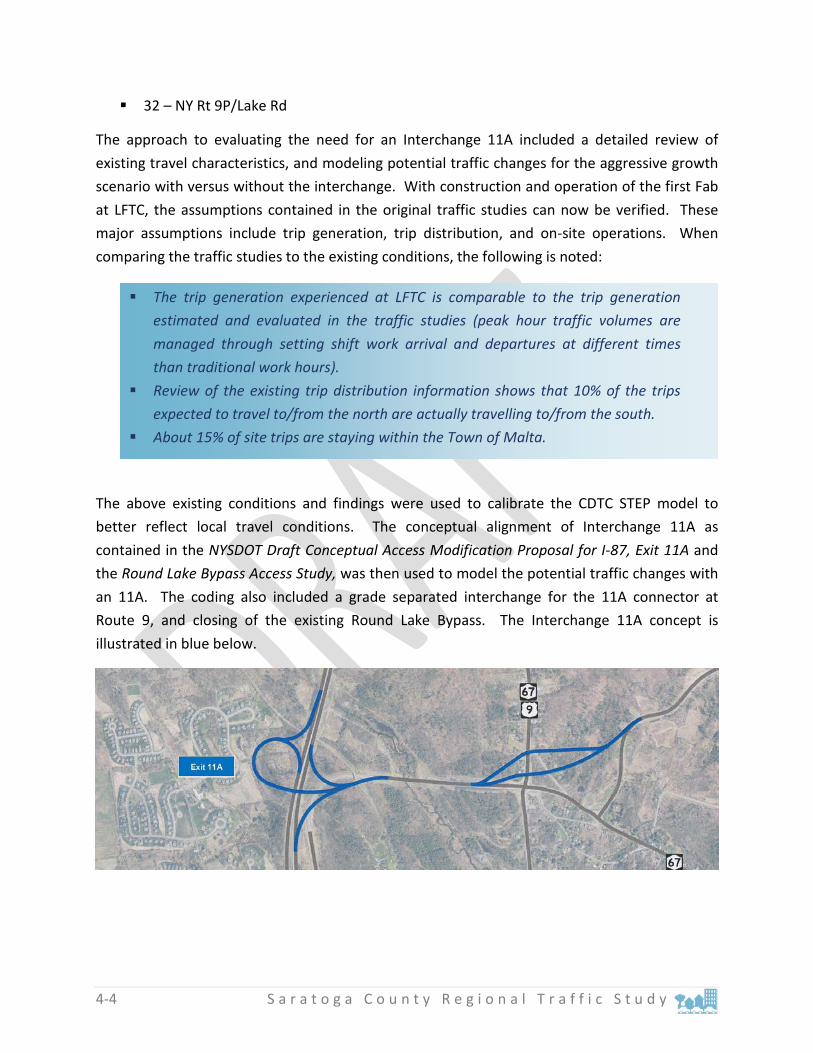
The approach to evaluating the need for an Interchange 11A included a detailed review of existing travel characteristics, and modeling potential traffic changes for the aggressive growth scenario with versus without the interchange. With construction and operation of the first Fab at LFTC, the assumptions contained in the original traffic studies can now be verified. These major assumptions include trip generation, trip distribution, and on-site operations. When comparing the traffic studies to the existing conditions, the following is noted:
The above existing conditions and findings were used to calibrate the CDTC STEP model to better reflect local travel conditions. The conceptual alignment of Interchange 11A as contained in the NYSDOT Draft Conceptual Access Modification Proposal for I-87, Exit 11A and the Round Lake Bypass Access Study, was then used to model the potential traffic changes with an 11A. The coding also included a grade separated interchange for the 11A connector at Route 9, and closing of the existing Round Lake Bypass. The Interchange 11A concept is illustrated in blue below.
The trip generation experienced at LFTC is comparable to the trip generation estimated and evaluated in the traffic studies (peak hour traffic volumes are managed through setting shift work arrival and departures at different times than traditional work hours).
Review of the existing trip distribution information shows that 10% of the trips expected to travel to/from the north are actually travelling to/from the south.
About 15% of site trips are staying within the Town of Malta.

S a r a t o g a C o u n t y R e g i o n a l T r a f f i c S t u d y 4-5
The STEP model analysis showed minor traffic diversions would be expected at most study area intersections. Locations which would see reductions of 100 vph in the PM peak travel period or more are summarized in Table 4.3 below.
Table 4.3 – Interchange 11A Traffic Volume Change
No. Intersection Change in Total Entering Traffic with Exit 11A
14 Rt 67/Rt 9/ Dunning -105 17 Round Lake Bypass/Rt 9 /Route 67 -567 21 Round Lake Road/Exit 11 I-87 SB Ramps -460 22 Round Lake Road/Exit 11 I-87 NB Ramps -711
The model showed that traffic from LFTC heading north would not use Exit 11A. Only modest reductions in traffic would be apparent at the Route 67/Route 9/Dunning Street intersection (minus 105 vph), and major traffic diversions away from existing Exit 11 would occur. Therefore, the evaluations show that construction of Exit 11A will not significantly impact regional traffic volumes to such an extent as to remove the need for mitigation at most study area intersections identified in Chapter 3. The notable exceptions are the Exit 11 northbound and southbound ramps and the Route 67/Luther Forest Blvd intersection which will all experience major peak hour traffic volume reductions with construction of Exit 11A. Table 4.4 below shows the intersections that fall below the acceptable LOS thresholds with and without construction of Exit 11A.
Table 4.4 – Intersections Below LOS E/F Threshold
No. Intersection Below LOS Threshold
With Exit 11A
Without Exit 11A
3 Old Post Rd/Northline Rd 6 US Rt 9/Malta Ave 10 NY Rt 67/Brookline Rd 11 NY Rt 67/Eastline Rd 16 US Rt 9/Stonebreak Rd 18 Luther Forest Blvd/NY Rt 67 21 Round Lake Rd/I-87 Exit 11 Southbound 22 Round Lake Rd/I-87 Exit 11 Northbound 31 NY Rt 9P/Plains Rd
Due to the high costs associated with construction of an interchange ($50 to $75 million for an interchange of this type) and the relatively small benefit, further evaluation and construction of I-87 Interchange Exit 11A is not recommended at this time. Further, it is highly unlikely that the
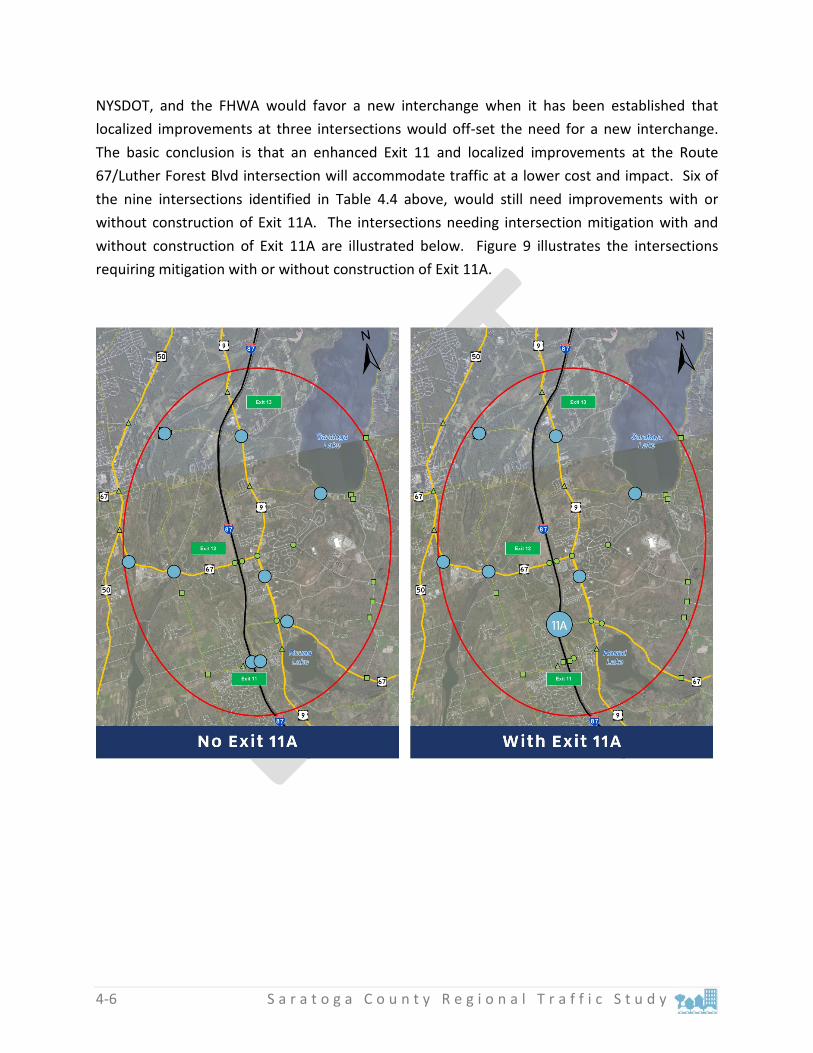
4-6 S a r a t o g a C o u n t y R e g i o n a l T r a f f i c S t u d y
NYSDOT, and the FHWA would favor a new interchange when it has been established that localized improvements at three intersections would off-set the need for a new interchange. The basic conclusion is that an enhanced Exit 11 and localized improvements at the Route 67/Luther Forest Blvd intersection will accommodate traffic at a lower cost and impact. Six of the nine intersections identified in Table 4.4 above, would still need improvements with or without construction of Exit 11A. The intersections needing intersection mitigation with and without construction of Exit 11A are illustrated below. Figure 9 illustrates the intersections requiring mitigation with or without construction of Exit 11A.
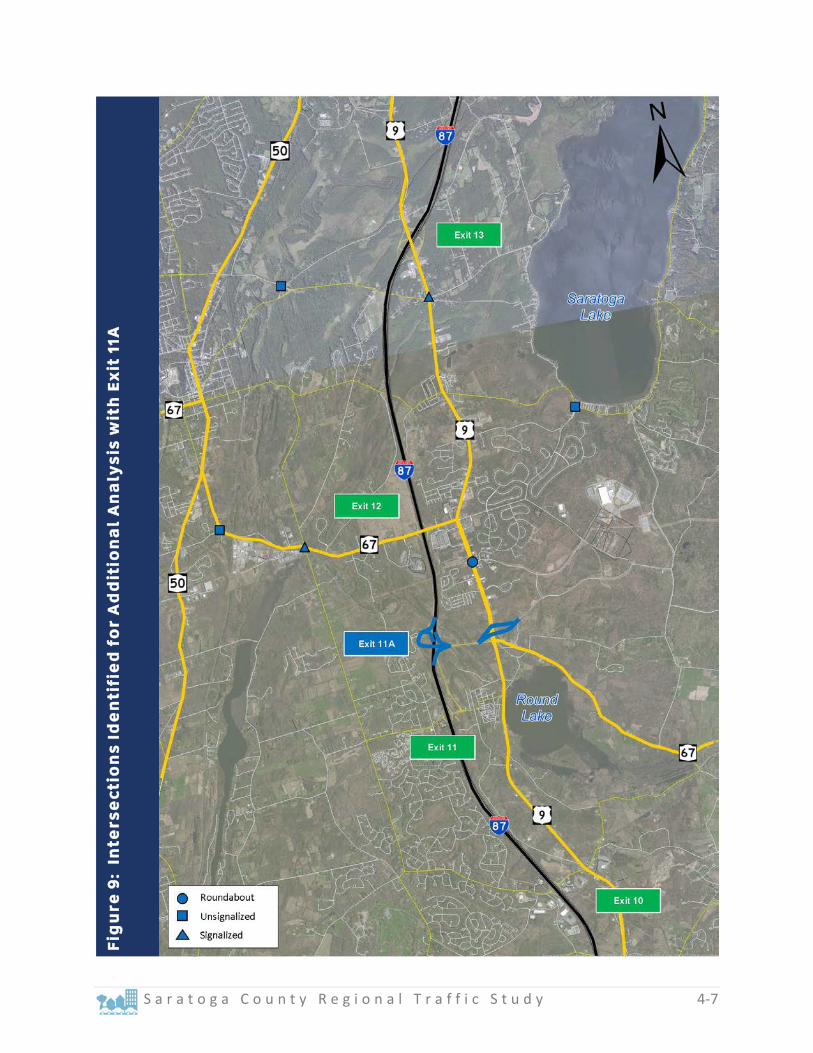
S a r a t o g a C o u n t y R e g i o n a l T r a f f i c S t u d y 4-7
Fig
ure
9:
Inte
rse
ctio
ns
Ide
nti
fie
d f
or
Ad
dit
ion
al
An
aly
sis
wit
h E
xit
11A
4-8 S a r a t o g a C o u n t y R e g i o n a l T r a f f i c S t u d y
Local Connections The previous sections have shown that major regional roadway connections are not needed in the foreseeable future; however, local street and path connections are very important to facilitate community interaction and to preserve the function of the regional arterials for regional traffic movement. For example, the planned local street connections around the Route 9/Route 67/Dunning Street intersection are needed to insure reasonable operation of the Route 9/Route 67/Dunning Street roundabout. Similarly, the local streets and proposed street connection opposite Stonebreak Road are vital to the findings of this study. These types of connections also encourage travel by other modes by accommodating short distance walking and bicycling trips.
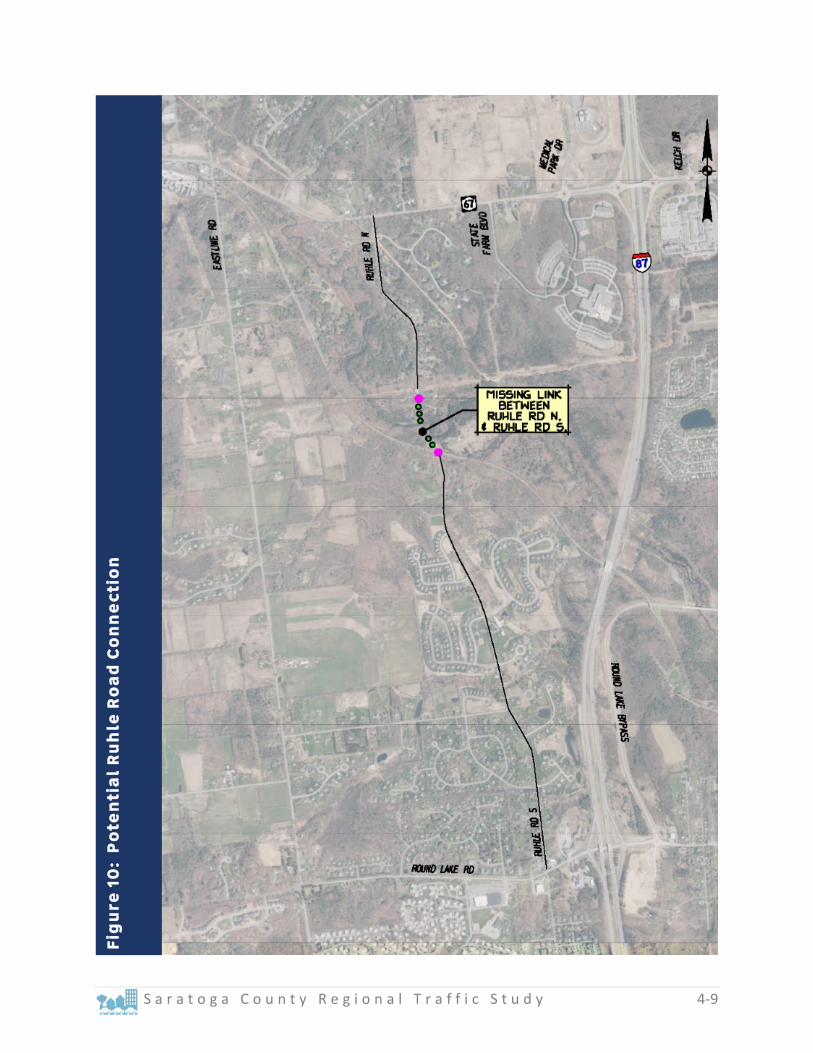
The Town of Malta Comprehensive Plan refers to improving access with new proposed access routes and connections to the existing roadway network. Completion of the missing connection between Ruhle Road South and Ruhle Road North (as illustrated on Figure 10) should be pursued. This would expand neighborhood connectivity on the west side of the Northway. Improving local connections in the Town of Malta ties into goals outlined in the 2005 Malta Master Plan to provide safe, efficient transportation for people within, through, and around the Town.
S a r a t o g a C o u n t y R e g i o n a l T r a f f i c S t u d y 4-9
Fig
ure
10
: P
ote
nti
al
Ru
hle
Ro
ad
Co
nn
ect
ion
4-10 S a r a t o g a C o u n t y R e g i o n a l T r a f f i c S t u d y
Travel Demand Management (TDM) Travel Demand Management addresses intersection and roadway congestion through reduction in demand (fewer passenger vehicles) or redistribution of demand in space or time rather than just increasing capacity (bigger roads and intersections). TDM strategies range from providing multi-modal transportation options to implementing flexible work schedules to land use planning. All of these strategies reduce peak hour passenger vehicle demand. The Victoria Transport Policy Institute (VTPI) publishes the TDM Encyclopedia which is a comprehensive resource on innovative transportation management strategies. The TDM Encyclopedia defines TDM as follows:
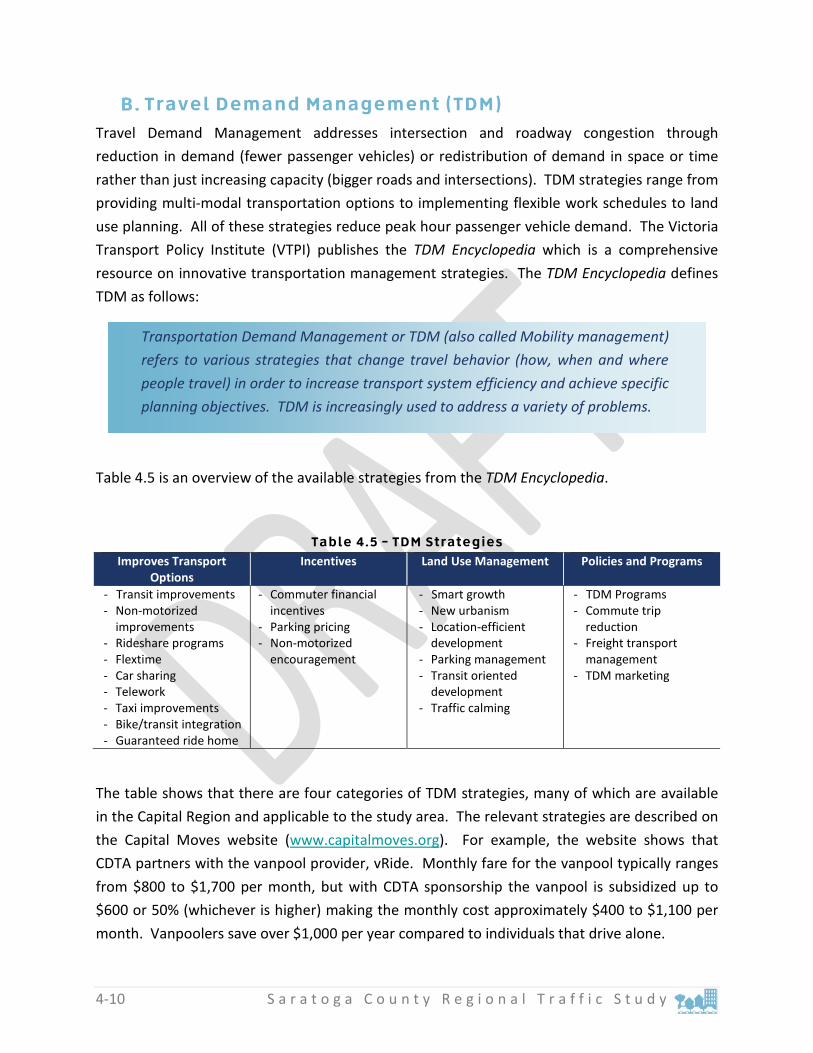
Table 4.5 is an overview of the available strategies from the TDM Encyclopedia.
Table 4.5 – TDM Strategies Improves Transport
Options Incentives Land Use Management Policies and Programs
- Transit improvements - Non-motorized
improvements - Rideshare programs - Flextime - Car sharing - Telework - Taxi improvements - Bike/transit integration - Guaranteed ride home
- Commuter financial incentives
- Parking pricing - Non-motorized
encouragement
- Smart growth - New urbanism - Location-efficient
development - Parking management - Transit oriented
development - Traffic calming
- TDM Programs - Commute trip
reduction - Freight transport
management - TDM marketing
The table shows that there are four categories of TDM strategies, many of which are available in the Capital Region and applicable to the study area. The relevant strategies are described on the Capital Moves website (www.capitalmoves.org). For example, the website shows that CDTA partners with the vanpool provider, vRide. Monthly fare for the vanpool typically ranges from $800 to $1,700 per month, but with CDTA sponsorship the vanpool is subsidized up to $600 or 50% (whichever is higher) making the monthly cost approximately $400 to $1,100 per month. Vanpoolers save over $1,000 per year compared to individuals that drive alone.
Transportation Demand Management or TDM (also called Mobility management) refers to various strategies that change travel behavior (how, when and where people travel) in order to increase transport system efficiency and achieve specific planning objectives. TDM is increasingly used to address a variety of problems.
S a r a t o g a C o u n t y R e g i o n a l T r a f f i c S t u d y 4-11
Passenger vehicle travel is relatively easy and parking is plentiful in the study area; therefore, TDM strategies that involve driver choice and convenience should be incentivized to be effective. In addition, TDM strategies should be easy to use and easy to find for the users and people new to the Capital Region.
Policy Local communities and environmental review boards can play a role in implementing TDM strategies through local planning documents (comprehensive plans), zoning laws, and the State Environmental Quality Review Act (SEQRA) process. These documents frame the way a community is developed including locations for residential, commercial, educational, and recreational land uses and the various connections between land uses. These documents identify areas of preference for higher density development and can also define the system of vehicle, bicycle, and pedestrian connections and the types of accommodations appropriate for each connection. The plans can be written into the municipal zoning laws and policies to ensure that development in the municipality follows the community’s plan. For example, the Town of Malta has implemented a Form-Based Zoning Code addressing building facades, and the scale and types of streets and blocks. Advantages to a form-based code include providing attractive streetscapes and locating and orienting buildings in a way that support walking and bicycling and reducing vehicle trips by mixing land uses and creating greater density.
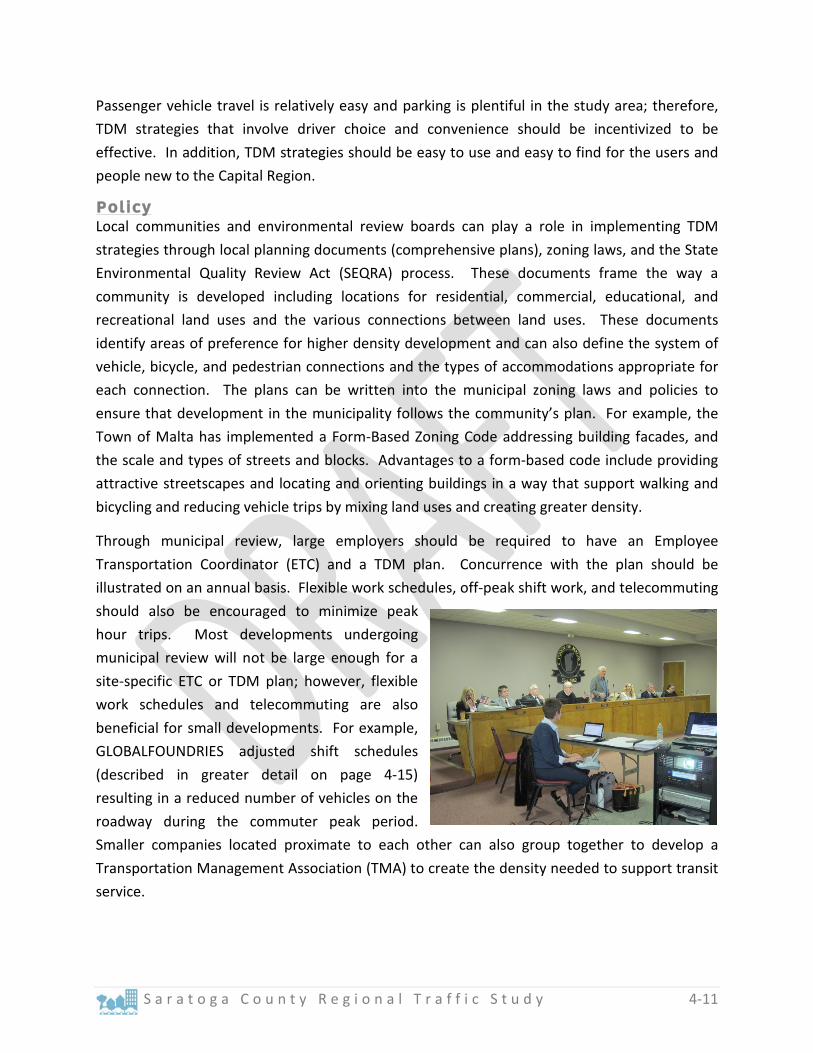
Through municipal review, large employers should be required to have an Employee Transportation Coordinator (ETC) and a TDM plan. Concurrence with the plan should be illustrated on an annual basis. Flexible work schedules, off-peak shift work, and telecommuting should also be encouraged to minimize peak hour trips. Most developments undergoing municipal review will not be large enough for a site-specific ETC or TDM plan; however, flexible work schedules and telecommuting are also beneficial for small developments. For example, GLOBALFOUNDRIES adjusted shift schedules (described in greater detail on page 4-15) resulting in a reduced number of vehicles on the roadway during the commuter peak period. Smaller companies located proximate to each other can also group together to develop a Transportation Management Association (TMA) to create the density needed to support transit service.
4-12 S a r a t o g a C o u n t y R e g i o n a l T r a f f i c S t u d y
Town, planning, and zoning boards should take advantage of training sessions through local planning agencies to learn the best practices for travel demand and land use management. Local chambers of commerce are also good resources to better understand how to market a community to the desired development types.
Transit Transit service reduces travel demand by removing passenger vehicles from the roadway network. It improves overall mobility while providing an essential service for those who do not have access to a car (captured riders), it offers a travel option for others (choice riders), and is an attractive travel option for millennials and people new to the Capital Region. Towns and cities across the U.S. are looking to provide higher quality transit as people are expecting and value better transit options. Transit also has the potential to reduce congestion, reduce parking demand, promote smart growth and contribute to a more balanced and sustainable transportation system.
Several studies of Saratoga County, including the Transit Feasibility Study for Luther Forest Technology Campus Economic Development Corporation dated March 30, 2011, have shown that the population density in Saratoga County is generally not high enough to support transit service. Key challenges are the lower suburban densities that prevail in the area, widely dispersed origins and destinations, and incomes that enable high auto ownership rates, all of which lead to travel by personal automobile. Although large employers like GLOBALFOUNDRIES present an improved opportunity for transit viability by creating a single destination, free and plentiful parking make it a challenge. The 2011 study concluded that robust public transit was not economically feasible and recommended employer incentivized van pools as a reasonable step toward expanded transit. The study also noted Bus Route 409, which had operated on Route 9 was discontinued due to low ridership. Although not necessarily an indication of whether transit to the GLOBALFOUNDRIES Campus would be viable or not, the Route 409 experience was an indication of the challenge of attracting riders and operating a successful service at that time.
Since 2011 area development and employment has been on a steady rise, including growth at LFTC, and the CDTA has continued to explore and implement expanded transit service in the area that is both viable and serves identified needs. A few of those improvements include:
Exploring a new Park and Ride lot near Exit 12 due to high demand in that area.
S a r a t o g a C o u n t y R e g i o n a l T r a f f i c S t u d y 4-13
Currently there is limited parking capacity at the existing Malta Commons Park and Ride location (50 spaces), but there is an estimated need for up to 500 spaces or more in the future if GLOBALFOUNDRIES is to be served. Finding a new expanded Park and Ride option in the area is a priority and would provide the foundation for expanded transit and local shuttles to/from activity centers in the area. A local shuttle providing front door service to/from GLOBALFOUNDRIES would provide an attractive option for employees who may be parking a long distance away in large surface parking lots. CDTA has begun initial discussion with stakeholders in the area for siting the new Park and Ride lot.
CDTA is currently in the planning phase of a route restructuring that involves several bus routes in the Saratoga Springs and Ballston Spa area. Route improvements may facilitate an extension of service to GLOBALFOUNDRIES at some point, although such an extension is not part of the current plan. Public meetings are planned with roll out in 2016.
In addition to these existing efforts, other transit improvements were considered as part of this study, and may be advanced over time.
The Northway Express (NX) is a premium commuter coach service with 11 daily trips to and from downtown Albany. Many of the buses “dead head” in the morning to begin their trip, meaning they travel empty northbound before starting their first trip southbound. The idea of providing service northbound in the morning was considered, particularly to serve work destinations in the Malta/GLOBALFOUNDRIES area. Although this option is not possible as part of the existing NX operations, it could be implemented with some service changes and operating cost increases. The NX buses originate from Albany and many GF employees originate from lower Saratoga County. The current origin of the NX would not likely serve many riders, but as the buses pass through lower Saratoga County, they could attract local riders. Based upon employee data, there may be an opportunity to provide transit service to/from GLOBALFOUNDRIES and the park and ride lots at Exits 8 and 9; Wilton/Saratoga Springs, and Ballston/Milton areas, which requires further study. The proposed expanded Park and Ride lot near Exit 12 would provide a hub for this service.
As a rule, bus passengers begin and end their trip as pedestrians or bicyclists, so improved bicycle/pedestrian connections should be pursued to and from bus stop locations. This is also needed on-site at major employers where bike racks, lockers and improved connections from parking lots help support “get to door” transportation.

4‐14 S a r a t o g a C o u n t y R e g i o n a l T r a f f i c S t u d y
Bicycle and Pedestrian Transportation Bicycle and pedestrian travel is an integral part of fostering healthy and active communities. To promote bicycle and pedestrian travel for purpose‐based trips as well as recreation and exercise, public agencies must provide facilities for safe travel. Like purpose‐based vehicle travel, bicyclists and pedestrians prefer direct connections for purpose‐based trips. Pedestrians and bicyclists also have different needs primarily resulting from trip length. With these differing needs in mind, the CDTC Bike/Pedestrian Advisory Committee (BPAC) modified the Bicycle Pedestrian Priority Network for inclusion in the CDTC New Visions 2040 Plan. The priority network now includes pedestrian districts (areas) and a linear bicycle network.
Historically, sidewalk networks have been difficult to complete with many hurdles to overcome. Publicly funded projects may have difficulty acquiring right‐of‐way and/or funding for a project that can be considered “lower priority”. Private development projects typically have limited roadway frontage and don’t connect logical termini. More recently municipalities have required construction to logical termini or rather than constructing a piece of the network, private developers may have contributed to a sidewalk fund. The result has been a disconnected sidewalk network that is filling in over time. The gaps in the priority networks should be identified and prioritized for completion possibly using sidewalk funds.
Local municipalities and review agencies should continue to focus on creating a fully connected sidewalk network through the SEQRA process one private development project at a time and implementing larger‐scale public projects as funding allows. On roadways located in higher density areas, faster travel speeds, higher traffic volumes, and on roadways connecting pedestrian destinations a sidewalk or shared path is the preferred accommodation.

S a r a t o g a C o u n t y R e g i o n a l T r a f f i c S t u d y 4-15
The only east-west connection in the 1.8 mile segment between Exit 11 and Exit 12 is the Zim Smith trail which primarily serves as an east-west connection towards the southern side near Round Lake Bypass. Another bike/pedestrian connection to the north of this trail, behind State Farm offices, connecting the residential neighborhood on the west of the Northway to the commercial development near Downtown Malta would be beneficial. The need for an additional local east-west street connection is supported by public comments in the Malta Town-wide GEIS dated April 2006 and the public meeting held for this study in November 2014.
Good quality bicycle access can generally be provided through a paved shoulder (minimum 4-feet) and may not require a separate facility. These facilities should be marked with signing and striping to remind drivers of the potential for bicyclists on the roadway. Signing and striping are generally low cost options.
Employers can encourage bicycle and walking trips by providing locker rooms with showers and bike racks. Employers on larger campuses with multiple buildings may want to provide bicycles on-site to allow for internal trips between buildings similar to a municipal bike-share program. Municipalities and government agencies can encourage bicycle and walking trips by ensuring that transportation projects and new developments plan for and include bicycle and pedestrian elements like bike racks, sidewalks, shoulders, crosswalks, trails, appropriately designed catch basins, etc.

4-16 S a r a t o g a C o u n t y R e g i o n a l T r a f f i c S t u d y
TDM in Practice: GLOBALFOUNDRIES As the major employer in the study area, daily operations at GLOBALFOUNDRIES have the potential to significantly affect peak hour travel demand. For example, the existing hourly traffic volume (travel demand) on US Route 9 on the NY Route 67 overlap is shown in blue in the following chart. The future traffic volumes correlating to the Aggressive growth scenario are illustrated in grey. It is important to note that GLOBALFOUNDRIES existing traffic patterns reflect the implementation of significant TDM strategies shifting hundreds of vehicle trips outside the peak travel periods of the adjacent transportation network.
US Route 9 Hourly Traffic Volumes
The chart shows that the existing peak hour traffic volume on US Route 9 (with GLOBALFOUNDRIES using shift work to spread the peak hour) is approximately 1,500 vehicles. With aggressive growth, the peak hour traffic volume spikes to approximately 2,100 vehicles. By again adjusting the start and end times for their shift workers, GLOBALFOUNDRIES can reduce the peak hour traffic demand on US Route 9 and the adjacent roadways. The “shifted schedule” is illustrated by the black line in the above chart which shows that the peak hour traffic demand is reduced by approximately 150 vehicles to a peak hour traffic volume of 1,950 vehicles.
GLOBALFOUNDRIES has agreed to implement the shifted schedule. Implementation of this TDM strategy has been accounted for in the projection of the future peak hour traffic volumes for both the Planned and Aggressive growth scenarios analyzed in Chapter 3. Without implementation of the shifted schedule, there would likely be more intersections requiring additional evaluation.
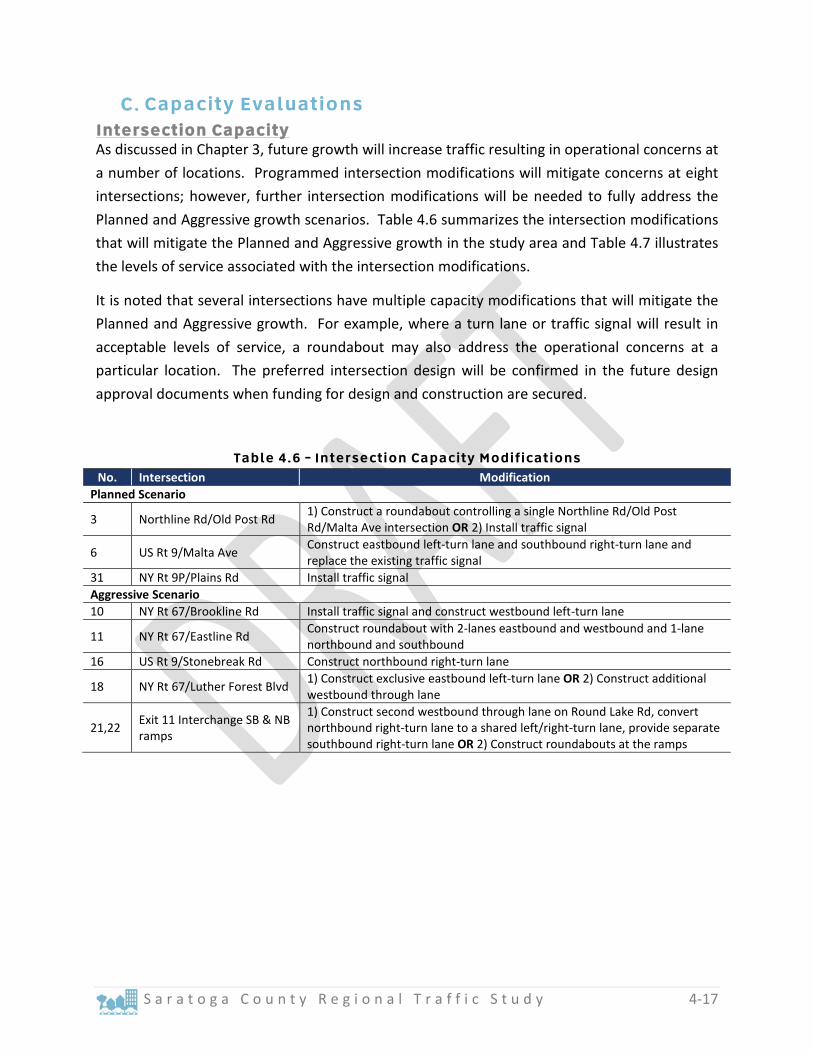
S a r a t o g a C o u n t y R e g i o n a l T r a f f i c S t u d y 4-17
Capacity Evaluations Intersection Capacity As discussed in Chapter 3, future growth will increase traffic resulting in operational concerns at a number of locations. Programmed intersection modifications will mitigate concerns at eight intersections; however, further intersection modifications will be needed to fully address the Planned and Aggressive growth scenarios. Table 4.6 summarizes the intersection modifications that will mitigate the Planned and Aggressive growth in the study area and Table 4.7 illustrates the levels of service associated with the intersection modifications.
It is noted that several intersections have multiple capacity modifications that will mitigate the Planned and Aggressive growth. For example, where a turn lane or traffic signal will result in acceptable levels of service, a roundabout may also address the operational concerns at a particular location. The preferred intersection design will be confirmed in the future design approval documents when funding for design and construction are secured.
Table 4.6 – Intersection Capacity Modifications No. Intersection Modification
Planned Scenario
3 Northline Rd/Old Post Rd 1) Construct a roundabout controlling a single Northline Rd/Old Post Rd/Malta Ave intersection OR 2) Install traffic signal
6 US Rt 9/Malta Ave Construct eastbound left-turn lane and southbound right-turn lane and replace the existing traffic signal
31 NY Rt 9P/Plains Rd Install traffic signal Aggressive Scenario 10 NY Rt 67/Brookline Rd Install traffic signal and construct westbound left-turn lane
11 NY Rt 67/Eastline Rd Construct roundabout with 2-lanes eastbound and westbound and 1-lane northbound and southbound
16 US Rt 9/Stonebreak Rd Construct northbound right-turn lane
18 NY Rt 67/Luther Forest Blvd 1) Construct exclusive eastbound left-turn lane OR 2) Construct additional westbound through lane
21,22 Exit 11 Interchange SB & NB ramps
1) Construct second westbound through lane on Round Lake Rd, convert northbound right-turn lane to a shared left/right-turn lane, provide separate southbound right-turn lane OR 2) Construct roundabouts at the ramps
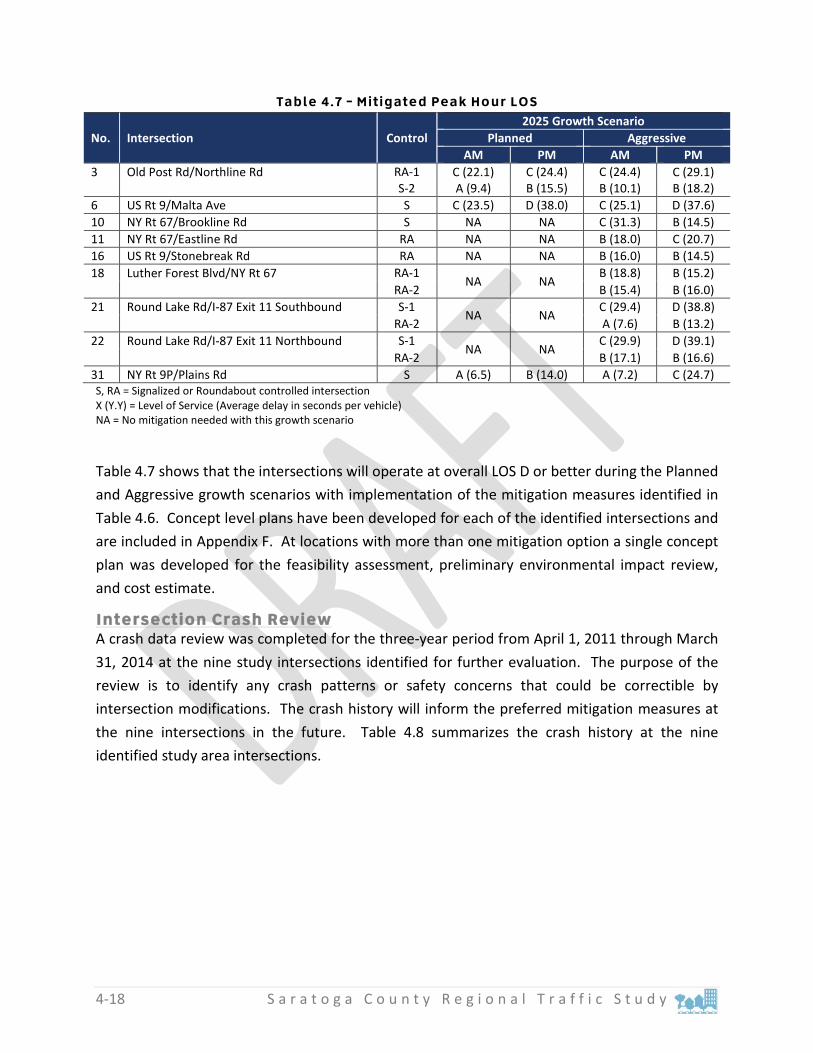
4-18 S a r a t o g a C o u n t y R e g i o n a l T r a f f i c S t u d y
Table 4.7 – Mitigated Peak Hour LOS
No. Intersection Control 2025 Growth Scenario
Planned Aggressive AM PM AM PM
3 Old Post Rd/Northline Rd RA-1 C (22.1) C (24.4) C (24.4) C (29.1) S-2 A (9.4) B (15.5) B (10.1) B (18.2) 6 US Rt 9/Malta Ave S C (23.5) D (38.0) C (25.1) D (37.6) 10 NY Rt 67/Brookline Rd S NA NA C (31.3) B (14.5) 11 NY Rt 67/Eastline Rd RA NA NA B (18.0) C (20.7) 16 US Rt 9/Stonebreak Rd RA NA NA B (16.0) B (14.5) 18 Luther Forest Blvd/NY Rt 67 RA-1
NA NA B (18.8) B (15.2)
RA-2 B (15.4) B (16.0) 21 Round Lake Rd/I-87 Exit 11 Southbound S-1
NA NA C (29.4) D (38.8)
RA-2 A (7.6) B (13.2) 22 Round Lake Rd/I-87 Exit 11 Northbound S-1
NA NA C (29.9) D (39.1)
RA-2 B (17.1) B (16.6) 31 NY Rt 9P/Plains Rd S A (6.5) B (14.0) A (7.2) C (24.7) S, RA = Signalized or Roundabout controlled intersection X (Y.Y) = Level of Service (Average delay in seconds per vehicle) NA = No mitigation needed with this growth scenario
Table 4.7 shows that the intersections will operate at overall LOS D or better during the Planned and Aggressive growth scenarios with implementation of the mitigation measures identified in Table 4.6. Concept level plans have been developed for each of the identified intersections and are included in Appendix F. At locations with more than one mitigation option a single concept plan was developed for the feasibility assessment, preliminary environmental impact review, and cost estimate.
Intersection Crash Review A crash data review was completed for the three-year period from April 1, 2011 through March 31, 2014 at the nine study intersections identified for further evaluation. The purpose of the review is to identify any crash patterns or safety concerns that could be correctible by intersection modifications. The crash history will inform the preferred mitigation measures at the nine intersections in the future. Table 4.8 summarizes the crash history at the nine identified study area intersections.

S a r a t o g a C o u n t y R e g i o n a l T r a f f i c S t u d y 4-19
Table 4.8 – Crash Data Review
No. Intersection Severity Rate
NR PD Injury Fatality Unk Total Calc’d State 3 Old Post Rd/Northline Rd 3 4 2 0 0 9 1.87 0.15 6 US Rt 9/Malta Ave 8 7 5 0 0 20 0.85 0.21 10 NY Rt 67/Brookline Rd 5 8 9 0 0 22 1.41 0.15 11 NY Rt 67/Eastline Rd 8 19 6 0 1 34 1.45 0.45 16 US Rt 9/Stonebreak Rd 6 11 4 0 0 21 1.27 -- 18 Luther Forest Blvd/NY Rt 67 1 4 2 0 0 7 0.54 -- 21 Round Lake Rd/I-87 Exit 11 SB 2 1 1 0 0 4 0.21 0.26 22 Round Lake Rd/I 87 Exit 11 NB 2 2 1 0 0 5 0.30 0.45 31 NY Rt 9P/Plains Rd 8 6 4 0 0 18 1.82 0.15 NR, PD, Unk = Non-Reportable, Property Damage, Unknown Calc’d = Calculated crash rate -- = No comparable statewide rate
Review of the crash rate information shows that the calculated crash rate is higher than the statewide average at five of the nine intersections. It is noted that there is no statewide average rate for roundabout controlled intersections. The following observations are evident from the crash history evaluation:
Old Post Rd/Northline Rd (#3) – The calculated crash rate is higher than the statewide average. Of the nine intersection crashes, three were single-vehicle crashes. Four of the remaining six intersection crashes were right-angle collisions. One of the intersection modifications identified at this location is construction of a roundabout. Right-angle collisions are correctible by construction of a roundabout.
US Route 9/Malta Ave (#6) – The calculated crash rate is higher than the statewide average. Four of the 20 intersection crashes were single-vehicle crashes. The remaining 16 crashes were a mix of rear end, left-turn, right-turn, overtaking, and “other” type collisions. Construction of turn lanes can help to reduce the potential for rear end collisions by removing turning traffic from the through vehicle movement.
NY Route 67/Brookline Rd (#10) – Rear end crashes account for 14 of the 22 collisions at this intersection. Installation of a traffic signal will create an expected stop condition on the currently free-flow NY Route 67 approach to Brookline Road and the construction of a westbound left-turn lane on NY Route 67 will remove turning traffic from the through travel lane. With the expected stop condition associated with installation of a traffic signal and the removal of left-turn traffic from the through lane, the number of rear end collisions should be reduced. These improvements are consistent with previous recommendations at this location.
NY Route 67/Eastline Rd (#11) – Of the 34 total crashes at the intersection two were single-vehicle collisions. The remaining crash types include 16 rear end, 8 other, 3
4-20 S a r a t o g a C o u n t y R e g i o n a l T r a f f i c S t u d y
unknown, 3 left-turn, 2 sideswipe, 1 right-angle, and 1 head on. Roundabouts are identified by the FHWA as a proven safety countermeasure and construction of a roundabout at this intersection will result in a reduction of crash severity at this location. It is noted that construction of a roundabout at this location is consistent with previous studies.
US Route 9/Stonebreak Rd (#16) – The roundabout at this location was opened to traffic on November 1, 2011; since that time there were 19 crashes of which nine were single-vehicle collisions. The remaining crash types are a mix of right-angle, overtaking, left-turn, and rear end collisions.
NY Route 67/Luther Forest Blvd (#18) – The data shows that the seven crashes at this intersection are all single-vehicle collisions with curbing, sign posts, or guide rail. These types of collisions indicate that the drivers were travelling too fast through the roundabout.
Round Lake Rd/I-87 Exit 11 (#21, #22) – Review of the crash data at the Round Lake Road/I-87 Exit 11 interchange showed that there was one collision with a bicyclist. The data shows that the bicyclist was crossing a roadway mid-block at the time of the crash. The provision of enhanced pedestrian features in this area as part of the Round Lake Traffic and Mobility Improvement Project PIN 1757.54 will reduce the potential for this type of collision. The other eight crashes include a mix of rear end, overtaking, right-angle, and left-turn collisions.
NY Route 9P/Plains Rd (#31) – Ten of the 18 intersection collisions were single vehicle crashes that occurred during inclement weather (snow, sleet, hail, freezing rain, etc.). The remaining eight crashes include a mix of right-angle, rear end, and “other” type collisions.
Environmental Screening An environmental screening for each of the capacity modifications identified in Table 4.6 was completed. The screening can be used to determine possible impacts associated with the potential intersection modifications and can help guide the documentation process needed for each of the modifications when they are implemented. Table 4.9 summarizes the possible environmental impacts associated with the potential intersection modifications. The detailed environmental screening is included in Appendix G.

S a r a t o g a C o u n t y R e g i o n a l T r a f f i c S t u d y 4-21
Table 4.9 – Potential Environmental Impacts
No. Intersection Mitigation Under Consideration
Fede
ral W
etla
nds/
W
ater
shed
Stat
e W
etla
nds &
10
0 ft
buf
fer
Floo
d Zo
ne
Thre
aten
ed/
Enda
nger
ed S
peci
es
Arch
eolo
gica
l
Righ
t-of
-Way
Qua
lity
of L
ife
3 Old Post Rd/Northline Rd Yes Yes No NLEB No Yes No 6 US Rt 9/Malta Ave No No No NLEB No Yes Yes 10 NY Rt 67/Brookline Rd No No No NLEB No Yes Yes 11 NY Rt 67/Eastline Rd Yes No No NLEB Yes Yes No 16 US Rt 9/Stonebreak Rd No No No NLEB No Yes No 18 Luther Forest Blvd/NY Rt 67 Yes No No NLEB No Yes No 21 Round Lake Rd/I-87 Exit 11 SB No No No NLEB No No No 22 Round Lake Rd/I-87 Exit 11 NB No No No NLEB No No No 31 NY Rt 9P/Plains Rd No No No NLEB No No Yes NLEB – Northern Long-Eared Bat
As the potential mitigation measures are converted to projects, detailed design and environmental evaluations will be completed. When these projects are developed, the preferred intersection modification will be determined. While all projects will require detailed design and environmental analysis, publicly and privately funded projects will go through a slightly different public process; however, whether public or private, the intersection capacity modification will be required to avoid, minimize or when impacts are unavoidable may be required to mitigate environmental impacts and create safe operations. This process includes coordination with emergency responders and general public input. Overall, this preliminary assessment shows a low probability of any significant adverse impacts.
In regard to air quality, New York State collects air quality data for numerous pollutants at monitoring stations in each county through a program operated by the Bureau of Air Quality Surveillance. The Federal Environmental Protection Agency (EPA) determines which air quality pollutants should be monitored at different locations based upon the characteristics of a region. There is one monitoring station in Saratoga County located at Saratoga National Historical Park in Stillwater that monitors ozone. Based on the latest three years of available data, this station is in compliance with the New York State and National Ambient Air Quality Standards for ozone.
The NYSDOT evaluates air quality impacts through procedures set forth in The Environmental Manual (TEM). Typical “worst-case” concentrations of air quality emissions are associated with idling vehicles at an intersection; therefore, air quality impact analyses are primarily focused on signalized intersections. A review of the analysis screening criteria contained in the TEM
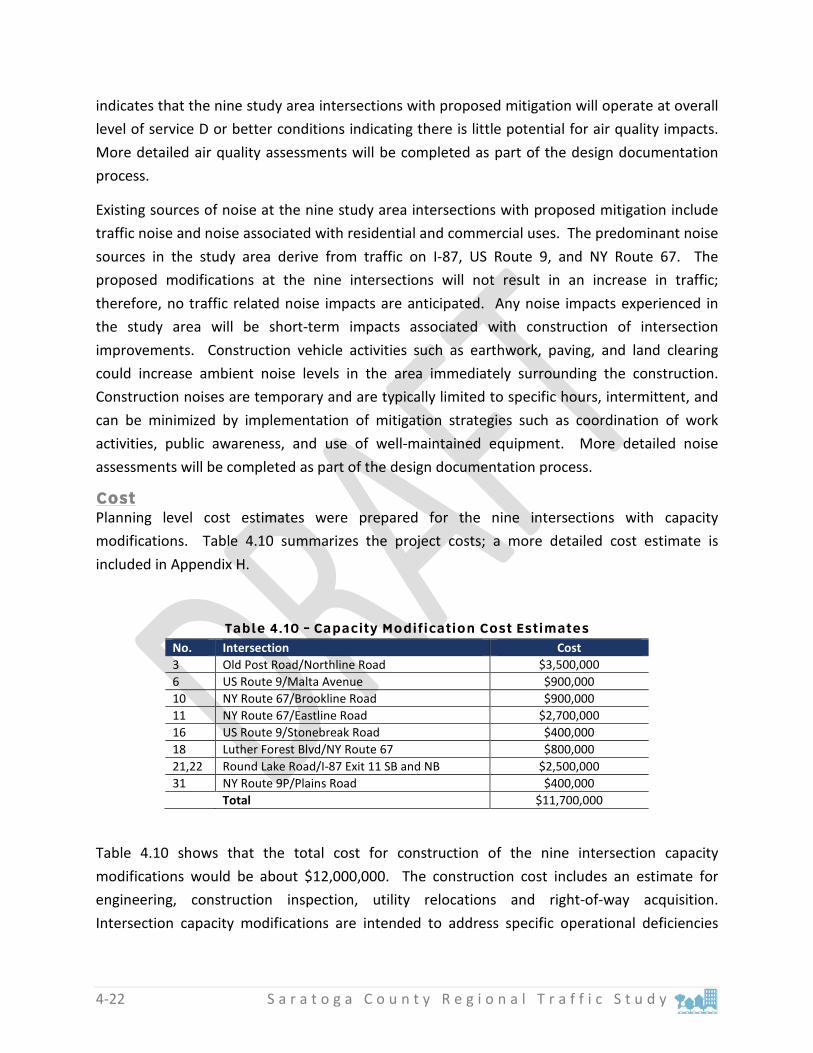
4-22 S a r a t o g a C o u n t y R e g i o n a l T r a f f i c S t u d y
indicates that the nine study area intersections with proposed mitigation will operate at overall level of service D or better conditions indicating there is little potential for air quality impacts. More detailed air quality assessments will be completed as part of the design documentation process.
Existing sources of noise at the nine study area intersections with proposed mitigation include traffic noise and noise associated with residential and commercial uses. The predominant noise sources in the study area derive from traffic on I-87, US Route 9, and NY Route 67. The proposed modifications at the nine intersections will not result in an increase in traffic; therefore, no traffic related noise impacts are anticipated. Any noise impacts experienced in the study area will be short-term impacts associated with construction of intersection improvements. Construction vehicle activities such as earthwork, paving, and land clearing could increase ambient noise levels in the area immediately surrounding the construction. Construction noises are temporary and are typically limited to specific hours, intermittent, and can be minimized by implementation of mitigation strategies such as coordination of work activities, public awareness, and use of well-maintained equipment. More detailed noise assessments will be completed as part of the design documentation process.
Cost Planning level cost estimates were prepared for the nine intersections with capacity modifications. Table 4.10 summarizes the project costs; a more detailed cost estimate is included in Appendix H.
Table 4.10 – Capacity Modification Cost Estimates No. Intersection Cost 3 Old Post Road/Northline Road $3,500,000 6 US Route 9/Malta Avenue $900,000 10 NY Route 67/Brookline Road $900,000 11 NY Route 67/Eastline Road $2,700,000 16 US Route 9/Stonebreak Road $400,000 18 Luther Forest Blvd/NY Route 67 $800,000 21,22 Round Lake Road/I-87 Exit 11 SB and NB $2,500,000 31 NY Route 9P/Plains Road $400,000 Total $11,700,000
Table 4.10 shows that the total cost for construction of the nine intersection capacity modifications would be about $12,000,000. The construction cost includes an estimate for engineering, construction inspection, utility relocations and right-of-way acquisition. Intersection capacity modifications are intended to address specific operational deficiencies

S a r a t o g a C o u n t y R e g i o n a l T r a f f i c S t u d y 4-23
and are relatively high cost. To the extent that capacity modifications can be avoided through implementation of TDM measures, they should.
Safety and Education Several comments raised during the SAC meetings, interviews with Stakeholder, and during the public meeting were directly related to safety. Specifically pedestrian and bicyclist safety at roundabouts, general pedestrian and bicycle accessibility and Americans with Disabilities Act (ADA) compliance, and overall safety concerns related to increases in traffic volumes. This section discusses safety considerations relative to transportation to address the concerns heard from the interested participants.
Roundabouts The SRTS study area is relatively unique in that eight of the study area intersections operate under roundabout control. There is a perception by some of the public that roundabouts are unsafe for pedestrians and bicyclists because vehicles operate under yield control rather being stopped at a traffic signal. Several studies have been completed to determine whether this perception is true or false.
A British study noted that there are 0.33 pedestrian crashes/million trips at roundabouts and 0.67 pedestrian crashes/million trips at traffic signals.
A Dutch study evaluated 181 intersections that were converted to roundabout control that saw a 73% reduction in all crashes and an 89% reduction in injury crashes.
The Insurance Institute of Highway Safety found a 75% reduction in pedestrian crashes at roundabout controlled intersections.
A study of two roundabout controlled intersections in Washington state found that the rates of property damage crashes rose with construction of the two-lane roundabouts and that the increase in property damage collisions could be attributed to driver confusion.
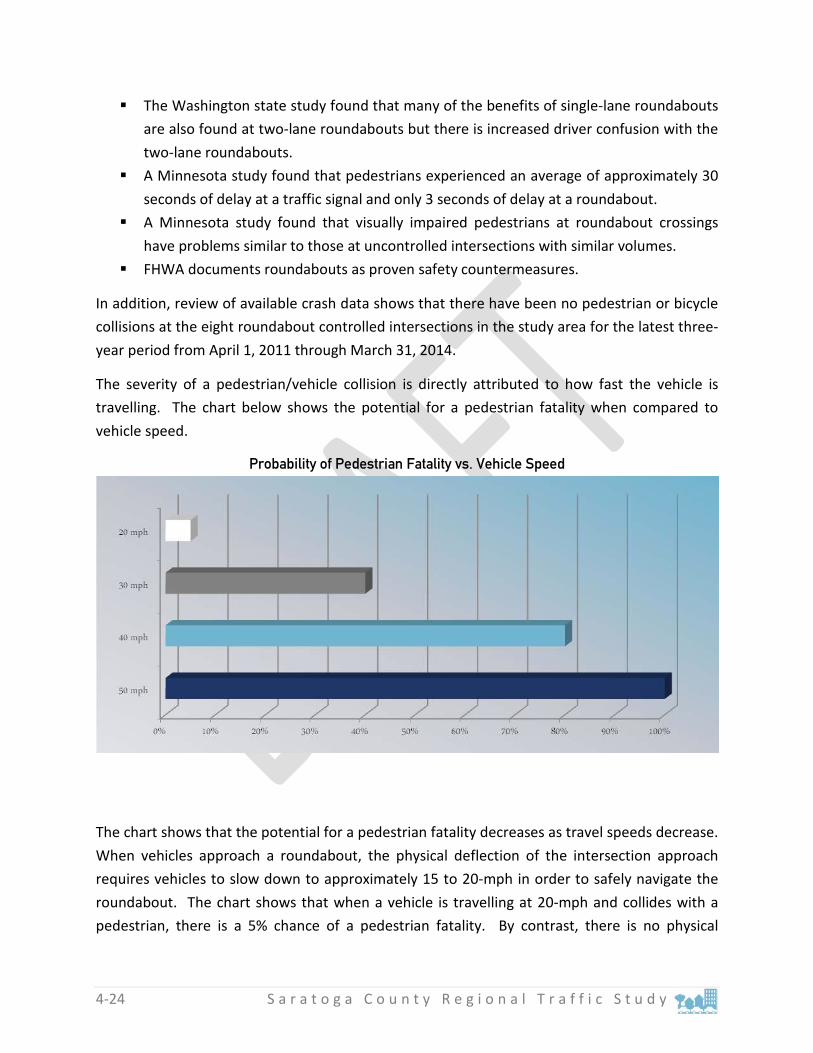
4-24 S a r a t o g a C o u n t y R e g i o n a l T r a f f i c S t u d y
The Washington state study found that many of the benefits of single-lane roundabouts are also found at two-lane roundabouts but there is increased driver confusion with the two-lane roundabouts.
A Minnesota study found that pedestrians experienced an average of approximately 30 seconds of delay at a traffic signal and only 3 seconds of delay at a roundabout.
A Minnesota study found that visually impaired pedestrians at roundabout crossings have problems similar to those at uncontrolled intersections with similar volumes.
FHWA documents roundabouts as proven safety countermeasures.
In addition, review of available crash data shows that there have been no pedestrian or bicycle collisions at the eight roundabout controlled intersections in the study area for the latest three-year period from April 1, 2011 through March 31, 2014.
The severity of a pedestrian/vehicle collision is directly attributed to how fast the vehicle is travelling. The chart below shows the potential for a pedestrian fatality when compared to vehicle speed.
Probability of Pedestrian Fatality vs. Vehicle Speed
The chart shows that the potential for a pedestrian fatality decreases as travel speeds decrease. When vehicles approach a roundabout, the physical deflection of the intersection approach requires vehicles to slow down to approximately 15 to 20-mph in order to safely navigate the roundabout. The chart shows that when a vehicle is travelling at 20-mph and collides with a pedestrian, there is a 5% chance of a pedestrian fatality. By contrast, there is no physical

S a r a t o g a C o u n t y R e g i o n a l T r a f f i c S t u d y 4-25
intersection modification causing a vehicle approaching a traffic signal to slow down to safely navigate the intersection.
A number of other factors contribute to the increased safety for roundabout controlled intersections including a reduced number of conflict and decision points, only have to worry about vehicles approaching from one direction, the location of the crossing approximately one-car length away from the circulating vehicles, and the shorter length of the exposed crossing distance. These factors are illustrated in the following images showing pedestrian crossings at typical traffic signal and roundabout controlled intersections.
There are ways to further enhance the safety benefits of roundabouts for pedestrians and bicyclists including:
Clarifying roundabout signing and striping can minimize confusion for drivers and reduce crashes caused by confused drivers
Installing pedestrian hybrid beacons at roundabout approaches
Installing raised crosswalks to further reduce vehicle travel speeds

4-26 S a r a t o g a C o u n t y R e g i o n a l T r a f f i c S t u d y
Installing rectangular rapid flash beacons at pedestrian crossings Installing roadway crosswalk lighting to illuminate the crosswalk when a pedestrian is
entering the roundabout Educating drivers, pedestrians, and bicyclists as to the proper way to navigate a
roundabout. The FHWA Office of Safety, the NYSDOT, and other agencies including the American Association of Retired Persons (AARP) provide educational materials that teach drivers, pedestrians, and bicyclists how to navigate one-lane and two-lane roundabouts.
Pedestrians and Bicyclists Review of the study area accident data shows that there have been three pedestrian and two bicycle crashes in the study area from April 1, 2011 through March 31, 2014. Table 4.11 summarizes the pedestrian and bicycle crashes during the data period.
Table 4.11 – Pedestrian/Bicycle Crash Summary
Crash Location At intersection or Along highway?
Pedestrian/Cyclist Action
Pedestrians Round Lake Rd near Hearthwood Dr Along highway With traffic Route 9/Kendall Way At intersection Crossing – no signal, marked crosswalk Route 9 near Kendall Way At intersection Crossing – no signal or crosswalk Bicyclists Round Lake Rd/Curry Ave near ramp At intersection Crossing – no signal or crosswalk Route 67 near Raymond Rd Along highway With traffic
The table shows that there were three pedestrian crashes in the study area. Two occurred near the Route 9/Kendall Way intersection and one was on Round Lake Road near Hearthwood Drive. Of the two bicyclist crashes, one occurred on Round Lake Road and the second occurred on Route 67. Three of the five crashes occurred when the pedestrian or bicyclist was crossing the roadway and the other two when the pedestrian or bicyclist was travelling along the highway.
The National Highway Institute (NHI) is the education and training branch of the Federal Highway Administration (FHWA) and provides educational resources for transportation-related training. One of the many university courses provided by the NHI is Bicycle and Pedestrian Transportation with an entire chapter devoted to education, encouragement, and enforcement. Education campaigns must focus on all users. The FHWA Bicycle and Pedestrian Transportation course notes that the following must be included in a good education program:

S a r a t o g a C o u n t y R e g i o n a l T r a f f i c S t u d y 4-27
Teach important bicycling and walking skills to youngsters. Teach important bicycling and walking skills to adults. Include bike and pedestrian information in driver training.
There are numerous free, online resources available for municipalities, schools, clubs, and other organized groups or individuals to learn how to create and promote a safe transportation system for all users. The FHWA Office of Safety website (www.safety.fhwa.dot.gov) provides resources and links for all transportation modes and the entire transportation system. In addition to the online resources, local government agencies, coalitions, schools, and law enforcement agencies provide hands on education to promote safe travel.
An education campaign was launched by the NYSDOT in September 2014 to highlight pedestrian awareness and safety in response to a number of pedestrian fatalities in the NY Route 5 corridor in Schenectady and Albany counties and the NY Route 7 corridor in Troy. The “See! Be Seen!” campaign provides a message for both driver and pedestrian awareness. This message is advertised on CDTA buses, in brochures, on posters and in other materials being distributed at schools, senior centers, local businesses, and other locations.
The “See!” aspect of this campaign encourages drivers to:
Always look for pedestrians, particularly when turning at a green lighting or making a right turn on red
Take extra care around schools, playgrounds, and in neighborhoods Slow down and obey speed limits Stop for pedestrians at crosswalks and intersections Not block crosswalks when stopped at an intersection Not run red lights
The “Be Seen!” aspect of this campaign encourages pedestrians to:
Cross at intersections and marked crosswalks Use pedestrian push-buttons where available and wait for the signal to cross
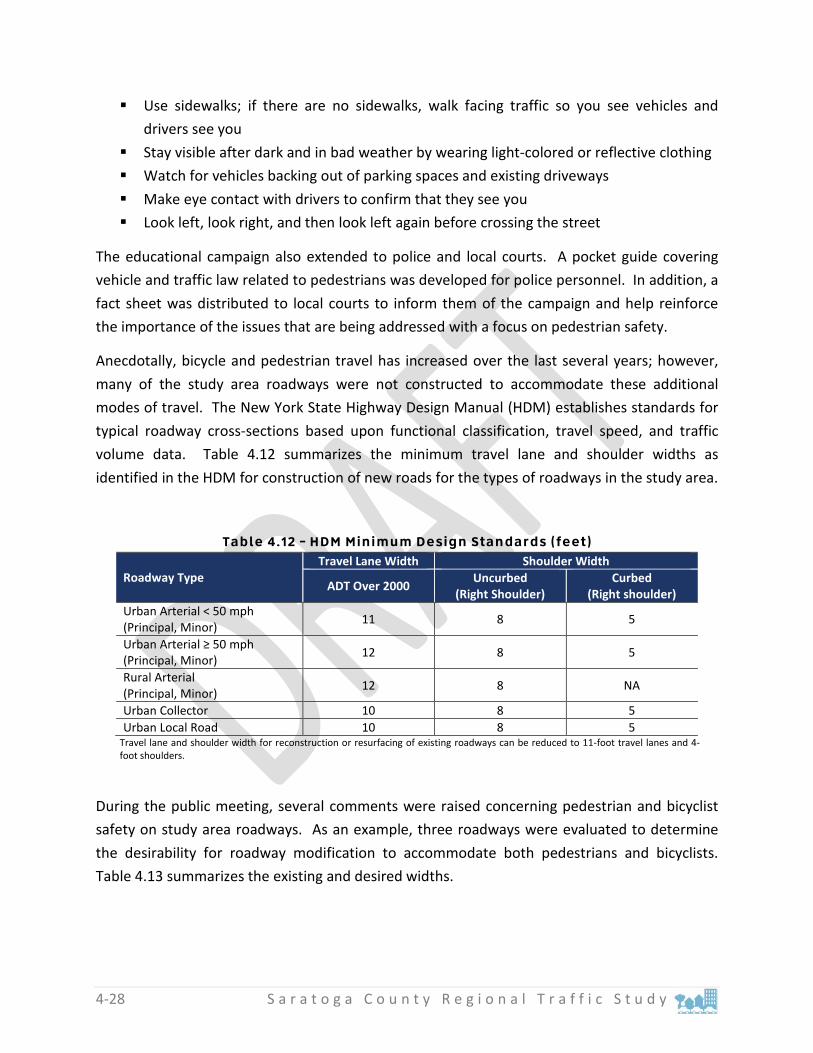
4-28 S a r a t o g a C o u n t y R e g i o n a l T r a f f i c S t u d y
Use sidewalks; if there are no sidewalks, walk facing traffic so you see vehicles and drivers see you
Stay visible after dark and in bad weather by wearing light-colored or reflective clothing Watch for vehicles backing out of parking spaces and existing driveways Make eye contact with drivers to confirm that they see you Look left, look right, and then look left again before crossing the street
The educational campaign also extended to police and local courts. A pocket guide covering vehicle and traffic law related to pedestrians was developed for police personnel. In addition, a fact sheet was distributed to local courts to inform them of the campaign and help reinforce the importance of the issues that are being addressed with a focus on pedestrian safety.
Anecdotally, bicycle and pedestrian travel has increased over the last several years; however, many of the study area roadways were not constructed to accommodate these additional modes of travel. The New York State Highway Design Manual (HDM) establishes standards for typical roadway cross-sections based upon functional classification, travel speed, and traffic volume data. Table 4.12 summarizes the minimum travel lane and shoulder widths as identified in the HDM for construction of new roads for the types of roadways in the study area.
Table 4.12 – HDM Minimum Design Standards (feet)
Roadway Type Travel Lane Width Shoulder Width
ADT Over 2000 Uncurbed (Right Shoulder)
Curbed (Right shoulder)
Urban Arterial < 50 mph (Principal, Minor) 11 8 5
Urban Arterial ≥ 50 mph (Principal, Minor) 12 8 5
Rural Arterial (Principal, Minor) 12 8 NA
Urban Collector 10 8 5 Urban Local Road 10 8 5
Travel lane and shoulder width for reconstruction or resurfacing of existing roadways can be reduced to 11-foot travel lanes and 4-foot shoulders.
During the public meeting, several comments were raised concerning pedestrian and bicyclist safety on study area roadways. As an example, three roadways were evaluated to determine the desirability for roadway modification to accommodate both pedestrians and bicyclists. Table 4.13 summarizes the existing and desired widths.
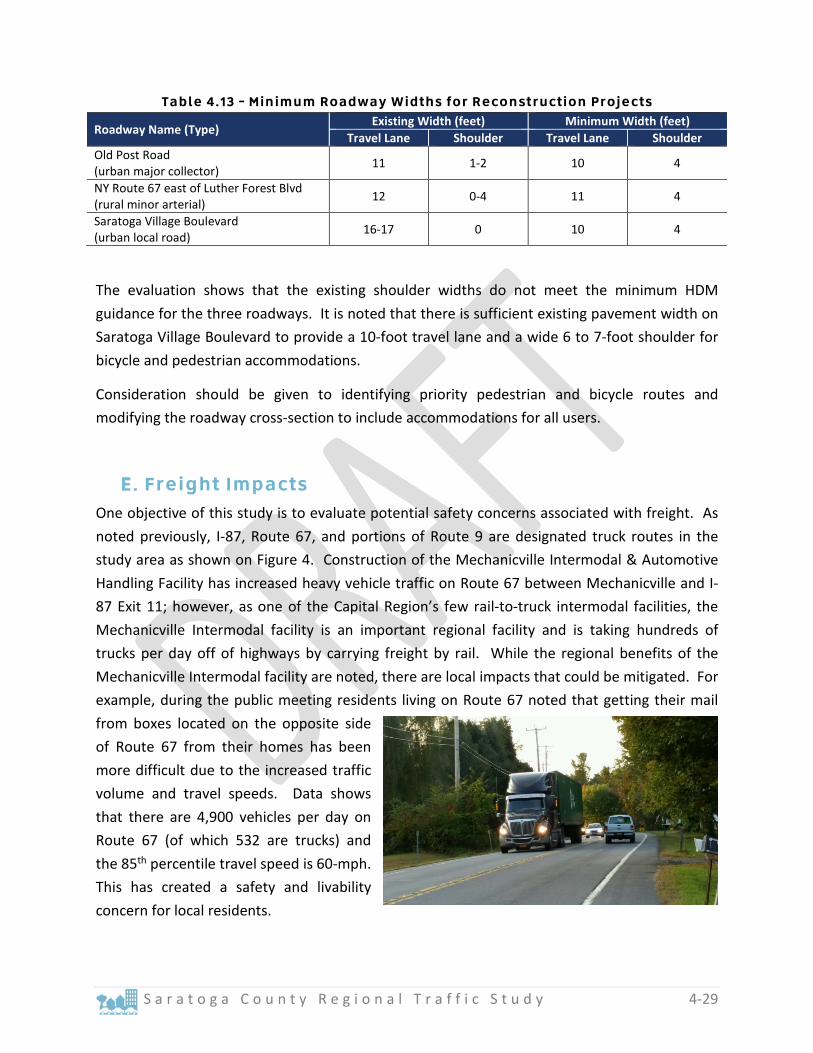
S a r a t o g a C o u n t y R e g i o n a l T r a f f i c S t u d y 4-29
Table 4.13 – Minimum Roadway Widths for Reconstruction Projects
Roadway Name (Type) Existing Width (feet) Minimum Width (feet)
Travel Lane Shoulder Travel Lane Shoulder Old Post Road (urban major collector) 11 1-2 10 4
NY Route 67 east of Luther Forest Blvd (rural minor arterial) 12 0-4 11 4
Saratoga Village Boulevard (urban local road) 16-17 0 10 4
The evaluation shows that the existing shoulder widths do not meet the minimum HDM guidance for the three roadways. It is noted that there is sufficient existing pavement width on Saratoga Village Boulevard to provide a 10-foot travel lane and a wide 6 to 7-foot shoulder for bicycle and pedestrian accommodations.
Consideration should be given to identifying priority pedestrian and bicycle routes and modifying the roadway cross-section to include accommodations for all users.
Freight Impacts One objective of this study is to evaluate potential safety concerns associated with freight. As noted previously, I-87, Route 67, and portions of Route 9 are designated truck routes in the study area as shown on Figure 4. Construction of the Mechanicville Intermodal & Automotive Handling Facility has increased heavy vehicle traffic on Route 67 between Mechanicville and I-87 Exit 11; however, as one of the Capital Region’s few rail-to-truck intermodal facilities, the Mechanicville Intermodal facility is an important regional facility and is taking hundreds of trucks per day off of highways by carrying freight by rail. While the regional benefits of the Mechanicville Intermodal facility are noted, there are local impacts that could be mitigated. For example, during the public meeting residents living on Route 67 noted that getting their mail from boxes located on the opposite side of Route 67 from their homes has been more difficult due to the increased traffic volume and travel speeds. Data shows that there are 4,900 vehicles per day on Route 67 (of which 532 are trucks) and the 85th percentile travel speed is 60-mph. This has created a safety and livability concern for local residents.

4-30 S a r a t o g a C o u n t y R e g i o n a l T r a f f i c S t u d y
The existing travel lanes on Route 67 are generally 12-feet wide and the shoulder width ranges from zero to four feet. The narrow shoulder width creates a problem for pedestrians gathering their mail. There may be potential to move the existing mailboxes to eliminate the safety/access concern. Information on the US Postal Service website shows that changes to the type of delivery method can be adjusted “if service by existing methods imposes an extreme physical hardship on the customer.” The following steps are needed to request a change:
Work with residents to get a formal request with all of their signatures. Work with town officials to coordinate delivery method change request. Talk to mail delivery person to confirm delivery route and method. Submit written request to the Postmaster illustrating the hardship experienced by the
residents.
A change to the mail delivery would be consistent with the one of the goals of the CDTC Freight Advisory Committee to minimize conflicts associated with incompatible land uses near freight facilities or generators. In addition, consistent enforcement of speed limits would reduce travel speeds in the area.
The CDTC recently completed the draft report for the Freight and Goods Movement Study which includes the following recommendations for the study area:
Provide speed enforcement to reduce travel speeds of truck traffic Move the existing mailboxes Encourage trucks heading north to use the Round Lake Bypass to access I-87 via Exit 11
rather than travelling north on the US Route 9/NY Route 67 overlap to access I-87 via Exit 12
Widen shoulders where needed
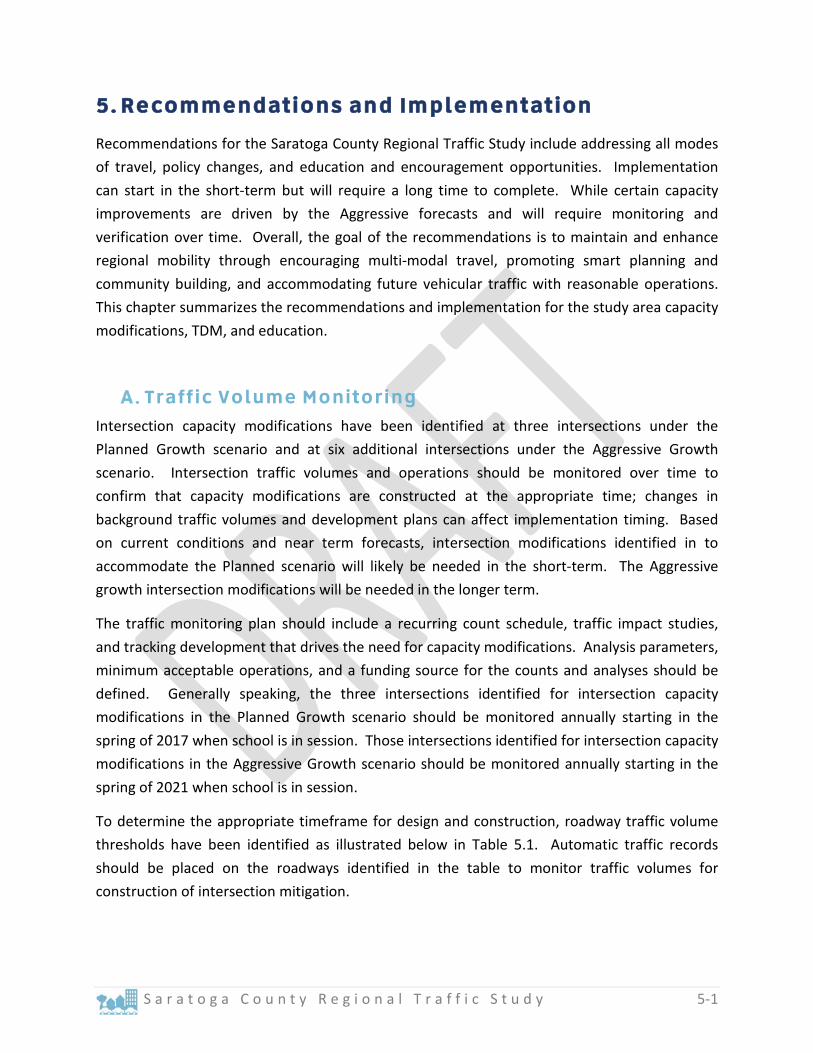
S a r a t o g a C o u n t y R e g i o n a l T r a f f i c S t u d y 5-1
5. Recommendations and Implementation
Recommendations for the Saratoga County Regional Traffic Study include addressing all modes of travel, policy changes, and education and encouragement opportunities. Implementation can start in the short-term but will require a long time to complete. While certain capacity improvements are driven by the Aggressive forecasts and will require monitoring and verification over time. Overall, the goal of the recommendations is to maintain and enhance regional mobility through encouraging multi-modal travel, promoting smart planning and community building, and accommodating future vehicular traffic with reasonable operations. This chapter summarizes the recommendations and implementation for the study area capacity modifications, TDM, and education.
Traffic Volume Monitoring Intersection capacity modifications have been identified at three intersections under the Planned Growth scenario and at six additional intersections under the Aggressive Growth scenario. Intersection traffic volumes and operations should be monitored over time to confirm that capacity modifications are constructed at the appropriate time; changes in background traffic volumes and development plans can affect implementation timing. Based on current conditions and near term forecasts, intersection modifications identified in to accommodate the Planned scenario will likely be needed in the short-term. The Aggressive growth intersection modifications will be needed in the longer term.
The traffic monitoring plan should include a recurring count schedule, traffic impact studies, and tracking development that drives the need for capacity modifications. Analysis parameters, minimum acceptable operations, and a funding source for the counts and analyses should be defined. Generally speaking, the three intersections identified for intersection capacity modifications in the Planned Growth scenario should be monitored annually starting in the spring of 2017 when school is in session. Those intersections identified for intersection capacity modifications in the Aggressive Growth scenario should be monitored annually starting in the spring of 2021 when school is in session.
To determine the appropriate timeframe for design and construction, roadway traffic volume thresholds have been identified as illustrated below in Table 5.1. Automatic traffic records should be placed on the roadways identified in the table to monitor traffic volumes for construction of intersection mitigation.

5-2 S a r a t o g a C o u n t y R e g i o n a l T r a f f i c S t u d y
Table 5.1 – PM Peak Hour Traffic Volume Monitoring
No Intersection & Approach Traffic Volumes Traffic Volume Threshold Existing Planned Aggressive
2 Old Post Rd/Northline Rd - Northline Road (west Leg) 1,170 1,325 1,370 1,200
6 US Rt 9/Malta Ave - Malta Ave (east leg) 195 200 215 200
10 NY Rt 67/Brookline Rd - NY Route 67 (east leg) 1,490* 1,585* 1,610* 1,500
11 NY Rt 67/Eastline Rd - NY Route 67 (west leg) 1,525 1,645 1,700 1,600
16 US Rt 9/Stonebreak Rd - US Route 9 (north leg) 1,380 1,940 2,190 2,000
18 Luther Forest Blvd/NY Rt 67 - NY Route 67 (west leg) 695* 1,100* 1,390* 1,200
21,22 Round Lake Rd/I-87 Exit 11 - Round Lake Rd (between ramps) 1,385 1,635 1,845 1,700
31 NY Rt 9P/Plains Rd - Plains Rd (south leg) 430 675 825 500
* Indicates AM Peak Hour Traffic Volumes
As traffic volumes on the roadway approach the traffic volume threshold, intersection design and construction should be implemented.
A second alternative for growth monitoring is through the number of building permits issued in each community. The CDRPC monitors building permit history in each community in the Capital District. The building permit data can be reviewed annually to determine whether growth in the study area is on-track with the Planned or the Aggressive growth scenarios. Table 5.2 summarizes the communities to monitor and the corresponding new residential units associated with each growth scenario after 2015. Residential building permits should be reviewed annually to track growth in the study area.
Table 5.2 – Building Permit Monitoring
Municipality Residential Units
Planned Total (Annual)
Aggressive Total (Annual)
Town of Ballston 442 (44) 956 (96) Town of Halfmoon 1,313 (131) 2,100 (210) Town of Malta 1,939 (194) 2,936 (294) Town of Milton 523 (52) 523 (52) Town of Stillwater 186 (19) 742 (74)

S a r a t o g a C o u n t y R e g i o n a l T r a f f i c S t u d y 5-3
If the number of building permits being issued tracks more consistently with the Planned growth scenario, then implementation of capacity mitigation at those intersections identified for the Planned scenario should be progressed. Should the number of building permits being issued track more consistently with the Aggressive growth scenario, then implementation of capacity mitigation at intersections identified for the Aggressive growth scenario should be progressed. This includes creating engineering design plans and securing funding for construction of intersection mitigation.
TDM Local municipalities, government agencies, chambers of commerce, and business owners should work to encourage implementation of TDM strategies. A number of strategies are available in the region, applicable to the study area, and require additional education about availability, their benefits, and to become integrated into the regional thinking about traffic management. These include:
Work with CDTA to locate a new and larger park and ride lot near Exit 12 from which local transit services can be expanded near
Work with GLOBALFOUNDRIES, other larger employers, and chambers of commerce to implement, advertise, and incentivize employer-based TDM
Work with CDTA, CDTC, and local municipalities to develop transit improvements including bike/transit integration
Encourage rideshare programs like carpools and vanpooling. Also encourage car sharing and bike sharing programs
Educate business owners about the benefits of modified work schedules including flextime, off-peak shift work, and telecommuting
Work with local municipalities to implement smart planning like new urbanism, smart growth, transit oriented development, car-free planning, and location-efficient development
Implement parking management including pay to park, parking incentives for rideshare programs, and maximum parking requirements rather than minimum parking requirements
Encourage non-motorized travel through education, programming, traffic calming, and construction of appropriate facilities
Coordinate with CDTC to implement freight transport management recommendations from the Freight and Goods Movement Study
Market regionally available TDM programs
5-4 S a r a t o g a C o u n t y R e g i o n a l T r a f f i c S t u d y
Many of these strategies are little or low cost and require education and encouragement rather than significant capital investment. For example, shifting the work schedules for GLOBALFOUNDRIES employees reduces trips at a low cost during peak hours and potentially saves millions of dollars in roadway modifications. Other strategies like transit improvements and rideshare programs will have a much lower reduction in peak hour trips, but will provide system-wide operational benefits.
Continued advocacy and implementation of good TDM measures and programs is needed, without which, employees will continue to predominately drive themselves to and from work. Towns and large employers should designate TDM managers to market and foster these programs and build from the resources already available at the regional level such as incentivizing carpools and vanpools which are a more viable option for lower density areas like Saratoga County. Commuters can sign up for carpools and vanpools by registering at the www.iPool2.org website and additional information can be found at the Capital Moves website. Employers can incentivize carpool and vanpool use by financing the service, providing pre-tax payment options, and creating preferential parking for carpool and vanpool users, among other incentives.
Education Education is a fundamental element to increasing safety and compliance for all travel modes. Education is also critical for municipal review boards as they are the decision makers for project approvals and have the local authority and responsibility to implement desired changes. Transportation education should take many forms to reach all users, such as:
Municipalities should encourage the use of existing free, online resources for schools, clubs, and other organized groups to promote a safe transportation system for all users.
Teach bicycling and walking skills to youngsters for all types of intersections and roadways in safe, controlled environments like schools and clubs.
Teach important travel mode skills to adults through add campaigns, employer education courses, social organizations, and flyers at major activity centers. Adults can also be reached through programs that their children attend at school.
Include bike, pedestrian, and multiple types of intersection control navigation information in driver training like Drivers-Ed.
Saratoga County should promote safe travel for all modes by working with municipalities to create a task force focused on education. The task force should use online and local resources to develop and implement an educational campaign focused on all modes of travel on all types

S a r a t o g a C o u n t y R e g i o n a l T r a f f i c S t u d y 5-5
of intersection and roadway facilities. For example, municipalities could play short educational videos on the televisions located in Town Hall. These videos would reach most people that enter Town Hall for a relatively low cost.
While education concerning the existing built environmental is vital, so is the understanding of how our planning choices affect our transportation network. For example, promoting low-density single-family housing encourages personal vehicle trips while promoting higher-density, mixed use development creates the opportunity for multi-modal travel and shared trips. Local municipalities should use the regional resources available to learn the implications of decisions made today and how they affect the transportation networks of tomorrow in order to make informed decisions when creating community plans and making development decisions.
Implementation Public Funding The proposed highway modification locations are all within the Capital District urbanized area and the level of functional classification of at least one of the approach highway legs would allow for federal aid highway program eligibility under one or two of the primary core programs. The core programs include the Surface Transportation Program (STP) and National Highway System Performance Program (NHPP). These eligible functional classification assignments are generally re-evaluated every ten years in conjunction with the latest US Census information and input from State and local traffic volume reporting and the Metropolitan Planning Organization.
Table 5.3 – Federal Aid Highway Eligibility No Intersection Highest Functional
Class Within Urbanized
Area Federal Aid Program
Eligibility (Core) 3 Old Post Rd/Northline Rd Major Collector Yes STP 6 US Rt 9/Malta Ave Principal Arterial Yes NHPP/STP 10 NY Rt 67/Brookline Rd Principal Arterial Yes NHPP/STP 11 NY Rt 67/Eastline Rd Principal Arterial Yes NHPP/STP 16 US Rt 9/Stonebreak Rd Principal Arterial Yes NHPP/STP 18 Luther Forest Blvd/NY Rt 67 Minor Arterial Yes STP 21,22 Round Lake Rd/I-87 Exit 11 Principal Arterial Yes NHPP/STP 31 NY Rt 9P/Plains Road Major Collector Yes STP
Eligibility for federal funding does not automatically lead to the assignment of those funds to a project. In the Capital District four county area, of which the affected Towns are a part, the CDTC, comprised of representatives across the Capital District municipalities, has the legal

5-6 S a r a t o g a C o u n t y R e g i o n a l T r a f f i c S t u d y
mandate to determine priorities for assigning federal highway and transit funds. As noted in Chapter 1, the CDTC New Visions Plan calls for priority to maintaining existing infrastructure. This objective is consistent with the NYSDOT “Forward Four” policy with preservation of existing facilities as the highest priority for use of limited funds. The five year CDTC Transportation Improvement Program (TIP) is structured around preservation and not system expansion. Preservation needs far exceed current and expected funding levels. As of the date of this document, CDTC has made no commitment for funding any of the improvements proposed with federal monies under its purview.
Some of the project locations exhibit a crash history pattern which may indicate a correctable situation using standard countermeasures. The current federal surface transportation act (MAP-21), under extension authorization to October 31, 2015, includes a funding program (HSIP) to address safety deficient locations. The basic requirement to access these funds is to evaluate historic crash data (usually three years) and determine if a cost effective countermeasure exists. Federal and State policy requires the analysis be data driven on history and pattern(s) of crashes. It is possible to combine these funds with core or other monies in the event of providing a countermeasure with a standard preservation treatment.
Post October 31, 2015, the federal highway funding future remains unclear. MAP-21 in essence, redirected the federal funding focus to the expanded National Highway System. Projects off the NHS are competing for far fewer available monies. There is no reason, as of now, to believe this situation will change anytime soon; nor, can one assume the strict direction and focus of funding toward preservation, not expansion, would cease in the near term.
New York, under direction from Governor Cuomo has created regional economic development councils (EDCs) to set strategies and program and project proposals for the geographic area each council presides over. Proposals for grants, loans, and other State economic development monies outside the federal highway and transit programs generally have to be evaluated and prioritized by the affected Council in accordance with that Region’s multiyear plan. One of the major strategies of the Capital Region Plan is to create a 21st Century sustainable infrastructure able to attract and allow expansion of business. This plan and its strategies, in turn, are supported by a Consolidated Funding Application (CFA) process. The improvements proposed essentially have to be linked to job creation or retention. Most (sub) programs have cash match requirements and three to one, or higher, (private) leverage for benefits. Each calendar year, new projects are solicited and evaluated by the EDCs. The proposed improvements could be submitted under the CFA solicitation either separately or combined.
S a r a t o g a C o u n t y R e g i o n a l T r a f f i c S t u d y 5-7
Most federal and State programs require cash matches for individual projects, usually 10-20 percent of the total cost. The match can be provided by State transportation monies, local funds, or private contributions (usually through a SEQRA GEIS impact assessment). Absent a GEIS impact assessment, the State has no set policy on providing its contributions, except that projects with scopes outside Forward Four preservation generally will not fare well for State participation under current and expected budget restrictions. It is clear that an infusion of private monies, of some significance, will probably be expected for some, or possibly all, of the proposed improvements.
This is consistent with the programmed projects “already on the books” which are the responsibility of private developers as part of the traffic impacts associated with specific developments. The additional capacity mitigation identified in this study are also directly related to land development, and the towns should take the lead on securing private mitigation funding through traffic impact studies and other SEQR documentation.
Of special note are improvements for pedestrians and bicyclists. Those improvements slated for non-vehicular users are specifically made eligible for federal funding under Title 23 USC. The State has been required to assign a minimum portion of its funding towards these type improvements. Special project solicitations have been made on a regular basis but are currently on hold given the uncertainty of creating a new surface transportation act. As always the affected municipalities should identify and prioritize its pedestrian/bicyclists facility needs and, indeed, incorporate them into individual property development requirements, either as actual construction or reservation of right of way.
Generic Environmental Impact Statement This plan reveals a fundamental challenge that many communities face: planning for new economic development while ensuring that transportation facilities are capable of accommodating the increased demand associated with that development. The Town, the State, and the private sector, while promoting responsible and beneficial economic development, all share a responsibility for evaluating and maintaining reasonable transportation operations in the area. Local municipalities typically strive to limit obstacles to commercial development and provide maximum flexibility for economic growth.
A Generic Environmental Impact Statement (GEIS) is a tool that can be used to facilitate public/private cost sharing for implementation of transportation improvements. The purpose of a GEIS is to associate planned development or development alternatives with potential impacts and related mitigation measures. It establishes a mechanism to assess multiple potential impacts over a large geographical area. This serves two purposes. First, it allows for future development to reduce or bypass the lengthy environmental review process, as long as

5-8 S a r a t o g a C o u n t y R e g i o n a l T r a f f i c S t u d y
the proposed project is within the thresholds established in the GEIS. This saves potential developers significant time and money. In addition, a GEIS is a means for all involved parties to contribute towards the implementation of necessary improvements. Since the establishment of the GEIS process within the State Environmental Quality Review Act (SEQR) in 1982, several communities within New York State have utilized that process to develop financial strategies to allow cost sharing for infrastructure improvements.
A Task Force should be developed to implement the findings of the Saratoga County Regional Traffic Study. The Task Force should include representation from the CDTC, Saratoga County, NYSDOT, the Town of Malta, CEG, and SEDC. One item on the task force list should be to establish a Regional GEIS as a mechanism to create the initial engineering requirements and budgets as well as further investigate funding and implementation of transportation improvements. The GEIS would help ensure that all growth, not just the largest or last-in projects, will contribute toward their fair share of recommended capacity modifications.
According to the Department of State Regulation “6 NYCRR, Part 617.10 Generic Environmental Impact Statement”, a GEIS may be used “to assess the environmental impacts of a number of separate actions in a given geographic area which, if considered singly, may have minor impacts, but if considered together may have significant impacts.” A GEIS will enable the Task Force to identify a governing agency to acquire and pool funds toward specific highway modification projects, when individual smaller developments may not show a transportation impact and may otherwise avoid transportation mitigation. A GEIS makes the rational nexus between a project’s relative impact (even if that is small), facilitates fair share mitigation, and gives the governing agency the legal authority to collect fees from private development to mitigate impacts. The GEIS would confirm transportation improvements, costs of new transportation infrastructure, establish the basis for a successful public/private cost sharing program, monitoring and timing for mitigation, and provide the structure for implementation of the recommendation.