sarc report for kipp academy of innovation€¦ · last updated: 2/1/2016 last updated: 1/26/2016...
TRANSCRIPT

KIPP Academy of Innovation
By February 1 of each year, every school in California is required by state law to publish a School Accountability Report Card (SARC).The SARC contains information aboutthe condit ion and performance of each California public school. Under the Local Control Funding Formula (LCFF) all local educat ional agencies (LEAs) are required toprepare a Local Control Accountability Plan (LCAP), which describes how they intend to meet annual school-specific goals for all pupils, w ith specific act ivit ies to addressstate and local priorit ies. Addit ionally, data reported in an LCAP is to be consistent w ith data reported in the SARC.
For more information about SARC requirements, see the California Department of Educat ion (CDE) SARC Web page at http://www.cde.ca.gov/ta/ac/sa/.
For more information about the LCFF or LCAP, see the CDE LCFF Web page at http://www.cde.ca.gov/fg/aa/lc/.
For addit ional information about the school, parents/guardians, and community members should contact the school principal or the district office.
DataQuest
Internet Access
California Department of Education
School Accountability Report CardReported Using Data from the 2014-15 School Year
Published During 2015-16
DataQuest is an online data tool located on the CDE DataQuest Web page that contains addit ional information about this school and comparisons of the school tothe district , the county, and the state. Specifically, DataQuest is a dynamic system that provides reports for accountability (e.g., test data, enrollment, highschool graduates, dropouts, course enrollments, staffing, and data regarding English learners.
Internet access is available at public libraries and other locat ions that are publicly accessible (e.g., the California State Library). Access to the Internet at librariesand public locat ions is generally provided on a first-come, first-served basis. Other use restrict ions may include the hours of operat ion, the length of t ime that aworkstat ion may be used (depending on availability), the types of software programs available on a workstat ion, and the ability to print documents.
Alice Lai, School LeaderPrincipal, KIPP Academy of Innovation
KIPP Academy of Innovat ion is a tuit ion-free public S.T.E.A.M. charter middle school that opened in August 2014 in EastLos Angeles. KIPP Academy of Innovat ion current ly serves 252 5th and 6th grade students, and w ill add one grade eachyear unt il we reach capacity in 2017 w ith students in fifth through eighth grade. KIPP Academy of Innovat ion is a proudmember of a nat ional network of KIPP (Knowledge is Power Program) schools. The school is operated by KIPP LASchools, a charter management organizat ion.
We believe that all children have an unalienable right to determine their own dest iny. At the center of this fundamentalbelief is the idea that all children deserve a high-quality educat ion that provides them w ith the freedom, knowledge, andcourage to choose their paths to and through college and beyond. At KAI, our students are 21st century learners andleaders, who confident ly think outside the box, bravely remain ahead of the curve, and solve problems that don’t yetexist.
KIPP Academy of Innovat ion students have access to cutt ing edge curriculum, instruct ion, and resources on a daily basis.Rigorous literacy instruct ion, an interdisciplinary STEAM (science, technology, engineering, art, and mathematics)curriculum, and small group intervent ion and accelerat ion provide KAI innovators w ith the necessary challenging academicfoundat ion and crit ical character development to succeed to and through college and beyond.
KIPP Academy of Innovat ion4800 East Cesar Chavez AvenueLos Angeles, CA 90022-1307
Phone: 323-406-8000E-mail: [email protected]
About Our SchoolAbout Our School
ContactContact

Last updated: 1/26/2016
Last updated: 1/26/2016
About This School
Contact Information - Most Recent YearContact Information - Most Recent Year
District Contact Information - Most Recent Year
District Name Los Angeles Unified
Phone Number (213) 241-1000
Superintendent Ramon Cort ines
E-mail Address ramon.cort [email protected]
Web Site www.lausd.net
School Contact Information - Most Recent Year
School Name KIPP Academy of Innovat ion
Street 4800 East Cesar Chavez Avenue
City, State, Zip Los Angeles, Ca, 90022-1307
Phone Number 323-406-8000
Principal Alice Lai, School Leader
E-mail Address [email protected]
Web Site www.kippla.org/innovat ion
County-District-School (CDS) Code
19647330128512
School Description and Mission Statement - Most Recent YearSchool Description and Mission Statement - Most Recent Year
At KIPP Academy of Innovat ion, we believe in the relent less pursuit of excellence beyond college for all children. We believe that excellent schools and strongpartnerships transform communit ies in preparat ion for the 21st century and beyond. We believe that by educat ing the whole child, our students are empoweredto transform their lives, the communit ies they live in, and the world at large. We foster a genuine love of learning by creat ing a collaborat ive culture of inquiry andlearning through discovery.
W ith rigorous literacy based instruct ion as the gateway to learning, interdisciplinary STEAM (Science, Technology, Engineering, Arts, and Mathematics) curricula,and a deep culture of character development, our students are empowered as 21st century learners and leaders to innovate and compete in the global arena.
2014-15 SARC - KIPP Academy of Innovation
Page 2 of 31
Last updated: 2/1/2016
Last updated: 1/26/2016
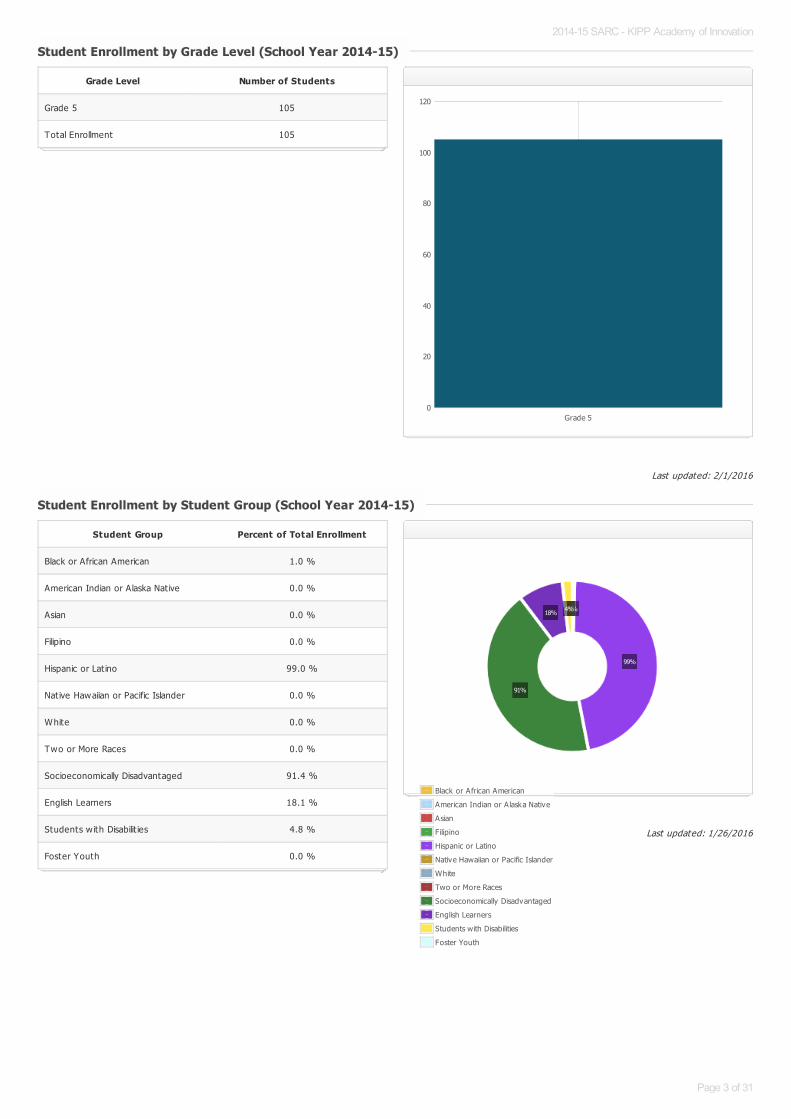
Student Enrollment by Grade Level (School Year 2014-15)Student Enrollment by Grade Level (School Year 2014-15)
Grade Level Number of Students
Grade 5 105
Total Enrollment 105
Grade 50
20
40
60
80
100
120
Student Enrollment by Student Group (School Year 2014-15)Student Enrollment by Student Group (School Year 2014-15)
Student Group Percent of Total Enrollment
Black or African American 1.0 %
American Indian or Alaska Nat ive 0.0 %
Asian 0.0 %
Filipino 0.0 %
Hispanic or Lat ino 99.0 %
Native Hawaiian or Pacific Islander 0.0 %
White 0.0 %
Two or More Races 0.0 %
Socioeconomically Disadvantaged 91.4 %
English Learners 18.1 %
Students w ith Disabilit ies 4.8 %
Foster Youth 0.0 %
Black or African American
American Indian or A laska Native
Asian
Filipino
Hispanic or Latino
Native Hawaiian or Pacific Islander
White
Two or More Races
Socioeconomically Disadvantaged
English Learners
Students with Disabilities
Foster Youth
1%
99%
91%
18% 4%
2014-15 SARC - KIPP Academy of Innovation
Page 3 of 31

Last updated: 1/26/2016
Last updated: 1/26/2016
A. Conditions of Learning
State Priority: Basic
The SARC provides the follow ing information relevant to the State priority: Basic (Priority 1):
Degree to which teachers are appropriately assigned and fully credent ialed in the subject area and for the pupils they are teaching;Pupils have access to standards-aligned instruct ional materials; andSchool facilit ies are maintained in good repair
Note: “Misassignments” refers to the number of posit ions filled by teachers who lack legal authorizat ion to teach that grade level, subject area, student group, etc.
* Total Teacher Misassignments includes the number of Misassignments of Teachers of English learners.
Teacher CredentialsTeacher Credentials
Teachers School District
2013-14
2014-15
2015-16
2015-16
With Full Credent ial 5 9
W ithout Full Credent ial
Teachers Teaching Outside SubjectArea of Competence (w ith fullcredent ial)
2013-14 2014-15 2015-164.5
5.0
5.5
6.0
6.5
7.0
7.5
8.0
8.5
9.0
9.5Teachers with Full Credential
Teachers without Full Credential
Teachers Teaching Outside Subject Area of Competence
Teacher Misassignments and Vacant Teacher PositionsTeacher Misassignments and Vacant Teacher Positions
Indicator2013-
142014-
152015-
16
Misassignments of Teachers of EnglishLearners
0 0
Total Teacher Misassignments* 0 0
Vacant Teacher Posit ions 0 0
2013-14 2014-15 2015-16-1.0
-0.5
0.0
0.5
1.0Misassignments of Teachers of English Learners
Total Teacher Misassignments
Vacant Teacher Positions
2014-15 SARC - KIPP Academy of Innovation
Page 4 of 31

Last updated: 2/1/2016
Note: High-poverty schools are defined as those schools w ith student eligibility of approximately 40 percent or more in the free and reduced price meals program. Low-poverty schools are those w ith student eligibility of approximately 39 percent or less in the free and reduced price meals program.
Year and month in which data were collected: January 2016
Core Academic Classes Taught by Highly Qualified Teachers (School Year 2014-15)Core Academic Classes Taught by Highly Qualified Teachers (School Year 2014-15)
Location of ClassesPercent of Classes In Core Academic Subjects Taught by
Highly Qualified TeachersPercent of Classes In Core Academic Subjects Not Taught by
Highly Qualified Teachers
This School 100.0% 0.0%
All Schools in District 88.0% 12.0%
High-Poverty Schoolsin District
93.0% 7.0%
Low-Poverty Schoolsin District
45.0% 55.0%
Quality, Currency, Availability of Textbooks and Instructional Materials - Most Recent YearQuality, Currency, Availability of Textbooks and Instructional Materials - Most Recent Year
Subject Textbooks and Instructional Materials/year of AdoptionFrom Most Recent
Adoption?Percent Students Lacking Own
Assigned Copy
Reading/Language ArtsAchieve3000
Wheatly Curriculum
Fountas and Pinnell Leveled Literacy Intervent ion Sets - 2ndthrough 8th grade
Great Nonfict ion for 3-5
Stem Grades for 3-4
Lat ino Biographies
'If You' Series
'Community and Neighborhood' Series
Yes 0.0 %
MathematicsST Math
Eureka MathSingapore Math
FACEing Math Set
Yes 0.0 %
ScienceTeacher created Curriculum - standards aligned
NGSS Reader Pack
Yes 0.0 %
History-Social ScienceTeacher created Curriculum - standards aligned
History AliveTHe Alexandria Plan: U.S. and World History
Yes 0.0 %
Foreign LanguageN/A
0.0 %
HealthN/A
0.0 %
Visual and Performing ArtsThe Art Teacher's Survival Guide
Art Lab for KidsDrawing Lab for Mixed Media Art ists
Paint Lab
Yes 0.0 %
Science Lab Eqpmt(Grades 9-12)
0.0 %
2014-15 SARC - KIPP Academy of Innovation
Page 5 of 31

2014-15 SARC - KIPP Academy of Innovation
Page 6 of 31
Last updated: 1/26/2016
Last updated: 1/26/2016
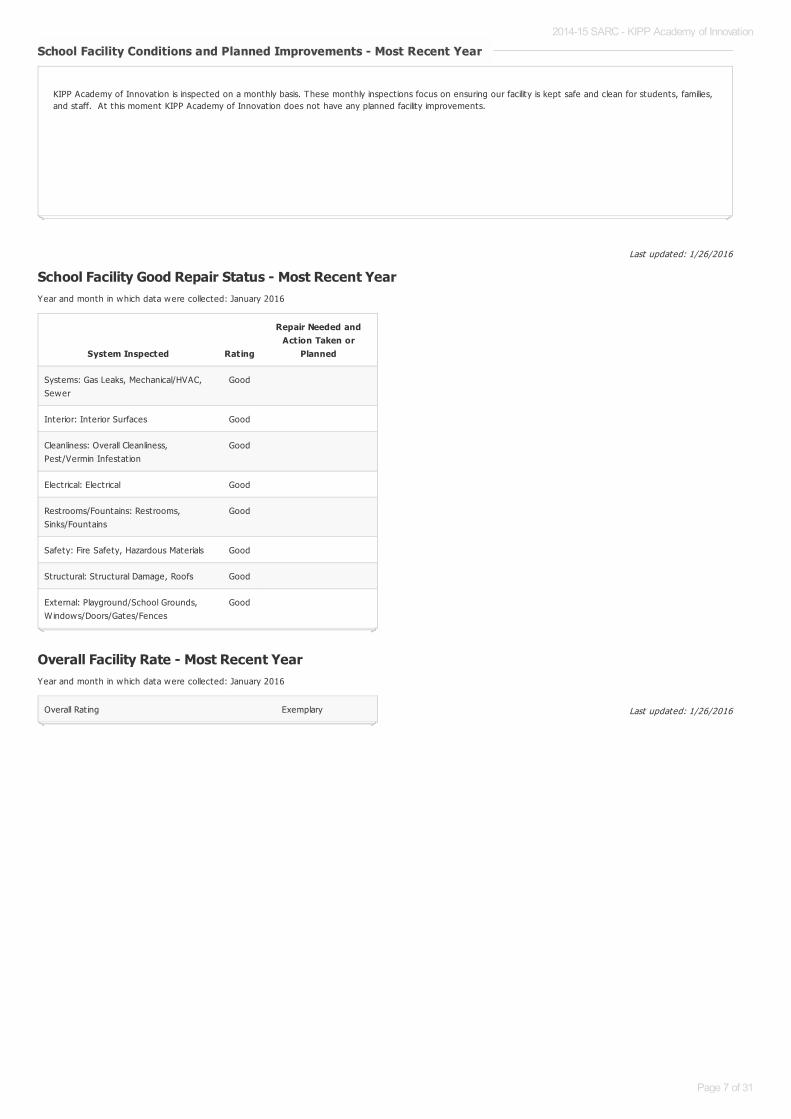
School Facility Good Repair Status - Most Recent YearYear and month in which data were collected: January 2016
Overall Facility Rate - Most Recent YearYear and month in which data were collected: January 2016
School Facility Conditions and Planned Improvements - Most Recent YearSchool Facility Conditions and Planned Improvements - Most Recent Year
KIPP Academy of Innovat ion is inspected on a monthly basis. These monthly inspect ions focus on ensuring our facility is kept safe and clean for students, families,and staff. At this moment KIPP Academy of Innovat ion does not have any planned facility improvements.
System Inspected Rating
Repair Needed andAction Taken or
Planned
Systems: Gas Leaks, Mechanical/HVAC,Sewer
Good
Interior: Interior Surfaces Good
Cleanliness: Overall Cleanliness,Pest/Vermin Infestat ion
Good
Electrical: Electrical Good
Restrooms/Fountains: Restrooms,Sinks/Fountains
Good
Safety: Fire Safety, Hazardous Materials Good
Structural: Structural Damage, Roofs Good
External: Playground/School Grounds,W indows/Doors/Gates/Fences
Good
Overall Rat ing Exemplary
2014-15 SARC - KIPP Academy of Innovation
Page 7 of 31

Last updated: 1/26/2016
B. Pupil Outcomes
State Priority: Pupil Achievement
The SARC provides the follow ing information relevant to the State priority: Pupil Achievement (Priority 4):
Statew ide assessments (i.e., California Assessment of Student Performance and Progress [CAASPP], Science California Standards Tests); andThe percentage of pupils who have successfully completed courses that sat isfy the requirements for entrance to the University of California and the CaliforniaState University, or career technical educat ion sequences or programs of study
Note: Percentages are not calculated when the number of students tested is ten or less, either because the number of students in this category is too small forstat ist ical accuracy or to protect student privacy. Double dashes (--) appear in the table when the number of students tested is ten or less.
California Assessment of Student Performance and Progress Results for All Students (School Year 2014-15)California Assessment of Student Performance and Progress Results for All Students (School Year 2014-15)
Subject
Percent of Students Meeting or Exceeding the State Standards
School District State
English Language Arts / Literacy (grades 3-8 and 11) 62.0% 33.0% 44.0%
Mathematics (grades 3-8 and 11) 53.0% 25.0% 33.0%
2014-15 SARC - KIPP Academy of Innovation
Page 8 of 31

Last updated: 1/26/2016
Double dashes (--) appear in the table when the number of students is ten or less, either because the number of students in this category is too small for stat ist icalaccuracy or to protect student privacy.
Note: The number of students tested includes students that did not receive a score; however the number of students tested is not the number that was used tocalculate the achievement level percentages. The achievement level percentages are calculated using students w ith scores.
* Level 1 = Standard not met Level 2 = Standard nearly met Level 3 = Standard met Level 4 = Standard exceeded
CAASPP Assessment Results - English Language Arts (ELA) CAASPP Assessment Results - English Language Arts (ELA)
Disaggregated by Student Groups, Grades Three through Eight and Eleven (School Year 2014-15)Disaggregated by Student Groups, Grades Three through Eight and Eleven (School Year 2014-15)
ELA - Grade 3ELA - Grade 3
Student GroupTotal
EnrollmentNumberTested
PercentTested
PercentAchievement
Level 1*
PercentAchievement
Level 2*
PercentAchievement
Level 3*
PercentAchievement
Level 4*
All Students -- -- -- -- -- -- --
Male -- -- -- -- -- -- --
Female -- -- -- -- -- -- --
Black or African American -- -- -- -- -- -- --
American Indian or Alaska Nat ive -- -- -- -- -- -- --
Asian -- -- -- -- -- -- --
Filipino -- -- -- -- -- -- --
Hispanic or Lat ino -- -- -- -- -- -- --
Nat ive Hawaiian or Pacific Islander -- -- -- -- -- -- --
White -- -- -- -- -- -- --
Two or More Races -- -- -- -- -- -- --
Socioeconomically Disadvantaged -- -- -- -- -- -- --
English Learners -- -- -- -- -- -- --
Students w ith Disabilit ies -- -- -- -- -- -- --
Students Receiving MigrantEducat ion Services
-- -- -- -- -- -- --
Foster Youth -- -- -- -- -- -- --
2014-15 SARC - KIPP Academy of Innovation
Page 9 of 31

Last updated: 1/26/2016
Double dashes (--) appear in the table when the number of students is ten or less, either because the number of students in this category is too small for stat ist icalaccuracy or to protect student privacy.
Note: The number of students tested includes students that did not receive a score; however the number of students tested is not the number that was used tocalculate the achievement level percentages. The achievement level percentages are calculated using students w ith scores.
* Level 1 = Standard not met Level 2 = Standard nearly met Level 3 = Standard met Level 4 = Standard exceeded
ELA - Grade 4ELA - Grade 4
Student GroupTotal
EnrollmentNumberTested
PercentTested
PercentAchievement
Level 1*
PercentAchievement
Level 2*
PercentAchievement
Level 3*
PercentAchievement
Level 4*
All Students -- -- -- -- -- -- --
Male -- -- -- -- -- -- --
Female -- -- -- -- -- -- --
Black or African American -- -- -- -- -- -- --
American Indian or Alaska Nat ive -- -- -- -- -- -- --
Asian -- -- -- -- -- -- --
Filipino -- -- -- -- -- -- --
Hispanic or Lat ino -- -- -- -- -- -- --
Nat ive Hawaiian or Pacific Islander -- -- -- -- -- -- --
White -- -- -- -- -- -- --
Two or More Races -- -- -- -- -- -- --
Socioeconomically Disadvantaged -- -- -- -- -- -- --
English Learners -- -- -- -- -- -- --
Students w ith Disabilit ies -- -- -- -- -- -- --
Students Receiving MigrantEducat ion Services
-- -- -- -- -- -- --
Foster Youth -- -- -- -- -- -- --
2014-15 SARC - KIPP Academy of Innovation
Page 10 of 31
Last updated: 1/26/2016
Double dashes (--) appear in the table when the number of students is ten or less, either because the number of students in this category is too small for stat ist icalaccuracy or to protect student privacy.
Note: The number of students tested includes students that did not receive a score; however the number of students tested is not the number that was used tocalculate the achievement level percentages. The achievement level percentages are calculated using students w ith scores.
* Level 1 = Standard not met Level 2 = Standard nearly met Level 3 = Standard met Level 4 = Standard exceeded
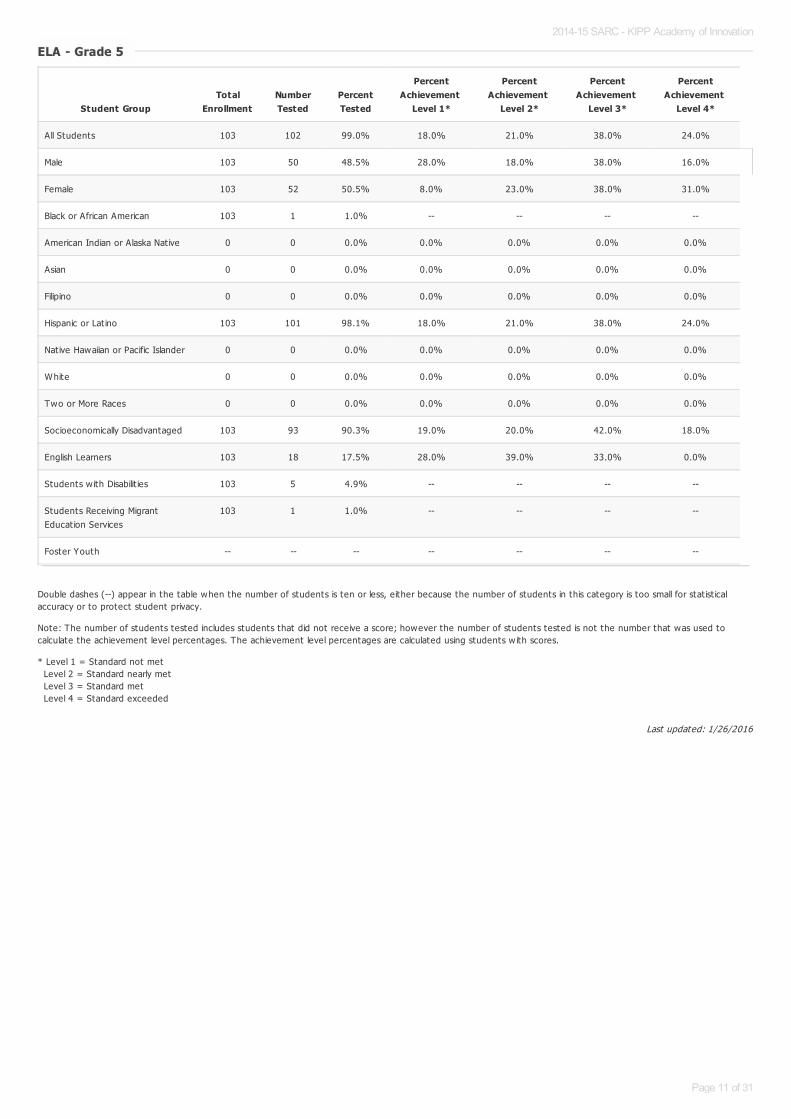
ELA - Grade 5ELA - Grade 5
Student GroupTotal
EnrollmentNumberTested
PercentTested
PercentAchievement
Level 1*
PercentAchievement
Level 2*
PercentAchievement
Level 3*
PercentAchievement
Level 4*
All Students 103 102 99.0% 18.0% 21.0% 38.0% 24.0%
Male 103 50 48.5% 28.0% 18.0% 38.0% 16.0%
Female 103 52 50.5% 8.0% 23.0% 38.0% 31.0%
Black or African American 103 1 1.0% -- -- -- --
American Indian or Alaska Nat ive 0 0 0.0% 0.0% 0.0% 0.0% 0.0%
Asian 0 0 0.0% 0.0% 0.0% 0.0% 0.0%
Filipino 0 0 0.0% 0.0% 0.0% 0.0% 0.0%
Hispanic or Lat ino 103 101 98.1% 18.0% 21.0% 38.0% 24.0%
Native Hawaiian or Pacific Islander 0 0 0.0% 0.0% 0.0% 0.0% 0.0%
White 0 0 0.0% 0.0% 0.0% 0.0% 0.0%
Two or More Races 0 0 0.0% 0.0% 0.0% 0.0% 0.0%
Socioeconomically Disadvantaged 103 93 90.3% 19.0% 20.0% 42.0% 18.0%
English Learners 103 18 17.5% 28.0% 39.0% 33.0% 0.0%
Students w ith Disabilit ies 103 5 4.9% -- -- -- --
Students Receiving MigrantEducat ion Services
103 1 1.0% -- -- -- --
Foster Youth -- -- -- -- -- -- --
2014-15 SARC - KIPP Academy of Innovation
Page 11 of 31
Last updated: 1/26/2016
Double dashes (--) appear in the table when the number of students is ten or less, either because the number of students in this category is too small for stat ist icalaccuracy or to protect student privacy.
Note: The number of students tested includes students that did not receive a score; however the number of students tested is not the number that was used tocalculate the achievement level percentages. The achievement level percentages are calculated using students w ith scores.
* Level 1 = Standard not met Level 2 = Standard nearly met Level 3 = Standard met Level 4 = Standard exceeded
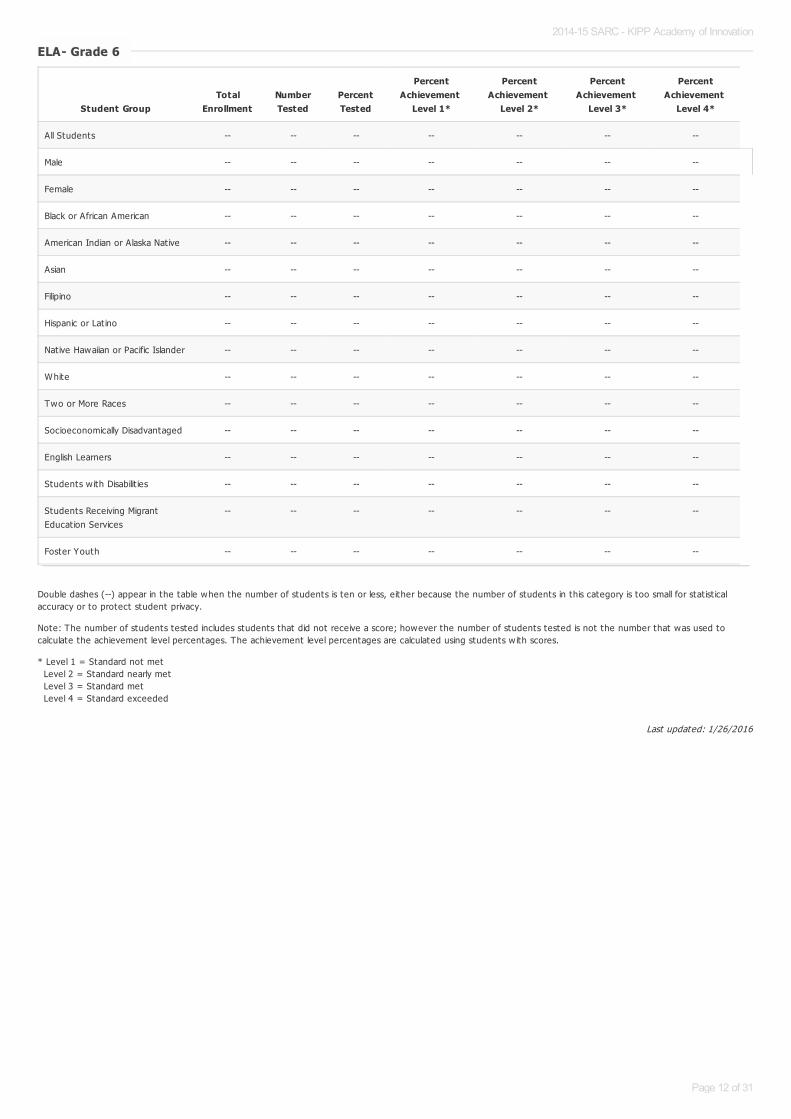
ELA- ELA- Grade 6Grade 6
Student GroupTotal
EnrollmentNumberTested
PercentTested
PercentAchievement
Level 1*
PercentAchievement
Level 2*
PercentAchievement
Level 3*
PercentAchievement
Level 4*
All Students -- -- -- -- -- -- --
Male -- -- -- -- -- -- --
Female -- -- -- -- -- -- --
Black or African American -- -- -- -- -- -- --
American Indian or Alaska Nat ive -- -- -- -- -- -- --
Asian -- -- -- -- -- -- --
Filipino -- -- -- -- -- -- --
Hispanic or Lat ino -- -- -- -- -- -- --
Nat ive Hawaiian or Pacific Islander -- -- -- -- -- -- --
White -- -- -- -- -- -- --
Two or More Races -- -- -- -- -- -- --
Socioeconomically Disadvantaged -- -- -- -- -- -- --
English Learners -- -- -- -- -- -- --
Students w ith Disabilit ies -- -- -- -- -- -- --
Students Receiving MigrantEducat ion Services
-- -- -- -- -- -- --
Foster Youth -- -- -- -- -- -- --
2014-15 SARC - KIPP Academy of Innovation
Page 12 of 31

Last updated: 1/26/2016
Double dashes (--) appear in the table when the number of students is ten or less, either because the number of students in this category is too small for stat ist icalaccuracy or to protect student privacy.
Note: The number of students tested includes students that did not receive a score; however the number of students tested is not the number that was used tocalculate the achievement level percentages. The achievement level percentages are calculated using students w ith scores.
* Level 1 = Standard not met Level 2 = Standard nearly met Level 3 = Standard met Level 4 = Standard exceeded
ELA - Grade 7ELA - Grade 7
Student GroupTotal
EnrollmentNumberTested
PercentTested
PercentAchievement
Level 1*
PercentAchievement
Level 2*
PercentAchievement
Level 3*
PercentAchievement
Level 4*
All Students -- -- -- -- -- -- --
Male -- -- -- -- -- -- --
Female -- -- -- -- -- -- --
Black or African American -- -- -- -- -- -- --
American Indian or Alaska Nat ive -- -- -- -- -- -- --
Asian -- -- -- -- -- -- --
Filipino -- -- -- -- -- -- --
Hispanic or Lat ino -- -- -- -- -- -- --
Nat ive Hawaiian or Pacific Islander -- -- -- -- -- -- --
White -- -- -- -- -- -- --
Two or More Races -- -- -- -- -- -- --
Socioeconomically Disadvantaged -- -- -- -- -- -- --
English Learners -- -- -- -- -- -- --
Students w ith Disabilit ies -- -- -- -- -- -- --
Students Receiving MigrantEducat ion Services
-- -- -- -- -- -- --
Foster Youth -- -- -- -- -- -- --
2014-15 SARC - KIPP Academy of Innovation
Page 13 of 31
Last updated: 1/26/2016
Double dashes (--) appear in the table when the number of students is ten or less, either because the number of students in this category is too small for stat ist icalaccuracy or to protect student privacy.
Note: The number of students tested includes students that did not receive a score; however the number of students tested is not the number that was used tocalculate the achievement level percentages. The achievement level percentages are calculated using students w ith scores.
* Level 1 = Standard not met Level 2 = Standard nearly met Level 3 = Standard met Level 4 = Standard exceeded
ELA - Grade 8ELA - Grade 8
Student GroupTotal
EnrollmentNumberTested
PercentTested
PercentAchievement
Level 1*
PercentAchievement
Level 2*
PercentAchievement
Level 3*
PercentAchievement
Level 4*
All Students -- -- -- -- -- -- --
Male -- -- -- -- -- -- --
Female -- -- -- -- -- -- --
Black or African American -- -- -- -- -- -- --
American Indian or Alaska Nat ive -- -- -- -- -- -- --
Asian -- -- -- -- -- -- --
Filipino -- -- -- -- -- -- --
Hispanic or Lat ino -- -- -- -- -- -- --
Nat ive Hawaiian or Pacific Islander -- -- -- -- -- -- --
White -- -- -- -- -- -- --
Two or More Races -- -- -- -- -- -- --
Socioeconomically Disadvantaged -- -- -- -- -- -- --
English Learners -- -- -- -- -- -- --
Students w ith Disabilit ies -- -- -- -- -- -- --
Students Receiving MigrantEducat ion Services
-- -- -- -- -- -- --
Foster Youth -- -- -- -- -- -- --
2014-15 SARC - KIPP Academy of Innovation
Page 14 of 31

Last updated: 1/26/2016
Double dashes (--) appear in the table when the number of students is ten or less, either because the number of students in this category is too small for stat ist icalaccuracy or to protect student privacy.
Note: The number of students tested includes students that did not receive a score; however the number of students tested is not the number that was used tocalculate the achievement level percentages. The achievement level percentages are calculated using students w ith scores.
* Level 1 = Standard not met Level 2 = Standard nearly met Level 3 = Standard met Level 4 = Standard exceeded
ELA - Grade 11ELA - Grade 11
Student GroupTotal
EnrollmentNumberTested
PercentTested
PercentAchievement
Level 1*
PercentAchievement
Level 2*
PercentAchievement
Level 3*
PercentAchievement
Level 4*
All Students -- -- -- -- -- -- --
Male -- -- -- -- -- -- --
Female -- -- -- -- -- -- --
Black or African American -- -- -- -- -- -- --
American Indian or Alaska Nat ive -- -- -- -- -- -- --
Asian -- -- -- -- -- -- --
Filipino -- -- -- -- -- -- --
Hispanic or Lat ino -- -- -- -- -- -- --
Nat ive Hawaiian or Pacific Islander -- -- -- -- -- -- --
White -- -- -- -- -- -- --
Two or More Races -- -- -- -- -- -- --
Socioeconomically Disadvantaged -- -- -- -- -- -- --
English Learners -- -- -- -- -- -- --
Students w ith Disabilit ies -- -- -- -- -- -- --
Students Receiving MigrantEducat ion Services
-- -- -- -- -- -- --
Foster Youth -- -- -- -- -- -- --
2014-15 SARC - KIPP Academy of Innovation
Page 15 of 31
Last updated: 1/26/2016
Double dashes (--) appear in the table when the number of students is ten or less, either because the number of students in this category is too small for stat ist icalaccuracy or to protect student privacy.
Note: The number of students tested includes students that did not receive a score; however the number of students tested is not the number that was used tocalculate the achievement level percentages. The achievement level percentages are calculated using students w ith scores.
* Level 1 = Standard not met Level 2 = Standard nearly met Level 3 = Standard met Level 4 = Standard exceeded
CAASPP Assessment Results - Mathematics CAASPP Assessment Results - Mathematics
Disaggregated by Student Groups, Grades Three through Eight and Eleven (School Year 2014-15)Disaggregated by Student Groups, Grades Three through Eight and Eleven (School Year 2014-15)
Mathematics - Grade 3Mathematics - Grade 3
Student GroupTotal
EnrollmentNumberTested
PercentTested
PercentAchievement
Level 1*
PercentAchievement
Level 2*
PercentAchievement
Level 3*
PercentAchievement
Level 4*
All Students -- -- -- -- -- -- --
Male -- -- -- -- -- -- --
Female -- -- -- -- -- -- --
Black or African American -- -- -- -- -- -- --
American Indian or Alaska Nat ive -- -- -- -- -- -- --
Asian -- -- -- -- -- -- --
Filipino -- -- -- -- -- -- --
Hispanic or Lat ino -- -- -- -- -- -- --
Nat ive Hawaiian or Pacific Islander -- -- -- -- -- -- --
White -- -- -- -- -- -- --
Two or More Races -- -- -- -- -- -- --
Socioeconomically Disadvantaged -- -- -- -- -- -- --
English Learners -- -- -- -- -- -- --
Students w ith Disabilit ies -- -- -- -- -- -- --
Students Receiving MigrantEducat ion Services
-- -- -- -- -- -- --
Foster Youth -- -- -- -- -- -- --
2014-15 SARC - KIPP Academy of Innovation
Page 16 of 31

Last updated: 1/26/2016
Double dashes (--) appear in the table when the number of students is ten or less, either because the number of students in this category is too small for stat ist icalaccuracy or to protect student privacy.
Note: The number of students tested includes students that did not receive a score; however the number of students tested is not the number that was used tocalculate the achievement level percentages. The achievement level percentages are calculated using students w ith scores.
* Level 1 = Standard not met Level 2 = Standard nearly met Level 3 = Standard met Level 4 = Standard exceeded
Mathematics - Grade 4Mathematics - Grade 4
Student GroupTotal
EnrollmentNumberTested
PercentTested
PercentAchievement
Level 1*
PercentAchievement
Level 2*
PercentAchievement
Level 3*
PercentAchievement
Level 4*
All Students -- -- -- -- -- -- --
Male -- -- -- -- -- -- --
Female -- -- -- -- -- -- --
Black or African American -- -- -- -- -- -- --
American Indian or Alaska Nat ive -- -- -- -- -- -- --
Asian -- -- -- -- -- -- --
Filipino -- -- -- -- -- -- --
Hispanic or Lat ino -- -- -- -- -- -- --
Nat ive Hawaiian or Pacific Islander -- -- -- -- -- -- --
White -- -- -- -- -- -- --
Two or More Races -- -- -- -- -- -- --
Socioeconomically Disadvantaged -- -- -- -- -- -- --
English Learners -- -- -- -- -- -- --
Students w ith Disabilit ies -- -- -- -- -- -- --
Students Receiving MigrantEducat ion Services
-- -- -- -- -- -- --
Foster Youth -- -- -- -- -- -- --
2014-15 SARC - KIPP Academy of Innovation
Page 17 of 31

Last updated: 1/26/2016
Double dashes (--) appear in the table when the number of students is ten or less, either because the number of students in this category is too small for stat ist icalaccuracy or to protect student privacy.
Note: The number of students tested includes students that did not receive a score; however the number of students tested is not the number that was used tocalculate the achievement level percentages. The achievement level percentages are calculated using students w ith scores.
* Level 1 = Standard not met Level 2 = Standard nearly met Level 3 = Standard met Level 4 = Standard exceeded
Mathematics - Grade 5Mathematics - Grade 5
Student GroupTotal
EnrollmentNumberTested
PercentTested
PercentAchievement
Level 1*
PercentAchievement
Level 2*
PercentAchievement
Level 3*
PercentAchievement
Level 4*
All Students 103 102 99.0% 11.0% 36.0% 27.0% 25.0%
Male 103 50 48.5% 14.0% 36.0% 26.0% 24.0%
Female 103 52 50.5% 8.0% 37.0% 29.0% 27.0%
Black or African American 103 1 1.0% -- -- -- --
American Indian or Alaska Nat ive 0 0 0.0% 0.0% 0.0% 0.0% 0.0%
Asian 0 0 0.0% 0.0% 0.0% 0.0% 0.0%
Filipino 0 0 0.0% 0.0% 0.0% 0.0% 0.0%
Hispanic or Lat ino 103 101 98.1% 11.0% 37.0% 27.0% 26.0%
Native Hawaiian or Pacific Islander 0 0 0.0% 0.0% 0.0% 0.0% 0.0%
White 0 0 0.0% 0.0% 0.0% 0.0% 0.0%
Two or More Races 0 0 0.0% 0.0% 0.0% 0.0% 0.0%
Socioeconomically Disadvantaged 103 93 90.3% 12.0% 38.0% 28.0% 23.0%
English Learners 103 18 17.5% 28.0% 39.0% 33.0% 0.0%
Students w ith Disabilit ies 103 5 4.9% -- -- -- --
Students Receiving MigrantEducat ion Services
103 1 1.0% -- -- -- --
Foster Youth -- -- -- -- -- -- --
2014-15 SARC - KIPP Academy of Innovation
Page 18 of 31

Last updated: 1/26/2016
Double dashes (--) appear in the table when the number of students is ten or less, either because the number of students in this category is too small for stat ist icalaccuracy or to protect student privacy.
Note: The number of students tested includes students that did not receive a score; however the number of students tested is not the number that was used tocalculate the achievement level percentages. The achievement level percentages are calculated using students w ith scores.
* Level 1 = Standard not met Level 2 = Standard nearly met Level 3 = Standard met Level 4 = Standard exceeded
Mathematics - Grade 6Mathematics - Grade 6
Student GroupTotal
EnrollmentNumberTested
PercentTested
PercentAchievement
Level 1*
PercentAchievement
Level 2*
PercentAchievement
Level 3*
PercentAchievement
Level 4*
All Students -- -- -- -- -- -- --
Male -- -- -- -- -- -- --
Female -- -- -- -- -- -- --
Black or African American -- -- -- -- -- -- --
American Indian or Alaska Nat ive -- -- -- -- -- -- --
Asian -- -- -- -- -- -- --
Filipino -- -- -- -- -- -- --
Hispanic or Lat ino -- -- -- -- -- -- --
Nat ive Hawaiian or Pacific Islander -- -- -- -- -- -- --
White -- -- -- -- -- -- --
Two or More Races -- -- -- -- -- -- --
Socioeconomically Disadvantaged -- -- -- -- -- -- --
English Learners -- -- -- -- -- -- --
Students w ith Disabilit ies -- -- -- -- -- -- --
Students Receiving MigrantEducat ion Services
-- -- -- -- -- -- --
Foster Youth -- -- -- -- -- -- --
2014-15 SARC - KIPP Academy of Innovation
Page 19 of 31

Last updated: 1/26/2016
Double dashes (--) appear in the table when the number of students is ten or less, either because the number of students in this category is too small for stat ist icalaccuracy or to protect student privacy.
Note: The number of students tested includes students that did not receive a score; however the number of students tested is not the number that was used tocalculate the achievement level percentages. The achievement level percentages are calculated using students w ith scores.
* Level 1 = Standard not met Level 2 = Standard nearly met Level 3 = Standard met Level 4 = Standard exceeded
Mathematics - Grade 7Mathematics - Grade 7
Student GroupTotal
EnrollmentNumberTested
PercentTested
PercentAchievement
Level 1*
PercentAchievement
Level 2*
PercentAchievement
Level 3*
PercentAchievement
Level 4*
All Students -- -- -- -- -- -- --
Male -- -- -- -- -- -- --
Female -- -- -- -- -- -- --
Black or African American -- -- -- -- -- -- --
American Indian or Alaska Nat ive -- -- -- -- -- -- --
Asian -- -- -- -- -- -- --
Filipino -- -- -- -- -- -- --
Hispanic or Lat ino -- -- -- -- -- -- --
Nat ive Hawaiian or Pacific Islander -- -- -- -- -- -- --
White -- -- -- -- -- -- --
Two or More Races -- -- -- -- -- -- --
Socioeconomically Disadvantaged -- -- -- -- -- -- --
English Learners -- -- -- -- -- -- --
Students w ith Disabilit ies -- -- -- -- -- -- --
Students Receiving MigrantEducat ion Services
-- -- -- -- -- -- --
Foster Youth -- -- -- -- -- -- --
2014-15 SARC - KIPP Academy of Innovation
Page 20 of 31
Last updated: 1/26/2016
Double dashes (--) appear in the table when the number of students is ten or less, either because the number of students in this category is too small for stat ist icalaccuracy or to protect student privacy.
Note: The number of students tested includes students that did not receive a score; however the number of students tested is not the number that was used tocalculate the achievement level percentages. The achievement level percentages are calculated using students w ith scores.
* Level 1 = Standard not met Level 2 = Standard nearly met Level 3 = Standard met Level 4 = Standard exceeded
Mathematics - Grade 8Mathematics - Grade 8
Student GroupTotal
EnrollmentNumberTested
PercentTested
PercentAchievement
Level 1*
PercentAchievement
Level 2*
PercentAchievement
Level 3*
PercentAchievement
Level 4*
All Students -- -- -- -- -- -- --
Male -- -- -- -- -- -- --
Female -- -- -- -- -- -- --
Black or African American -- -- -- -- -- -- --
American Indian or Alaska Nat ive -- -- -- -- -- -- --
Asian -- -- -- -- -- -- --
Filipino -- -- -- -- -- -- --
Hispanic or Lat ino -- -- -- -- -- -- --
Nat ive Hawaiian or Pacific Islander -- -- -- -- -- -- --
White -- -- -- -- -- -- --
Two or More Races -- -- -- -- -- -- --
Socioeconomically Disadvantaged -- -- -- -- -- -- --
English Learners -- -- -- -- -- -- --
Students w ith Disabilit ies -- -- -- -- -- -- --
Students Receiving MigrantEducat ion Services
-- -- -- -- -- -- --
Foster Youth -- -- -- -- -- -- --
2014-15 SARC - KIPP Academy of Innovation
Page 21 of 31

Last updated: 1/26/2016
Double dashes (--) appear in the table when the number of students is ten or less, either because the number of students in this category is too small for stat ist icalaccuracy or to protect student privacy.
Note: The number of students tested includes students that did not receive a score; however the number of students tested is not the number that was used tocalculate the achievement level percentages. The achievement level percentages are calculated using students w ith scores.
* Level 1 = Standard not met Level 2 = Standard nearly met Level 3 = Standard met Level 4 = Standard exceeded
Mathematics - Grade 11Mathematics - Grade 11
Student GroupTotal
EnrollmentNumberTested
PercentTested
PercentAchievement
Level 1*
PercentAchievement
Level 2*
PercentAchievement
Level 3*
PercentAchievement
Level 4*
All Students -- -- -- -- -- -- --
Male -- -- -- -- -- -- --
Female -- -- -- -- -- -- --
Black or African American -- -- -- -- -- -- --
American Indian or Alaska Nat ive -- -- -- -- -- -- --
Asian -- -- -- -- -- -- --
Filipino -- -- -- -- -- -- --
Hispanic or Lat ino -- -- -- -- -- -- --
Nat ive Hawaiian or Pacific Islander -- -- -- -- -- -- --
White -- -- -- -- -- -- --
Two or More Races -- -- -- -- -- -- --
Socioeconomically Disadvantaged -- -- -- -- -- -- --
English Learners -- -- -- -- -- -- --
Students w ith Disabilit ies -- -- -- -- -- -- --
Students Receiving MigrantEducat ion Services
-- -- -- -- -- -- --
Foster Youth -- -- -- -- -- -- --
2014-15 SARC - KIPP Academy of Innovation
Page 22 of 31
Last updated: 1/26/2016
Last updated: 1/26/2016
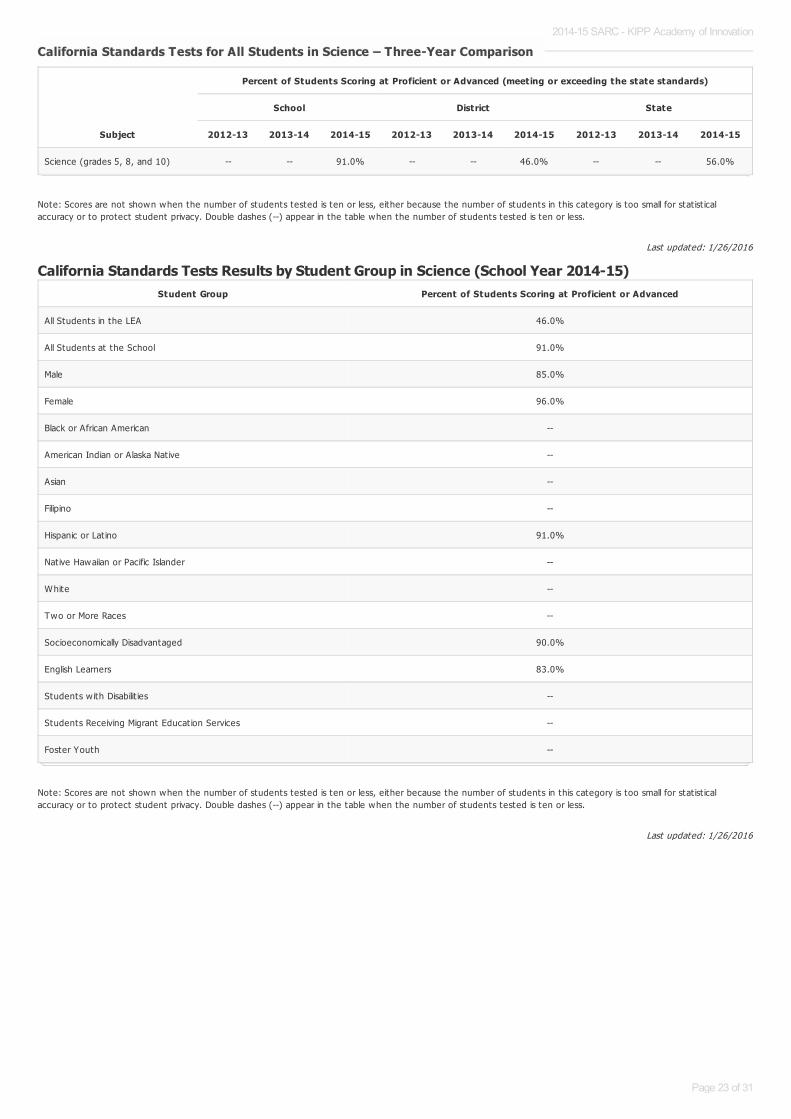
Note: Scores are not shown when the number of students tested is ten or less, either because the number of students in this category is too small for stat ist icalaccuracy or to protect student privacy. Double dashes (--) appear in the table when the number of students tested is ten or less.
California Standards Tests Results by Student Group in Science (School Year 2014-15)
Note: Scores are not shown when the number of students tested is ten or less, either because the number of students in this category is too small for stat ist icalaccuracy or to protect student privacy. Double dashes (--) appear in the table when the number of students tested is ten or less.
California Standards Tests for All Students in Science – Three-Year ComparisonCalifornia Standards Tests for All Students in Science – Three-Year Comparison
Subject
Percent of Students Scoring at Proficient or Advanced (meeting or exceeding the state standards)
School District State
2012-13 2013-14 2014-15 2012-13 2013-14 2014-15 2012-13 2013-14 2014-15
Science (grades 5, 8, and 10) -- -- 91.0% -- -- 46.0% -- -- 56.0%
Student Group Percent of Students Scoring at Proficient or Advanced
All Students in the LEA 46.0%
All Students at the School 91.0%
Male 85.0%
Female 96.0%
Black or African American --
American Indian or Alaska Nat ive --
Asian --
Filipino --
Hispanic or Lat ino 91.0%
Native Hawaiian or Pacific Islander --
White --
Two or More Races --
Socioeconomically Disadvantaged 90.0%
English Learners 83.0%
Students w ith Disabilit ies --
Students Receiving Migrant Educat ion Services --
Foster Youth --
2014-15 SARC - KIPP Academy of Innovation
Page 23 of 31

State Priority: Other Pupil Outcomes
The SARC provides the follow ing information relevant to the State priority: Other Pupil Outcomes (Priority 8):
Pupil outcomes in the subject areas of English, mathematics, and physical educat ion
2014-15 SARC - KIPP Academy of Innovation
Page 24 of 31

Last updated: 1/26/2016
Last updated: 1/26/2016
C. Engagement
State Priority: Parental Involvement
The SARC provides the follow ing information relevant to the State priority: Parental Involvement (Priority 3):
Efforts the school district makes to seek parent input in making decisions for the school district and each schoolsite
State Priority: Pupil Engagement
The SARC provides the follow ing information relevant to the State priority: Pupil Engagement (Priority 5):
High school dropout rates; andHigh school graduat ion rates
Opportunities for Parental Involvement - Most Recent YearOpportunities for Parental Involvement - Most Recent Year
All families are encouraged to have an act ive role At KIPP Academy of Innovat ion. Families are invited to part icpate in various school events and meetingsthroughout the year, such as Coffee w ith the Principal, parent educat ion workshops, student-led Conferences, and Team and Family act ivit ies. In spring 2014parents were involved w ith the development of the 2014-15 LCAP. Families are also given the opportunity to be leaders in the school's community bypart icipat ing in the Innovat ion Parent Council and by co-facilitat ing school-w ide fundraising efforts. In addit ion, parents are welcomed to serve as volunteers oncampus and assist w ith student supervision. Volunteer opportunites are announced via our weekly Family Bullet in, calls, not ices, and school website.
Dropout Rate and Graduation Rate (Four-Year Cohort Rate)Dropout Rate and Graduation Rate (Four-Year Cohort Rate)
Indicator
School District State
2011-12 2012-13 2013-14 2011-12 2012-13 2013-14 2011-12 2012-13 2013-14
Dropout Rate 0.0% 0.0% 0.0% 0.0% 0.0% 0.0% 13.1% 11.4% 11.5%
Graduat ion Rate 0.00 0.00 0.00 66.60 68.10 70.20 78.87 80.44 80.95
Dropout/Graduation Rate (Four-Year Cohort Rate) Chart
2011-12 2012-13 2013-14-1.0
-0.5
0.0
0.5
1.0Dropout Rate
Graduation Rate
2014-15 SARC - KIPP Academy of Innovation
Page 25 of 31

Completion of High School Graduation RequirementsCompletion of High School Graduation Requirements
Student Group
Graduating Class of 2014
School District State
All Students -- 70 84
Black or African American -- 62 76
American Indian or Alaska Nat ive -- 64 78
Asian -- 79 92
Filipino -- 90 96
Hispanic or Lat ino -- 72 81
Native Hawaiian or Pacific Islander -- 59 83
White -- 72 89
Two or More Races -- 74 82
Socioeconomically Disadvantaged -- 69 81
English Learners -- 38 50
Students w ith Disabilit ies -- 43 61
Foster Youth -- -- --
2014-15 SARC - KIPP Academy of Innovation
Page 26 of 31

Last updated: 1/26/2016
Last updated: 1/26/2016
Last updated: 1/26/2016
State Priority: School Climate
The SARC provides the follow ing information relevant to the State priority: School Climate (Priority 6):
Pupil suspension rates;Pupil expulsion rates; andOther local measures on the sense of safety
School Safety Plan - Most Recent Year
Suspensions and ExpulsionsSuspensions and Expulsions
School District State
Rate 2012-13 2013-14 2014-15 2012-13 2013-14 2014-15 2012-13 2013-14 2014-15
Suspensions 0.0 0.0 1.8 1.7 1.3 0.9 5.1 4.4 3.8
Expulsions 0.0 0.0 0.0 0.0 0.0 0.0 0.1 0.1 0.1
Suspensions
2012-13 2013-14 2014-150.0
1.0
2.0
3.0
4.0
5.0
6.0School Suspensions
District Suspensions
State Suspensions
Expulsions
2012-13 2013-14 2014-150.00
0.02
0.04
0.06
0.08
0.10
0.12School Expulsions
District Expulsions
State Expulsions
KIPP Academy of Innovat ion's Emergency Reponse Plan for the 2016-16 school year was implemented in August 2015. All aspects of the plan - descript ions ofemergency response roles, types of evacuat ions, evacuat ion and drill procedures, locat ion of emergency supplies, emergency signals, and evacuat ion routes -were reviewed and discussed w ith all staff members in September 2015. Monthly drills are conducted and every classroom is equipped w ith a copy of the site'sEmergency Reponse Plan, evacuat ion map, and an emergency backpack.
2014-15 SARC - KIPP Academy of Innovation
Page 27 of 31

Last updated: 1/26/2016
Last updated: 1/26/2016
Last updated: 2/1/2016
D. Other SARC InformationThe information in this sect ion is required to be in the SARC but is not included in the state priorit ies for LCFF.
Note: Cells w ith NA values do not require data.
Average Class Size and Class Size Distribution (Elementary)
* Number of classes indicates how many classes fall into each size category (a range of total students per class).
Adequate Yearly Progress Overall and by Criteria (School Year 2014-15)Adequate Yearly Progress Overall and by Criteria (School Year 2014-15)
AYP Criteria School District State
Made AYP Overall Yes Yes
Met Part icipat ion Rate - English Language Arts Yes Yes
Met Part icipat ion Rate - Mathematics Yes Yes
Met Percent Proficient - English Language Arts N/A No
Met Percent Proficient - Mathematics N/A No
Met Attendance Rate Yes
Met Graduat ion Rate N/A N/A
Federal Intervention Program (School Year 2015-16)Federal Intervention Program (School Year 2015-16)
Indicator School District
Program Improvement Status In PI
First Year of Program Improvement 2004-2005
Year in Program Improvement Year 5
Number of Schools Current ly in Program Improvement N/A 654
Percent of Schools Current ly in Program Improvement N/A 82.6%
2012-13 2013-14 2014-15
Grade Level Average Class Size
Number of Classes *
Average Class Size
Number of Classes *
Average Class Size
Number of Classes *
1-20 21-32 33+ 1-20 21-32 33+ 1-20 21-32 33+
K
1
2
3
4
5 32.0 0 3 0
6
Other
2014-15 SARC - KIPP Academy of Innovation
Page 28 of 31

Last updated: 1/26/2016
Last updated: 1/28/2016
* Number of classes indicates how many classrooms fall into each size category (a range of total students per classroom). At the secondary school level, this information isreported by subject area rather than grade level.
Academic Counselors and Other Support Staff (School Year 2014-15)
Note: Cells w ith N/A values do not require data.
*One Full T ime Equivalent (FTE) equals one staff member working full t ime; one FTE could also represent two staff members who each work 50 percent of full t ime.
Average Class Size and Class Size Distribution (Secondary)Average Class Size and Class Size Distribution (Secondary)
2012-13 2013-14 2014-15
Subject Average Class Size
Number of Classes *
Average Class Size
Number of Classes *
Average Class Size
Number of Classes *
1-22 23-32 33+ 1-22 23-32 33+ 1-22 23-32 33+
English
Mathematics
Science
Social Science
Title Number of FTE* Assigned to School Average Number of Students per Academic Counselor
Academic Counselor
Counselor (Social/Behavioral or Career Development) N/A
Library Media Teacher (librarian) N/A
Library Media Services Staff (paraprofessional) N/A
Psychologist 0.3 N/A
Social Worker 0.2 N/A
Nurse 0.2 N/A
Speech/Language/Hearing Specialist 0.2 N/A
Resource Specialist (non-teaching) N/A
Other 0.5 N/A
2014-15 SARC - KIPP Academy of Innovation
Page 29 of 31

Last updated: 1/26/2016
Last updated: 1/26/2016
For detailed information on salaries, see the CDE Cert ificated Salaries & Benefits Web page at http://www.cde.ca.gov/ds/fd/cs/ .
Types of Services Funded (Fiscal Year 2014-15)Types of Services Funded (Fiscal Year 2014-15)
KIPP Academy of Innovat ion offers an afterschool program that is ASES funded. The main goal of our afterschool program is to support students by providingliteracy and enrichment act ivit ies. Everyday students receive academic assistance in the core subject areas of reading, language artes, mathematics and science.They also part icipate in extracurricular act ivit ies such as drill, photography, music, dance, sports, and cheerleading.
Teacher and Administrative Salaries (Fiscal Year 2013-14)Teacher and Administrative Salaries (Fiscal Year 2013-14)
Category District Amount State Average For Districts In Same Category
Beginning Teacher Salary $39,788 $43,165
Mid-Range Teacher Salary $63,553 $68,574
Highest Teacher Salary $78,906 $89,146
Average Principal Salary (Elementary) $105,723 $111,129
Average Principal Salary (Middle) $115,222 $116,569
Average Principal Salary (High) $116,595 $127,448
Superintendent Salary $350,000 $234,382
Percent of Budget for Teacher Salaries 35.0% 38.0%
Percent of Budget for Administrat ive Salaries 5.0% 5.0%
Teacher Salary Chart
Beginning Teacher Salary Mid-Range Teacher Salary Highest Teacher Salary0
10000
20000
30000
40000
50000
60000
70000
80000
90000
Principal Salary Chart
Average Principal Salary
(Elementary)
Average Principal Salary
(Middle)
Average Principal Salary
(High)
0
20000
40000
60000
80000
100000
120000
2014-15 SARC - KIPP Academy of Innovation
Page 30 of 31
Last updated: 1/26/2016
Last updated: 1/26/2016
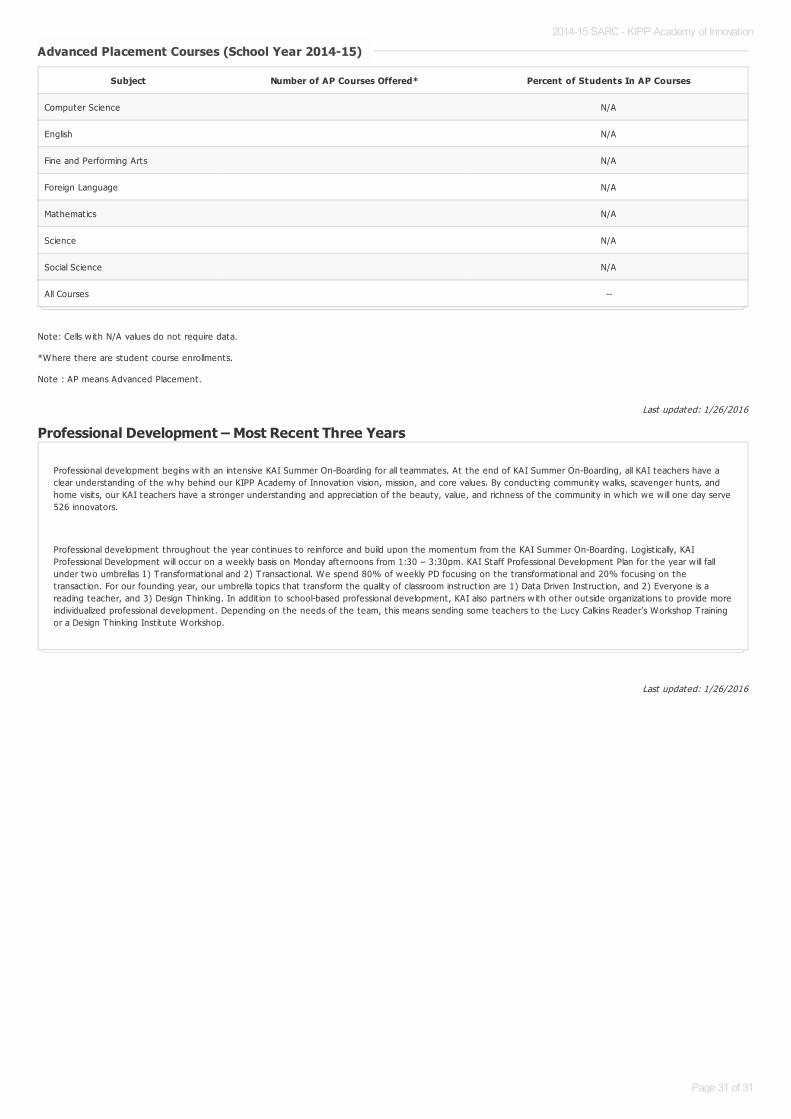
Note: Cells w ith N/A values do not require data.
*Where there are student course enrollments.
Note : AP means Advanced Placement.
Professional Development – Most Recent Three Years
Advanced Placement Courses (School Year 2014-15)Advanced Placement Courses (School Year 2014-15)
Subject Number of AP Courses Offered* Percent of Students In AP Courses
Computer Science N/A
English N/A
Fine and Performing Arts N/A
Foreign Language N/A
Mathematics N/A
Science N/A
Social Science N/A
All Courses --
Professional development begins w ith an intensive KAI Summer On-Boarding for all teammates. At the end of KAI Summer On-Boarding, all KAI teachers have aclear understanding of the why behind our KIPP Academy of Innovat ion vision, mission, and core values. By conduct ing community walks, scavenger hunts, andhome visits, our KAI teachers have a stronger understanding and appreciat ion of the beauty, value, and richness of the community in which we w ill one day serve526 innovators.
Professional development throughout the year cont inues to reinforce and build upon the momentum from the KAI Summer On-Boarding. Logist ically, KAIProfessional Development w ill occur on a weekly basis on Monday afternoons from 1:30 – 3:30pm. KAI Staff Professional Development Plan for the year w ill fallunder two umbrellas 1) Transformational and 2) Transact ional. We spend 80% of weekly PD focusing on the transformational and 20% focusing on thetransact ion. For our founding year, our umbrella topics that transform the quality of classroom instruct ion are 1) Data Driven Instruct ion, and 2) Everyone is areading teacher, and 3) Design Thinking. In addit ion to school-based professional development, KAI also partners w ith other outside organizat ions to provide moreindividualized professional development. Depending on the needs of the team, this means sending some teachers to the Lucy Calkins Reader’s Workshop Trainingor a Design Thinking Inst itute Workshop.
2014-15 SARC - KIPP Academy of Innovation
Page 31 of 31