sast master feeder statutory prospectus - annuities · pdf fileportfolio is part of a...
TRANSCRIPT

PROSPECTUSMay 1, 2017
SUNAMERICA SERIES TRUST(Class 1 and Class 3 Shares)
American Funds® Growth SAST PortfolioAmerican Funds® Global Growth SAST PortfolioAmerican Funds® Growth-Income SAST PortfolioAmerican Funds® Asset Allocation SAST PortfolioVCPSM Managed Asset Allocation SAST Portfolio
This Prospectus contains information you should know before investing, including information about risks. Please readit before you invest and keep it for future reference.
The Securities and Exchange Commission and the Commodity Futures Trading Commission have not approved ordisapproved these securities or passed upon the adequacy of this Prospectus. Any representation to the contrary is acriminal offense.

Topic Page
Portfolio Summaries ................................................................................................................................................................ 1American Funds® Growth SAST Portfolio .................................................................................................................... 1American Funds® Global Growth SAST Portfolio ........................................................................................................ 4American Funds® Growth-Income SAST Portfolio ....................................................................................................... 7American Funds® Asset Allocation SAST Portfolio ...................................................................................................... 10VCPSM Managed Asset Allocation SAST Portfolio ....................................................................................................... 14
Important Additional Information ........................................................................................................................................... 21SunAmerica Series Trust: A Quick Note About the Portfolios................................................................................................ 22Account Information ............................................................................................................................................................... 24Transaction Policies ................................................................................................................................................................. 25Dividend Policies and Taxes .................................................................................................................................................... 27Portfolio Details ....................................................................................................................................................................... 28Management............................................................................................................................................................................. 33Financial Highlights................................................................................................................................................................. 38For More Information .............................................................................................................................................................. 41
TABLE OF CONTENTS
- i -
Investment Goal
The Portfolio’s investment goal is growth.
Fees and Expenses of the Portfolio
This table describes the fees and expenses that you may pay ifyou buy and hold shares of the Portfolio. The Portfolio’s annualoperating expenses do not reflect the separate account feescharged in the variable annuity or variable life insurance policy(“Variable Contracts”) in which the Portfolio is offered. If theseparate account’s fees were shown, the Portfolio’s annualoperating expenses would be higher. Please see your VariableContract prospectus for more details on the separate accountfees.
Annual Portfolio Operating Expenses1
(expenses that you payeach year as a percentage of the value of your investment)
Class 1 Class 3
Management Fees ......................................... 1.18% 1.18%Service (12b-1) Fees..................................... None 0.25%Other Expenses2 ........................................... 0.05% 0.05%Total Annual Portfolio Operating Expenses . 1.23% 1.48%Fee Waivers and/or Expense
Reimbursements3 ...................................... -0.60% -0.60%Total Annual Portfolio Operating
Expenses After Fee Waivers and/orExpense Reimbursements3........................ 0.63% 0.88%
1 Amounts reflect the total expenses of the Portfolio and the Master GrowthFund (as defined herein).
2 “Other Expenses” for Class 1 shares are based on estimated amounts for thecurrent fiscal year.
3 SunAmerica Asset Management, LLC (“SunAmerica”) has entered into acontractual agreement with SunAmerica Series Trust (the “Trust”) underwhich it will waive 0.60% of its advisory fee for such time as the Portfoliois operated as a feeder fund, because during that time it will not be providingthe portfolio management portion of the advisory and management servicesto be provided under its investment advisory and management agreementwith the Trust. This fee waiver will continue indefinitely as long as thePortfolio is part of a master-feeder fund structure and cannot be reduced oreliminated without Board approval.
Expense Example
This Example is intended to help you compare the cost ofinvesting in the Portfolio with the cost of investing in othermutual funds. The Example assumes that you invest $10,000 inthe Portfolio for the time periods indicated and then redeem allof your shares at the end of those periods. The Example alsoassumes that your investment has a 5% return each year and thatthe Portfolio’s operating expenses remain the same. TheExample does not reflect charges imposed by the VariableContract. If the Variable Contract fees were reflected, theexpenses would be higher. See the Variable Contract prospectusfor information on such charges. The Example reflects theaggregate expenses of both the Master Growth Fund and thePortfolio and assumes that the contractual waiver ofSunAmerica’s advisory fee continues for all periods shown.
Although your actual costs may be higher or lower, based onthese assumptions and the Total Annual Portfolio OperatingExpenses After Fee Waivers and/or Expense Reimbursementsshown in the fee table, your costs would be:
1 Year 3 Years 5 Years 10 Years
Class 1 Shares ............... $64 $202 $351 $ 786Class 3 Shares ............... 90 281 488 1,084
Portfolio Turnover
The Portfolio pays transaction costs, such as commissions,when it buys and sells securities (or “turns over” its portfolio).A higher portfolio turnover rate may indicate higher transactioncosts. These costs, which are not reflected in annual portfoliooperating expenses or in the example, affect the Portfolio’sperformance.
During the most recent fiscal year, the Portfolio’s portfolioturnover rate was 4% of the average value of its portfolio.
Principal Investment Strategies of the Portfolio
The Portfolio described in this Prospectus operates as a “feederfund” and attempts to achieve its investment goal by investingall or substantially all of its assets in Class 1 shares of theAmerican Funds Insurance Series® Growth Fund (the “MasterGrowth Fund”), a portfolio offered by American FundsInsurance Series®, a registered open-end investment company.In turn, the Master Growth Fund seeks to make shareholders’investments grow by investing primarily in common stocks ofcompanies that appear to offer superior opportunities for growthof capital. The Master Growth Fund may invest a portion of itsassets (up to 25%) in securities of issuers domiciled outside theUnited States.
The Master Growth Fund is designed for investors seekingcapital appreciation principally through investment in stocks.Investors in the Portfolio should have a long-term perspectiveand be able to tolerate potentially sharp, short-term declines invalue as the growth-oriented, equity-type securities generallypurchased by the Master Growth Fund may involve large priceswings and potential for loss.
Investment of the Portfolio’s assets in the Master Growth Fundis not a fundamental policy of the Portfolio and a shareholdervote is not required for the Portfolio to withdraw its entireinvestment in the Master Growth Fund.
Principal Risks of Investing in the Portfolio
There can be no assurance that the Portfolio’s investment goalwill be met or that the net return on an investment in thePortfolio will exceed what could have been obtained throughother investment or savings vehicles. Shares of the Portfolio arenot bank deposits and are not guaranteed or insured by any bank,government entity or the Federal Deposit InsuranceCorporation. As with any mutual fund, there is no guarantee that
PORTFOLIO SUMMARY: AMERICAN FUNDS® GROWTH SAST PORTFOLIO
- 1 -
the Portfolio will be able to achieve its investment goal. If thevalue of the assets of the Portfolio goes down, you could losemoney.
The following is a summary description of the principal risks ofinvesting in the Portfolio.
Risks of Investing in Equity Securities. The Portfolio investsprimarily (through its investment in the Master Growth Fund) inequity securities. As with any equity fund, the value of yourinvestment in the Portfolio may fluctuate in response to stockmarket movements. You should be aware that the performanceof various types of equity stocks may rise or decline undervarying market conditions — for example, “value” stocks mayperform well in circumstances under which “growth” stocks ingeneral have fallen, or vice versa. In addition, individual stocksselected for the Master Growth Fund may underperform themarket generally, relevant indices or other funds withcomparable investment objectives or strategies.
Risks of Investing in Growth Stocks. Growth stocks arehistorically volatile, which will affect the Master Growth Fundand the Portfolio. Growth stocks can be volatile for severalreasons. Since the issuers of growth stocks usually reinvest ahigh portion of earnings in their own business, growth stocksmay lack the dividend yield associated with value stocks thatcan cushion total return in a bear market. Also, growth stocksnormally carry a higher price/earnings ratio than many otherstocks. Consequently, if earnings expectations are not met, themarket price of growth stocks will often decline more than otherstocks. However, the market frequently rewards growth stockswith price increases when expectations are met or exceeded.
Risk of Foreign Exposure. The Master Growth Fund mayinvest in foreign securities. Investors in foreign countries aresubject to a number of risks. A principal risk is that fluctuationsin the exchange rates between the U.S. dollar and foreigncurrencies may negatively affect an investment. In addition,there may be less publicly available information about a foreigncompany and it may not be subject to the same uniformaccounting, auditing and financial reporting standards as U.S.companies. Foreign governments may not regulate securitiesmarkets and companies to the same degree as in the U.S. Foreigninvestments will also be affected by local political, social oreconomic developments and governmental actions.Consequently, foreign securities may be less liquid, morevolatile and more difficult to price than U.S. securities. Theserisks may be heightened to the extent the Master Growth Fundinvests in emerging markets.
Market Risk. The Portfolio’s or the Master Growth Fund’s shareprice can fall because of weakness in the broad market, aparticular industry, or specific holdings. The market as a wholecan decline for many reasons, including adverse political oreconomic developments here or abroad, changes in investorpsychology, or heavy institutional selling. The prospects for anindustry or issuer may deteriorate because of a variety of factors,including disappointing earnings or changes in the competitiveenvironment. In addition, the Master Growth Fund’s investmentadviser’s assessment of issuers held in the Master Growth Fundmay prove incorrect, resulting in losses or poor performanceeven in a rising market. Finally, the Master Growth Fund’sinvestment approach could fall out of favor with the investingpublic, resulting in lagging performance versus othercomparable portfolios.
Master-Feeder Structure. Other “feeder” funds may alsoinvest in the Master Growth Fund. As shareholders of the MasterGrowth Fund, feeder funds, including the Portfolio, vote onmatters pertaining to the Master Growth Fund. Feeder fundswith a greater pro rata ownership in the Master Growth Fundcould have effective voting control of the operations of theMaster Growth Fund. Also, a large-scale redemption by anotherfeeder fund may increase the proportionate share of the costs ofthe Master Growth Fund borne by the remaining feeder fundshareholders, including the Portfolio.
You should also refer to the Master Growth Fund’s prospectusthat you received along with your Portfolio Prospectus.Additionally, the statements of additional information for yourPortfolio and the Master Growth Fund are available free ofcharge upon request.
Performance Information
The performance in the bar chart and table below provide someindication of the risks of investing in the Portfolio. Remember,however, that the past performance of the Portfolio is notnecessarily an indication of how it will perform in the future. Noperformance is shown for Class 1 shares because Class 1 sharesdo not have annual returns for a full calendar year. As a result,the bar chart and table give you a picture of the long-termperformance for Class 3 shares of the Portfolio. Theperformance of Class 1 shares would be substantially similar toClass 3 shares and differ only to the extent that Class 1 sharesand Class 3 shares have different expenses. The table shows theaverage annual total returns of Class 3 shares of the Portfolio forcertain time periods compared to the returns of the S&P 500®
Index. The returns shown in the bar chart and table do not
PORTFOLIO SUMMARY: AMERICAN FUNDS® GROWTH SAST PORTFOLIO
- 2 -

include charges that will be imposed by the Variable Contracts.If these amounts were reflected, returns would be less than thoseshown.
(Class 3 Shares)
11.93%
-44.19%
38.96%
18.32%
-4.57%
17.51%
29.76%
8.19% 6.52%9.17%
-50%
-40%
-30%
-20%
-10%
0%
10%
20%
30%
40%
50%
2007 2008 2009 2010 2011 2012 2013 2014 2015 2016
During the 10-year period shown in the bar chart, the highestreturn for a quarter was 18.27% (quarter ended June 30, 2009)and the lowest return for a quarter was -26.16% (quarter endedDecember 31, 2008).
Average Annual Total Returns (For the periods endedDecember 31, 2016)
1Year
5Years
10Years
Class 3 Shares ................................ 9.17% 13.92% 6.52%
S&P 500® Index............................. 11.96% 14.66% 6.95%
Investment Adviser
SunAmerica serves as investment adviser to the Portfoliopursuant to its investment advisory and management agreementwith the Trust so long as the Portfolio is part of a master-feederfund structure. Capital Research and Management Companyserves as investment adviser to the Master Growth Fund.
Portfolio Managers
Name and Title
PortfolioManager of
MasterGrowth Fund
Since
Mark L. CaseyPartner – Capital World Investors .................... 2016
Michael T. KerrPartner – Capital World Investors .................... 2005
Ronald B. MorrowPartner – Capital World Investors .................... 2003
Andraz RazenPartner – Capital World Investors .................... 2013
Martin RomoPartner – Capital World Investors .................... 2016
Alan J. WilsonPartner – Capital World Investors .................... 2013
For important information about purchases and sales ofPortfolio shares, taxes and payments to broker-dealers and otherfinancial intermediaries, please turn to the section “ImportantAdditional Information” on page 21.
PORTFOLIO SUMMARY: AMERICAN FUNDS® GROWTH SAST PORTFOLIO
- 3 -
Investment Goal
The Portfolio’s investment goal is growth.
Fees and Expenses of the Portfolio
This table describes the fees and expenses that you may pay ifyou buy and hold shares of the Portfolio. The Portfolio’s annualoperating expenses do not reflect the separate account feescharged in the variable annuity or variable life insurance policy(“Variable Contracts”) in which the Portfolio is offered. If theseparate account’s fees were shown, the Portfolio’s annualoperating expenses would be higher. Please see your VariableContract prospectus for more details on the separate accountfees.
Annual Portfolio Operating Expenses1
(expenses that you payeach year as a percentage of the value of your investment)
Class 1 Class 3
Management Fees ......................................... 1.48% 1.48%Service (12b-1) Fees..................................... None 0.25%Other Expenses2 ........................................... 0.06% 0.06%Total Annual Portfolio Operating Expenses . 1.54% 1.79%Fee Waivers and/or Expense
Reimbursements3 ...................................... -0.70% -0.70%Total Annual Portfolio Operating
Expenses After Fee Waivers and/orExpense Reimbursements3........................ 0.84% 1.09%
1 Amounts reflect the total expenses of the Portfolio and the Master GlobalGrowth Fund (as defined herein).
2 “Other Expenses” for Class 1 shares are based on estimated amounts for thecurrent fiscal year.
3 SunAmerica Asset Management, LLC (“SunAmerica”) has entered into acontractual agreement with SunAmerica Series Trust (the “Trust”) underwhich it will waive 0.70% of its advisory fee for such time as the Portfoliois operated as a feeder fund, because during that time it will not be providingthe portfolio management portion of the advisory and management servicesto be provided under its investment advisory and management agreementwith the Trust. This fee waiver will continue indefinitely as long as thePortfolio is part of a master-feeder fund structure and cannot be reduced oreliminated without Board approval.
Expense Example
This Example is intended to help you compare the cost ofinvesting in the Portfolio with the cost of investing in othermutual funds. The Example assumes that you invest $10,000 inthe Portfolio for the time periods indicated and then redeem allof your shares at the end of those periods. The Example alsoassumes that your investment has a 5% return each year and thatthe Portfolio’s operating expenses remain the same. TheExample does not reflect charges imposed by the VariableContract. If the Variable Contract fees were reflected, theexpenses would be higher. See the Variable Contract prospectusfor information on such charges. The Example reflects theaggregate expenses of both the Master Global Growth Fund andthe Portfolio and assumes that the contractual waiver of
SunAmerica’s advisory fee continues for all periods shown.Although your actual costs may be higher or lower, based onthese assumptions and the Total Annual Portfolio OperatingExpenses After Fee Waivers and/or Expense Reimbursementsshown in the fee table, your costs would be:
1 Year 3 Years 5 Years 10 Years
Class 1 Shares ............... $ 86 $268 $466 $1,037Class 3 Shares ............... 111 347 601 1,329
Portfolio Turnover
The Portfolio pays transaction costs, such as commissions,when it buys and sells securities (or “turns over” its portfolio).A higher portfolio turnover rate may indicate higher transactioncosts. These costs, which are not reflected in annual portfoliooperating expenses or in the example, affect the Portfolio’sperformance.
During the most recent fiscal year, the Portfolio’s portfolioturnover rate was 10% of the average value of its portfolio.
Principal Investment Strategies of the Portfolio
The Portfolio described in this Prospectus operates as a “feederfund” and attempts to achieve its investment goal by investingall or substantially all of its assets in Class 1 shares of theAmerican Funds Insurance Series® Global Growth Fund (the“Master Global Growth Fund”), a portfolio offered by AmericanFunds Insurance Series®, a registered open-end investmentcompany. The Master Global Growth Fund invests primarily incommon stocks of companies around the world that the MasterGlobal Growth Fund’s investment adviser believes have thepotential for growth. The Master Global Growth Fund willallocate its assets among securities of companies domiciled invarious countries, including the United States and countrieswith emerging markets (but no fewer than three countries).Under normal market conditions, the Master Global GrowthFund will invest significantly in issuers domiciled outside theUnited States (i.e., at least 40% of its net assets, unless marketconditions are not deemed favorable by the Master GlobalGrowth Fund’s investment adviser, in which case the fund wouldinvest at least 30% of its net assets in issuers outside theUnited States). The Master Global Growth Fund is designed forinvestors seeking capital appreciation through stocks. Investorsin the Portfolio should have a long-term perspective and be ableto tolerate potentially sharp, declines in value as the growth-oriented, equity-type securities generally purchased by theMaster Global Growth Fund may involve large price swings andpotential for loss.
Investment of the Portfolio’s assets in the Master Global GrowthFund is not a fundamental policy of the Portfolio and ashareholder vote is not required for the Portfolio to withdraw itsentire investment in the Master Global Growth Fund.
PORTFOLIO SUMMARY: AMERICAN FUNDS® GLOBAL GROWTH SAST PORTFOLIO
- 4 -
Principal Risks of Investing in the Portfolio
There can be no assurance that the Portfolio’s investment goalwill be met or that the net return on an investment in thePortfolio will exceed what could have been obtained throughother investment or savings vehicles. Shares of the Portfolio arenot bank deposits and are not guaranteed or insured by any bank,government entity or the Federal Deposit InsuranceCorporation. As with any mutual fund, there is no guarantee thatthe Portfolio will be able to achieve its investment goal. If thevalue of the assets of the Portfolio goes down, you could losemoney.
The following is a summary description of the principal risks ofinvesting in the Portfolio.
Risks of Investing in Equity Securities. The Portfolio investsprimarily (through its investment in the Master Global GrowthFund) in equity securities. As with any equity fund, the value ofyour investment in the Portfolio may fluctuate in response tostock market movements. You should be aware that theperformance of various types of equity stocks may rise ordecline under varying market conditions — for example,“value” stocks may perform well in circumstances under which“growth” stocks in general have fallen, or vice versa. Inaddition, individual stocks selected for the Master GlobalGrowth Fund may underperform the market generally, relevantindices or other funds with comparable investment objectives orstrategies.
Risks of Investing in Growth Stocks. Growth stocks arehistorically volatile, which will affect the Master Global GrowthFund and the Portfolio. Growth stocks can be volatile for severalreasons. Since the issuers of growth stocks usually reinvest ahigh portion of earnings in their own business, growth stocksmay lack the dividend yield associated with value stocks thatcan cushion total return in a bear market. Also, growth stocksnormally carry a higher price/earnings ratio than many otherstocks. Consequently, if earnings expectations are not met, themarket price of growth stocks will often decline more than otherstocks. However, the market frequently rewards growth stockswith price increases when expectations are met or exceeded.
Risk of Foreign Exposure. The Master Global Growth Fundmay invest in foreign securities. Investors in foreign countriesare subject to a number of risks. A principal risk is thatfluctuations in the exchange rates between the U.S. dollar andforeign currencies may negatively affect an investment. Inaddition, there may be less publicly available information abouta foreign company and it may not be subject to the same uniformaccounting, auditing and financial reporting standards as U.S.companies. Foreign governments may not regulate securitiesmarkets and companies to the same degree as in the U.S. Foreigninvestments will also be affected by local political, social oreconomic developments and governmental actions.Consequently, foreign securities may be less liquid, more
volatile and more difficult to price than U.S. securities. Theserisks may be heightened to the extent the Master Global GrowthFund invests in emerging markets.
Risks of Investing in Emerging Market Countries. Investingin countries with developing economies and/or markets mayinvolve risks in addition to and greater than those generallyassociated with investing in the securities markets of developedcountries. Emerging and developing countries may have lessdeveloped legal and accounting systems than those in developedcountries. The governments of these countries may be moreunstable and more likely to impose capital controls, nationalizea company or industry, place restrictions on foreign ownershipand on withdrawing sale proceeds of securities from the country,and/or impose punitive taxes that could adversely affect theprices of securities. In addition, the value of investments outsidethe United States may be reduced by foreign taxes, includingforeign withholding taxes on interest and dividends. Theeconomies of these countries may be dependent on relativelyfew industries that are more susceptible to local and globalchanges. Securities markets in these countries can also berelatively small and have substantially lower trading volumes.As a result, securities issued in these countries may be morevolatile and less liquid, and may be more difficult to value, thansecurities issued in countries with more developed economies ormarkets. Because these markets may not be as mature, there maybe increased settlement risks for transactions in local securities.
Market Risk. The Portfolio’s or the Master Global GrowthFund’s share price can fall because of weakness in the broadmarket, a particular industry, or specific holdings. The marketas a whole can decline for many reasons, including adversepolitical or economic developments here or abroad, changes ininvestor psychology, or heavy institutional selling. Theprospects for an industry or issuer may deteriorate because of avariety of factors, including disappointing earnings or changesin the competitive environment. In addition, the Master GlobalGrowth Fund’s investment adviser’s assessment of issuers heldin the Master Global Growth Fund may prove incorrect,resulting in losses or poor performance even in a rising market.Finally, the Master Global Growth Fund’s investment approachcould fall out of favor with the investing public, resulting inlagging performance versus other comparable portfolios.
Master-Feeder Structure. Other “feeder” funds may alsoinvest in the Master Global Growth Fund. As shareholders of theMaster Global Growth Fund, feeder funds, including thePortfolio, vote on matters pertaining to the Master GlobalGrowth Fund. Feeder funds with a greater pro rata ownership inthe Master Global Growth Fund could have effective votingcontrol of the operations of the Master Global Growth Fund.Also, a large-scale redemption by another feeder fund mayincrease the proportionate share of the costs of the MasterGlobal Growth Fund borne by the remaining feeder fundshareholders, including the Portfolio.
PORTFOLIO SUMMARY: AMERICAN FUNDS® GLOBAL GROWTH SAST PORTFOLIO
- 5 -
You should also refer to the Master Global Growth Fund’sprospectus that you received along with your PortfolioProspectus. Additionally, the statements of additionalinformation for your Portfolio and the Master Global GrowthFund are available free of charge upon request.
Performance Information
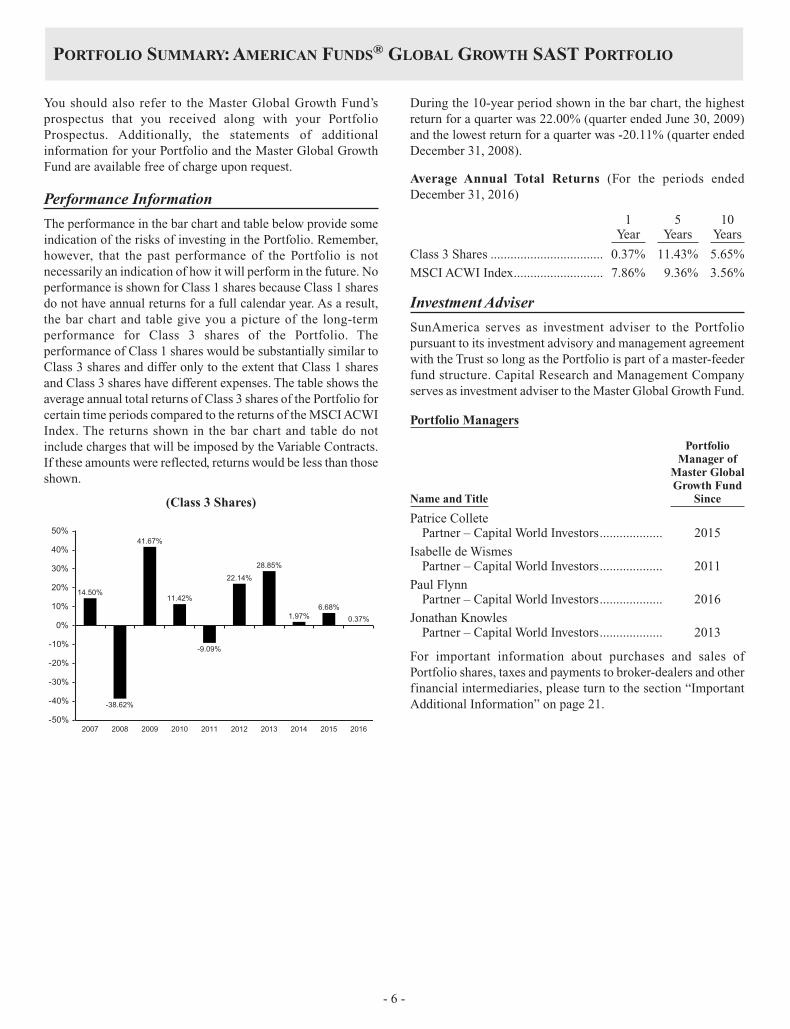
The performance in the bar chart and table below provide someindication of the risks of investing in the Portfolio. Remember,however, that the past performance of the Portfolio is notnecessarily an indication of how it will perform in the future. Noperformance is shown for Class 1 shares because Class 1 sharesdo not have annual returns for a full calendar year. As a result,the bar chart and table give you a picture of the long-termperformance for Class 3 shares of the Portfolio. Theperformance of Class 1 shares would be substantially similar toClass 3 shares and differ only to the extent that Class 1 sharesand Class 3 shares have different expenses. The table shows theaverage annual total returns of Class 3 shares of the Portfolio forcertain time periods compared to the returns of the MSCI ACWIIndex. The returns shown in the bar chart and table do notinclude charges that will be imposed by the Variable Contracts.If these amounts were reflected, returns would be less than thoseshown.
(Class 3 Shares)
14.50%
-38.62%
41.67%
11.42%
-9.09%
22.14%
28.85%
1.97%6.68%
0.37%
-50%
-40%
-30%
-20%
-10%
0%
10%
20%
30%
40%
50%
2007 2008 2009 2010 2011 2012 2013 2014 2015 2016
During the 10-year period shown in the bar chart, the highestreturn for a quarter was 22.00% (quarter ended June 30, 2009)and the lowest return for a quarter was -20.11% (quarter endedDecember 31, 2008).
Average Annual Total Returns (For the periods endedDecember 31, 2016)
1Year
5Years
10Years
Class 3 Shares .................................. 0.37% 11.43% 5.65%
MSCI ACWI Index........................... 7.86% 9.36% 3.56%
Investment Adviser
SunAmerica serves as investment adviser to the Portfoliopursuant to its investment advisory and management agreementwith the Trust so long as the Portfolio is part of a master-feederfund structure. Capital Research and Management Companyserves as investment adviser to the Master Global Growth Fund.
Portfolio Managers
Name and Title
PortfolioManager of
Master GlobalGrowth Fund
Since
Patrice ColletePartner – Capital World Investors................... 2015
Isabelle de WismesPartner – Capital World Investors................... 2011
Paul FlynnPartner – Capital World Investors................... 2016
Jonathan KnowlesPartner – Capital World Investors................... 2013
For important information about purchases and sales ofPortfolio shares, taxes and payments to broker-dealers and otherfinancial intermediaries, please turn to the section “ImportantAdditional Information” on page 21.
PORTFOLIO SUMMARY: AMERICAN FUNDS® GLOBAL GROWTH SAST PORTFOLIO
- 6 -
Investment Goal
The Portfolio’s investment goal is growth and income.
Fees and Expenses of the Portfolio
This table describes the fees and expenses that you may pay ifyou buy and hold shares of the Portfolio. The Portfolio’s annualoperating expenses do not reflect the separate account feescharged in the variable annuity or variable life insurance policy(“Variable Contracts”) in which the Portfolio is offered. If theseparate account’s fees were shown, the Portfolio’s annualoperating expenses would be higher. Please see your VariableContract prospectus for more details on the separate accountfees.
Annual Portfolio Operating Expenses1
(expenses that you payeach year as a percentage of the value of your investment)
Class 1 Class 3
Management Fees ......................................... 1.12% 1.12%Service (12b-1) Fees..................................... None 0.25%Other Expenses............................................. 0.06% 0.06%Total Annual Portfolio Operating Expenses . 1.18% 1.43%Fee Waivers and/or Expense
Reimbursements2 ...................................... -0.60% -0.60%Total Annual Portfolio Operating
Expenses After Fee Waivers and/orExpense Reimbursements2........................ 0.58% 0.83%
1 Amounts reflect the total expenses of the Portfolio and the Master Growth-Income Fund (as defined herein).
2 SunAmerica Asset Management, LLC (“SunAmerica”) has entered into acontractual agreement with SunAmerica Series Trust (the “Trust”) underwhich it will waive 0.60% of its advisory fee for such time as the Portfoliois operated as a feeder fund, because during that time it will not be providingthe portfolio management portion of the advisory and management servicesto be provided under its investment advisory and management agreementwith the Trust. This fee waiver will continue indefinitely as long as thePortfolio is part of a master-feeder fund structure and cannot be reduced oreliminated without Board approval.
Expense Example
This Example is intended to help you compare the cost ofinvesting in the Portfolio with the cost of investing in othermutual funds. The Example assumes that you invest $10,000 inthe Portfolio for the time periods indicated and then redeem allof your shares at the end of those periods. The Example alsoassumes that your investment has a 5% return each year and thatthe Portfolio’s operating expenses remain the same. TheExample does not reflect charges imposed by the VariableContract. If the Variable Contract fees were reflected, theexpenses would be higher. See the Variable Contract prospectusfor information on such charges. The Example reflects theaggregate expenses of both the Master Growth-Income Fundand the Portfolio and assumes that the contractual waiver ofSunAmerica’s advisory fee continues for all periods shown.Although your actual costs may be higher or lower, based onthese assumptions and the Total Annual Portfolio Operating
Expenses After Fee Waivers and/or Expense Reimbursementsshown in the fee table, your costs would be:
1 Year 3 Years 5 Years 10 Years
Class 1 Shares ............... $59 $186 $324 $ 726Class 3 Shares ............... 85 265 460 1,025
Portfolio Turnover
The Portfolio pays transaction costs, such as commissions,when it buys and sells securities (or “turns over” its portfolio).A higher portfolio turnover rate may indicate higher transactioncosts. These costs, which are not reflected in annual portfoliooperating expenses or in the example, affect the Portfolio’sperformance.
During the most recent fiscal year, the Portfolio’s portfolioturnover rate was 3% of the average value of its portfolio.
Principal Investment Strategies of the Portfolio
The Portfolio described in this Prospectus operates as a “feederfund” and attempts to achieve its investment goal by investingall or substantially all of its assets in Class 1 shares of theAmerican Funds Insurance Series® Growth-Income Fund (the“Master Growth-Income Fund”), a portfolio offered byAmerican Funds Insurance Series®, a registered open-endinvestment company. In turn, the Master Growth-Income Fundseeks to make investors’ investments grow and provide themwith income over time by investing primarily in common stocksor other securities that demonstrate the potential forappreciation and/or dividends. It may invest up to 15% of itsassets, at the time of purchase, in securities of issuers domiciledoutside the United States. The Master Growth-Income Fund isdesigned for investors seeking both capital appreciation andincome.
Investment of the Portfolio’s assets in the Master Growth-Income Fund is not a fundamental policy of the Portfolio and ashareholder vote is not required for the Portfolio to withdraw itsentire investment in the Master Growth-Income Fund.
Principal Risks of Investing in the Portfolio
There can be no assurance that the Portfolio’s investment goalwill be met or that the net return on an investment in thePortfolio will exceed what could have been obtained throughother investment or savings vehicles. Shares of the Portfolio arenot bank deposits and are not guaranteed or insured by any bank,government entity or the Federal Deposit InsuranceCorporation. As with any mutual fund, there is no guarantee thatthe Portfolio will be able to achieve its investment goal. If thevalue of the assets of the Portfolio goes down, you could losemoney.
The following is a summary description of the principal risks ofinvesting in the Portfolio.
PORTFOLIO SUMMARY: AMERICAN FUNDS® GROWTH-INCOME SAST PORTFOLIO
- 7 -

Risks of Investing in Equity Securities. The Portfolio investsprimarily (through its investment in the Master Growth-IncomeFund) in equity securities. As with any equity fund, the value ofyour investment in the Portfolio may fluctuate in response tostock market movements. You should be aware that theperformance of various types of equity stocks may rise ordecline under varying market conditions — for example,“value” stocks may perform well in circumstances under which“growth” stocks in general have fallen, or vice versa. Inaddition, individual stocks selected for the Master Growth-Income Fund may underperform the market generally, relevantindices or other funds with comparable investment objectives orstrategies.
Risks of Investing in Growth Stocks. Growth stocks arehistorically volatile, which will affect the Master Growth-Income Fund and the Portfolio. Growth stocks can be volatilefor several reasons. Since the issuers of growth stocks usuallyreinvest a high portion of earnings in their own business, growthstocks may lack the dividend yield associated with value stocksthat can cushion total return in a bear market. Also, growthstocks normally carry a higher price/earnings ratio than manyother stocks. Consequently, if earnings expectations are not met,the market price of growth stocks will often decline more thanother stocks. However, the market frequently rewards growthstocks with price increases when expectations are met orexceeded.
Risk of Income-Oriented Stocks. Changes in dividend policiesor the availability of capital resources may reduce the incomefrom companies in which the Master Growth-Income Fundinvests.
Risk of Foreign Exposure. The Master Growth-Income Fundmay invest in foreign securities. Investors in foreign countriesare subject to a number of risks. A principal risk is thatfluctuations in the exchange rates between the U.S. dollar andforeign currencies may negatively affect an investment. Inaddition, there may be less publicly available information abouta foreign company and it may not be subject to the same uniformaccounting, auditing and financial reporting standards as U.S.companies. Foreign governments may not regulate securitiesmarkets and companies to the same degree as in the U.S. Inaddition, the value of investments outside the United States maybe reduced by foreign taxes, including foreign withholding taxeson interest and dividends. Foreign investments will also beaffected by local political, social or economic developments andgovernmental actions. Consequently, foreign securities may beless liquid, more volatile and more difficult to price than U.S.securities. These risks may be heightened to the extent theMaster Growth-Income Fund invests in emerging markets.
Market Risk. The Portfolio’s or the Master Growth-IncomeFund’s share price can fall because of weakness in the broadmarket, a particular industry, or specific holdings. The marketas a whole can decline for many reasons, including adversepolitical or economic developments here or abroad, changes ininvestor psychology, or heavy institutional selling. Theprospects for an industry or issuer may deteriorate because of avariety of factors, including disappointing earnings or changesin the competitive environment. In addition, the Master Growth-Income Fund’s investment adviser’s assessment of issuers heldin the Master Growth-Income Fund may prove incorrect,resulting in losses or poor performance even in a rising market.Finally, the Master Growth-Income Fund’s investment approachcould fall out of favor with the investing public, resulting inlagging performance versus other comparable portfolios.
Master-Feeder Structure. Other “feeder” funds may alsoinvest in the Master Growth-Income Fund. As shareholders ofthe Master Growth-Income Fund, feeder funds, including thePortfolio, vote on matters pertaining to the Master Growth-Income Fund. Feeder funds with a greater pro rata ownership inthe Master Growth-Income Fund could have effective votingcontrol of the operations of the Master Growth-Income Fund.Also, a large-scale redemption by another feeder fund mayincrease the proportionate share of the costs of the MasterGrowth-Income Fund borne by the remaining feeder fundshareholders, including the Portfolio.
You should also refer to the Master Growth-Income Fund’sprospectus that you received along with your PortfolioProspectus. Additionally, the statements of additionalinformation for your Portfolio and the Master Growth-IncomeFund are available free of charge upon request.
Performance Information
The performance in the bar chart and table below provide someindication of the risks of investing in the Portfolio. Remember,however, that the past performance of the Portfolio is notnecessarily an indication of how it will perform in the future. Noperformance is shown for Class 1 shares because Class 1 sharesdo not have annual returns for a full calendar year. As a result,the bar chart and table give you a picture of the long-termperformance for Class 3 shares of the Portfolio. Theperformance of Class 1 shares would be substantially similar toClass 3 shares and differ only to the extent that Class 1 sharesand Class 3 shares have different expenses. The table shows theaverage annual total returns of Class 3 shares of the Portfolio forcertain time periods compared to the returns of the S&P 500®
Index. The returns shown in the bar chart and table do notinclude charges that will be imposed by the Variable Contracts.
PORTFOLIO SUMMARY: AMERICAN FUNDS® GROWTH-INCOME SAST PORTFOLIO
- 8 -
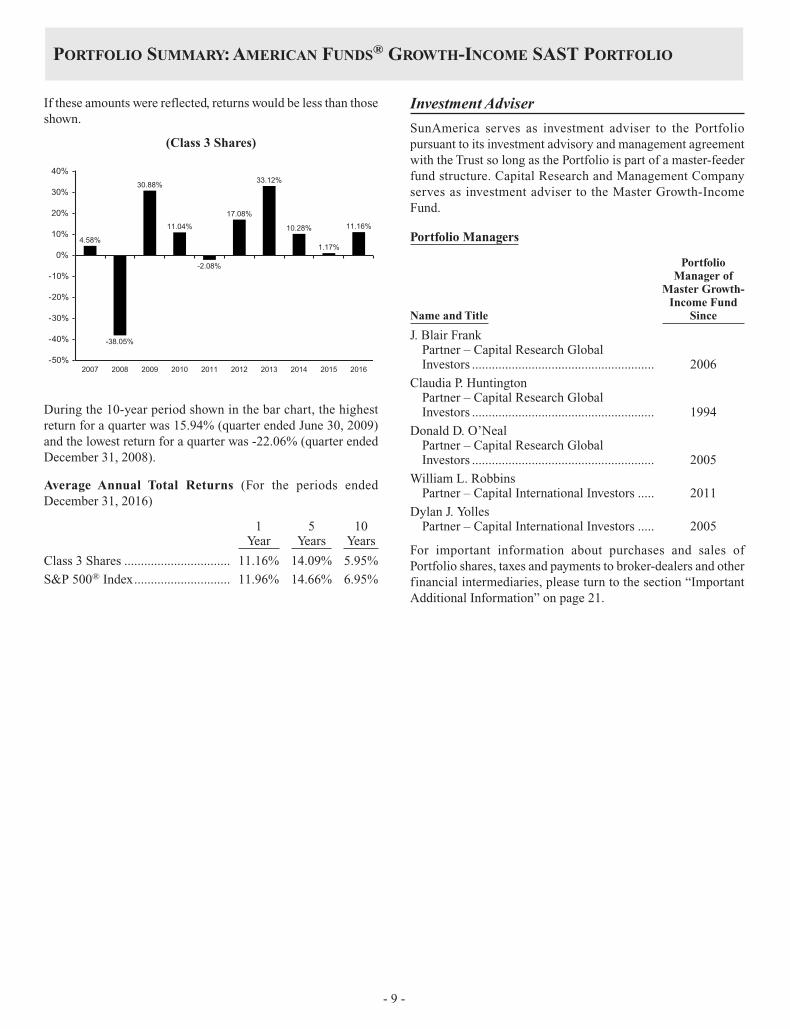
If these amounts were reflected, returns would be less than thoseshown.
(Class 3 Shares)
4.58%
-38.05%
30.88%
11.04%
-2.08%
17.08%
33.12%
10.28%
1.17%
11.16%
-50%
-40%
-30%
-20%
-10%
0%
10%
20%
30%
40%
2007 2008 2009 2010 2011 2012 2013 2014 2015 2016
During the 10-year period shown in the bar chart, the highestreturn for a quarter was 15.94% (quarter ended June 30, 2009)and the lowest return for a quarter was -22.06% (quarter endedDecember 31, 2008).
Average Annual Total Returns (For the periods endedDecember 31, 2016)
1Year
5Years
10Years
Class 3 Shares ................................ 11.16% 14.09% 5.95%
S&P 500® Index............................. 11.96% 14.66% 6.95%
Investment Adviser
SunAmerica serves as investment adviser to the Portfoliopursuant to its investment advisory and management agreementwith the Trust so long as the Portfolio is part of a master-feederfund structure. Capital Research and Management Companyserves as investment adviser to the Master Growth-IncomeFund.
Portfolio Managers
Name and Title
PortfolioManager of
Master Growth-Income Fund
Since
J. Blair FrankPartner – Capital Research GlobalInvestors ....................................................... 2006
Claudia P. HuntingtonPartner – Capital Research GlobalInvestors ....................................................... 1994
Donald D. O’NealPartner – Capital Research GlobalInvestors ....................................................... 2005
William L. RobbinsPartner – Capital International Investors ..... 2011
Dylan J. YollesPartner – Capital International Investors ..... 2005
For important information about purchases and sales ofPortfolio shares, taxes and payments to broker-dealers and otherfinancial intermediaries, please turn to the section “ImportantAdditional Information” on page 21.
PORTFOLIO SUMMARY: AMERICAN FUNDS® GROWTH-INCOME SAST PORTFOLIO
- 9 -
Investment Goal
The Portfolio’s investment goal is high total return (includingincome and capital gains) consistent with the preservation ofcapital over the long term.
Fees and Expenses of the Portfolio
This table describes the fees and expenses that you may pay ifyou buy and hold shares of the Portfolio. The Portfolio’s annualoperating expenses do not reflect the separate account feescharged in the variable annuity or variable life insurance policy(“Variable Contracts”) in which the Portfolio is offered. If theseparate account’s fees were shown, the Portfolio’s annualoperating expenses would be higher. Please see your VariableContract prospectus for more details on the separate accountfees.
Annual Portfolio Operating Expenses1
(expenses that you payeach year as a percentage of the value of your investment)
Class 1 Class 3
Management Fees ......................................... 1.12% 1.12%Service (12b-1) Fees..................................... None 0.25%Other Expenses............................................. 0.06% 0.06%Total Annual Portfolio Operating Expenses . 1.18% 1.43%Fee Waivers and/or Expense
Reimbursements2 ...................................... -0.60% -0.60%Total Annual Portfolio Operating
Expenses After Fee Waivers and/orExpense Reimbursements2........................ 0.58% 0.83%
1 Amounts reflect the total expenses of the Portfolio and the Master AssetAllocation Fund (as defined herein).
2 SunAmerica Asset Management, LLC (“SunAmerica”) has entered into acontractual agreement with SunAmerica Series Trust (the “Trust”) underwhich it will waive 0.60% of its advisory fee for such time as the Portfoliois operated as a feeder fund, because during that time it will not be providingthe portfolio management portion of the advisory and management servicesto be provided under its investment advisory and management agreementwith the Trust. This fee waiver will continue indefinitely as long as thePortfolio is part of a master-feeder fund structure and cannot be reduced oreliminated without Board approval.
Expense Example
This Example is intended to help you compare the cost ofinvesting in the Portfolio with the cost of investing in othermutual funds. The Example assumes that you invest $10,000 inthe Portfolio for the time periods indicated and then redeem allof your shares at the end of those periods. The Example alsoassumes that your investment has a 5% return each year and thatthe Portfolio’s operating expenses remain the same. TheExample does not reflect charges imposed by the VariableContract. If the Variable Contract fees were reflected, theexpenses would be higher. See the Variable Contract prospectusfor information on such charges. The Example reflects theaggregate expenses of both the Master Asset Allocation Fund
and the Portfolio and assumes that the contractual waiver ofSunAmerica’s advisory fee continues for all periods shown.Although your actual costs may be higher or lower, based onthese assumptions and the Total Annual Portfolio OperatingExpenses After Fee Waivers and/or Expense Reimbursementsshown in the fee table, your costs would be:
1 Year 3 Years 5 Years 10 Years
Class 1 Shares ............... $59 $186 $324 $ 726Class 3 Shares ............... 85 265 460 1,025
Portfolio Turnover
The Portfolio pays transaction costs, such as commissions,when it buys and sells securities (or “turns over” its portfolio).A higher portfolio turnover rate may indicate higher transactioncosts. These costs, which are not reflected in annual portfoliooperating expenses or in the example, affect the Portfolio’sperformance.
During the most recent fiscal year, the Portfolio’s portfolioturnover rate was 4% of the average value of its portfolio.
Principal Investment Strategies of the Portfolio
The Portfolio described in this Prospectus operates as a “feederfund” and attempts to achieve its investment goal by investingall or substantially all of its assets in Class 1 shares of theAmerican Funds Insurance Series® Asset Allocation Fund (the“Master Asset Allocation Fund”), a portfolio offered byAmerican Funds Insurance Series®, a registered open-endinvestment company. In turn, the Master Asset Allocation Fundseeks to provide investors with high total return (includingincome and capital gains) consistent with the preservation ofcapital over the long term by investing in a diversified portfolioof common stocks and other equity securities, bonds and otherintermediate and long-term debt securities and money marketinstruments (debt securities maturing in one year or less).
The Master Asset Allocation Fund may invest up to 15% of itsassets in common stocks and other equity securities of issuersdomiciled outside the United States and up to 5% of its assets indebt securities of issuers domiciled outside the United States. Inaddition, the Master Asset Allocation Fund may invest up to25% of its debt assets in lower quality debt securities (rated Ba1or below and BB+ or below by Nationally RecognizedStatistical Rating Organizations as designated by the adviser tothe Master Asset Allocation Fund or unrated but determined tobe of equivalent quality by the adviser to the Master AssetAllocation Fund). Such securities are sometimes referred to as“junk bonds” and are considered speculative.
In seeking to pursue its investment goal, the Master AssetAllocation Fund will vary its mix of equity securities, debtsecurities and money market instruments. Under normal market
PORTFOLIO SUMMARY: AMERICAN FUNDS® ASSET ALLOCATION SAST PORTFOLIO
- 10 -
conditions, the Master Asset Allocation Fund’s investmentadviser expects (but is not required) to maintain a flexibleinvestment mix falling within the following ranges:
40% – 80% in equity securities; 20% – 50% in debt securities;and 0% – 40% in money market instruments and cash. As ofDecember 31, 2016, the Master Asset Allocation Fund wasapproximately 66% invested in equity securities, 24% investedin debt securities and 10% invested in money marketinstruments and cash. The proportion of equities, debt andmoney market securities held by the Master Asset AllocationFund varies with market conditions and the investment adviser’sassessment of their relative attractiveness as investmentopportunities.
Investment of the Portfolio’s assets in the Master AssetAllocation Fund is not a fundamental policy of the Portfolio anda shareholder vote is not required for the Portfolio to withdrawits entire investment in the Master Asset Allocation Fund.
Principal Risks of Investing in the Portfolio
There can be no assurance that the Portfolio’s investment goalwill be met or that the net return on an investment in thePortfolio will exceed what could have been obtained throughother investment or savings vehicles. Shares of the Portfolio arenot bank deposits and are not guaranteed or insured by any bank,government entity or the Federal Deposit InsuranceCorporation. As with any mutual fund, there is no guarantee thatthe Portfolio will be able to achieve its investment goal. If thevalue of the assets of the Portfolio goes down, you could losemoney.
The following is a summary description of the principal risks ofinvesting in the Portfolio.
Risks of Investing in Equity Securities. The Portfolio investsprimarily (through its investment in the Master Asset AllocationFund) in equity securities. As with any equity fund, the value ofyour investment in the Portfolio may fluctuate in response tostock market movements. You should be aware that theperformance of various types of equity stocks may rise ordecline under varying market conditions — for example,“value” stocks may perform well in circumstances under which“growth” stocks in general have fallen, or vice versa. Inaddition, individual stocks selected for the Master AssetAllocation Fund may underperform the market generally,relevant indices or other funds with comparable investmentobjectives or strategies.
Risks of Investing in Growth Stocks. Growth stocks arehistorically volatile, which will affect the Master AssetAllocation Fund and the Portfolio. Growth stocks can be volatilefor several reasons. Since the issuers of growth stocks usuallyreinvest a high portion of earnings in their own business, growthstocks may lack the dividend yield associated with value stocksthat can cushion total return in a bear market. Also, growth
stocks normally carry a higher price/earnings ratio than manyother stocks. Consequently, if earnings expectations are not met,the market price of growth stocks will often decline more thanother stocks. However, the market frequently rewards growthstocks with price increases when expectations are met orexceeded.
Risks of Investing in Debt Instruments. The value of yourinvestment in the Portfolio may go up or down in response tochanges in interest rates or defaults (or even the potential forfuture default) by debt instrument issuers. To the extent theMaster Asset Allocation Fund is invested in the fixed incomemarket, movements in the fixed income market generally mayaffect its performance. In addition, individual debt instrumentsselected for the Master Asset Allocation Fund mayunderperform the market generally, relevant indices or otherfunds with comparable investment objectives and strategies. Asecurity backed by the U.S. Treasury or the full faith and creditof the United States is guaranteed only as to the timely paymentof interest and principal when held to maturity. Accordingly, thecurrent market prices for these securities will fluctuate withchanges in interest rates.
Interest Rate Fluctuation Risk. The volatility of fixed incomesecurities is due principally to changes in interest rates. Themarket value of bonds and other fixed income securities usuallytends to vary inversely with the level of interest rates. As interestrates rise the value of such securities typically falls, and asinterest rates fall, the value of such securities typically rises.Longer-term and lower coupon bonds tend to be more sensitiveto changes in interest rates. Lower quality fixed incomesecurities generally have higher rates of interest and may besubject to greater price fluctuations than higher quality debtsecurities. Interest rates have been historically low, so the MasterAsset Allocation Fund faces a heightened risk that interest ratesmay rise.
Credit Quality Risk. The creditworthiness of an issuer isalways a factor in analyzing fixed income securities. An issuerwith a lower credit rating will be more likely than a higher ratedissuer to default or otherwise become unable to honor itsfinancial obligations. Credit quality risk is gauged, in part, bythe credit ratings of the securities in which the Master AssetAllocation Fund invests. However, ratings are only the opinionsof the rating agencies issuing them and are not guarantees as tothe credit quality or an evaluation of market risk. The MasterAsset Allocation Fund’s investment adviser relies on its owncredit analysts to research issuers in seeking to mitigate the risksof an issuer defaulting on its obligations.
Risk of Investing in Junk Bonds. Junk bonds carry asubstantial risk of default or changes in the issuer’screditworthiness, or they may already be in default. A junkbond’s market price may fluctuate more than higher-qualitysecurities and may decline significantly. In addition, it may bemore difficult for the Master Asset Allocation Fund to dispose
PORTFOLIO SUMMARY: AMERICAN FUNDS® ASSET ALLOCATION SAST PORTFOLIO
- 11 -

of junk bonds or to determine their value. Junk bonds maycontain redemption or call provisions that, if exercised during aperiod of declining interest rates, may force the Master AssetAllocation Fund to replace the security with a lower yieldingsecurity. If this occurs, it will result in a decreased return for thePortfolio.
Risk of Income-Oriented Stocks. Changes in dividend policiesor the availability of capital resources may reduce the incomefrom companies in which the Master Asset Allocation Fundinvests.
Risk of Thinly-Traded Securities. There may not be a marketfor certain securities making it difficult or impossible to sell atthe time and the price that the seller would like.
Risk of Foreign Exposure. The Master Asset Allocation Fundmay invest in foreign securities. Investors in foreign countriesare subject to a number of risks. A principal risk is thatfluctuations in the exchange rates between the U.S. dollar andforeign currencies may negatively affect an investment. Inaddition, there may be less publicly available information abouta foreign company and it may not be subject to the same uniformaccounting, auditing and financial reporting standards as U.S.companies. Foreign governments may not regulate securitiesmarkets and companies to the same degree as in the U.S. Inaddition, the value of investments outside the United States maybe reduced by foreign taxes, including foreign withholding taxeson interest and dividends. Foreign investments will also beaffected by local political, social or economic developments andgovernmental actions. Consequently, foreign securities may beless liquid, more volatile and more difficult to price than U.S.securities. These risks may be heightened to the extent theMaster Asset Allocation Fund invests in emerging markets.
Prepayment Risk. Prepayment risk is the possibility that theprincipal of the loans underlying mortgage-backed or otherpass-through securities may be prepaid at any time. As a generalrule, prepayments increase during a period of falling interestrates and decrease during a period of rising interest rates. Thiscan reduce the returns of the Master Asset Allocation Fundbecause the Master Asset Allocation Fund will have to reinvestthat money at the lower prevailing interest rates. In periods ofincreasing interest rates, the occurrence of prepaymentsgenerally declines, with the effect that the securities subject toprepayment risk held by the Master Asset Allocation Fund mayexhibit price characteristics of longer-term debt securities.
Market Risk. The Portfolio’s or the Master Asset AllocationFund’s share price can fall because of weakness in the broadmarket, a particular industry, or specific holdings. The marketas a whole can decline for many reasons, including adversepolitical or economic developments here or abroad, changes in
investor psychology, or heavy institutional selling. Theprospects for an industry or issuer may deteriorate because of avariety of factors, including disappointing earnings or changesin the competitive environment. In addition, the Master AssetAllocation Fund’s investment adviser’s assessment of issuersheld in the Master Asset Allocation Fund may prove incorrect,resulting in losses or poor performance even in a rising market.Finally, the Master Asset Allocation Fund’s investment approachcould fall out of favor with the investing public, resulting inlagging performance versus other comparable portfolios.
Master-Feeder Structure. Other “feeder” funds may alsoinvest in the Master Asset Allocation Fund. As shareholders ofthe Master Asset Allocation Fund, feeder funds, including thePortfolio, vote on matters pertaining to the Master AssetAllocation Fund. Feeder funds with a greater pro rata ownershipin the Master Asset Allocation Fund could have effective votingcontrol of the operations of the Master Asset Allocation Fund.Also, a large-scale redemption by another feeder fund mayincrease the proportionate share of the costs of the Master AssetAllocation Fund borne by the remaining feeder fundshareholders, including the Portfolio.
You should also refer to the Master Asset Allocation Fund’sprospectus that you received along with your PortfolioProspectus. Additionally, the statements of additionalinformation for your Portfolio and the Master Asset AllocationFund are available free of charge upon request.
Performance Information
The performance in the bar chart and table below provide someindication of the risks of investing in the Portfolio. Remember,however, that the past performance of the Portfolio is notnecessarily an indication of how it will perform in the future. Noperformance is shown for Class 1 shares because Class 1 sharesdo not have annual returns for a full calendar year. As a result,the bar chart and table give you a picture of the long-termperformance for Class 3 shares of the Portfolio. Theperformance of Class 1 shares would be substantially similar toClass 3 shares and differ only to the extent that Class 1 sharesand Class 3 shares have different expenses. The table shows theaverage annual total returns of Class 3 shares of the Portfolio forcertain time periods compared to the returns of the S&P 500®
Index, Bloomberg Barclays U.S. Aggregate Bond Index and ablended index. The blended index consists of 60% S&P 500®
Index and 40% Bloomberg Barclays U.S. Aggregate Bond Index(the “Blended Index”). The returns shown in the bar chart andtable do not include charges that will be imposed by the VariableContracts. If these amounts were reflected, returns would be lessthan those shown.
PORTFOLIO SUMMARY: AMERICAN FUNDS® ASSET ALLOCATION SAST PORTFOLIO
- 12 -

(Class 3 Shares)
6.20%
-29.85%
23.44%
12.00%
0.97%
15.77%
23.32%
5.05%1.16%
9.09%
-40%
-30%
-20%
-10%
0%
10%
20%
30%
2007 2008 2009 2010 2011 2012 2013 2014 2015 2016
During the 10-year period shown in the bar chart, the highestreturn for a quarter was 11.43% (quarter ended September 30,2009) and the lowest return for a quarter was -16.41% (quarterended December 31, 2008).
Average Annual Total Returns (For the periods endedDecember 31, 2016)
1Year
5Years
10Years
Class 3 Shares ................................ 9.09% 10.60% 5.58%
Bloomberg Barclays U.S.Aggregate Bond Index................ 2.65% 2.23% 4.34%
S&P 500® Index............................. 11.96% 14.66% 6.95%
Blended Index ................................ 8.31% 9.69% 6.21%
Investment Adviser
SunAmerica serves as investment adviser to the Portfoliopursuant to its investment advisory and management agreementwith the Trust so long as the Portfolio is part of a master-feederfund structure. Capital Research and Management Companyserves as investment adviser to the Master AssetAllocation Fund.
Portfolio Managers
Name and Title
PortfolioManager of
Master AssetAllocation Fund
Since
Alan N. BerroPartner – Capital World Investors ................ 2000
J. David CarpenterPartner – Capital World Investors ................ 2013
David A. DaiglePartner – Capital Fixed Income Investors .... 2009
Jeffrey T. LagerPartner – Capital World Investors ................ 2007
James R. MulallyPartner – Capital Fixed Income Investors .... 2006
John R. QueenVice President – Capital Fixed IncomeInvestors ....................................................... 2016
For important information about purchases and sales ofPortfolio shares, taxes and payments to broker-dealers and otherfinancial intermediaries, please turn to the section “ImportantAdditional Information” on page 21.
PORTFOLIO SUMMARY: AMERICAN FUNDS® ASSET ALLOCATION SAST PORTFOLIO
- 13 -

Investment Goal
The Portfolio’s investment goal is high total return (includingincome and capital gains) consistent with preservation of capitalover the long term while seeking to manage volatility andprovide downside protection.
Fees and Expenses of the Portfolio
This table describes the fees and expenses that you may pay ifyou buy and hold shares of the Portfolio. The Portfolio’s annualoperating expenses do not reflect the separate account feescharged in the variable annuity or variable life insurance policy(“Variable Contracts”) in which the Portfolio is offered. If theseparate account’s fees were shown, the Portfolio’s annualoperating expenses would be higher. Please see your VariableContract prospectus for more details on the separate accountfees.
Annual Portfolio Operating Expenses1
(expenses that you payeach year as a percentage of the value of your investment)
Class 1 Class 3
Management Fees2,3 ..................................... 1.10% 1.10%Service (12b-1) Fees..................................... None 0.25%
Other Master Fund Expenses .................... 0.28% 0.28%Acquired Fund Fees and Expensesof the
Master Fund........................................... 0.27% 0.27%Other Portfolio Expenses4......................... 0.03% 0.03%
Total Other Expenses.................................... 0.58% 0.58%Total Annual Portfolio Operating Expenses . 1.68% 1.93%Fee Waivers and/or Expense
Reimbursements 2,3,4................................. -0.75% -0.75%Total Annual Portfolio Operating Expenses
After Fee Waivers and/or ExpenseReimbursements ....................................... 0.93% 1.18%
1 Amounts reflect the total expenses of the Portfolio and the Master ManagedRisk Fund (as defined herein).
2 SunAmerica Asset Management, LLC (“SunAmerica”) has entered into acontractual agreement with SunAmerica Series Trust (the “Trust”) underwhich it will waive 0.70% of its advisory fee for such time as the Portfoliois operated as a feeder fund, because during that time it will not be providingthe portfolio management portion of the advisory and management servicesto be provided under its investment advisory and management agreementwith the Trust. This fee waiver will continue indefinitely as long as thePortfolio is part of a master-feeder fund structure and cannot be reduced oreliminated without Board approval.
3 Capital Research and Management Company (“Capital Research”)currently waives a portion of its management fee equal to 0.05% of theMaster Managed Risk Fund’s net assets. This waiver will be in effect throughat least May 1, 2018, unless modified or terminated by the Master ManagedRiskFund Board. Capital Research may elect at its discretion to extend,modify or terminate the reimbursement at that time. The waiver may only bemodified or terminated with the approval of the Master Managed Risk FundBoard.
4 SunAmerica has contractually agreed to reimburse the expenses of thePortfolio until April 30, 2018, so that the Portfolio’s “Total Annual PortfolioOperating Expenses After Fee Waivers and/or Expense Reimbursements” donot exceed 0.28% for Class 1 shares and 0.53% for Class 3 shares. Forpurposes of the Expense Limitation Agreement, “Total Annual PortfolioOperating Expenses” shall not include extraordinary expenses (i.e.,
expenses that are unusual in nature and/or infrequent in occurrence, such aslitigation), acquired fund fees and expenses, brokerage commissions andother transactional expenses relating to the purchase and sale of portfoliosecurities, interest, taxes and governmental fees and other expenses notincurred in the ordinary course of the Trust’s business on behalf of thePortfolio. Any waivers and/or reimbursements made by SunAmerica withrespect to the Portfolio, except for Advisory Fee Waivers, are subject torecoupment from the Portfolio within two years after the occurrence of thewaivers and/or reimbursements, provided that the Portfolio is able to effectsuch payment to SunAmerica and remain in compliance with the expenselimitation in effect at the time the waivers and/or reimbursements weremade. This agreement will be renewed in terms of one year unlessterminated by the Board of Trustees of the Trust prior to any such renewal.
Expense Example
This Example is intended to help you compare the cost ofinvesting in the Portfolio with the cost of investing in othermutual funds. The Example assumes that you invest $10,000 inthe Portfolio for the time periods indicated and then redeem allof your shares at the end of those periods. The Example alsoassumes that your investment has a 5% return each year and thatthe Portfolio’s operating expenses remain the same. TheExample does not reflect charges imposed by the VariableContract. If the Variable Contract fees were reflected, theexpenses would be higher. See the Variable Contract prospectusfor information on such charges. The Example reflects theaggregate expenses of both the Master Managed Risk Fund andthe Portfolio and assumes that the contractual waiver ofSunAmerica’s advisory fee continues for all periods shown.Although your actual costs may be higher or lower, based onthese assumptions and the Total Annual Portfolio OperatingExpenses After Fee Waivers and/or Expense Reimbursementsshown in the fee table, your costs would be:
1 Year 3 Years 5 Years 10 Years
Class 1 Shares ............... $ 95 $307 $537 $1,197Class 3 Shares ............... 120 385 671 1,484
Portfolio Turnover
The Portfolio pays transaction costs, such as commissions,when it buys and sells securities (or “turns over” its portfolio).A higher portfolio turnover rate may indicate higher transactioncosts. These costs, which are not reflected in annual portfoliooperating expenses or in the example, affect the Portfolio’sperformance.
During the most recent fiscal year, the Portfolio’s portfolioturnover rate was 2% of the average value of its portfolio.
Principal Investment Strategies of the Portfolio
The Portfolio described in this Prospectus operates as a “feederfund” and attempts to achieve its investment goal by investingall or substantially all of its assets in Class P1 shares of theAmerican Funds Insurance Series® (“AFIS”) Managed RiskAsset Allocation Fund (the “Master Managed Risk Fund”), aportfolio offered by American Funds Insurance Series®, aregistered open-end investment company. In turn, the Master
PORTFOLIO SUMMARY: VCPSM MANAGED ASSET ALLOCATION SAST PORTFOLIO
- 14 -

Managed Risk Fund pursues its investment objective byinvesting in shares of an underlying fund, the American FundsInsurance Series® Asset Allocation FundSM (the “UnderlyingFund”), while seeking to manage portfolio volatility and providedownside protection primarily through the use of exchange-traded futures contracts.
The investment objective of the Underlying Fund is to provideinvestors with high total returns (including income and capitalgains) consistent with preservation of capital over the long term.The Underlying Fund invests in a diversified portfolio ofcommon stocks and other equity securities, bonds and otherintermediate and long-term debt securities, and money marketinstruments (debt securities maturing in one year or less). TheUnderlying Fund varies its mix of equity securities, debtsecurities and money market instruments. Under normal marketconditions, the Underlying Fund’s investment adviser, CapitalResearch, expects (but is not required) to maintain aninvestment mix falling within the following ranges: 40%-80%in equity securities, 20%-50% in debt securities and 0%-40% inmoney market instruments and cash. As of December 31, 2016,the Underlying Fund was approximately 66% invested in equitysecurities, 24% invested in debt securities and 10% invested inmoney market instruments and cash. The proportion of equities,debt and money market securities held by the Underlying Fundvaries with market conditions and its investment adviser’sassessment of their relative attractiveness as investmentopportunities.
The Underlying Fund may invest up to 15% of its assets incommon stocks and other equity securities of issuers domiciledoutside the United States and up to 5% of its assets in debtsecurities of issuers domiciled outside the United States. Inaddition, the Underlying Fund may invest up to 25% of its debtassets in lower quality debt securities (rated Ba1 or below andBB+ or below by Nationally Recognized Statistical RatingOrganizations designated by the Underlying Fund’s investmentadviser or unrated but determined to be of equivalent quality bythe investment adviser). Such securities are sometimes referredto as “junk bonds” and are considered speculative.
The Master Managed Risk Fund employs a risk-managementoverlay, or managed risk strategy. The managed risk strategyconsists of using hedge instruments – primarily short positionsin exchange-traded futures contracts – to attempt to stabilize thevolatility of the Master Managed Risk Fund around a targetvolatility level and reduce the downside exposure of the MasterManaged Risk Fund during periods of significant marketdeclines. “Volatility” in this context means variance in theMaster Managed Risk Fund’s investment results. The MasterManaged Risk Fund employs a subadviser to select individualfutures contracts on equity indices of U.S. markets and marketsoutside the United States that the subadviser believes arecorrelated to the Underlying Fund’s equity exposure. Theseinstruments are selected based on the subadviser’s analysis ofthe relation of various equity indices to the Underlying Fund’s
portfolio. In addition, the subadviser will monitor liquiditylevels of relevant futures contracts and transparency provided byexchanges as the counterparties in hedging transactions. Thetarget volatility level will be set from time to time by theinvestment adviser and the subadviser and may be adjusted ifdeemed advisable in the judgment of the investment adviser andthe subadviser. The subadviser will regularly adjust the level ofexchange-traded futures contracts to seek to manage the overallnet risk level of the Master Managed Risk Fund. The subadvisermay also seek to hedge the Master Managed Risk Fund’scurrency risk related to its exposure to equity index futuresdenominated in currencies other than the U.S. dollar.
A futures contract is an agreement between two parties to buyor sell a financial instrument for a set price on a future date. Theshort equity futures contracts increase in value as equity marketsdecline. The subadviser will purchase or sell futures contractsthrough a futures commission merchant, or FCM. Uponentering into a futures contract, the Master Managed Risk Fundwill be required to deposit with the FCM an amount of cash forcollateral, or initial margin, that will be held at the clearinghouseor exchange in the name of the FCM. On a daily basis, theMaster Managed Risk Fund will be required to post additionalcash with the FCM if a futures contract loses value or willreceive cash if a futures contract gains in value. This cash,known as variation margin, may be held intraday at the FCM.
During periods of generally rising equity security prices, thesubadviser will increase the target level of protection in theMaster Managed Risk Fund to seek to protect the growing valueof the Fund’s portfolio. During or after severe marketdownturns, however, the Master Managed Risk Fund’ssubadviser will realize gains for the Master Managed Risk Fundon the Master Managed Risk Fund’s short futures positions andthe amount of short futures held by the Master Managed RiskFund will decrease. Even in periods of low volatility in theequity markets, however, the subadviser may continue to use thehedging techniques to seek to preserve gains in favorable marketconditions and reduce losses in adverse market conditions. Inthe event of a sudden market dislocation, the managed riskstrategy may not provide the same downside protection as inother periods. In addition, under certain market conditions, thesubadviser reserves the right to purchase or sell exchange-traded interest rate futures, including futures contracts on U.S.Treasury bonds, to seek to manage interest rate risk.
Due to recent regulatory changes, the market for swaps is likelyto move from a largely over-the-counter market to an exchange-traded market. If in the judgment of the Master Managed RiskFund’s investment adviser and the subadviser, the exchange-traded swaps market becomes similar in depth and substance tothat of the exchange-traded futures market, the subadviser mayuse exchange-traded swaps to seek to hedge interest rate risk. Aswap is an agreement pursuant to which two parties agree toexchange the returns, or differential in rates of returns, earnedor realized on particular predetermined interest rates,
PORTFOLIO SUMMARY: VCPSM MANAGED ASSET ALLOCATION SAST PORTFOLIO
- 15 -
investments or instruments over a predetermined period. Therisks of investing in exchange-traded swaps will be substantiallysimilar to those of investing in exchange-traded futures.
The Master Managed Risk Fund may be required to own cash orother liquid assets and post these assets with a FCM or brokeras collateral to cover the obligations under its futures contracts.In situations of extreme market volatility, the short positionsheld in exchange-traded equity index futures could potentiallyeliminate the Master Managed Risk Fund’s net economicexposure to equity securities. In addition, during severe marketdislocations, the Master Managed Risk Fund may adjust itsmanaged risk strategy if advisable in the judgment of the MasterManaged Risk Fund’s investment adviser and subadviser.Before adjusting the Master Managed Risk Fund’s managed riskstrategy, the Master Managed Risk Fund’s investment adviserand subadviser may consult with insurance companies that offerthe Master Managed Risk Fund as an underlying investmentoption for its variable contracts; provided, however, that anyadjustment will be made in the judgment of the Master ManagedRisk Fund’s investment adviser and the subadviser. Any suchadjustment may not have the desired positive effect, and couldpotentially have further adverse effects, on the Master ManagedRisk Fund’s investment results.
The success of the Master Managed Risk Fund will be impactedby the results of the Underlying Fund. For this reason, it isimportant to understand the risks associated with investing bothin the Master Managed Risk Fund and the Underlying Fund.
The Master Managed Risk Fund or the Underlying Fund mayalso hold cash or money market instruments, includingcommercial paper and short-term securities issued by the U.S.government, its agencies and instrumentalities. The MasterManaged Risk Fund may also hold money market fund sharesas part of its cash position. The percentage of the MasterManaged Risk Fund or the Underlying Fund invested in suchholdings varies and depends on various factors, includingmarket conditions and purchases and redemptions of fundshares. The Master Managed Risk Fund’s investment advisermay determine that it is appropriate to invest substantially insuch instruments in response to certain circumstances, such asperiods of market turmoil. In addition, for temporary defensivepurposes, the Master Managed Risk Fund or the UnderlyingFund may invest without limitation in such instruments. A largeramount of such holdings could moderate the investment resultsof the Master Managed Risk Fund or the Underlying Fund in aperiod of rising market prices. Alternatively, a larger percentageof such holdings could reduce the magnitude of loss in theMaster Managed Risk Fund or the Underlying Fund in a periodof falling market prices and provide liquidity to make additionalinvestments or to meet redemptions.
The Master Managed Risk Fund is non-diversified, whichallows it to invest a greater percentage of its assets in any oneissuer than would otherwise be the case. However, through the
Underlying Fund, the Master Managed Risk Fund owns adiversified mix of equity and fixed-income securities.
Investment of the Portfolio’s assets in the Master Managed RiskFund is not a fundamental policy of the Portfolio and ashareholder vote is not required for the Portfolio to withdraw itsentire investment in the Master Managed Risk Fund.
Principal Risks of Investing in the Portfolio
There can be no assurance that the Portfolio’s investment goalwill be met or that the net return on an investment in thePortfolio will exceed what could have been obtained throughother investment or savings vehicles. Shares of the Portfolio arenot bank deposits and are not guaranteed or insured by any bank,government entity or the Federal Deposit InsuranceCorporation. As with any mutual fund, there is no guarantee thatthe Portfolio will be able to achieve its investment goal. If thevalue of the assets of the Portfolio goes down, you could losemoney. You should also understand that the Master ManagedRisk Fund’s objective of protecting against downside losses mayresult directly in the Master Managed Risk Fund, and indirectlyin the Portfolio, not realizing the full gains of the UnderlyingFund.
The following is a summary description of the principal risks ofinvesting in the Portfolio.
Underlying Fund Risk. Because the Portfolio’s investmentsconsist of investing in the Master Managed Risk Fund which, inturn, invests a portion of the Portfolio’s assets in the UnderlyingFund, the Portfolio’s risks are directly related to the risks of theUnderlying Fund. For this reason, it is important to understandthe risks associated with investing in both the Portfolio and theUnderlying Fund.
Futures Risk. A futures contract is considered a derivativebecause it derives its value from the price of the underlyingsecurity or financial index. The prices of futures contracts canbe volatile and futures contracts may be illiquid. In addition,there may be imperfect or even negative correlation between theprice of a futures contract and the price of the underlyingsecurities or financial index.
Hedging Risk. There may be imperfect or even negativecorrelation between the prices of the futures contracts and theprices of the underlying securities. For example, futurescontracts may not provide an effective hedge because changesin futures contract prices may not track those of the underlyingsecurities or indexes they are intended to hedge. In addition,there are significant differences between the securities andfutures markets that could result in an imperfect correlationbetween the markets, causing a given hedge not to achieve itsobjectives. The degree of imperfection of correlation dependson circumstances such as variations in speculative marketdemand for futures, including technical influences in futurestrading, and differences between the financial instruments being
PORTFOLIO SUMMARY: VCPSM MANAGED ASSET ALLOCATION SAST PORTFOLIO
- 16 -
hedged and the instruments underlying the standard contractsavailable for trading. A decision as to whether, when and how tohedge involves the exercise of skill and judgment, and even awell-conceived hedge may be unsuccessful to some degreebecause of market behavior or unexpected interest rate trends.In addition, the Master Managed Risk Fund’s investment inexchange-traded futures and their resulting costs could limit theMaster Managed Risk Fund’s gains in rising markets relative tothose of the Underlying Fund, or to those of unhedged funds ingeneral.
Short Positions Risk. Losses from short positions in futurescontracts occur when the underlying index increases in value.Asthe underlying index increases in value, the holder of the shortposition in the corresponding futures contract is required to paythe difference in value of the futures contract resulting from theincrease in the index on a daily basis. Losses from a shortposition in an index futures contract could potentially be verylarge if the value of the underlying index rises dramatically in ashort period of time.
Risks of Investing in Equity Securities. The Portfolio investsprimarily (through its investment in the Master Managed RiskFund which invests in the Underlying Fund) in equity securities.As with any equity fund, the value of your investment in thePortfolio may fluctuate in response to stock market movements.You should be aware that the performance of various types ofequity stocks may rise or decline under varying marketconditions — for example, “value” stocks may perform well incircumstances under which “growth” stocks in general havefallen, or vice versa. In addition, individual stocks selected forthe Underlying Fund may underperform the market generally,relevant indices or other funds with comparable investmentobjectives or strategies.
Risks of Investing in Growth Stocks. Growth stocks arehistorically volatile, which will affect the Underlying Fund andthe Portfolio. Growth stocks can be volatile for several reasons.Since the issuers of growth stocks usually reinvest a high portionof earnings in their own business, growth stocks may lack thedividend yield associated with value stocks that can cushiontotal return in a bear market. Also, growth stocks normally carrya higher price/earnings ratio than many other stocks.Consequently, if earnings expectations are not met, the marketprice of growth stocks will often decline more than other stocks.However, the market frequently rewards growth stocks withprice increases when expectations are met or exceeded.
Risk of Investing in Bonds. The value of your investment in thePortfolio may go up or down in response to changes in interestrates or defaults (or even the potential for future default) bybond issuers. To the extent the Master Managed Risk Fund or theUnderlying Fund is invested in the bond market, movements inthe bond market generally may affect its performance. Inaddition, individual bonds selected may underperform themarket generally, relevant indices or other funds with
comparable investment objectives and strategies. A securitybacked by the U.S. Treasury or the full faith and credit of theUnited States is guaranteed only as to the timely payment ofinterest and principal when held to maturity. Accordingly, thecurrent market prices for these securities will fluctuate withchanges in interest rates.
Interest Rate Fluctuations Risk. The volatility of fixedincome securities is due principally to changes in interest rates.The market value of bonds and other fixed income securitiesusually tends to vary inversely with the level of interest rates. Asinterest rates rise the value of such securities typically falls, andas interest rates fall, the value of such securities typically rises.Longer-term and lower coupon bonds tend to be more sensitiveto changes in interest rates. Lower quality fixed incomesecurities generally have higher rates of interest and may besubject to greater price fluctuations than higher quality debtsecurities. Interest rates have been historically low, so theUnderlying Fund faces a heightened risk that interest rates mayrise.
Credit Quality Risk. The creditworthiness of an issuer isalways a factor in analyzing fixed income securities. An issuerwith a lower credit rating will be more likely than a higher ratedissuer to default or otherwise become unable to honor itsfinancial obligations. Credit quality risk is gauged, in part, bythe credit ratings of the securities in which the Underlying Fundinvests. However, ratings are only the opinions of the ratingagencies issuing them and are not guarantees as to the creditquality or an evaluation of market risk. The Underlying Fund’sinvestment adviser relies on its own credit analysts to researchissuers in seeking to mitigate the risks of an issuer defaulting onits obligations.
Risk of Investing in Junk Bonds. Junk bonds carry asubstantial risk of default or changes in the issuer’screditworthiness, or they may already be in default. A junkbond’s market price may fluctuate more than higher-qualitysecurities and may decline significantly. In addition, it may bemore difficult for the Underlying Fund to dispose of junk bondsor to determine their value. Junk bonds may contain redemptionor call provisions that, if exercised during a period of declininginterest rates, may force the Underlying Fund to replace thesecurity with a lower yielding security. If this occurs, it willresult in a decreased return for the Portfolio.
Risk of Income-Oriented Stocks. Changes in dividend policiesor the availability of capital resources may reduce the incomefrom companies in which the Underlying Fund invests.
Risk of Thinly-Traded Securities. There may not be a marketfor certain securities making it difficult or impossible to sell atthe time and the price that the seller would like.
Risk of Foreign Exposure. The Underlying Fund may invest inforeign securities. Investors in foreign countries are subject to a
PORTFOLIO SUMMARY: VCPSM MANAGED ASSET ALLOCATION SAST PORTFOLIO
- 17 -

number of risks. A principal risk is that fluctuations in theexchange rates between the U.S. dollar and foreign currenciesmay negatively affect an investment. In addition, there may beless publicly available information about a foreign company andit may not be subject to the same uniform accounting, auditingand financial reporting standards as U.S. companies. Foreigngovernments may not regulate securities markets and companiesto the same degree as in the U.S. Foreign investments will alsobe affected by local political, social or economic developmentsand governmental actions. Consequently, foreign securities maybe less liquid, more volatile and more difficult to price than U.S.securities. These risks may be heightened to the extent theUnderlying Fund invests in emerging markets.
Master-Feeder Structure. Other “feeder” funds may alsoinvest in the Master Managed Risk Fund. As shareholders of theMaster Managed Risk Fund, feeder funds, including thePortfolio, vote on matters pertaining to the Master ManagedRisk Fund. Feeder funds with a greater pro rata ownership in theMaster Managed Risk Fund could have effective voting controlof the operations of the Master Managed Risk Fund. Also, alarge-scale redemption by another feeder fund may increase theproportionate share of the costs of the Master Managed RiskFund borne by the remaining feeder fund shareholders,including the Portfolio.
Asset Allocation Risk. The Underlying Fund’s percentageallocations to equity securities, debt securities and moneymarket instruments could cause the Master Managed Risk Fund,and therefore the Portfolio, to underperform relative to relevantbenchmarks and other funds with similar investment objectives.
Non-diversification Risk. As a non-diversified fund, theMaster Managed Risk Fund has the ability to invest a largerpercentage of its assets in the securities of a smaller number ofissuers than a diversified fund. Therefore, poor performance bya single large holding could adversely impact the Portfolio’sinvestment results more than if the Master Managed Risk Fundwere invested in a larger number of issuers. However, throughthe Master Managed Risk Fund’s holdings in the UnderlyingFund, the Master Managed Risk Fund owns a diversified mix ofequity and fixed-income securities.
Market Risk. The Portfolio’s, the Master Managed Risk Fund’sor the Underlying Fund’s share price can fall because ofweakness in the broad market, a particular industry, or specificholdings. The market as a whole can decline for many reasons,including adverse political or economic developments here orabroad, changes in investor psychology, or heavy institutionalselling. The prospects for an industry or issuer may deterioratebecause of a variety of factors, including disappointing earningsor changes in the competitive environment. In addition, theinvestment adviser’s assessment of issuers held in theUnderlying Fund may prove incorrect, resulting in losses orpoor performance even in a rising market. Finally, the MasterManaged Risk Fund’s or the Underlying Fund’s investment
approach could fall out of favor with the investing public,resulting in lagging performance versus other comparableportfolios.
Derivatives Risk. A derivative is any financial instrumentwhose value is based on, and determined by, another security,index or benchmark (i.e., exchange traded futures and swaps).To the extent a derivative contract is used to hedge anotherposition in the Master Managed Risk Fund, the Master ManagedRisk Fund directly, and the Portfolio indirectly, will be exposedto the risks associated with hedging described above. To theextent an option, futures contract, swap, or other derivative isused to enhance return, rather than as a hedge, the MasterManaged Risk Fund directly, and the Portfolio indirectly, will beexposed to the risks of the contract. Gains or losses from non-hedging positions may be substantially greater than the cost ofthe position. By purchasing over-the-counter derivatives, theMaster Managed Risk Fund is exposed to credit quality risk ofthe counterparty.
Counterparty Risk. Counterparty risk is the risk that acounterparty to a security, loan or derivative held by the MasterManaged Risk Fund or the Underlying Fund becomes bankruptor otherwise fails to perform its obligations due to financialdifficulties. The Master Managed Risk Fund and the UnderlyingFund directly, and the Portfolio indirectly, may experiencesignificant delays in obtaining any recovery in a bankruptcy orother reorganization proceeding, and there may be no recoveryor limited recovery in such circumstances.
Risks of Leverage. Futures contracts and other derivatives inwhich the Master Managed Risk Fund may invest involveleverage. Leverage occurs when an investor has the right to areturn on an investment that exceeds the return that the investorwould be expected to receive based on the amount contributedto the investment. The Master Managed Risk Fund’s use ofcertain economically leveraged futures and other derivatives canresult in a loss substantially greater than the amount invested inthe futures or other derivative itself. Certain futures and otherderivatives have the potential for unlimited loss, regardless ofthe size of the initial investment. When the Master ManagedRisk Fund uses futures and other derivatives for leverage, ashareholder’s investment in the Master Managed Risk Fund willtend to be more volatile, resulting in larger gains or losses inresponse to the fluctuating prices of the Master Managed RiskFund’s investments. The use of leverage may cause the MasterManaged Risk Fund to liquidate portfolio positions atinopportune times in order to meet regulatory asset coveragerequirements, fulfill leverage contract terms, or for otherreasons. Leveraging, including borrowing, tends to increase theMaster Managed Risk Fund’s exposure to market risk, interestrate risk or other risks, and thus may cause the Master ManagedRisk Fund to be more volatile than if the Master Managed RiskFund had not utilized leverage.
PORTFOLIO SUMMARY: VCPSM MANAGED ASSET ALLOCATION SAST PORTFOLIO
- 18 -
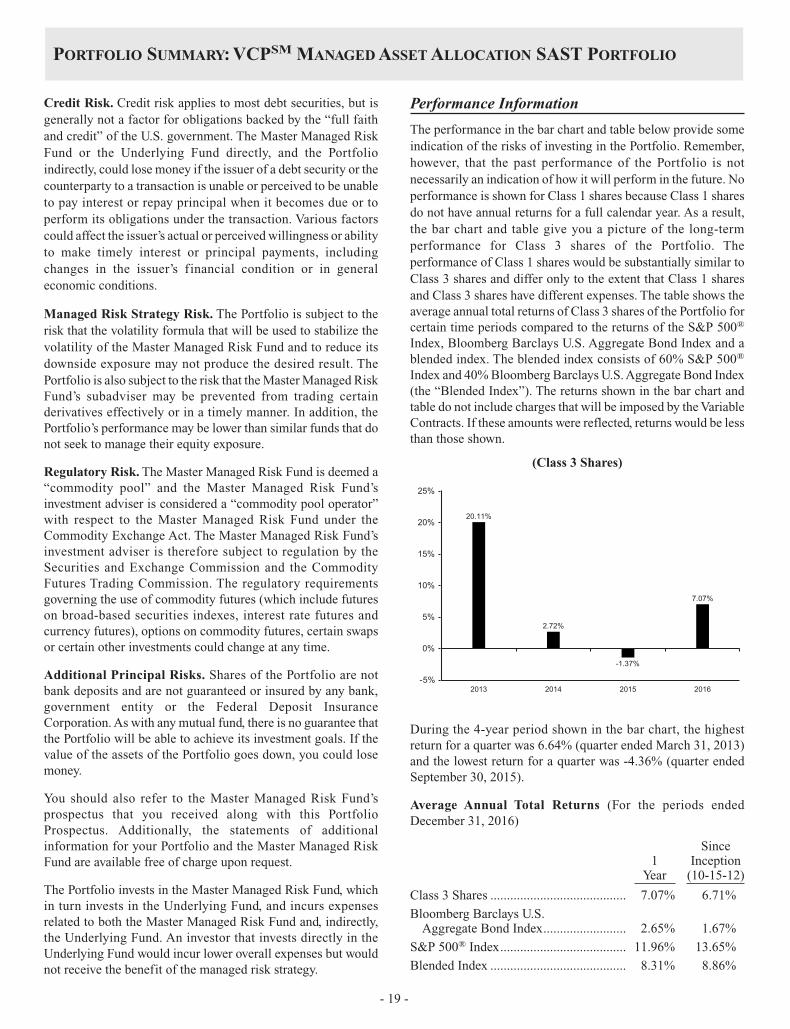
Credit Risk. Credit risk applies to most debt securities, but isgenerally not a factor for obligations backed by the “full faithand credit” of the U.S. government. The Master Managed RiskFund or the Underlying Fund directly, and the Portfolioindirectly, could lose money if the issuer of a debt security or thecounterparty to a transaction is unable or perceived to be unableto pay interest or repay principal when it becomes due or toperform its obligations under the transaction. Various factorscould affect the issuer’s actual or perceived willingness or abilityto make timely interest or principal payments, includingchanges in the issuer’s financial condition or in generaleconomic conditions.
Managed Risk Strategy Risk. The Portfolio is subject to therisk that the volatility formula that will be used to stabilize thevolatility of the Master Managed Risk Fund and to reduce itsdownside exposure may not produce the desired result. ThePortfolio is also subject to the risk that the Master Managed RiskFund’s subadviser may be prevented from trading certainderivatives effectively or in a timely manner. In addition, thePortfolio’s performance may be lower than similar funds that donot seek to manage their equity exposure.
Regulatory Risk. The Master Managed Risk Fund is deemed a“commodity pool” and the Master Managed Risk Fund’sinvestment adviser is considered a “commodity pool operator”with respect to the Master Managed Risk Fund under theCommodity Exchange Act. The Master Managed Risk Fund’sinvestment adviser is therefore subject to regulation by theSecurities and Exchange Commission and the CommodityFutures Trading Commission. The regulatory requirementsgoverning the use of commodity futures (which include futureson broad-based securities indexes, interest rate futures andcurrency futures), options on commodity futures, certain swapsor certain other investments could change at any time.
Additional Principal Risks. Shares of the Portfolio are notbank deposits and are not guaranteed or insured by any bank,government entity or the Federal Deposit InsuranceCorporation. As with any mutual fund, there is no guarantee thatthe Portfolio will be able to achieve its investment goals. If thevalue of the assets of the Portfolio goes down, you could losemoney.
You should also refer to the Master Managed Risk Fund’sprospectus that you received along with this PortfolioProspectus. Additionally, the statements of additionalinformation for your Portfolio and the Master Managed RiskFund are available free of charge upon request.
The Portfolio invests in the Master Managed Risk Fund, whichin turn invests in the Underlying Fund, and incurs expensesrelated to both the Master Managed Risk Fund and, indirectly,the Underlying Fund. An investor that invests directly in theUnderlying Fund would incur lower overall expenses but wouldnot receive the benefit of the managed risk strategy.
Performance Information
The performance in the bar chart and table below provide someindication of the risks of investing in the Portfolio. Remember,however, that the past performance of the Portfolio is notnecessarily an indication of how it will perform in the future. Noperformance is shown for Class 1 shares because Class 1 sharesdo not have annual returns for a full calendar year. As a result,the bar chart and table give you a picture of the long-termperformance for Class 3 shares of the Portfolio. Theperformance of Class 1 shares would be substantially similar toClass 3 shares and differ only to the extent that Class 1 sharesand Class 3 shares have different expenses. The table shows theaverage annual total returns of Class 3 shares of the Portfolio forcertain time periods compared to the returns of the S&P 500®
Index, Bloomberg Barclays U.S. Aggregate Bond Index and ablended index. The blended index consists of 60% S&P 500®
Index and 40% Bloomberg Barclays U.S. Aggregate Bond Index(the “Blended Index”). The returns shown in the bar chart andtable do not include charges that will be imposed by the VariableContracts. If these amounts were reflected, returns would be lessthan those shown.
(Class 3 Shares)
20.11%
2.72%
-1.37%
7.07%
-5%
0%
5%
10%
15%
20%
25%
2013 2014 2015 2016
During the 4-year period shown in the bar chart, the highestreturn for a quarter was 6.64% (quarter ended March 31, 2013)and the lowest return for a quarter was -4.36% (quarter endedSeptember 30, 2015).
Average Annual Total Returns (For the periods endedDecember 31, 2016)
1Year
SinceInception
(10-15-12)
Class 3 Shares ......................................... 7.07% 6.71%
Bloomberg Barclays U.S.Aggregate Bond Index......................... 2.65% 1.67%
S&P 500® Index...................................... 11.96% 13.65%
Blended Index ......................................... 8.31% 8.86%
PORTFOLIO SUMMARY: VCPSM MANAGED ASSET ALLOCATION SAST PORTFOLIO
- 19 -

Investment Adviser
SunAmerica serves as investment adviser to the Portfoliopursuant to its investment advisory and management agreementwith the Trust so long as the Portfolio is part of a master-feederfund structure. Capital Research serves as investment adviser tothe Master Managed Risk Fund and the Underlying Fund.Milliman Financial Risk Management, LLC (“Milliman”)serves as subadviser to the Master Managed Risk Fund.
Portfolio Managers
The individuals primarily responsible for the management of theMaster Managed Risk Fund at Capital Research are:
Portfolio Managersand Primary Title withCapital Research
PortfolioManager
to the MasterManaged Risk
Fund since
Alan N. BerroPartner – Capital World Investors................... 2012
James R. MulallyPartner – Capital Fixed Income Investors....... 2012
The individual primarily responsible for the management of theMaster Managed Risk Fund’s managed risk strategy at Millimanis:
Portfolio Managerand Primary Titlewith Milliman
PortfolioManager
to the MasterManaged Risk
Fund since
Adam SchenckDirector – Portfolio Management Group........ 2012
For important information about purchases and sales ofPortfolio shares, taxes and payments to broker-dealers and otherfinancial intermediaries, please turn to the section “ImportantAdditional Information” on page 21.
PORTFOLIO SUMMARY: VCPSM MANAGED ASSET ALLOCATION SAST PORTFOLIO
- 20 -
Purchases and Sales of Portfolio Shares
Shares of the Portfolios may only be purchased or redeemedthrough Variable Contracts offered by the separate accounts ofparticipating life insurance companies. Shares of a Portfoliomay be purchased and redeemed each day the New York StockExchange is open, at the Portfolio’s net asset value determinedafter receipt of a request in good order.
The Portfolios do not have any initial or subsequent investmentminimums. However, your insurance company may imposeinvestment or account minimums. The prospectus (or otheroffering document) for your Variable Contract may containadditional information about purchases and redemptions of thePortfolios’ shares.
Tax Information
The Portfolios will not be subject to U.S. federal income tax onthe net investment company taxable income or net capital gainsdistributed to shareholders as ordinary income dividends orcapital gain dividends; however, you may be subject to federalincome tax (and a federal Medicare tax of 3.8% that applies tonet investment income, including taxable annuity payments, ifapplicable) upon withdrawal from such tax deferredarrangements.
Payments to Broker-Dealers andOther Financial Intermediaries
The Portfolios are not sold directly to the general public butinstead are offered as an underlying investment option forVariable Contracts. The Portfolios and their related companiesmay make payments to the sponsoring insurance company (or itsaffiliates) for distribution and/or other services. These paymentsmay create a conflict of interest as they may be a factor that theinsurance company considers in including the Portfolios asunderlying investment options in the Variable Contract. Theprospectus (or other offering document) for your VariableContract may contain additional information about thesepayments.
IMPORTANT ADDITIONAL INFORMATION
- 21 -

This Prospectus is designed to help you make informeddecisions about one of the investments available under yourVariable Contract (as such term is defined below). It providesyou with an overview of the Trust and five of its separateinvestment series (“Portfolios”) and their investment goals andprincipal investment strategies.
Shares of the Portfolios are not offered directly to the public.Instead, shares are currently issued and redeemed only inconnection with investments in and payments under variableannuity contracts and/or variable life insurance policies(collectively, “Variable Contracts”) offered by life insurancecompanies affiliated with SunAmerica Asset Management,LLC (“SunAmerica”), the Portfolios’ adviser and administrator.“You” and “your” as used in this Prospectus refer to contractowners who invest in the Portfolios indirectly through theirVariable Contracts. All shares of the Trust are owned by“Separate Accounts” of the life insurance companies. If youwould like to invest in a Portfolio, you must purchase a VariableContract from one of the life insurance companies. ThisProspectus offers Class 1 and Class 3 shares of each Portfolio.
You should be aware that the Variable Contracts involve fees andexpenses that are not described in this Prospectus, and that theVariable Contracts also may involve certain restrictions andlimitations. You will find information about purchasing aVariable Contract and the Portfolios available to you in theprospectus that offers the Variable Contracts, whichaccompanies this Prospectus.
The Trust does not foresee a disadvantage to contract ownersarising out of the fact that the Trust offers its shares for VariableContracts through the various life insurance companies.Nevertheless, the Trust’s Board of Trustees (the “Board”)intends to monitor events in order to identify any materialirreconcilable conflicts that may possibly arise and to determinewhat action, if any, should be taken in response. If such aconflict were to occur, one or more insurance company SeparateAccounts might withdraw their investments in a Portfolio. If thatwere to occur, a Portfolio might be forced to redeem some of itsshares in the Master Fund (as such term is defined below) inwhich it invests (as described under “Master-Feeder MutualFund Structure”); the Master Fund might in turn be forced to sellportfolio securities at disadvantageous prices.
Introduction to the Portfolios
This Prospectus provides information about five Portfoliosoffered by the Trust. The following sections describe keyinformation about the Portfolios, including informationregarding their investment goals, investment strategies, risksand fees. Each Portfolio’s investment goal can be changedwithout shareholder approval. Use the Portfolio Summaries tocompare each Portfolio with other mutual funds. More detailedinformation about the risks and investment techniques of thePortfolios can be found in “Portfolio Details” herein.
The Portfolio Summaries contain a discussion of the principalrisks of investing in each Portfolio. As with any mutual fund,there can be no guarantee that a Portfolio will meet its goal orthat a Portfolio’s performance will be positive for any period oftime.
Reading the Prospectus will help you to decide whether one ofthese Portfolios is the right investment for you. You should keepthis Prospectus for future reference. Additionally, because thesePortfolios are feeder funds in a master-feeder mutual fundstructure, as described below, it is important that you read theenclosed Master Fund prospectus which is provided to youalong with this Prospectus.
Master-Feeder Mutual Fund Structure
Each Portfolio described in this Prospectus operates as a “feederfund,” which means it does not buy individual securities directly.Instead, it invests all or substantially all of its investment assetsin another mutual fund, the “master fund,” which invests directlyin individual securities or the American Funds InsuranceSeries® Asset Allocation FundSM (the “Underlying Fund”), asapplicable. Each such master fund (each a “Master Fund,” andcollectively, the “Master Funds”) is a portfolio offered byAmerican Funds Insurance Series® (“AFIS”). Therefore, eachPortfolio has the same investment goal and limitations as itscorresponding Master Fund in which it invests and theinvestment return of each Portfolio corresponds directly to thatof its Master Fund. The differences in investment goals andpolicies among each of the five Master Funds can be expectedto affect the return of each Portfolio and the degree of marketand financial risk to which each Portfolio is subject.
As feeder funds, the Portfolios do not pay their investmentadviser for portfolio management services because eachPortfolio’s assets are invested in its respective Master Fund’sportfolio, which is managed by Capital Research andManagement Company (“Capital Research”), the MasterFunds’ investment adviser. Under the master-feeder structure,however, each Portfolio may withdraw its entire investmentfrom its corresponding Master Fund if the Board determinesthat it is in the best interests of the Portfolio and its shareholdersto do so. At the time of such withdrawal, the Board would haveto consider what action might be taken, including: (1) investingall of the assets of the Portfolio in another pooled investmententity (i.e., another master fund); (2) electing to haveSunAmerica, the Portfolios’ investment manager, manage thePortfolio either directly or with a subadviser under the Trust’sinvestment advisory and management agreement withSunAmerica; or (3) taking any other appropriate action. TheTrust, on behalf of each Portfolio, has entered into an investmentadvisory and management agreement with SunAmericapursuant to which SunAmerica will provide the services setforth below so long as a Portfolio is a “feeder fund” investinginto a Master Fund and provides that SunAmerica will provide
SUNAMERICA SERIES TRUST: A QUICK NOTE ABOUT THE PORTFOLIOS
- 22 -
portfolio management for a Portfolio if the Portfolio ceases tooperate as a “feeder fund.”
SunAmerica currently is waiving a portion of its advisory fee foreach Portfolio because it is not providing portfolio managementservices to the Portfolios. If a Portfolio were to withdraw itsentire investment from its corresponding Master Fund and theBoard approved SunAmerica as the investment manager for thePortfolio, SunAmerica would provide portfolio managementservices to the Portfolio, the current advisory fee waiver wouldterminate and SunAmerica would receive its full contractualadvisory fee for that Portfolio, effectively increasing theadvisory fee payable by the Portfolio, subject to any voluntaryor contractual fee waivers and/or expense reimbursementsagreed to between SunAmerica and the Trust at that time. See“Information about the Investment Manager to the Portfolios”for a more complete discussion of the advisory feearrangements.
SunAmerica provides those services for the Portfolios that arenormally provided by a fund’s investment adviser with theexception of portfolio management. Such services include, butare not limited to, monitoring the ongoing investmentperformance of the Master Funds, monitoring the Portfolios’other service providers, facilitating the distribution of MasterFund shareholder materials to Portfolio shareholders andproviding such other services as are necessary or appropriate tothe efficient operation of the Portfolios with respect to theirinvestment in the corresponding Master Funds.
Investment of each Portfolio’s assets in its corresponding MasterFund is not a fundamental policy of any Portfolio and ashareholder vote is not required for any Portfolio to withdraw itsentire investment from its corresponding Master Fund. Awithdrawal by a Portfolio of its investment in the correspondingMaster Fund could result in a distribution in kind of portfoliosecurities (as opposed to a cash distribution) to the Portfolio.Should such a distribution occur, the Portfolio could incurbrokerage fees or other transaction costs in converting suchsecurities to cash in order to pay redemptions. In addition, adistribution in kind to a Portfolio could result in a lessdiversified portfolio of investments and could affect adverselythe liquidity of the Portfolio.
The Board considered that the Portfolios will bear their ownportfolio expenses as well as their pro rata share of eachPortfolio’s corresponding Master Fund fees and expenses.
Because each Portfolio invests all or substantially all of its assetsin a Master Fund, each Portfolio and its shareholders will bear
the fees and expenses of both the Portfolio and the Master Fundin which it invests, and in the case of the VCPSM Managed AssetAllocation SAST Portfolio, indirectly the fees and expenses ofthe Underlying Fund in which the Master Managed Risk Fund(as such term is defined below) invests, with the result that eachPortfolio’s expenses may be higher than those of other mutualfunds which invest directly in securities. This structure isdifferent from that of other Trust portfolios and many otherinvestment companies, which directly acquire and manage theirown portfolio of securities. Each Master Fund may have othershareholders, each of whom, like each Portfolio, will pay theirproportionate share of the Master Fund’s expenses. Theexpenses and, correspondingly, the returns of other shareholdersof the Master Funds may differ from those of the Portfolios. TheMaster Funds are not established as partnerships, and thereforedo not allocate income and expenses, but pay distributions toeach Master Fund shareholder, including the Portfolios.
Information about the Master Funds and Capital Research isprovided with their permission and is based on informationprovided by Capital Research or derived from AFIS.
Portfolios and Master Funds
Each Master Fund is a portfolio offered by AFIS. EachPortfolio’s corresponding Master Fund is listed below:
TrustFeeder Fund
AFISMaster Fund
American Funds®
Growth SAST PortfolioAmerican Funds InsuranceSeries® Growth Fund(“Master Growth Fund”)
American Funds®
Global Growth SASTPortfolio
American Funds InsuranceSeries® Global Growth Fund(“Master Global GrowthFund”)
American Funds®
Growth-Income SASTPortfolio
American Funds InsuranceSeries® Growth-Income Fund(“Master Growth-IncomeFund”)
American Funds®
Asset Allocation SASTPortfolio
American Funds InsuranceSeries® Asset AllocationFund (“Master AssetAllocation Fund”)
VCPSM Managed AssetAllocation SAST Portfolio
American Funds InsuranceSeries® Managed Risk AssetAllocation Fund (“MasterManaged Risk Fund”)
SUNAMERICA SERIES TRUST: A QUICK NOTE ABOUT THE PORTFOLIOS
- 23 -
Shares of the Portfolios are not offered directly to the public.Instead, shares are currently issued and redeemed only inconnection with investments in and payments under VariableContracts offered by life insurance companies affiliated withSunAmerica. All shares of the Trust are owned by SeparateAccounts of the life insurance companies. If you would like toinvest in a Portfolio, you must purchase a Variable Contract fromone of the life insurance companies. The Trust offers threeclasses of shares: Class 1, Class 2 and Class 3 shares. EachPortfolio offers only Class 1 and Class 3 shares.
Service (12b-1) Plan
Class 3 shares of each Portfolio are subject to a Rule 12b-1 Planthat provides for service fees payable at the annual rate of up to0.25% of the average daily net assets of such class of shares. Theservice fees will be used to compensate the life insurancecompanies for costs associated with the servicing of Class 3shares, including the cost of reimbursing the life insurancecompanies for expenditures made to financial intermediaries forproviding services to contract owners who are the indirectbeneficial owners of the Portfolio’s Class 3 shares. Becausethese fees are paid out of each Portfolio’s Class 3 assets on anongoing basis, over time these fees will increase the cost of yourinvestment and may cost you more than paying other types ofsales charges. Class 1 shares of each Portfolio are not subject toservice fees.
The Master Funds
The Master Funds, other than the Master Managed Risk Fund,do not charge a 12b-1 fee for the Class 1 shares in which thePortfolios invest.
With respect to the Master Managed Risk Fund, AFIS hasadopted a plan of distribution for the Class P1 shares underwhich it may finance activities primarily intended to sell shares,provided that the categories of expenses are approved by theAFIS board of trustees. The plan provides for annual expensesof 0.25% for Class P1 shares; however, the AFIS board oftrustees has not authorized any payments under the plan.
The insurance companies for which the Master Managed RiskFund’s Class P1 shares are available provide certainadministrative services for the contract owners for which theshares of the Master Managed Risk Fund are beneficiallyowned. These services include, but are not limited to, recordmaintenance, shareholder communications and transactionalservices. These services are provided pursuant to an InsuranceAdministrative Services Plan (the “Services Plan”) adopted bythe Master Managed Risk Fund. Under the Services Plan, theinsurance companies receive 0.25% of the Master ManagedRisk Fund’s average daily net assets attributable to Class P1shares.
Payments in Connection with Distribution
Certain life insurance companies affiliated with SunAmericareceive revenue sharing payments from SunAmerica inconnection with certain administrative, marketing and otherservicing activities, including payments to help offset costs formarketing activities and training to support sales of thePortfolio, as well as occasional gifts, entertainment or othercompensation as incentives. Payments may be derived from12b-1 (service) fees that are deducted directly from the assets ofthe Portfolio or from investment management fees received bythe adviser.
ACCOUNT INFORMATION
- 24 -

Valuation of Shares. The net asset value per share (“NAV”) foreach Portfolio is determined each business day at the close ofregular trading on the New York Stock Exchange (“NYSE”)(generally 4:00 p.m., Eastern Time) by dividing the net assets ofeach Portfolio by the number of such Portfolio’s outstandingshares. Because certain of the Portfolios may hold securities thatare listed primarily on foreign exchanges that trade on weekendsor days when the Portfolios do not price their shares, the valuesof the Portfolios may change on days when you will not be ableto purchase or redeem your Portfolio shares.
Because Class 3 shares are subject to service fees, while Class 1shares are not, the NAV of the Class 3 shares will generally belower than the NAV of the Class 1 shares of each Portfolio.
Fair Valuation
The NAV of each Portfolio is determined based upon the NAVof its corresponding Master Fund.
The Master Funds
Each Master Fund calculates its NAV each day the NYSE isopen for trading as of 4 p.m. New York time, the normal closeof regular trading. If, for example, the NYSE closes at 1 p.m.New York time, the Master Funds’ NAVs would still bedetermined as of 4 p.m. New York time. In this example,portfolio securities traded on the NYSE would be valued at theirclosing prices unless Capital Research determines that a “fairvalue” adjustment is appropriate due to subsequent events.Equity securities are valued primarily on the basis of marketquotations, and debt securities are valued primarily on the basisof prices from third-party pricing services. Futures contracts arevalued primarily on the basis of settlement prices. The MasterFunds have adopted procedures for making “fair value”determinations if market quotations or prices from third-partypricing services, as applicable, are not readily available or arenot considered reliable. For example, if events occur betweenthe close of markets outside the United States and the close ofregular trading on the NYSE that, in the opinion of CapitalResearch, materially affect the value of any of the Master Funds’or the Underlying Fund’s equity securities that trade principallyin those international markets, those securities will be valued inaccordance with fair value procedures. Similarly, fair valueprocedures may be employed if an issuer defaults on its debtsecurities and there is no market for its securities. Use of theseprocedures is intended to result in more appropriate NAVs and,where applicable, to reduce potential arbitrage opportunitiesotherwise available to short-term investors.
Because certain of the Master Funds and the Underlying Fund,in which the Master Managed Risk invests, may hold securitiesthat are listed primarily on foreign exchanges that trade onweekends or days when the Master Funds do not price their
shares, the values of securities held in the Master Funds maychange on days when you will not be able to purchase or redeemyour Portfolio shares.
Shares of the Master Funds will be purchased or sold at the NAVnext determined after receipt of requests from the appropriateinsurance company. Requests received by the appropriateinsurance company prior to 4 p.m. New York time andcommunicated by the insurance company to the Master Fundsor their agent will be purchased or sold at that day’s NAV.
Buying and Selling Portfolio Shares
The Portfolios
Buy and sell prices. The Separate Accounts buy and sell sharesof a Portfolio at NAV, without any sales or other charges.
Execution of requests. The Trust is open on those days whenthe NYSE is open for regular trading. Buy and sell requests areexecuted at the next NAV to be calculated after the request isaccepted by the Trust. If the order is received by the Trust, or theinsurance company as its authorized agent, before the Trust’sclose of business (generally 4:00 p.m., Eastern time), the orderwill receive that day’s closing price. If the order is received afterthat time, it will receive the next business day’s closing price.
If trading is halted or restricted on the NYSE or under otheremergency conditions as determined by the Securites andExchange Commission (“SEC”), a Portfolio may temporarilysuspend the processing of sell requests, or may postponepayment of proceeds for up to seven business days or longer.
The Master Funds
Buy and sell prices. Shares of the Master Funds are currentlyoffered only to insurance company Separate Accounts andfeeder funds that themselves are offered only to insurancecompany Separate Accounts. All such shares may be purchasedor redeemed by the Separate Accounts or feeder funds withoutany sales or redemption charges at NAV. Such purchases andredemptions are made promptly after corresponding purchasesand redemptions of units of the Separate Accounts/feeder funds.
Restrictions on Sales. All Master Fund shares may bepurchased or redeemed at NAV without any sales or redemptioncharges.
Frequent Purchases and Redemptions of Shares
The Portfolios, which are offered only through VariableContracts, are intended for long-term investment and not asfrequent short-term trading (“market timing”) vehicles.Accordingly, organizations or individuals that use market timing
TRANSACTION POLICIES
- 25 -

investment strategies and make frequent transfers orredemptions should not acquire Variable Contracts that relate toshares of the Portfolios.
The Board has adopted policies and procedures with respect tomarket timing activity as discussed below.
The Trust believes that market timing activity is not in the bestinterest of the Portfolios’ performance or their participants.Market timing can disrupt the ability of a manager to investassets in an orderly, long-term manner, which may have anadverse impact on the performance of a Portfolio. In addition,market timing may increase a Portfolio’s expenses throughincreased brokerage, transaction and administrative costs;forced and unplanned portfolio turnover; and large asset swingsthat decrease a Portfolio’s ability to provide maximuminvestment return to all participants. This in turn can have anadverse effect on Portfolio performance.
Each Master Fund, including the Master Managed Risk Fundindirectly through its investment in the Underlying Fund, mayinvest in foreign securities. The Master Asset AllocationFund and the Master Managed Risk Fund, indirectly through itsinvestment in the Underlying Fund, may invest significantly inhigh-yield fixed income securities (“junk bonds”), which areconsidered speculative. To the extent a Master Fund invests inforeign securities or junk bonds, its corresponding Portfoliomay be particularly vulnerable to market timing. Market timingin a Portfolio whose corresponding Master Fund investssignificantly in foreign securities may occur because of timezone differences between the foreign markets on which theMaster Fund’s international portfolio securities trade and thetime as of which the Portfolio’s NAV is calculated. Markettiming in a Portfolio whose corresponding Master Fund investssignificantly in junk bonds may occur if market prices are notreadily available for the Master Fund’s junk bond holdings.Market timers may purchase shares of a Portfolio based onevents occurring after foreign market closing prices areestablished but before calculation of the Portfolio’s NAV, or ifthey believe market prices for junk bonds are not accuratelyreflected by a Master Fund.
Shares of the Portfolios are generally held through SeparateAccounts. The ability of the Trust to monitor transfers made bythe participants in Separate Accounts maintained by financialintermediaries is limited by the institutional nature of theseomnibus accounts. The Board’s policy is that the Portfolios mustrely on the insurance company Separate Accounts to bothmonitor market timing within a Portfolio and attempt to preventit through their own policies and procedures. The Trust hasentered into agreements with the insurance company SeparateAccounts that require the insurance company SeparateAccountsto provide certain information to help identify frequent tradingactivity and to prohibit further purchases or exchanges by ashareholder identified as having engaged in frequent trades. Insituations in which the Trust becomes aware of possible market
timing activity, it will notify the insurance company SeparateAccount in order to help facilitate the enforcement of suchentity’s market timing policies and procedures.
There is no guarantee that the Trust will be able to detect markettiming activity or the participants engaged in such activity, or, ifit is detected, to prevent its recurrence. Whether or not the Trustdetects it, if market timing activity occurs, you may be subjectto the disruptions and increased expenses discussed above. TheTrust reserves the right, in its sole discretion and without priornotice, to reject or refuse purchase orders received frominsurance company Separate Accounts, whether directly or bytransfer, including orders that have been accepted by a financialintermediary, that the Trust determines not to be in the bestinterest of the Portfolios. Such rejections or refusals will beapplied uniformly without exception.
Any restrictions or limitations imposed by the insurancecompany Separate Accounts may differ from those imposed bythe Trust. Please review your Variable Contract prospectus formore information regarding the insurance company’s markettiming policies and procedures, including any restrictions orlimitations that the insurance company Separate Accounts mayimpose with respect to trades made through a Variable Contract.Please refer to the documents pertaining to your VariableContract prospectus on how to direct investments in orredemptions from (including making transfers into or out of) thePortfolios and any fees that may apply.
The Master Funds
The Portfolios also may be affected if there is frequent tradingof Master Fund shares by other shareholders of a Master Fund.Frequent trading of a Master Fund’s shares may lead toincreased costs to the Master Fund and less efficientmanagement of the Master Fund’s portfolio, potentiallyresulting in dilution of the value of the shares held by long-termshareholders, such as the Portfolios.
The Master Funds and American Funds Distributors, Inc.(“AFD”), the Master Funds’ distributor, reserve the right toreject any purchase order for any reason. The Master Funds arenot designed to serve as vehicles for frequent trading in responseto short-term fluctuations in the securities markets.Accordingly,purchases, including those that are part of exchange activity, thata Master Fund or AFD has determined could involve actual orpotential harm to any Master Fund may be rejected.
Information about the Portfolios’ Distributor
AIG Capital Services, Inc. (the “Distributor”), the Portfolios’distributor, distributes each Portfolio’s shares and incurs theexpenses of distributing the Portfolios’ shares under aDistribution Agreement with respect to the Portfolios, none ofwhich are reimbursed by or paid for by the Portfolios. TheDistributor is located at Harborside 5, 185 Hudson Street, Suite3300, Jersey City, NJ 07311.
TRANSACTION POLICIES
- 26 -
Distributions. Each Portfolio annually declares and distributessubstantially all of its net investment income in the form ofdividends. Distributions from net realized gains, if any, are paidannually for all Portfolios.
Distribution Reinvestments. The dividends and distributions, ifany, will be reinvested automatically in additional shares of thesame Portfolio on which they were paid. The per share dividendson Class 3 shares will generally be lower than the per sharedividends on Class 1 shares of the same Portfolio as a result ofthe fact that Class 3 shares are subject to service fees, whileClass 1 shares are not.
Taxability of a Portfolio. Each Portfolio intends to qualify as a“regulated investment company” under the Internal RevenueCode of 1986, as amended (the “Internal Revenue Code”),including maintaining the level of diversification requiredthereunder. As long as each Portfolio is qualified as a regulatedinvestment company, it will not be subject to U.S. federalincome tax on the earnings that it distributes to its shareholders.
Taxability of Contract Owners. Generally, the owners ofVariable Contracts are not taxed currently on income or gainrealized by such contracts. However, some distributions fromVariable Contracts may be taxable. In addition, distributionsmade to an owner who is younger than 59½ may be subject to apenalty tax of 10%.
In order for the holders of a Variable Contract to receive thisfavorable tax treatment, the Separate Accounts underlying suchcontracts must meet certain diversification and investor controlrequirements, as must the underlying funds in which they invest.
If a Portfolio, a Master Fund or a Separate Account were to failto meet the diversification, minimum distribution or investorcontrol requirements, income allocable to the contracts wouldbe taxable currently to the holders of the contracts and incomefrom prior periods relating to such contracts could also betaxable and would remain taxable in future years, even ifdiversification was achieved in the future.
The Master Funds
Each Master Fund intends to qualify as a “regulated investmentcompany” under the Internal Revenue Code. In any fiscal yearin which a Master Fund so qualifies and distributes toshareholders its investment company taxable income and netrealized capital gain, the Master Fund itself is relieved of federalincome tax.
It is the Master Funds’ policy to distribute to the shareholders(the insurance company Separate Accounts and any feederfunds) all of its investment company taxable income and capitalgain for each fiscal year.
See the applicable contract prospectus for information regardingthe federal income tax treatment of the contracts anddistributions to the Separate Accounts.
Custodian, Transfer and Dividend Paying Agent
State Street Bank and Trust Company, Boston, Massachusetts,acts as Custodian of the Trust’s assets. VALIC RetirementServices Company is the Trust’s Transfer and Dividend PayingAgent and in so doing performs certain bookkeeping, dataprocessing and administrative services.
DIVIDEND POLICIES AND TAXES
- 27 -

Additional Information about Investments,Investment Techniques and Risks
The Master Funds, including the Master Managed Risk Fundindirectly through its investments in the Underlying Fund, mayuse other investments and techniques in an effort to increasereturns, protect assets or diversify investments. The Statementof Additional Information (“SAI”) for the Portfolios containsadditional information about the Master Funds’ otherinvestment techniques. For information on how to obtain anSAI, see the back cover. When you request a copy of thePortfolios’ SAI, you will also receive a copy of the MasterFunds’ SAI free of charge.
Active Trading (Master Growth Fund, Master GlobalGrowth Fund, Master Growth-Income Fund and MasterAsset Allocation Fund). A strategy used whereby a MasterFund may engage in frequent trading of portfolio securities toachieve its investment goal. Active trading may result in highportfolio turnover and correspondingly greater brokeragecommissions and other transaction costs, which will be borneindirectly pro rata by a Portfolio. During periods of increasedmarket volatility, active trading may be more pronounced.Under certain market conditions, the investment policies of theMaster Asset Allocation Fund may result in higher portfolioturnover than those of the other Master Funds.
Currency Volatility Risk (All five Master Funds). The valueof a Master Fund’s or the Underlying Fund’s foreign investmentsmay fluctuate due to changes in currency exchange rates. Adecline in the value of foreign currencies relative to the U.S.dollar generally can be expected to depress the value of a MasterFund’s or the Underlying Fund’s non-U.S. dollar-denominatedsecurities.
Defensive Investments (All five Master Funds). Each MasterFund or the Underlying Fund will also hold cash or moneymarket instruments, the amount of which will vary and willdepend on various factors, including market conditions andpurchases and redemptions of fund shares. For temporarydefensive purposes, a Master Fund or the Underlying Fund mayhold all, or a significant portion, of its assets in cash or moneymarket instruments. When a Master Fund or the UnderlyingFund takes a defensive position, it may miss out on investmentopportunities that could have resulted from investing inaccordance with its principal investment strategy. As a result, aMaster Fund or the Underlying Fund may not achieve itsinvestment goal.
Depositary Receipts Risk (All five Master Funds). TheMaster Funds, including the Managed Master Risk Fundindirectly through its investment in the Underlying Fund, investin securities of foreign issuers in the form of depositary receipts,such as American Depositary Receipts, European DepositaryReceipts and Global Depositary Receipts, which typically areissued by local financial institutions and evidence ownership of
the underlying securities. Depositary receipts are generallysubject to the same risks as the foreign securities that theyevidence or into which they may be converted. Depositaryreceipts may or may not be jointly sponsored by the underlyingissuer. The issuers of unsponsored depositary receipts are notobligated to disclose information that is considered material inthe United States. Therefore, there may be less informationavailable regarding these issuers and there may not be acorrelation between such information and the market value ofthe depositary receipts. Certain depositary receipts are not listedon an exchange and therefore may be considered to be illiquidsecurities.
Risk of Income-Oriented Stocks (Master Growth-IncomeFund, Master Asset Allocation Fund and Master ManagedRisk Fund). Changes in dividend policies or the availability ofcapital resources may reduce the income from companies inwhich the Master Funds or the Underlying Fund invest.
Risks of Investing in Emerging Market Countries (All fiveMaster Funds). Investing in countries with developingeconomies and/ or markets may involve risks in addition to andgreater than those generally associated with investing in thesecurities markets of developed countries. Emerging anddeveloping countries may have less developed legal andaccounting systems than those in developed countries. Thegovernments of these countries may be more unstable and morelikely to impose capital controls, nationalize a company orindustry, place restrictions on foreign ownership and onwithdrawing sale proceeds of securities from the country, and/or impose punitive taxes that could adversely affect the prices ofsecurities. The economies of these countries may be dependenton relatively few industries that are more susceptible to local andglobal changes. Securities markets in these countries can also berelatively small and have substantially lower trading volumes.As a result, securities issued in these countries may be morevolatile and less liquid, and may be more difficult to value, thansecurities issued in countries with more developed economies ormarkets. Because these markets may not be as mature, there maybe increased settlement risks for transactions in local securities.
Equity securities (All five Master Funds). Equity securitiessuch as common stocks, represent shares of equity ownershipin a corporation. Common stocks may or may not receivedividend payments. Certain securities have common stockcharacteristics, including certain convertible securities such asconvertible bonds, convertible preferred stock, rights andwarrants, and may be classified as equity securities.Investments in equity securities and securities with equitycharacteristics include:
• Convertible securities are securities (such as bonds orpreferred stocks) that may be converted into commonstock of the same or a different company. Convertiblesecurities, like fixed income securities, tend to increasein value when interest rates decline and decrease in
PORTFOLIO DETAILS
- 28 -

value when interest rates rise. The market value of aconvertible security also tends to increase as themarket value of the underlying stock rises and decreaseas the market value of the underlying stock declines.
• Rights represent a preemptive right of stockholders topurchase additional shares of a stock at the time of anew issuance before the stock is offered to the generalpublic.
• Warrants are rights to buy common stock of acompany at a specified price during the life of thewarrant.
Fixed Income Securities (All five Master Funds). Fixedincome securities are broadly classified as securities thatprovide for periodic payment, typically interest or dividendpayments, to the holder of the security at a stated rate. Mostfixed income securities, such as bonds, represent indebtednessof the issuer and provide for repayment of principal at a statedtime in the future. Others do not provide for repayment of aprincipal amount. The issuer of a senior fixed income securityis obligated to make payments on this security ahead of otherpayments to security holders. Investments in fixed incomesecurities include:
• Agency discount notes are high credit quality, shortterm debt instruments issued by federal agencies andgovernment sponsored enterprises. These securitiesare issued at a discount to their par value.
• Corporate debt instruments (bonds, notes anddebentures) are securities representing a debt of acorporation. The issuer is obligated to repay a principalamount of indebtedness at a stated time in the futureand in most cases to make periodic payments ofinterest at a stated rate.
• An investment grade fixed income security is ratedin one of the top four rating categories by a debt ratingagency (or is considered of comparable quality byCapital Research). The two best-known debt ratingagencies are S&P Global (Ratings) (“S&P”) andMoody’s Investors Service (“Moody’s”). Investmentgrade refers to any security rated “BBB-” or above byS&P or “Baa3” or above by Moody’s, or if unrated,determined to be of comparable quality by CapitalResearch.
• A junk bond is a high yield, high risk bond that doesnot meet the credit quality standards of an investmentgrade security.
• Pass-Through Securities involve various debtobligations that are backed by a pool of mortgages orother assets. Principal and interest payments made onthe underlying asset pools are typically passed throughto investors. Types of pass-through securities includemortgage-backed securities, collateralized mortgageobligations, commercial mortgage-backed securities,
and asset-backed securities. To be announced (“TBA”)mortgage-backed securities represent contracts for thepurchase or sale of mortgage-backed securities to bedelivered at a future agreed upon date.
• Preferred stocks receive dividends at a specified rateand have preference over common stock in thepayment of dividends and the liquidation of assets.
• U.S. Government securities are issued or guaranteedby the U.S. Government, its agencies andinstrumentalities. Some U.S. Government securitiesare issued or unconditionally guaranteed by the U.S.Treasury. They are generally considered to be of highcredit quality. While these securities are subject tovariations in market value due to fluctuations ininterest rates, they are expected to be paid in full if heldto maturity. Other U.S. Government securities areneither direct obligations of, nor guaranteed by, theU.S. Treasury. However, they involve federalsponsorship in one way or another. For example, someare backed by specific types of collateral; some aresupported by the issuer’s right to borrow from theTreasury; some are supported by the discretionaryauthority of the Treasury to purchase certainobligations of the issuer; and others are supported onlyby the credit of the issuing government agency orinstrumentality.
• Zero-Coupon Bonds are debt obligations issued orpurchased at a significant discount from face value.
Foreign Exposure (All five Master Funds). Investors inforeign countries are subject to a number of risks. A principalrisk is that fluctuations in the exchange rates between the U.S.dollar and foreign currencies may negatively affect aninvestment. In addition, there may be less publicly availableinformation about a foreign company and it may not be subjectto the same uniform accounting, auditing and financialreporting standards as U.S. companies. Foreign governmentsmay not regulate securities markets and companies to the samedegree as in the U.S. Foreign investments will also be affectedby local political or economic developments and governmentalactions. Consequently, foreign securities may be less liquid,more volatile and more difficult to price than U.S. securities.
Forward Currency Contract Risk (All five Master Funds).Each of the Master Growth Fund, Master Global Growth Fund,Master Asset Allocation Fund and Master Managed Risk Fund,indirectly through its investment in the Underlying Fund, canenter into forward currency contracts to protect against changesin currency exchange rates. Master Growth-Income Fund doesnot currently intend to engage in any such transactions otherthan purchasing and selling foreign exchange contracts whichwill be used to facilitate settlement of trades. A forwardcurrency contract is an obligation to purchase or sell a specificcurrency at a future date, which may be any fixed number of
PORTFOLIO DETAILS
- 29 -
days from the date of the contract agreed upon by the parties, ata price set at the time of the contract. Forward currency contractsentered into by the Master Funds and the Underlying Fund willinvolve the purchase or sale of one currency against the U.S.dollar. While entering into forward currency transactions couldminimize the risk of loss due to a decline in the value of thehedged currency, it could also limit any potential gain whichmight result from an increase in the value of the currency. TheMaster Funds and the Underlying Fund will not generallyattempt to protect against all potential changes in exchangerates. The Master Funds and the Underlying Fund will segregateliquid assets which will be marked to market daily to meet theirforward contract commitments to the extent required by theSEC. To the extent a forward currency contract is used to hedgeanother position in a Master Fund or the Underlying Fund, theMaster Fund or the Underlying Fund will be exposed to the risksassociated with hedging. While hedging strategies can be veryuseful and inexpensive ways of reducing risk, they aresometimes ineffective due to unexpected changes in the market.Hedging also involves the risk that changes in the value of thederivative will not match those of the instruments being hedgedas expected, in which case any losses on the instruments beinghedged may not be reduced.
Futures Risk (Master Managed Risk Fund). A futurescontract is considered a derivative because it derives its valuefrom the price of the underlying security or financial index.Losses on futures contracts may exceed the amount invested.The prices of futures contracts can be volatile, and futurescontracts may be illiquid.
Futures exchanges may limit the amount of fluctuationpermitted in certain futures contract prices during a singletrading day. The daily limit establishes the maximum amountthat the price of a futures contract may vary either up or downfrom the previous day’s settlement price at the end of the currenttrading session. Once the daily limit has been reached in afutures contract subject to the limit, no more trades may be madeon that day at a price beyond that limit. The daily limit governsonly price movements during a particular trading day andtherefore does not limit potential losses because the limit maywork to prevent the liquidation of unfavorable positions. Forexample, futures prices have occasionally moved to the dailylimit for several consecutive trading days with little or notrading, thereby preventing prompt liquidation of positions andsubjecting some holders of futures contracts to substantiallosses.
There can be no assurance that a liquid market will exist at atime when the Master Managed Risk Fund seeks to close out afutures position, and the Master Managed Risk Fund wouldremain obligated to meet margin requirements until the positionis closed. In addition, there can be no assurance that an activesecondary market will continue to exist.
Initial margin will be held at the clearinghouse or exchange forsuch futures contract, and variation margin may be held intradayat the Master Managed Risk Fund’s futures commissionmerchant, or FCM, that buys or sells such futures contract. Anysuch amounts are subject to the risk that the party holding suchcash defaults on its obligations during the time it is in possessionof such cash and is unable to fund its obligation to, or on behalfof, the Master Managed Risk Fund.
Illiquid/Restricted securities (All five Master Funds) aresubject to legal or contractual restrictions that may make themdifficult to sell. A security that cannot easily be sold withinseven days will generally be considered illiquid. Certainrestricted securities (such as Rule 144A securities) are notgenerally considered illiquid because of their establishedtrading market.
Issuer Risk (Master Managed Risk Fund). The values of, andthe income generated by, securities held by the Underlying Fundmay also decline in response to various factors directly relatedto the issuers of such securities, including reduced demand foran issuer’s goods or services, poor management performanceand strategic initiatives such as mergers, acquisitions ordispositions and the market response to any such initiative.
Risk of Thinly-Traded Securities (All five Master Funds).There may not be a market for certain securities making itdifficult or impossible to sell at the time and the price that theseller would like.
Large Cap Companies Risk (All five Master Funds). Largecap companies tend to go in and out of favor based on marketand economic conditions. Large cap companies tend to be lessvolatile than companies with smaller market capitalizations. Inexchange for this potentially lower risk, a Master Fund’s or theUnderlying Fund’s value may not rise as much as the value ofportfolios that emphasize smaller cap companies.
Market Risk (All five Master Funds). Each of the Portfolios’,the Master Funds’ or the Underlying Fund’s share price can fallbecause of weakness in the broad market, a particular industry,or specific holdings. The market as a whole can decline formany reasons, including adverse political or economicdevelopments here or abroad, changes in investor psychology, orheavy institutional selling. The prospects for an industry orissuer may deteriorate because of a variety of factors, includingdisappointing earnings or changes in the competitiveenvironment. In addition, the investment adviser’s assessment ofissuers held in a Master Fund or the Underlying Fund may proveincorrect, resulting in losses or poor performance even in arising market. Finally, the Master Funds’ or the UnderlyingFund’s investment approach could fall out of favor with theinvesting public, resulting in lagging performance versus othercomparable portfolios.
PORTFOLIO DETAILS
- 30 -
Market Volatility (All five Master Funds). The stock and/orbond markets as a whole could go up or down (sometimesdramatically). This could affect the value of the securities in aMaster Fund’s or the Underlying Fund’s portfolio. Individualstocks are affected by many factors, including:
• corporate earnings,
• production,
• management,
• sales, and
• market trends, including investor demand for aparticular type of stock, such as growth or value stocks,small or large stocks, or stocks within a particularindustry.
Stock markets are affected by numerous factors, includinginterest rates, the outlook for corporate profits, the health of thenational and world economies, national and world social andpolitical events, and the fluctuation of other stock marketsaround the world.
RepurchaseAgreements (All five Master Funds). The MasterFunds, including the Master Managed Risk Fund directly orindirectly through its investment in the Underlying Fund, mayenter into repurchase agreements under which the Master Fundsor the Underlying Fund buy a security and obtain a simultaneouscommitment from the seller to repurchase the security at aspecified time and price. The seller must maintain with theMaster Funds’ or the Underlying Fund’s custodian collateralequal to at least 100% of the repurchase price, including accruedinterest, as monitored daily by the investment adviser. If theseller under the repurchase agreement defaults, a Master Fundor the Underlying Fund may incur a loss if the value of thecollateral securing the repurchase agreement has declined andmay incur disposition costs in connection with liquidating thecollateral. If bankruptcy proceedings are commenced withrespect to the seller, realization of the collateral by a MasterFund or the Underlying Fund may be delayed or limited.
Securities Selection Risk (All five Master Funds). A strategyused by a Master Fund or the Underlying Fund, or securitiesselected by its portfolio managers, may fail to produce theintended return.
Short-Term Investments (All five Master Funds). Short-terminvestments include money market securities, such as short-term U.S. government obligations, repurchase agreements,commercial paper, bankers’ acceptances and certificates ofdeposit. These securities provide a Master Fund with sufficientliquidity to meet redemptions and cover expense.
Small (Master Growth Fund, Master Growth-Income Fund,Master Asset Allocation Fund and Master Managed Risk
Portfolio) and Medium Sized (All five Master Funds)Companies Risk. Each of the Master Growth Fund, MasterGrowth-Income Fund, Master Asset Allocation Fund andMaster Managed Risk Fund, indirectly through its investment inthe Underlying Fund, may invest in the stocks of smallercapitalization companies (typically companies with marketcapitalizations of less than $3.5 billion at the time of purchase).Capital Research believes that the issuers of smallercapitalization stocks often provide attractive investmentopportunities. However, investing in smaller capitalizationstocks can involve greater risk than is customarily associatedwith investing in stocks of larger, more established companies.Companies with smaller market capitalizations tend to be atearly stages of development with limited product lines, marketaccess for products, financial resources, access to new capital,or depth in management. Consequently, the securities of smallercompanies may not be as readily marketable and may be subjectto more abrupt or erratic market movements. Securities ofmedium sized companies are also usually more volatile andentail greater risks than securities of large companies. Inaddition, small and medium sized companies may be traded inover-the-counter (“OTC”) markets as opposed to being tradedon an exchange. OTC securities may trade less frequently and insmaller volume than exchange-listed stocks, which may causethese securities to be more volatile than exchange-listed stocksand may make it more difficult to buy and sell these securitiesat prevailing market prices. The Master Funds and theUnderlying Fund determine relative market capitalizationsusing U.S. standards. Accordingly, the Master Funds’ and theUnderlying Fund’s non-U.S. investments may have largecapitalizations relative to market capitalizations of companiesbased outside the United States.
Tax Risk (Master Managed Risk Fund). The use of certainderivatives may cause a Master Fund to realize higher amountsof ordinary income or short-term capital gain, to suspend oreliminate holding periods of positions, and/or to defer realizedlosses, potentially increasing the amount of taxabledistributions, and of ordinary income distributions in particular.A Master Fund’s use of derivatives may be limited by therequirements for taxation of the Master Fund as a regulatedinvestment company. The tax treatment of derivatives may beaffected by changes in legislation, regulations or other legalauthority that could affect the character, timing and amount of aMaster Fund’s taxable income or gains and distributions toshareholders.
Unseasoned Companies Risk (All five Master Funds).Unseasoned companies are companies that have operated lessthan three years. The securities of such companies may havelimited liquidity, which can result in their being priced higher orlower than might otherwise be the case. In addition, investments
PORTFOLIO DETAILS
- 31 -
in unseasoned companies are more speculative and entailgreater risk than do investments in companies with anestablished operating record.
About the Indices
The Bloomberg Barclays U.S. Aggregate Bond Indexrepresents the U.S. investment-grade fixed-rate bond market.Unlike mutual funds, the Index does not incur expenses. Ifexpenses were deducted, the actual returns of the Index wouldbe lower.
The MSCI ACWI (All Country World Index) captures largeand mid-cap representation across 23 developed and 23emerging markets countries. With 2,482 constituents, the Indexcovers approximately 85% of the global investable equityopportunity set. Unlike mutual funds, the Index does not incurexpenses. If expenses were deducted the actual returns of theIndex would be lower.
The S&P 500® Index tracks the common stock performance of500 large-capitalization companies publicly traded in theUnited States. Because it is market-weighted, the Index willreflect changes in larger companies more heavily than those insmaller companies. Unlike mutual funds, the Index does notincur expenses. If expenses were deducted the actual returns ofthe Index would be lower.
Portfolio Holdings
The Portfolios. A description of the Portfolios’ policies andprocedures regarding the release of portfolio holdingsinformation is available in the Portfolios’ SAI. However, underthe master-feeder structure, each Portfolio’s sole or primaryportfolio holding is shares in the corresponding Master Fund(each Portfolio may also hold cash or cash equivalents).
The Master Funds. A description of the Master Funds’ policiesand procedures regarding the release of portfolio holdingsinformation is available in the Master Funds’ SAI.
PORTFOLIO DETAILS
- 32 -
Information about the Investment Adviserto the Master Funds
Capital Research, an experienced investment managementorganization founded in 1931, serves as investment adviser tothe Master Funds and to other mutual funds, including those inAFIS Capital Research, a wholly owned subsidiary of TheCapital Group Companies, Inc., is located at 333 South HopeStreet, Los Angeles, California 90071. Capital Researchmanages the investments and business affairs of the MasterFunds.
The Master Funds rely on the professional judgment of theirinvestment adviser, Capital Research, to make decisions aboutthe Master Funds’ portfolio investments. The basic investmentphilosophy of Capital Research is to seek to invest in attractivelypriced securities that, in its opinion, represent above-averagelong-term investment opportunities. Capital Research believesthat an important way to accomplish this is through fundamentalanalysis, including meeting with company executives andemployees, suppliers, customers and competitors. Securitiesmay be sold when Capital Research believes that they no longerrepresent relatively attractive investment opportunities.
Management Fee. The annual management fee for the yearended December 31, 2016, expressed as a percentage of eachMaster Fund’s average daily net assets and not taking intoaccount any applicable waivers, is as follows:
Master Fund Management Fee
Master Growth Fund ................................... 0.33%Master Global Growth Fund........................ 0.52%Master Growth-Income Fund ...................... 0.27%Master Asset Allocation Fund ..................... 0.28%Master Managed Risk Fund ........................ 0.15%
A discussion regarding the basis for the AFIS board of trustees’approval of the investment advisory agreement for the MasterGrowth Fund, Master Global Growth Fund, Master Growth-Income Fund, Master Asset Allocation Fund and MasterManaged Risk Fund is available in the Master Funds’ annualreport to shareholders for the fiscal year ended December 31,2016.
Information about the InvestmentManager to the Portfolios
Because each Portfolio invests all of its assets in a Master Fund,investment advisory services are currently provided at the
Master Fund level by Capital Research. Pursuant to itsinvestment advisory and management agreement with the Trust,SunAmerica, located at Harborside 5, 185 Hudson Street, Suite3300, Jersey City, New Jersey 07311, provides those servicesfor the Portfolios that are normally provided by a fund’sinvestment adviser with the exception of portfolio management.
SunAmerica provides master-feeder operational supportservices to each of the Portfolios under its investment advisoryand management agreement with the Trust so long as thePortfolios are part of a master-feeder fund structure. Suchservices will include, but are not limited to, monitoring theongoing investment performance of the Master Funds and theUnderlying Fund, monitoring the Portfolios’ other serviceproviders, facilitating the distribution of Master Fundshareholder materials to Portfolio shareholders and providingsuch other services as are necessary or appropriate to theefficient operation of the Portfolios with respect to theirinvestment in the corresponding Master Funds.
Under the Trust’s investment advisory and managementagreement with SunAmerica, if a Portfolio ceased to operate aspart of a master-feeder fund structure SunAmerica, upon theapproval of the Board, would provide the Portfolio withinvestment advisory services, including portfolio management,either directly or with a subadviser. For these services,SunAmerica would be entitled to receive a fee, accrued dailyand paid monthly, equal to the following percentage of averagedaily net assets:
Portfolio Advisory Fee
American Funds® Growth SAST Portfolio ........ 0.85%American Funds® Global Growth SAST
Portfolio .......................................................... 0.95%American Funds® Growth-Income SAST
Portfolio .......................................................... 0.85%American Funds® Asset Allocation SAST
Portfolio .......................................................... 0.85%VCPSM Managed Asset Allocation SAST
Portfolio .......................................................... 0.95%
Currently, because it is not providing portfolio managementservices to the Portfolios, SunAmerica is waiving this advisoryfee for the Portfolios as set forth below:
Portfolio Amount of Waiver
American Funds® Growth SASTPortfolio ................................................. 0.60%
MANAGEMENT
- 33 -
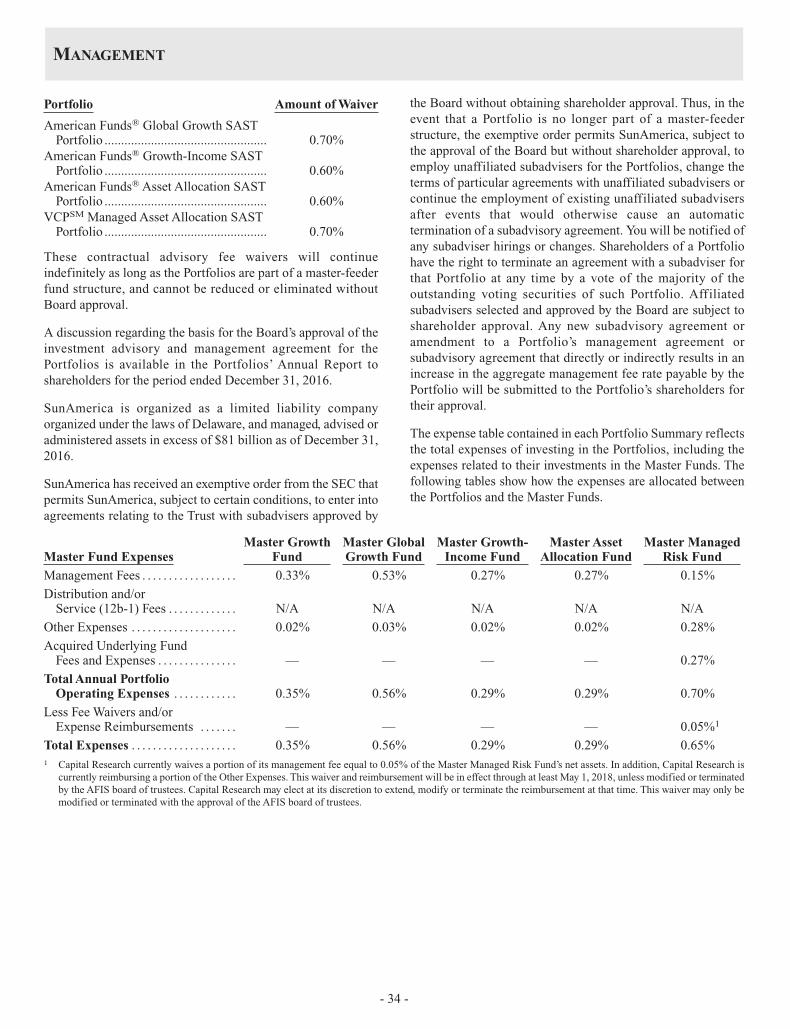
Portfolio Amount of Waiver
American Funds® Global Growth SASTPortfolio ................................................. 0.70%
American Funds® Growth-Income SASTPortfolio ................................................. 0.60%
American Funds® Asset Allocation SASTPortfolio ................................................. 0.60%
VCPSM Managed Asset Allocation SASTPortfolio ................................................. 0.70%
These contractual advisory fee waivers will continueindefinitely as long as the Portfolios are part of a master-feederfund structure, and cannot be reduced or eliminated withoutBoard approval.
A discussion regarding the basis for the Board’s approval of theinvestment advisory and management agreement for thePortfolios is available in the Portfolios’ Annual Report toshareholders for the period ended December 31, 2016.
SunAmerica is organized as a limited liability companyorganized under the laws of Delaware, and managed, advised oradministered assets in excess of $81 billion as of December 31,2016.
SunAmerica has received an exemptive order from the SEC thatpermits SunAmerica, subject to certain conditions, to enter intoagreements relating to the Trust with subadvisers approved by
the Board without obtaining shareholder approval. Thus, in theevent that a Portfolio is no longer part of a master-feederstructure, the exemptive order permits SunAmerica, subject tothe approval of the Board but without shareholder approval, toemploy unaffiliated subadvisers for the Portfolios, change theterms of particular agreements with unaffiliated subadvisers orcontinue the employment of existing unaffiliated subadvisersafter events that would otherwise cause an automatictermination of a subadvisory agreement. You will be notified ofany subadviser hirings or changes. Shareholders of a Portfoliohave the right to terminate an agreement with a subadviser forthat Portfolio at any time by a vote of the majority of theoutstanding voting securities of such Portfolio. Affiliatedsubadvisers selected and approved by the Board are subject toshareholder approval. Any new subadvisory agreement oramendment to a Portfolio’s management agreement orsubadvisory agreement that directly or indirectly results in anincrease in the aggregate management fee rate payable by thePortfolio will be submitted to the Portfolio’s shareholders fortheir approval.
The expense table contained in each Portfolio Summary reflectsthe total expenses of investing in the Portfolios, including theexpenses related to their investments in the Master Funds. Thefollowing tables show how the expenses are allocated betweenthe Portfolios and the Master Funds.
Master Fund ExpensesMaster Growth
FundMaster GlobalGrowth Fund
Master Growth-Income Fund
Master AssetAllocation Fund
Master ManagedRisk Fund
Management Fees . . . . . . . . . . . . . . . . . . 0.33% 0.53% 0.27% 0.27% 0.15%
Distribution and/orService (12b-1) Fees . . . . . . . . . . . . . N/A N/A N/A N/A N/A
Other Expenses . . . . . . . . . . . . . . . . . . . . 0.02% 0.03% 0.02% 0.02% 0.28%
Acquired Underlying FundFees and Expenses . . . . . . . . . . . . . . . — — — — 0.27%
Total Annual PortfolioOperating Expenses . . . . . . . . . . . . 0.35% 0.56% 0.29% 0.29% 0.70%
Less Fee Waivers and/orExpense Reimbursements . . . . . . . — — — — 0.05%1
Total Expenses . . . . . . . . . . . . . . . . . . . . 0.35% 0.56% 0.29% 0.29% 0.65%1 Capital Research currently waives a portion of its management fee equal to 0.05% of the Master Managed Risk Fund’s net assets. In addition, Capital Research is
currently reimbursing a portion of the Other Expenses. This waiver and reimbursement will be in effect through at least May 1, 2018, unless modified or terminatedby the AFIS board of trustees. Capital Research may elect at its discretion to extend, modify or terminate the reimbursement at that time. This waiver may only bemodified or terminated with the approval of the AFIS board of trustees.
MANAGEMENT
- 34 -

Feeder PortfolioExpenses
American Funds®
Growth SASTPortfolio
American Funds®
Global GrowthSAST Portfolio
American Funds®
Growth-IncomeSAST Portfolio
American Funds®
Asset AllocationSAST Portfolio
VCPSM ManagedAsset AllocationSAST Portfolio
Class 12 Class 3 Class 12 Class 3 Class 1 Class 3 Class 1 Class 3 Class 1 Class 3
Management Fees . . . . . . . 0.83% 0.85% 0.95% 0.95% 0.85% 0.85% 0.85% 0.85% 0.95% 0.95%
Distribution and/orService (12b-1) Fees . . N/A 0.25% N/A 0.25% N/A 0.25% N/A 0.25% N/A 0.25%
Other Expenses . . . . . . . . . 0.05% 0.03% 0.03% 0.03% 0.04% 0.04% 0.04% 0.04% 0.03% 0.03%
Total Annual PortfolioOperating Expenses . . . 0.88% 1.13% 0.98% 1.23% 0.89% 1.14% 0.89% 1.14% 0.98% 1.23%
Less FeeWaiver/Reimbursement . . . . . . . 0.60% 0.60% 0.70% 0.70% 0.60% 0.60% 0.60% 0.60% 0.70% 0.70%
Total Annual PortfolioOperating ExpensesAfter Waivers and/orReimbursements . . . . . . 0.28% 0.53% 0.28% 0.53% 0.29% 0.54% 0.29% 0.54% 0.28% 0.53%
Total Master FeederFund Expenses . . . . . . . 0.63% 0.88% 0.84% 1.09% 0.58% 0.83% 0.58% 0.83% 0.93% 1.18%
2 “Other Expenses” for Class 1 shares are based on estimated amounts for the current fiscal year.
SunAmerica has entered into a contractual agreement with theTrust under which it is voluntarily waiving fees and/orreimbursing expenses so that the Total Annual PortfolioOperating Expenses After Waivers and/or Reimbursements forClass 3 shares do not exceed 0.70% of each Portfolio’s expenses(0.53% for VCPSM Managed Asset Allocation SAST Portfolio).For purposes of the waived fees and/or reimbursed expensecalculations, Total Annual Portfolio Operating Expenses shallnot include extraordinary expenses (i.e., expenses that areunusual in nature and/or infrequent in occurrence, such aslitigation), or acquired fund fees and expenses, brokeragecommissions and other transactional expenses relating to thepurchase and sale of portfolio securities, interest, taxes andgovernmental fees and other expenses not incurred in theordinary course of the Trust’s business on behalf of the Portfolio.These fee waivers and/or reimbursements will continueindefinitely and cannot be reduced or eliminated without Boardapproval. Any waivers or reimbursements, with the exception ofAdvisory Fee Waivers made by SunAmerica with respect to thePortfolios, are subject to recoupment from the Portfolio withintwo years after the occurrence of any such waivers and/orreimbursements, provided that the Portfolio is able to effect suchpayment to SunAmerica and remain in compliance with theexpense limitations in effect at the time the waivers and/orreimbursements occurred.
Portfolio Management of the Master Funds
Capital Research uses a system of multiple fund counselors inmanaging mutual fund assets. Under this approach, the portfolioof a Master Fund is divided into segments, which are managedby individual managers. Portfolio managers decide how their
respective segments will be invested. In addition, CapitalResearch investment analysts may make investment decisionswith respect to a portion of a Master Fund’s portfolio.Investment decisions are subject to the limits provided by aMaster Fund’s goals and policies and the oversight of CapitalResearch’s investment committee. Capital Research managesequity assets through three investment divisions, Capital WorldInvestors, Capital Research International Investors and CapitalResearch Global Investors, and manages fixed-income assetsthrough its fixed income division, Capital Fixed IncomeInvestors. Capital World Investors, Capital ResearchInternational Investors, Capital Research Global Investors, andCapital Fixed Income Investors make investment decisions onan independent basis.
The equity investment divisions may, in the future, beincorporated as wholly owned subsidiaries of Capital Research.In that event, Capital Research would continue to be the MasterFunds’ investment adviser, and day-to-day investmentmanagement of equity assets would continue to be carried outthrough one or more of these subsidiaries. Although notcurrently contemplated, Capital Research could incorporate itsfixed income division in the future and engage it to provideday-to-day investment management of fixed income assets.Capital Research and each of the funds it advises have receivedan exemptive order from the SEC that allows Capital Researchto use, upon approval of the AFIS board of trustees, itsmanagement subsidiaries and affiliates to provide day-to-dayinvestment management services to the Master Funds, includingmaking changes to the management subsidiaries and affiliatesproviding such services. Each Master Fund’s shareholders pre-
MANAGEMENT
- 35 -
approved this arrangement, however, there is no assurance thatCapital Research will incorporate its investment divisions orexercise any authority granted to it under the exemptive order.
In addition, shareholders of AFIS approved a proposal toreorganize AFIS into a Delaware statutory trust. However, AFISreserves the right to delay implementing the reorganization.
The Master Fund portfolio managers primarily responsible forthe day-to-day management of the Master Funds’ portfolios arelisted below:
Master Growth Fund Team Members
Mark L. Casey is a Partner of Capital World Investors. Mr. Caseyhas been employed in the investment management area ofCapital Research or its affiliates for the past 17 years. Mr. Caseyhas been an equity portfolio manager for the Master GrowthFund for less than 1 year and has 11 years of prior experience asan investment analyst for the Master Growth Fund.
Michael T. Kerr is a Partner of Capital World Investors. Mr. Kerrhas been employed with Capital Research or its affiliates for32 years. Mr. Kerr has been an equity portfolio manager for theMaster Growth Fund for the past 12 years.
Ronald B. Morrow is a Partner of Capital World Investors.Mr. Morrow has been employed in the investment managementarea of Capital Research or its affiliates for the past 20 years.Mr. Morrow has been an equity portfolio manager for theMaster Growth Fund for the past 14 years.
Andraz Razen is a Partner of Capital World Investors. Mr. Razenhas been employed in the investment management area ofCapital Research or its affiliates for 13 years. Mr. Razen hasbeen an equity portfolio manager for the Master Growth Fundfor the past 4 years and has 3 years of prior experience as aninvestment analyst for the Master Growth Fund.
Martin Romo is a Partner of Capital World Investors. Mr. Romohas been employed as an investment professional with CapitalResearch and Management Company or its affiliates for the past24 years. Mr. Romo has served as an equity portfolio managerfor the Master Growth Fund for 1 year and has 15 years of priorexperience as an investment analyst for the Master GrowthFund.
Alan J. Wilson is a Partner of Capital World Investors.Mr. Wilson has been employed as an investment professional for32 years in total, 26 years with Capital Research or its affiliates.Mr. Wilson has been an equity portfolio manager for the MasterGrowth Fund for 3 years.
Master Global Growth Fund Team Members
Isabelle de Wismes is a Partner of Capital World Investors. Ms.de Wismes has been employed with Capital Research or itsaffiliates for the last 24 years. Ms. de Wismes has been an equity
portfolio manager for the Master Global Growth Fund for thepast 5 years and has 14 years of prior experience as aninvestment analyst for the Master Global Growth Fund.
Jonathan Knowles is a Partner of Capital World Investors.Mr. Knowles has been employed with Capital Research or itsaffiliates for 25 years. Mr. Knowles has been an equity portfoliomanager for the Master Global Growth Fund for the past 4 yearsand has 10 years of prior experience as an investment analyst forthe Master Global Growth Fund.
Paul Flynn is a Partner of Capital World Investors. Mr. Flynn hasbeen employed with Capital Research or its affiliates for21 years. Mr. Flynn has been an equity/fixed income portfoliomanager for the Master Global Growth Fund for less than 1 yearand has 4 years of prior experience as a portfolio manager forthe Master Global Growth Fund.
Patrice Collete is a Partner of Capital World Investors.Ms. Collete has been employed with Capital Research or itsaffiliates for less than 17 years. Ms. Collete has been an equityportfolio manager for the Master Global Growth Fund for thepast 2 years and has 14 years of prior experience as aninvestment analyst for the Master Global Growth Fund.
Master Growth-Income Fund Team Members
J. Blair Frank is a Partner of Capital Research Global Investors.Mr. Frank has been employed in the investment managementarea of Capital Research or its affiliates for the past 23 years.Mr. Frank has been an equity portfolio manager for the MasterGrowth-Income Fund for the past 11 years.
Claudia P. Huntington is a Partner of Capital Research GlobalInvestors. Ms. Huntington has been employed with CapitalResearch or its affiliates for the past 44 years. Ms. Huntingtonhas been an equity portfolio manager for the Master Growth-Income Fund for 23 years.
Donald D. O’Neal is a Partner of Capital Research GlobalInvestors. Mr. O’Neal has been employed with Capital Researchor its affiliates for the past 32 years. Mr. O’Neal has been anequity portfolio manager for the Master Growth-Income Fundfor 12 years.
William L. Robbins is a Partner of Capital InternationalInvestors. Mr. Robbins has been employed with CapitalResearch or its affiliates for 22 years. Mr. Robbins has been anequity portfolio manager for the Master Growth-Income Fundfor 5 years and has 12 years of prior experience as an investmentanalyst for the Master Growth-Income Fund.
Dylan J. Yolles is a Partner of Capital International Investors.Mr. Yolles has been employed with Capital Research or itsaffiliates for 17 years. Mr. Yolles has been an equity portfoliomanager for the Master Growth-Income Fund for the past12 years.
MANAGEMENT
- 36 -
Master Asset Allocation Fund Team Members
Alan N. Berro is a Partner of Capital World Investors. Mr. Berrohas been employed with Capital Research or its affiliates for26 years. Mr. Berro has been an equity portfolio manager for theMaster Asset Allocation Fund for the past 17 years.
J. David Carpenter is a Partner of Capital World Investors.Mr. Carpenter has been employed with Capital Research or itsaffiliates for 19 years. Mr. Carpenter has been and equityportfolio manager for the Master Asset Allocation Fund for thepast 4 years.
David A. Daigle is a Partner of Capital Fixed Income Investors,Capital Research. Mr. Daigle has been employed with CapitalResearch or its affiliates for 23 years. Mr. Daigle has been afixed-income portfolio manager for the Master Asset AllocationFund for 8 years.
Jeffrey T. Lager is a Partner of Capital World Investors.Mr. Lager has been employed in the investment managementarea of Capital Research or its affiliates for the past 21 years.Mr. Lager has been an equity portfolio manager for the MasterAsset Allocation Fund for the past 10 years.
James R. Mulally is a Partner of Capital Fixed Income Investors,Capital Research. Mr. Mulally has been employed with CapitalResearch or its affiliates for 37 years. Mr. Mulally has been afixed income equity portfolio manager for the Master AssetAllocation Fund for 11 years.
John R. Queen is a Partner of Capital Fixed Income Investors,Capital Research. Mr. Queen has been employeed with CapitalResearch or the affiliates for 14 years. Mr. Queen has been afixed income portfolio manager for the Master Asset AllocationFund for 1 year.
Master Managed Risk Fund Team Members
Capital Research
Alan N. Berro is a Partner of Capital World Investors. Mr. Berrohas been employed with Capital Research or its affiliates for26 years. Mr. Berro has been an equity portfolio manager for theMaster Managed Risk Fund for the past 5 years.
James R. Mulally is a Partner of Capital Fixed Income Investors,Capital Research. Mr. Mulally has been employed with CapitalResearch or its affiliates for 37 years. Mr. Mulally has been afixed income equity portfolio manager for the Master ManagedRisk Fund for 5 years.
Milliman Financial Risk Management, LLC (“Milliman”)
Adam Schenck is a managing director of Milliman. Mr. Schenckhas been employed with Milliman or its affiliates for 12 years.Mr. Schenck has been a portfolio manager of Milliman withrespect to the protection strategy for the Master Managed RiskFund for 5 years.
With respect to the individuals listed, the Master Funds’ SAIprovides additional information about compensation, otheraccounts managed and ownership of securities in the MasterFunds.
MANAGEMENT
- 37 -

FINANCIAL HIGHLIGHTS
The following Financial Highlights tables for the Portfolio are intended to help you understand the Portfolio’sfinancial performance since inception. Certain information reflects financial results for a single Portfolio share.The total returns in each table represent the rate that an investor would have earned on an investment in thePortfolio (assuming reinvestment of all dividends and distributions). Separate Account charges are not reflectedin the total returns. If these amounts were reflected, returns would be less than those shown. This information hasbeen audited by PricewaterhouseCoopers LLP, whose report, along with the Portfolio’s financial statements, isincluded in the Trust’s Annual Report to shareholders, which is available upon request.
Periodended
Net AssetValue,
beginningof
period
Netinvestment
income(loss)*
Net gain(loss) on
investments(both
realizedand
unrealized)
Total frominvestmentoperations
Dividendsfrom net
investmentincome
Dividendfrom netrealizedgain on
investmentsTotal
Distributions
NetAssetValue,end ofperiod
TotalReturn**
NetAssets,
end of period(000’s)
Ratio ofexpenses to
averagenet
assets(1)(2)
Ratio ofnet
investmentincome(loss) to
average netassets(1)(2)(3)
Portfolioturnover
VCPSM Managed Asset Allocation SAST Portfolio Class 109/26/16#-12/31/16 $12.66 $ 0.05 $ 0.16 $ 0.21 $ — $ — $ — $12.87 1.66% $ 102 0.28%† 1.40%† 2%
VCPSM Managed Asset Allocation SAST Portfolio Class 310/15/12#-12/31/12 10.00 0.17 (0.08) 0.09 — — — 10.09 0.90 5,068 0.53† 11.57† 312/31/13 10.09 0.21 1.82 2.03 (0.01) — (0.01) 12.11 20.11 111,529 0.53 1.98 012/31/14 12.11 (0.03) 0.36 0.33 (0.05) (0.00) (0.05) 12.39 2.72 275,987 0.53 (0.22) 012/31/15 12.39 0.19 (0.36) (0.17) — — — 12.22 (1.37) 710,452 0.53 1.59 212/31/16 12.22 0.14 0.72 0.86 (0.09) (0.12) (0.21) 12.87 7.07 1,215,590 0.53 1.16 2
American Funds Growth SAST Portfolio Class 109/26/16#-12/31/16 11.24 0.08 0.23 0.31 — — — 11.55 2.76 103 0.30† 2.63† 4
American Funds Growth SAST Portfolio Class 312/31/12 9.28 0.05 1.57 1.62 (0.03) — (0.03) 10.87 17.51 283,650 0.54 0.52 712/31/13 10.87 0.08 3.15 3.23 (0.06) — (0.06) 14.04 29.76 318,922 0.54 0.63 312/31/14 14.04 0.13 1.02 1.15 (0.09) (0.08) (0.17) 15.02 8.19 314,384 0.54 0.90 1012/31/15 15.02 0.05 0.86 0.91 (0.14) (1.36) (1.50) 14.43 6.52 310,350 0.54 0.32 1312/31/16 14.43 0.06 1.06 1.12 (0.05) (3.96) (4.01) 11.54 9.17 321,687 0.53 0.49 4
* Calculated based on average shares outstanding.** Total return is not annualized and does not reflect expenses that apply to the separate accounts of the Life Companies. If such expenses had been
included, the total return would have been lower for each period presented. Total return does include expense reimbursements (recoupment).† Annualized# Commencement of operations.
(1) During the below stated periods, the investment adviser either waived fees or reimbursed expenses for the Portfolios or through recoup-ment provisions, recovered a portion of or all fees and expenses waived or reimbursed in the previous two fiscal years. If all fees andexpenses had been incurred by the Portfolios, the ratio of expenses to average net assets and the ratio of net investment income (loss) toaverage net assets would have been as follows:
Expenses Net Investment Income ( Loss)
12/12 12/13 12/14 12/15 12/16 12/12 12/13 12/14 12/15 12/16
VCPSM Managed Asset Allocation SAST PortfolioClass 1 . . . . . . . . . . . . . . . . . . . . . . . . . . . . . . . . . . . . . . —% —% —% —% 0.98%† —% —% —% —% 0.70%†
VCPSM Managed Asset Allocation SAST PortfolioClass 3 . . . . . . . . . . . . . . . . . . . . . . . . . . . . . . . . . . . . . . 11.41† 1.45 1.25 1.23 1.23 0.69† 1.06 (0.94) 0.88 0.46
American Funds Growth SAST Portfolio Class 1 . . . . . . . . — — — — 0.90† — — — — 2.03†American Funds Growth SAST Portfolio Class 3 . . . . . . . . 1.14 1.14 1.14 1.14 1.13 (0.08) 0.03 0.30 (0.28) (0.11)
(2) Does not include underlying fund expenses that the Portfolios bear indirectly.(3) Recognition of net investment income by the Portfolios is affected by the timing of the declaration of dividends by the underlying
investment companies in which the Portfolios invest.
- 38 -
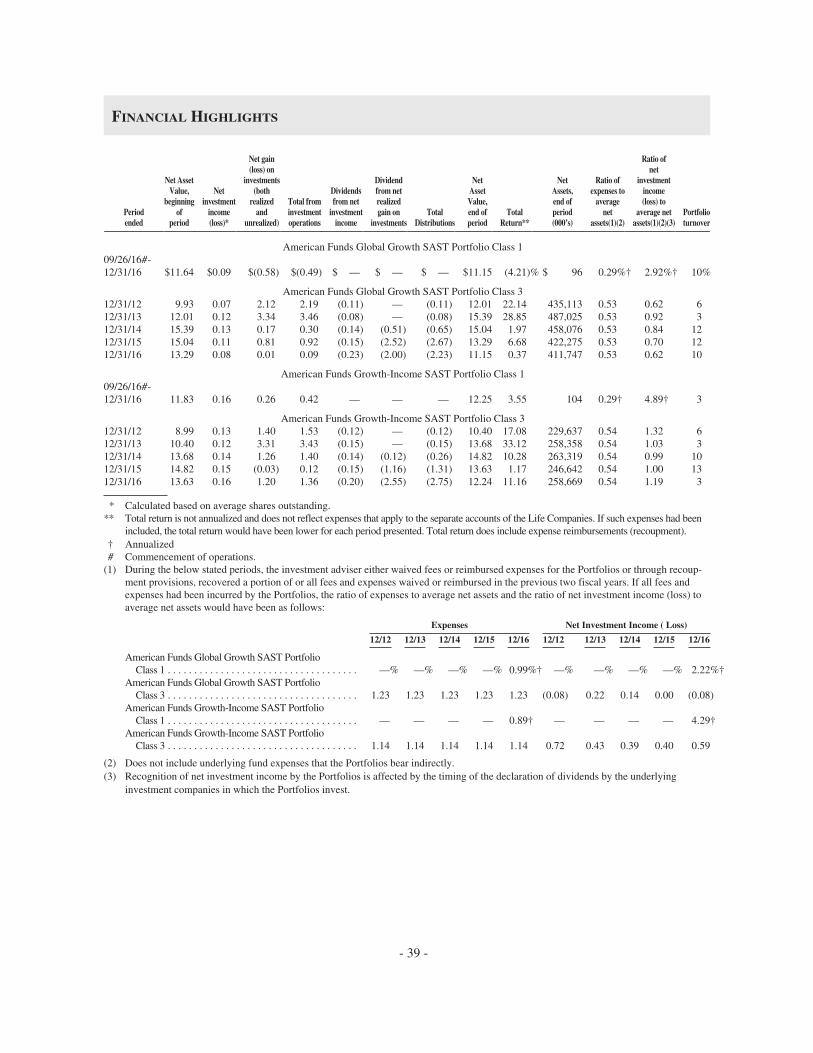
FINANCIAL HIGHLIGHTS
Periodended
Net AssetValue,
beginningof
period
Netinvestment
income(loss)*
Net gain(loss) on
investments(both
realizedand
unrealized)
Total frominvestmentoperations
Dividendsfrom net
investmentincome
Dividendfrom netrealizedgain on
investmentsTotal
Distributions
NetAssetValue,end ofperiod
TotalReturn**
NetAssets,end ofperiod(000’s)
Ratio ofexpenses to
averagenet
assets(1)(2)
Ratio ofnet
investmentincome(loss) to
average netassets(1)(2)(3)
Portfolioturnover
American Funds Global Growth SAST Portfolio Class 109/26/16#-12/31/16 $11.64 $0.09 $(0.58) $(0.49) $ — $ — $ — $11.15 (4.21)% $ 96 0.29%† 2.92%† 10%
American Funds Global Growth SAST Portfolio Class 312/31/12 9.93 0.07 2.12 2.19 (0.11) — (0.11) 12.01 22.14 435,113 0.53 0.62 612/31/13 12.01 0.12 3.34 3.46 (0.08) — (0.08) 15.39 28.85 487,025 0.53 0.92 312/31/14 15.39 0.13 0.17 0.30 (0.14) (0.51) (0.65) 15.04 1.97 458,076 0.53 0.84 1212/31/15 15.04 0.11 0.81 0.92 (0.15) (2.52) (2.67) 13.29 6.68 422,275 0.53 0.70 1212/31/16 13.29 0.08 0.01 0.09 (0.23) (2.00) (2.23) 11.15 0.37 411,747 0.53 0.62 10
American Funds Growth-Income SAST Portfolio Class 109/26/16#-12/31/16 11.83 0.16 0.26 0.42 — — — 12.25 3.55 104 0.29† 4.89† 3
American Funds Growth-Income SAST Portfolio Class 312/31/12 8.99 0.13 1.40 1.53 (0.12) — (0.12) 10.40 17.08 229,637 0.54 1.32 612/31/13 10.40 0.12 3.31 3.43 (0.15) — (0.15) 13.68 33.12 258,358 0.54 1.03 312/31/14 13.68 0.14 1.26 1.40 (0.14) (0.12) (0.26) 14.82 10.28 263,319 0.54 0.99 1012/31/15 14.82 0.15 (0.03) 0.12 (0.15) (1.16) (1.31) 13.63 1.17 246,642 0.54 1.00 1312/31/16 13.63 0.16 1.20 1.36 (0.20) (2.55) (2.75) 12.24 11.16 258,669 0.54 1.19 3
* Calculated based on average shares outstanding.** Total return is not annualized and does not reflect expenses that apply to the separate accounts of the Life Companies. If such expenses had been
included, the total return would have been lower for each period presented. Total return does include expense reimbursements (recoupment).† Annualized# Commencement of operations.
(1) During the below stated periods, the investment adviser either waived fees or reimbursed expenses for the Portfolios or through recoup-ment provisions, recovered a portion of or all fees and expenses waived or reimbursed in the previous two fiscal years. If all fees andexpenses had been incurred by the Portfolios, the ratio of expenses to average net assets and the ratio of net investment income (loss) toaverage net assets would have been as follows:
Expenses Net Investment Income ( Loss)
12/12 12/13 12/14 12/15 12/16 12/12 12/13 12/14 12/15 12/16
American Funds Global Growth SAST PortfolioClass 1 . . . . . . . . . . . . . . . . . . . . . . . . . . . . . . . . . . . . —% —% —% —% 0.99%† —% —% —% —% 2.22%†
American Funds Global Growth SAST PortfolioClass 3 . . . . . . . . . . . . . . . . . . . . . . . . . . . . . . . . . . . . 1.23 1.23 1.23 1.23 1.23 (0.08) 0.22 0.14 0.00 (0.08)
American Funds Growth-Income SAST PortfolioClass 1 . . . . . . . . . . . . . . . . . . . . . . . . . . . . . . . . . . . . — — — — 0.89† — — — — 4.29†
American Funds Growth-Income SAST PortfolioClass 3 . . . . . . . . . . . . . . . . . . . . . . . . . . . . . . . . . . . . 1.14 1.14 1.14 1.14 1.14 0.72 0.43 0.39 0.40 0.59
(2) Does not include underlying fund expenses that the Portfolios bear indirectly.(3) Recognition of net investment income by the Portfolios is affected by the timing of the declaration of dividends by the underlying
investment companies in which the Portfolios invest.
- 39 -
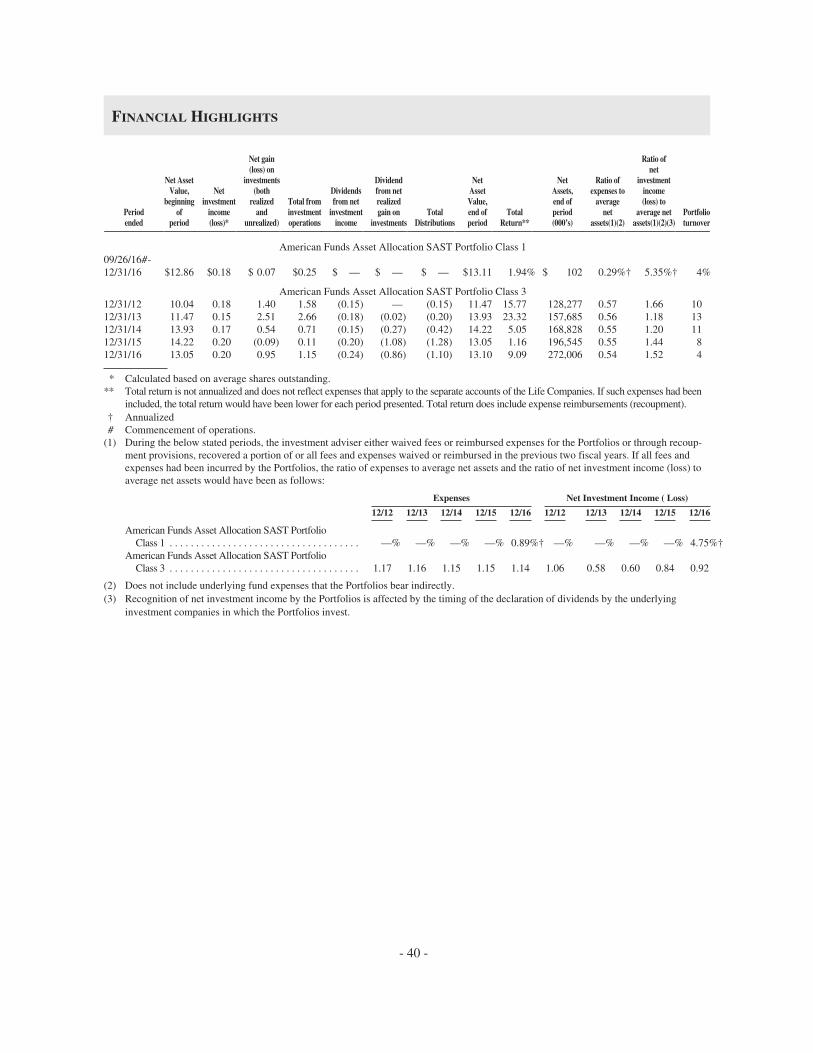
FINANCIAL HIGHLIGHTS
Periodended
Net AssetValue,
beginningof
period
Netinvestment
income(loss)*
Net gain(loss) on
investments(both
realizedand
unrealized)
Total frominvestmentoperations
Dividendsfrom net
investmentincome
Dividendfrom netrealizedgain on
investmentsTotal
Distributions
NetAssetValue,end ofperiod
TotalReturn**
NetAssets,end ofperiod(000’s)
Ratio ofexpenses to
averagenet
assets(1)(2)
Ratio ofnet
investmentincome(loss) to
average netassets(1)(2)(3)
Portfolioturnover
American Funds Asset Allocation SAST Portfolio Class 109/26/16#-12/31/16 $12.86 $0.18 $ 0.07 $0.25 $ — $ — $ — $13.11 1.94% $ 102 0.29%† 5.35%† 4%
American Funds Asset Allocation SAST Portfolio Class 312/31/12 10.04 0.18 1.40 1.58 (0.15) — (0.15) 11.47 15.77 128,277 0.57 1.66 1012/31/13 11.47 0.15 2.51 2.66 (0.18) (0.02) (0.20) 13.93 23.32 157,685 0.56 1.18 1312/31/14 13.93 0.17 0.54 0.71 (0.15) (0.27) (0.42) 14.22 5.05 168,828 0.55 1.20 1112/31/15 14.22 0.20 (0.09) 0.11 (0.20) (1.08) (1.28) 13.05 1.16 196,545 0.55 1.44 812/31/16 13.05 0.20 0.95 1.15 (0.24) (0.86) (1.10) 13.10 9.09 272,006 0.54 1.52 4
* Calculated based on average shares outstanding.** Total return is not annualized and does not reflect expenses that apply to the separate accounts of the Life Companies. If such expenses had been
included, the total return would have been lower for each period presented. Total return does include expense reimbursements (recoupment).† Annualized# Commencement of operations.
(1) During the below stated periods, the investment adviser either waived fees or reimbursed expenses for the Portfolios or through recoup-ment provisions, recovered a portion of or all fees and expenses waived or reimbursed in the previous two fiscal years. If all fees andexpenses had been incurred by the Portfolios, the ratio of expenses to average net assets and the ratio of net investment income (loss) toaverage net assets would have been as follows:
Expenses Net Investment Income ( Loss)
12/12 12/13 12/14 12/15 12/16 12/12 12/13 12/14 12/15 12/16
American Funds Asset Allocation SAST PortfolioClass 1 . . . . . . . . . . . . . . . . . . . . . . . . . . . . . . . . . . . . —% —% —% —% 0.89%† —% —% —% —% 4.75%†
American Funds Asset Allocation SAST PortfolioClass 3 . . . . . . . . . . . . . . . . . . . . . . . . . . . . . . . . . . . . 1.17 1.16 1.15 1.15 1.14 1.06 0.58 0.60 0.84 0.92
(2) Does not include underlying fund expenses that the Portfolios bear indirectly.(3) Recognition of net investment income by the Portfolios is affected by the timing of the declaration of dividends by the underlying
investment companies in which the Portfolios invest.
- 40 -

The following documents contain more information about the Portfolios’ investments and are available free of charge upon request:
• Annual and Semi-annual Reports contain financial statements, performance data and information on portfolio holdings.The annual report also contains a written analysis of market conditions and investment strategies that significantly affecteda Portfolio’s performance for the most recently completed fiscal year.
• Statement of Additional Information (SAI) contains additional information about the Portfolios’ policies, investmentrestrictions and business structure. This Prospectus incorporates the SAI by reference.
The Trust’s Prospectus(es), SAIs and semi-annual and annual reports are available at www.aig.com/getprospectus or online throughthe internet websites of the life insurance companies offering the Portfolios as investment options. You may obtain copies of thesedocuments or ask questions about the Portfolios at no charge by calling (800) 445-7862 or by writing the Trust at P.O. Box 15570,Amarillo, Texas 79105-5570.
Information about the Portfolios (including the SAI) can be reviewed and copied at the Public Reference Room of the Securities andExchange Commission, Washington, D.C. Call 1-202-551-8090 for information on the operation of the Public Reference Room.Reports and other information about the Portfolios are also available on the EDGAR Database on the Securities and ExchangeCommission’s website at http:// www.sec.gov and copies of this information may be obtained upon payment of a duplicating fee byelectronic request at the following e-mail address: [email protected], or by writing the Public Reference Section of the Securitiesand Exchange Commission, Washington, D.C. 20549-0102.
You should rely only on the information contained in this Prospectus. No one is authorized to provide you with any differentinformation.
The Trust’s Investment Company ActFile No: 811-7238
FOR MORE INFORMATION
- 41 -
Global Growth Fund Growth Fund Growth-Income Fund
Asset Allocation Fund
Table of contents
Global Growth Fund 1Growth Fund 4Growth-Income Fund 7Asset Allocation Fund 10
Investment objectives, strategies and risks 14Management and organization 21Purchases and redemptions of shares 25Plan of distribution 27Fund expenses 27Investment results 27Distributions and taxes 27Financial highlights 28
American Funds Insurance Series®
Prospectus Class 1 shares
May 1, 2017
The U.S. Securities and Exchange Commission has not approved or disapproved of these securities. Further, it has not determinedthat this prospectus is accurate or complete. Any representation to the contrary is a criminal offense.
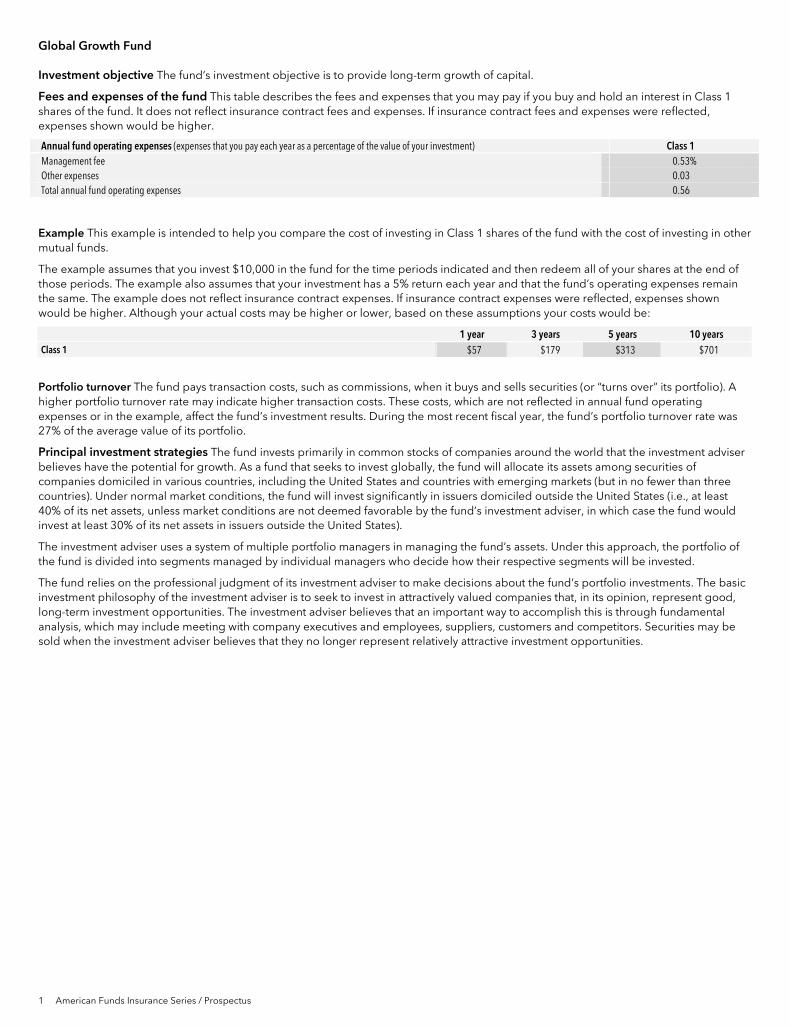
1 American Funds Insurance Series / Prospectus
Global Growth Fund Investment objective The fund’s investment objective is to provide long-term growth of capital.
Fees and expenses of the fund This table describes the fees and expenses that you may pay if you buy and hold an interest in Class 1 shares of the fund. It does not reflect insurance contract fees and expenses. If insurance contract fees and expenses were reflected, expenses shown would be higher.
Annual fund operating expenses (expenses that you pay each year as a percentage of the value of your investment) Class 1 Management fee 0.53% Other expenses 0.03 Total annual fund operating expenses 0.56
Example This example is intended to help you compare the cost of investing in Class 1 shares of the fund with the cost of investing in other mutual funds.
The example assumes that you invest $10,000 in the fund for the time periods indicated and then redeem all of your shares at the end of those periods. The example also assumes that your investment has a 5% return each year and that the fund’s operating expenses remain the same. The example does not reflect insurance contract expenses. If insurance contract expenses were reflected, expenses shown would be higher. Although your actual costs may be higher or lower, based on these assumptions your costs would be:
1 year 3 years 5 years 10 years Class 1 $57 $179 $313 $701
Portfolio turnover The fund pays transaction costs, such as commissions, when it buys and sells securities (or “turns over” its portfolio). A higher portfolio turnover rate may indicate higher transaction costs. These costs, which are not reflected in annual fund operating expenses or in the example, affect the fund’s investment results. During the most recent fiscal year, the fund’s portfolio turnover rate was 27% of the average value of its portfolio.
Principal investment strategies The fund invests primarily in common stocks of companies around the world that the investment adviser believes have the potential for growth. As a fund that seeks to invest globally, the fund will allocate its assets among securities of companies domiciled in various countries, including the United States and countries with emerging markets (but in no fewer than three countries). Under normal market conditions, the fund will invest significantly in issuers domiciled outside the United States (i.e., at least 40% of its net assets, unless market conditions are not deemed favorable by the fund’s investment adviser, in which case the fund would invest at least 30% of its net assets in issuers outside the United States).
The investment adviser uses a system of multiple portfolio managers in managing the fund’s assets. Under this approach, the portfolio of the fund is divided into segments managed by individual managers who decide how their respective segments will be invested.
The fund relies on the professional judgment of its investment adviser to make decisions about the fund’s portfolio investments. The basic investment philosophy of the investment adviser is to seek to invest in attractively valued companies that, in its opinion, represent good, long-term investment opportunities. The investment adviser believes that an important way to accomplish this is through fundamental analysis, which may include meeting with company executives and employees, suppliers, customers and competitors. Securities may be sold when the investment adviser believes that they no longer represent relatively attractive investment opportunities.

American Funds Insurance Series / Prospectus 2
Principal risks
This section describes the principal risks associated with the fund’s principal investment strategies. You may lose money by investing in the fund. The likelihood of loss may be greater if you invest for a shorter period of time. Investors in the fund should have a long-term perspective and be able to tolerate potentially sharp declines in value.
Market conditions — The prices of, and the income generated by, the common stocks and other securities held by the fund may decline – sometimes rapidly or unpredictably – due to various factors, including events or conditions affecting the general economy or particular industries; overall market changes; local, regional or global political, social or economic instability; governmental or governmental agency responses to economic conditions; and currency exchange rate, interest rate and commodity price fluctuations.
Issuer risks — The prices of, and the income generated by, securities held by the fund may decline in response to various factors directly related to the issuers of such securities, including reduced demand for an issuer’s goods or services, poor management performance and strategic initiatives such as mergers, acquisitions or dispositions and the market response to any such initiatives.
Investing in growth-oriented stocks — Growth-oriented common stocks and other equity-type securities (such as preferred stocks, convertible preferred stocks and convertible bonds) may involve larger price swings and greater potential for loss than other types of investments.
Investing outside the United States — Securities of issuers domiciled outside the United States, or with significant operations or revenues outside the United States, may lose value because of adverse political, social, economic or market developments (including social instability, regional conflicts, terrorism and war) in the countries or regions in which the issuers operate or generate revenue. These securities may also lose value due to changes in foreign currency exchange rates against the U.S. dollar and/or currencies of other countries. Issuers of these securities may be more susceptible to actions of foreign governments, such as the imposition of price controls or punitive taxes, that could adversely impact the value of these securities. Securities markets in certain countries may be more volatile and/or less liquid than those in the United States. Investments outside the United States may also be subject to different accounting practices and different regulatory, legal and reporting standards and practices, and may be more difficult to value, than those in the United States. In addition, the value of investments outside the United States may be reduced by foreign taxes, including foreign withholding taxes on interest and dividends. Further, there may be increased risks of delayed settlement of securities purchased or sold by the fund. The risks of investing outside the United States may be heightened in connection with investments in emerging markets.
Investing in emerging markets — Investing in emerging markets may involve risks in addition to and greater than those generally associated with investing in the securities markets of developed countries. For instance, developing countries may have less developed legal and accounting systems than those in developed countries. The governments of these countries may be less stable and more likely to impose capital controls, nationalize a company or industry, place restrictions on foreign ownership and on withdrawing sale proceeds of securities from the country, and/or impose punitive taxes that could adversely affect the prices of securities. In addition, the economies of these countries may be dependent on relatively few industries that are more susceptible to local and global changes. Securities markets in these countries can also be relatively small and have substantially lower trading volumes. As a result, securities issued in these countries may be more volatile and less liquid, and may be more difficult to value, than securities issued in countries with more developed economies and/or markets. Less certainty with respect to security valuations may lead to additional challenges and risks in calculating the fund’s net asset value. Additionally, there may be increased settlement risks for transactions in local securities.
Management — The investment adviser to the fund actively manages the fund’s investments. Consequently, the fund is subject to the risk that the methods and analyses employed by the investment adviser in this process may not produce the desired results. This could cause the fund to lose value or its investment results to lag relevant benchmarks or other funds with similar objectives.
Your investment in the fund is not a bank deposit and is not insured or guaranteed by the Federal Deposit Insurance Corporation or any other governmental agency, entity or person. You should consider how this fund fits into your overall investment program.

3 American Funds Insurance Series / Prospectus
Investment results The following bar chart shows how the investment results of the Class 1 shares of the fund have varied from year to year, and the following table shows how the fund’s average annual total returns for various periods compare with a broad measure of securities market results and other applicable measures of market results. This information provides some indication of the risks of investing in the fund. The Lipper Global Funds Index includes mutual funds that disclose investment objectives and/or strategies reasonably comparable to those of the fund. Past investment results (before and after taxes) are not predictive of future investment results. Figures shown reflect fees and expenses associated with an investment in the fund, but do not reflect insurance contract fees and expenses. If insurance contract fees and expenses were included, results would have been lower. Updated information on the fund’s investment results can be obtained by visiting americanfunds.com/afis.
Calendar year total returns
Highest/Lowest quarterly results during this period were:
Highest 22.27% (quarter ended June 30, 2009)
Lowest –20.04% (quarter ended December 31, 2008)
(%)
–100
1020304050
–50
–30–20
–40
’12 ’14 ’15 ’16’07 ’08 ’09
42.58
’10
12.04
’11
–8.66
22.89
’13
15.167.24
–38.23
–60
29.51
2.52 0.87
Average annual total returns For the periods ended December 31, 2016: 1 year 5 years 10 years Lifetime
Fund (inception date — 4/30/97) 0.87% 12.03% 6.24% 9.12% MSCI All Country World Index (reflects no deduction for sales charges, account fees, expenses or U.S. federal income taxes)
7.86 9.36 3.56 5.59
Lipper Global Funds Index (reflects no deduction for sales charges, account fees or U.S. federal income taxes)
7.64 10.00 3.73 5.90
Management Investment adviser Capital Research and Management CompanySM Portfolio managers The individuals primarily responsible for the portfolio management of the fund are:
Portfolio manager/ Series title (if applicable)
Portfolio manager experience in this fund
Primary title with investment adviser
Patrice Collette 2 years Partner – Capital World Investors Isabelle de Wismes 5 years Partner – Capital World Investors Paul Flynn Less than 1 year Partner – Capital World Investors Jonathan Knowles 4 years Partner – Capital World Investors
Tax information See your variable insurance contract prospectus for information regarding the federal income tax treatment of your variable insurance contract and related distributions.
Payments to broker-dealers and other financial intermediaries If you purchase shares of the fund through a broker-dealer or other financial intermediary (such as an insurance company), the fund and the fund’s distributor or its affiliates may pay the intermediary for the sale of fund shares and related services. These payments may create a conflict of interest by influencing the broker-dealer or other intermediary and your individual financial advisor to recommend the fund over another investment. Ask your individual financial advisor or visit your financial intermediary’s website for more information. The fund is not sold directly to the general public but instead is offered as an underlying investment option for variable insurance contracts. In addition to payments described above, the fund and its related companies may make payments to the sponsoring insurance company (or its affiliates) for distribution and/or other services. These payments may be a factor that the insurance company considers in including the fund as an underlying investment option in the variable insurance contract. The prospectus (or other offering document) for your variable insurance contract may contain additional information about these payments.
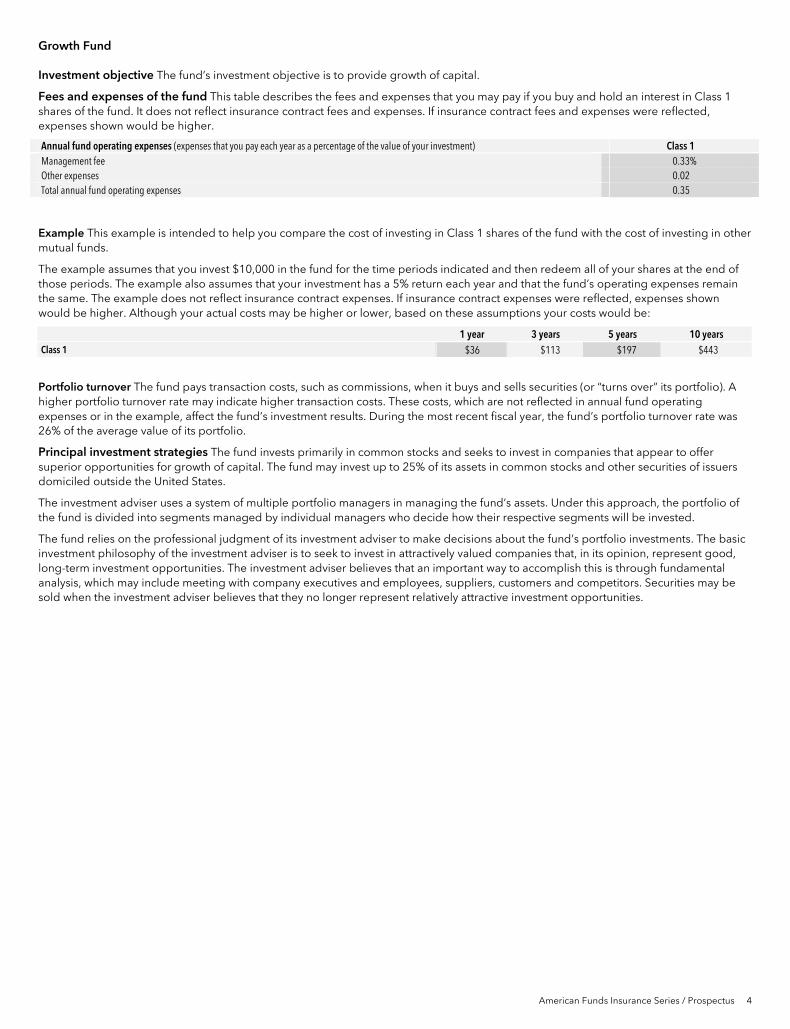
American Funds Insurance Series / Prospectus 4
Growth Fund Investment objective The fund’s investment objective is to provide growth of capital.
Fees and expenses of the fund This table describes the fees and expenses that you may pay if you buy and hold an interest in Class 1 shares of the fund. It does not reflect insurance contract fees and expenses. If insurance contract fees and expenses were reflected, expenses shown would be higher.
Annual fund operating expenses (expenses that you pay each year as a percentage of the value of your investment) Class 1 Management fee 0.33% Other expenses 0.02 Total annual fund operating expenses 0.35
Example This example is intended to help you compare the cost of investing in Class 1 shares of the fund with the cost of investing in other mutual funds.
The example assumes that you invest $10,000 in the fund for the time periods indicated and then redeem all of your shares at the end of those periods. The example also assumes that your investment has a 5% return each year and that the fund’s operating expenses remain the same. The example does not reflect insurance contract expenses. If insurance contract expenses were reflected, expenses shown would be higher. Although your actual costs may be higher or lower, based on these assumptions your costs would be:
1 year 3 years 5 years 10 years Class 1 $36 $113 $197 $443
Portfolio turnover The fund pays transaction costs, such as commissions, when it buys and sells securities (or “turns over” its portfolio). A higher portfolio turnover rate may indicate higher transaction costs. These costs, which are not reflected in annual fund operating expenses or in the example, affect the fund’s investment results. During the most recent fiscal year, the fund’s portfolio turnover rate was 26% of the average value of its portfolio.
Principal investment strategies The fund invests primarily in common stocks and seeks to invest in companies that appear to offer superior opportunities for growth of capital. The fund may invest up to 25% of its assets in common stocks and other securities of issuers domiciled outside the United States.
The investment adviser uses a system of multiple portfolio managers in managing the fund’s assets. Under this approach, the portfolio of the fund is divided into segments managed by individual managers who decide how their respective segments will be invested.
The fund relies on the professional judgment of its investment adviser to make decisions about the fund’s portfolio investments. The basic investment philosophy of the investment adviser is to seek to invest in attractively valued companies that, in its opinion, represent good, long-term investment opportunities. The investment adviser believes that an important way to accomplish this is through fundamental analysis, which may include meeting with company executives and employees, suppliers, customers and competitors. Securities may be sold when the investment adviser believes that they no longer represent relatively attractive investment opportunities.
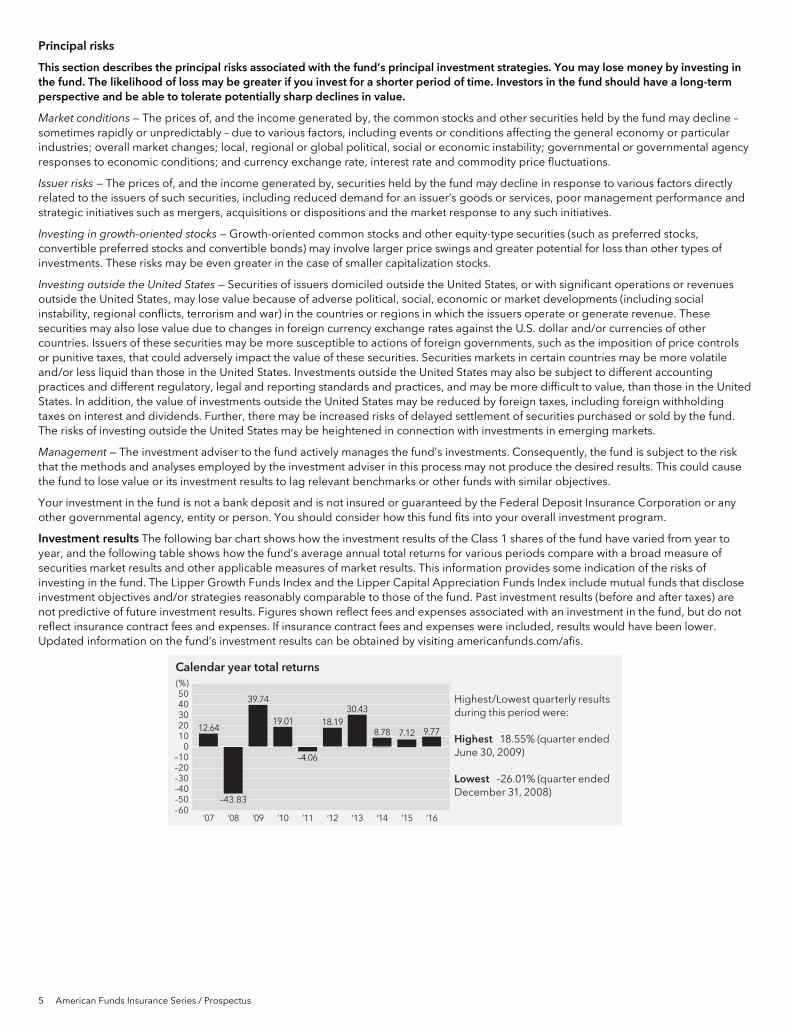
5 American Funds Insurance Series / Prospectus
Principal risks
This section describes the principal risks associated with the fund’s principal investment strategies. You may lose money by investing in the fund. The likelihood of loss may be greater if you invest for a shorter period of time. Investors in the fund should have a long-term perspective and be able to tolerate potentially sharp declines in value.
Market conditions — The prices of, and the income generated by, the common stocks and other securities held by the fund may decline – sometimes rapidly or unpredictably – due to various factors, including events or conditions affecting the general economy or particular industries; overall market changes; local, regional or global political, social or economic instability; governmental or governmental agency responses to economic conditions; and currency exchange rate, interest rate and commodity price fluctuations.
Issuer risks — The prices of, and the income generated by, securities held by the fund may decline in response to various factors directly related to the issuers of such securities, including reduced demand for an issuer’s goods or services, poor management performance and strategic initiatives such as mergers, acquisitions or dispositions and the market response to any such initiatives.
Investing in growth-oriented stocks — Growth-oriented common stocks and other equity-type securities (such as preferred stocks, convertible preferred stocks and convertible bonds) may involve larger price swings and greater potential for loss than other types of investments. These risks may be even greater in the case of smaller capitalization stocks.
Investing outside the United States — Securities of issuers domiciled outside the United States, or with significant operations or revenues outside the United States, may lose value because of adverse political, social, economic or market developments (including social instability, regional conflicts, terrorism and war) in the countries or regions in which the issuers operate or generate revenue. These securities may also lose value due to changes in foreign currency exchange rates against the U.S. dollar and/or currencies of other countries. Issuers of these securities may be more susceptible to actions of foreign governments, such as the imposition of price controls or punitive taxes, that could adversely impact the value of these securities. Securities markets in certain countries may be more volatile and/or less liquid than those in the United States. Investments outside the United States may also be subject to different accounting practices and different regulatory, legal and reporting standards and practices, and may be more difficult to value, than those in the United States. In addition, the value of investments outside the United States may be reduced by foreign taxes, including foreign withholding taxes on interest and dividends. Further, there may be increased risks of delayed settlement of securities purchased or sold by the fund. The risks of investing outside the United States may be heightened in connection with investments in emerging markets.
Management — The investment adviser to the fund actively manages the fund’s investments. Consequently, the fund is subject to the risk that the methods and analyses employed by the investment adviser in this process may not produce the desired results. This could cause the fund to lose value or its investment results to lag relevant benchmarks or other funds with similar objectives.
Your investment in the fund is not a bank deposit and is not insured or guaranteed by the Federal Deposit Insurance Corporation or any other governmental agency, entity or person. You should consider how this fund fits into your overall investment program.
Investment results The following bar chart shows how the investment results of the Class 1 shares of the fund have varied from year to year, and the following table shows how the fund’s average annual total returns for various periods compare with a broad measure of securities market results and other applicable measures of market results. This information provides some indication of the risks of investing in the fund. The Lipper Growth Funds Index and the Lipper Capital Appreciation Funds Index include mutual funds that disclose investment objectives and/or strategies reasonably comparable to those of the fund. Past investment results (before and after taxes) are not predictive of future investment results. Figures shown reflect fees and expenses associated with an investment in the fund, but do not reflect insurance contract fees and expenses. If insurance contract fees and expenses were included, results would have been lower. Updated information on the fund’s investment results can be obtained by visiting americanfunds.com/afis.
Calendar year total returns
Highest/Lowest quarterly results during this period were:
Highest 18.55% (quarter ended June 30, 2009)
Lowest –26.01% (quarter ended December 31, 2008)
(%)
–100
1020304050
–50
–30–20
–40
’12 ’14 ’16’07 ’08 ’09
39.74
’10
19.01
’11
–4.06
18.19
’13
12.64
–43.83–60
30.43
9.778.78
’15
7.12
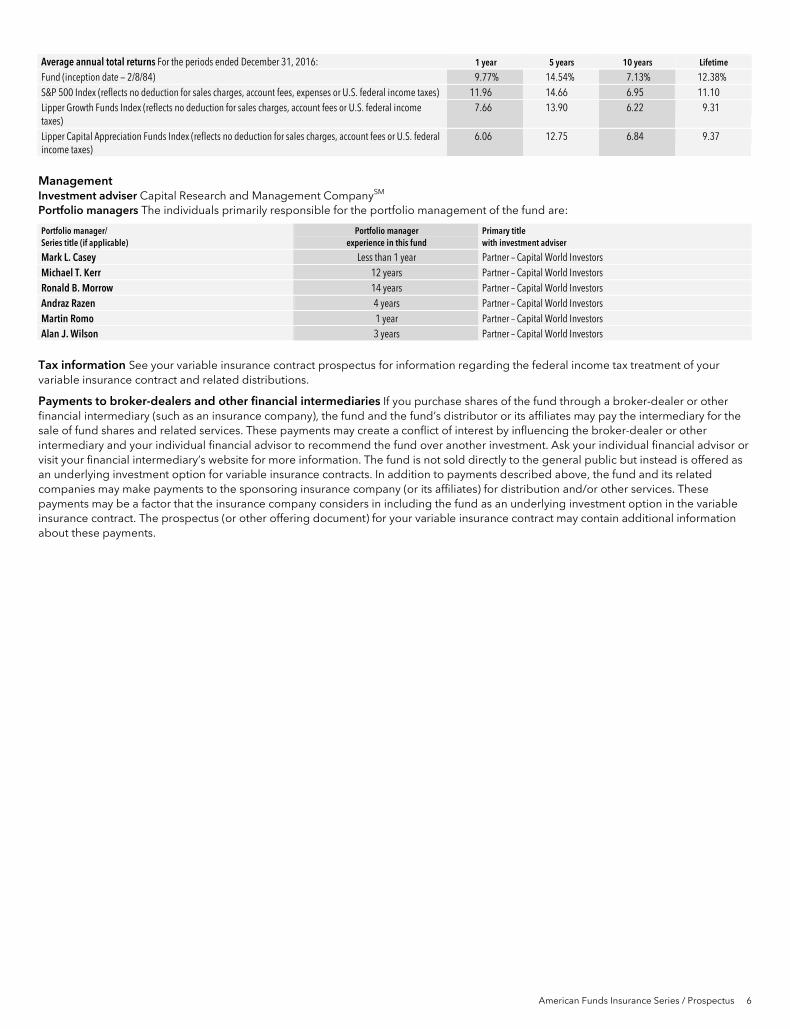
American Funds Insurance Series / Prospectus 6
Average annual total returns For the periods ended December 31, 2016: 1 year 5 years 10 years Lifetime
Fund (inception date — 2/8/84) 9.77% 14.54% 7.13% 12.38% S&P 500 Index (reflects no deduction for sales charges, account fees, expenses or U.S. federal income taxes) 11.96 14.66 6.95 11.10 Lipper Growth Funds Index (reflects no deduction for sales charges, account fees or U.S. federal income taxes)
7.66 13.90 6.22 9.31
Lipper Capital Appreciation Funds Index (reflects no deduction for sales charges, account fees or U.S. federal income taxes)
6.06 12.75 6.84 9.37
Management Investment adviser Capital Research and Management CompanySM Portfolio managers The individuals primarily responsible for the portfolio management of the fund are:
Portfolio manager/ Series title (if applicable)
Portfolio manager experience in this fund
Primary title with investment adviser
Mark L. Casey Less than 1 year Partner – Capital World Investors Michael T. Kerr 12 years Partner – Capital World Investors Ronald B. Morrow 14 years Partner – Capital World Investors Andraz Razen 4 years Partner – Capital World Investors Martin Romo 1 year Partner – Capital World Investors Alan J. Wilson 3 years Partner – Capital World Investors
Tax information See your variable insurance contract prospectus for information regarding the federal income tax treatment of your variable insurance contract and related distributions.
Payments to broker-dealers and other financial intermediaries If you purchase shares of the fund through a broker-dealer or other financial intermediary (such as an insurance company), the fund and the fund’s distributor or its affiliates may pay the intermediary for the sale of fund shares and related services. These payments may create a conflict of interest by influencing the broker-dealer or other intermediary and your individual financial advisor to recommend the fund over another investment. Ask your individual financial advisor or visit your financial intermediary’s website for more information. The fund is not sold directly to the general public but instead is offered as an underlying investment option for variable insurance contracts. In addition to payments described above, the fund and its related companies may make payments to the sponsoring insurance company (or its affiliates) for distribution and/or other services. These payments may be a factor that the insurance company considers in including the fund as an underlying investment option in the variable insurance contract. The prospectus (or other offering document) for your variable insurance contract may contain additional information about these payments.
7 American Funds Insurance Series / Prospectus
Growth-Income Fund Investment objectives The fund’s investment objectives are to achieve long-term growth of capital and income.
Fees and expenses of the fund This table describes the fees and expenses that you may pay if you buy and hold an interest in Class 1 shares of the fund. It does not reflect insurance contract fees and expenses. If insurance contract fees and expenses were reflected, expenses shown would be higher.
Annual fund operating expenses (expenses that you pay each year as a percentage of the value of your investment) Class 1 Management fee 0.27% Other expenses 0.02 Total annual fund operating expenses 0.29
Example This example is intended to help you compare the cost of investing in Class 1 shares of the fund with the cost of investing in other mutual funds.
The example assumes that you invest $10,000 in the fund for the time periods indicated and then redeem all of your shares at the end of those periods. The example also assumes that your investment has a 5% return each year and that the fund’s operating expenses remain the same. The example does not reflect insurance contract expenses. If insurance contract expenses were reflected, expenses shown would be higher. Although your actual costs may be higher or lower, based on these assumptions your costs would be:
1 year 3 years 5 years 10 years Class 1 $30 $93 $163 $368
Portfolio turnover The fund pays transaction costs, such as commissions, when it buys and sells securities (or “turns over” its portfolio). A higher portfolio turnover rate may indicate higher transaction costs. These costs, which are not reflected in annual fund operating expenses or in the example, affect the fund’s investment results. During the most recent fiscal year, the fund’s portfolio turnover rate was 27% of the average value of its portfolio.
Principal investment strategies The fund invests primarily in common stocks or other securities that the investment adviser believes demonstrate the potential for appreciation and/or dividends. The fund may invest up to 15% of its assets, at the time of purchase, in securities of issuers domiciled outside the United States. The fund is designed for investors seeking both capital appreciation and income.
The investment adviser uses a system of multiple portfolio managers in managing the fund’s assets. Under this approach, the portfolio of the fund is divided into segments managed by individual managers who decide how their respective segments will be invested.
The fund relies on the professional judgment of its investment adviser to make decisions about the fund’s portfolio investments. The basic investment philosophy of the investment adviser is to seek to invest in attractively valued companies that, in its opinion, represent good, long-term investment opportunities. The investment adviser believes that an important way to accomplish this is through fundamental analysis, which may include meeting with company executives and employees, suppliers, customers and competitors. Securities may be sold when the investment adviser believes that they no longer represent relatively attractive investment opportunities.

American Funds Insurance Series / Prospectus 8
Principal risks
This section describes the principal risks associated with the fund’s principal investment strategies. You may lose money by investing in the fund. The likelihood of loss may be greater if you invest for a shorter period of time. Investors in the fund should have a long-term perspective and be able to tolerate potentially sharp declines in value.
Market conditions — The prices of, and the income generated by, the common stocks and other securities held by the fund may decline – sometimes rapidly or unpredictably – due to various factors, including events or conditions affecting the general economy or particular industries; overall market changes; local, regional or global political, social or economic instability; governmental or governmental agency responses to economic conditions; and currency exchange rate, interest rate and commodity price fluctuations.
Issuer risks — The prices of, and the income generated by, securities held by the fund may decline in response to various factors directly related to the issuers of such securities, including reduced demand for an issuer’s goods or services, poor management performance and strategic initiatives such as mergers, acquisitions or dispositions and the market response to any such initiatives.
Investing in growth-oriented stocks — Growth-oriented common stocks and other equity-type securities (such as preferred stocks, convertible preferred stocks and convertible bonds) may involve larger price swings and greater potential for loss than other types of investments.
Investing in income-oriented stocks — Income provided by the fund may be reduced by changes in the dividend policies of, and the capital resources available for dividend payments at, the companies in which the fund invests.
Investing outside the United States — Securities of issuers domiciled outside the United States, or with significant operations or revenues outside the United States, may lose value because of adverse political, social, economic or market developments (including social instability, regional conflicts, terrorism and war) in the countries or regions in which the issuers operate or generate revenue. These securities may also lose value due to changes in foreign currency exchange rates against the U.S. dollar and/or currencies of other countries. Issuers of these securities may be more susceptible to actions of foreign governments, such as the imposition of price controls or punitive taxes, that could adversely impact the value of these securities. Securities markets in certain countries may be more volatile and/or less liquid than those in the United States. Investments outside the United States may also be subject to different accounting practices and different regulatory, legal and reporting standards and practices, and may be more difficult to value, than those in the United States. In addition, the value of investments outside the United States may be reduced by foreign taxes, including foreign withholding taxes on interest and dividends. Further, there may be increased risks of delayed settlement of securities purchased or sold by the fund. The risks of investing outside the United States may be heightened in connection with investments in emerging markets.
Management — The investment adviser to the fund actively manages the fund’s investments. Consequently, the fund is subject to the risk that the methods and analyses employed by the investment adviser in this process may not produce the desired results. This could cause the fund to lose value or its investment results to lag relevant benchmarks or other funds with similar objectives.
Your investment in the fund is not a bank deposit and is not insured or guaranteed by the Federal Deposit Insurance Corporation or any other governmental agency, entity or person. You should consider how this fund fits into your overall investment program.
Investment results The following bar chart shows how the investment results of the Class 1 shares of the fund have varied from year to year, and the following table shows how the fund’s average annual total returns for various periods compare with a broad measure of securities market results and other applicable measures of market results. This information provides some indication of the risks of investing in the fund. The Lipper Growth and Income Funds Index includes mutual funds that disclose investment objectives and/or strategies reasonably comparable to those of the fund. Past investment results (before and after taxes) are not predictive of future investment results. Figures shown reflect fees and expenses associated with an investment in the fund, but do not reflect insurance contract fees and expenses. If insurance contract fees and expenses were included, results would have been lower. Updated information on the fund’s investment results can be obtained by visiting americanfunds.com/afis.
Calendar year total returns
Highest/Lowest quarterly results during this period were:
Highest 16.11% (quarter ended June 30, 2009)
Lowest –21.91% (quarter ended December 31, 2008)
(%)
–100
10203040
–30–20
–40
’12 ’14 ’15 ’16’07 ’08 ’09 ’10
11.72
’11
–1.60
17.79
’13
5.3210.91
1.72
–37.68–50
33.8231.54
11.80
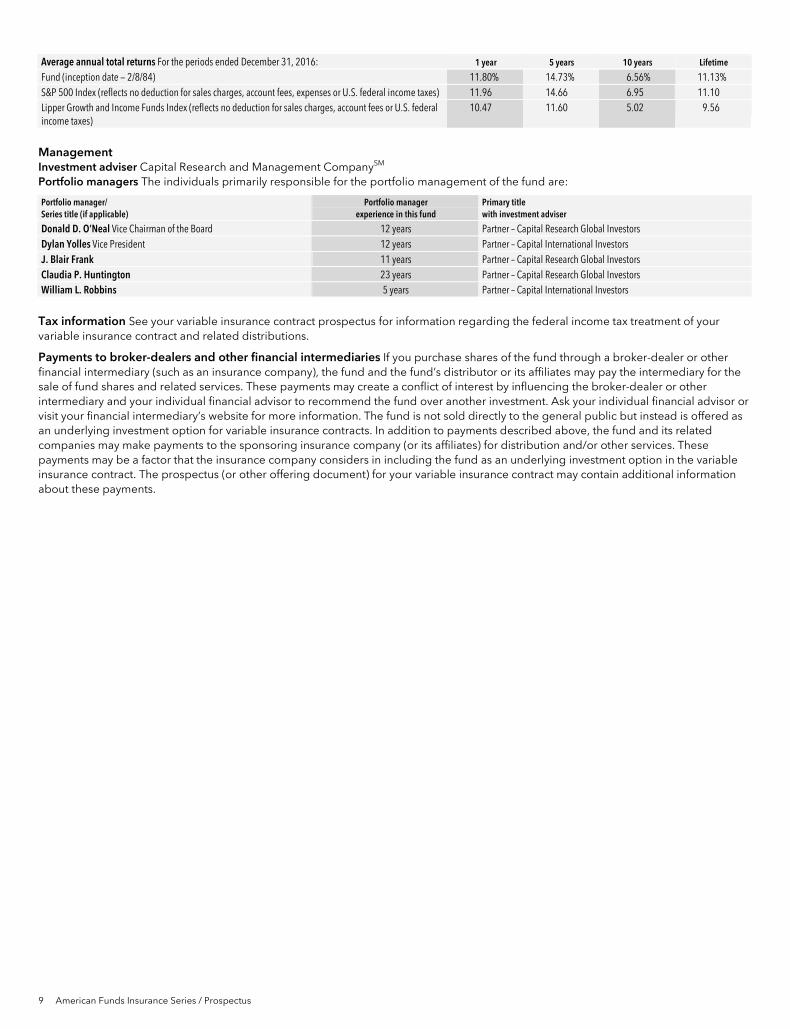
9 American Funds Insurance Series / Prospectus
Average annual total returns For the periods ended December 31, 2016: 1 year 5 years 10 years Lifetime
Fund (inception date — 2/8/84) 11.80% 14.73% 6.56% 11.13% S&P 500 Index (reflects no deduction for sales charges, account fees, expenses or U.S. federal income taxes) 11.96 14.66 6.95 11.10 Lipper Growth and Income Funds Index (reflects no deduction for sales charges, account fees or U.S. federal income taxes)
10.47 11.60 5.02 9.56
Management Investment adviser Capital Research and Management CompanySM Portfolio managers The individuals primarily responsible for the portfolio management of the fund are:
Portfolio manager/ Series title (if applicable)
Portfolio manager experience in this fund
Primary title with investment adviser
Donald D. O’Neal Vice Chairman of the Board 12 years Partner – Capital Research Global Investors Dylan Yolles Vice President 12 years Partner – Capital International Investors J. Blair Frank 11 years Partner – Capital Research Global Investors Claudia P. Huntington 23 years Partner – Capital Research Global Investors William L. Robbins 5 years Partner – Capital International Investors
Tax information See your variable insurance contract prospectus for information regarding the federal income tax treatment of your variable insurance contract and related distributions.
Payments to broker-dealers and other financial intermediaries If you purchase shares of the fund through a broker-dealer or other financial intermediary (such as an insurance company), the fund and the fund’s distributor or its affiliates may pay the intermediary for the sale of fund shares and related services. These payments may create a conflict of interest by influencing the broker-dealer or other intermediary and your individual financial advisor to recommend the fund over another investment. Ask your individual financial advisor or visit your financial intermediary’s website for more information. The fund is not sold directly to the general public but instead is offered as an underlying investment option for variable insurance contracts. In addition to payments described above, the fund and its related companies may make payments to the sponsoring insurance company (or its affiliates) for distribution and/or other services. These payments may be a factor that the insurance company considers in including the fund as an underlying investment option in the variable insurance contract. The prospectus (or other offering document) for your variable insurance contract may contain additional information about these payments.
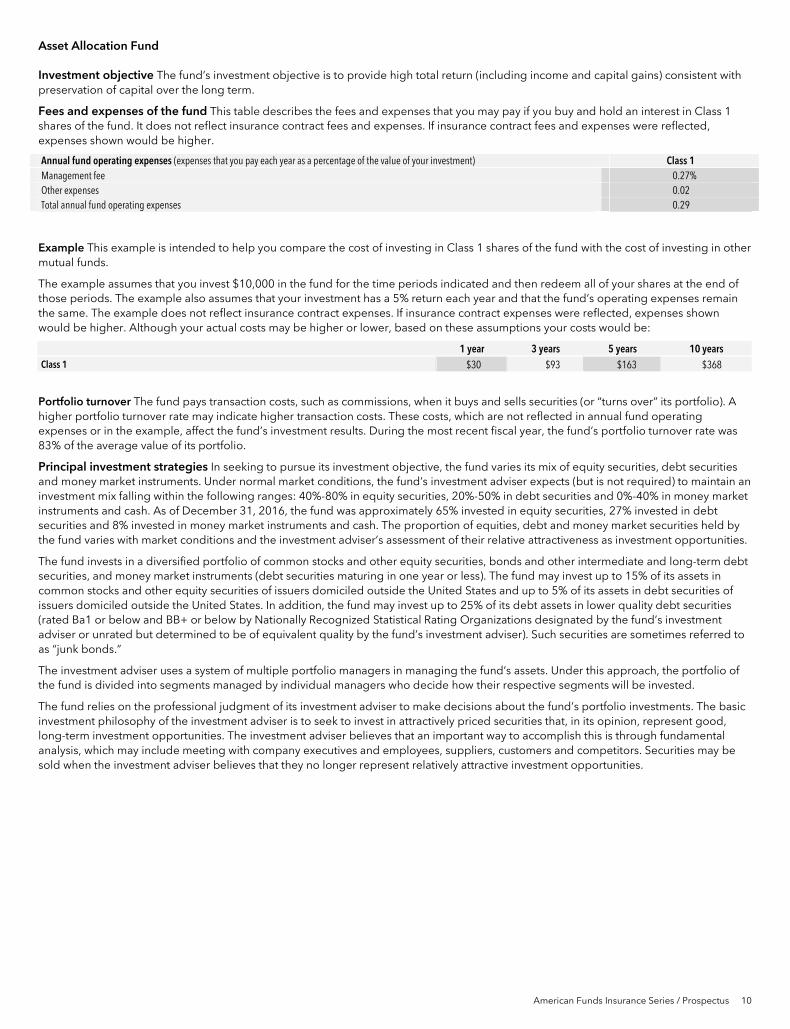
American Funds Insurance Series / Prospectus 10
Asset Allocation Fund Investment objective The fund’s investment objective is to provide high total return (including income and capital gains) consistent with preservation of capital over the long term.
Fees and expenses of the fund This table describes the fees and expenses that you may pay if you buy and hold an interest in Class 1 shares of the fund. It does not reflect insurance contract fees and expenses. If insurance contract fees and expenses were reflected, expenses shown would be higher.
Annual fund operating expenses (expenses that you pay each year as a percentage of the value of your investment) Class 1 Management fee 0.27% Other expenses 0.02 Total annual fund operating expenses 0.29
Example This example is intended to help you compare the cost of investing in Class 1 shares of the fund with the cost of investing in other mutual funds.
The example assumes that you invest $10,000 in the fund for the time periods indicated and then redeem all of your shares at the end of those periods. The example also assumes that your investment has a 5% return each year and that the fund’s operating expenses remain the same. The example does not reflect insurance contract expenses. If insurance contract expenses were reflected, expenses shown would be higher. Although your actual costs may be higher or lower, based on these assumptions your costs would be:
1 year 3 years 5 years 10 years Class 1 $30 $93 $163 $368
Portfolio turnover The fund pays transaction costs, such as commissions, when it buys and sells securities (or “turns over” its portfolio). A higher portfolio turnover rate may indicate higher transaction costs. These costs, which are not reflected in annual fund operating expenses or in the example, affect the fund’s investment results. During the most recent fiscal year, the fund’s portfolio turnover rate was 83% of the average value of its portfolio.
Principal investment strategies In seeking to pursue its investment objective, the fund varies its mix of equity securities, debt securities and money market instruments. Under normal market conditions, the fund’s investment adviser expects (but is not required) to maintain an investment mix falling within the following ranges: 40%-80% in equity securities, 20%-50% in debt securities and 0%-40% in money market instruments and cash. As of December 31, 2016, the fund was approximately 65% invested in equity securities, 27% invested in debt securities and 8% invested in money market instruments and cash. The proportion of equities, debt and money market securities held by the fund varies with market conditions and the investment adviser’s assessment of their relative attractiveness as investment opportunities.
The fund invests in a diversified portfolio of common stocks and other equity securities, bonds and other intermediate and long-term debt securities, and money market instruments (debt securities maturing in one year or less). The fund may invest up to 15% of its assets in common stocks and other equity securities of issuers domiciled outside the United States and up to 5% of its assets in debt securities of issuers domiciled outside the United States. In addition, the fund may invest up to 25% of its debt assets in lower quality debt securities (rated Ba1 or below and BB+ or below by Nationally Recognized Statistical Rating Organizations designated by the fund’s investment adviser or unrated but determined to be of equivalent quality by the fund’s investment adviser). Such securities are sometimes referred to as “junk bonds.”
The investment adviser uses a system of multiple portfolio managers in managing the fund’s assets. Under this approach, the portfolio of the fund is divided into segments managed by individual managers who decide how their respective segments will be invested.
The fund relies on the professional judgment of its investment adviser to make decisions about the fund’s portfolio investments. The basic investment philosophy of the investment adviser is to seek to invest in attractively priced securities that, in its opinion, represent good, long-term investment opportunities. The investment adviser believes that an important way to accomplish this is through fundamental analysis, which may include meeting with company executives and employees, suppliers, customers and competitors. Securities may be sold when the investment adviser believes that they no longer represent relatively attractive investment opportunities.
11 American Funds Insurance Series / Prospectus
Principal risks
This section describes the principal risks associated with the fund’s principal investment strategies. You may lose money by investing in the fund. The likelihood of loss may be greater if you invest for a shorter period of time. Investors in the fund should have a long-term perspective and be able to tolerate potentially sharp declines in value.
Market conditions — The prices of, and the income generated by, the common stocks, bonds and other securities held by the fund may decline – sometimes rapidly or unpredictably – due to various factors, including events or conditions affecting the general economy or particular industries; overall market changes; local, regional or global political, social or economic instability; governmental or governmental agency responses to economic conditions; and currency exchange rate, interest rate and commodity price fluctuations.
Issuer risks — The prices of, and the income generated by, securities held by the fund may decline in response to various factors directly related to the issuers of such securities, including reduced demand for an issuer’s goods or services, poor management performance and strategic initiatives such as mergers, acquisitions or dispositions and the market response to any such initiatives.
Investing in growth-oriented stocks — Growth-oriented common stocks and other equity-type securities (such as preferred stocks, convertible preferred stocks and convertible bonds) may involve larger price swings and greater potential for loss than other types of investments.
Investing in income-oriented stocks — Income provided by the fund may be reduced by changes in the dividend policies of, and the capital resources available for dividend payments at, the companies in which the fund invests.
Investing in debt instruments — The prices of, and the income generated by, bonds and other debt securities held by the fund may be affected by changing interest rates and by changes in the effective maturities and credit ratings of these securities.
Rising interest rates will generally cause the prices of bonds and other debt securities to fall. Falling interest rates may cause an issuer to redeem, call or refinance a debt security before its stated maturity, which may result in the fund having to reinvest the proceeds in lower yielding securities. Longer maturity debt securities generally have greater sensitivity to changes in interest rates and may be subject to greater price fluctuations than shorter maturity debt securities.
Bonds and other debt securities are also subject to credit risk, which is the possibility that the credit strength of an issuer will weaken and/or an issuer of a debt security will fail to make timely payments of principal or interest and the security will go into default. Lower quality debt securities generally have higher rates of interest and may be subject to greater price fluctuations than higher quality debt securities. Credit risk is gauged, in part, by the credit ratings of the debt securities in which the fund invests. However, ratings are only the opinions of the rating agencies issuing them and are not guarantees as to credit quality or an evaluation of market risk. The fund’s investment adviser relies on its own credit analysts to research issuers and issues in seeking to mitigate various credit and default risks.
Investing in lower rated debt instruments — Lower rated bonds and other lower rated debt securities generally have higher rates of interest and involve greater risk of default or price declines due to changes in the issuer’s creditworthiness than those of higher quality debt securities. The market prices of these securities may fluctuate more than the prices of higher quality debt securities and may decline significantly in periods of general economic difficulty. These risks may be increased with respect to investments in junk bonds.
Investing in securities backed by the U.S. government — Securities backed by the U.S. Treasury or the full faith and credit of the U.S. government are guaranteed only as to the timely payment of interest and principal when held to maturity. Accordingly, the current market values for these securities will fluctuate with changes in interest rates. Securities issued by government-sponsored entities and federal agencies and instrumentalities that are not backed by the full faith and credit of the U.S. government are neither issued nor guaranteed by the U.S. government.
Liquidity risk — Certain fund holdings may be deemed to be less liquid or illiquid because they cannot be readily sold without significantly impacting the value of the holdings. Liquidity risk may result from the lack of an active market for a holding, legal or contractual restrictions on resale, or the reduced number and capacity of market participants to make a market in such holding. Market prices for less liquid or illiquid holdings may be volatile, and reduced liquidity may have an adverse impact on the market price of such holdings. Additionally, the sale of less liquid or illiquid holdings may involve substantial delays (including delays in settlement) and additional costs and the fund may be unable to sell such holdings when necessary to meet its liquidity needs.

American Funds Insurance Series / Prospectus 12
Investing outside the United States — Securities of issuers domiciled outside the United States, or with significant operations or revenues outside the United States, may lose value because of adverse political, social, economic or market developments (including social instability, regional conflicts, terrorism and war) in the countries or regions in which the issuers operate or generate revenue. These securities may also lose value due to changes in foreign currency exchange rates against the U.S. dollar and/or currencies of other countries. Issuers of these securities may be more susceptible to actions of foreign governments, such as the imposition of price controls or punitive taxes, that could adversely impact the value of these securities. Securities markets in certain countries may be more volatile and/or less liquid than those in the United States. Investments outside the United States may also be subject to different accounting practices and different regulatory, legal and reporting standards and practices, and may be more difficult to value, than those in the United States. In addition, the value of investments outside the United States may be reduced by foreign taxes, including foreign withholding taxes on interest and dividends. Further, there may be increased risks of delayed settlement of securities purchased or sold by the fund. The risks of investing outside the United States may be heightened in connection with investments in emerging markets.
Asset allocation — The fund’s percentage allocation to equity securities, debt securities and money market instruments could cause the fund to underperform relative to relevant benchmarks and other funds with similar investment objectives.
Management — The investment adviser to the fund actively manages the fund’s investments. Consequently, the fund is subject to the risk that the methods and analyses employed by the investment adviser in this process may not produce the desired results. This could cause the fund to lose value or its investment results to lag relevant benchmarks or other funds with similar objectives.
Your investment in the fund is not a bank deposit and is not insured or guaranteed by the Federal Deposit Insurance Corporation or any other governmental agency, entity or person. You should consider how this fund fits into your overall investment program.
Investment results The following bar chart shows how the investment results of the Class 1 shares of the fund have varied from year to year, and the following table shows how the fund’s average annual total returns for various periods compare with a broad measure of securities market results and other applicable measures of market results. This information provides some indication of the risks of investing in the fund. The 60%/40% S&P 500 Index/Bloomberg Barclays U.S. Aggregate Index is a composite blend of 60% of the S&P 500 Index and 40% of the Bloomberg Barclays U.S. Aggregate Index and represents a broad measure of the U.S. stock and bond markets, including market sectors in which the fund may invest. The Lipper Balanced Funds Index includes mutual funds that disclose investment objectives and/or strategies reasonably comparable to those of the fund. Past investment results (before and after taxes) are not predictive of future investment results. Figures shown reflect fees and expenses associated with an investment in the fund, but do not reflect insurance contract fees and expenses. If insurance contract fees and expenses were included, results would have been lower. Updated information on the fund’s investment results can be obtained by visiting americanfunds.com/afis.
Calendar year total returns
Highest/Lowest quarterly results during this period were:
Highest 11.65% (quarter ended September 30, 2009)
Lowest –16.30% (quarter ended December 31, 2008)
(%)
0
10
20
30
–30
–10
–20
’12 ’14 ’15 ’16’07 ’08 ’09
24.27
’10 ’11 ’13
6.82
–40
24.04
1.56
–29.30
9.6916.44
12.75
1.645.66
Average annual total returns For the periods ended December 31, 2016: 1 year 5 years 10 years Lifetime
Fund (inception date — 8/1/89) 9.69% 11.22% 6.22% 8.42% S&P 500 Index (reflects no deduction for sales charges, account fees, expenses or U.S. federal income taxes) 11.96 14.66 6.95 9.41 Bloomberg Barclays U.S. Aggregate Index (reflects no deduction for sales charges, account fees, expenses or U.S. federal income taxes)
2.65 2.23 4.34 6.12
60%/40% S&P 500 Index/Bloomberg Barclays U.S. Aggregate Index (reflects no deductions for sales charges, account fees, expenses or U.S. federal income taxes)
8.31 9.69 6.21 8.35
Lipper Balanced Funds Index (reflects no deductions for sales charges, account fees or U.S. federal income taxes) 7.20 8.32 5.01 7.46

13 American Funds Insurance Series / Prospectus
Management Investment adviser Capital Research and Management CompanySM Portfolio managers The individuals primarily responsible for the portfolio management of the fund are:
Portfolio manager/ Series title (if applicable)
Portfolio manager experience in this fund
Primary title with investment adviser
Alan N. Berro President 17 years Partner – Capital World Investors J. David Carpenter 4 years Partner – Capital World Investors David A. Daigle 8 years Partner – Capital Fixed Income Investors Jeffrey T. Lager 10 years Partner – Capital World Investors James R. Mulally 11 years Partner – Capital Fixed Income Investors John R. Queen 1 year Vice President – Capital Fixed Income Investors
Tax information See your variable insurance contract prospectus for information regarding the federal income tax treatment of your variable insurance contract and related distributions.
Payments to broker-dealers and other financial intermediaries If you purchase shares of the fund through a broker-dealer or other financial intermediary (such as an insurance company), the fund and the fund’s distributor or its affiliates may pay the intermediary for the sale of fund shares and related services. These payments may create a conflict of interest by influencing the broker-dealer or other intermediary and your individual financial advisor to recommend the fund over another investment. Ask your individual financial advisor or visit your financial intermediary’s website for more information. The fund is not sold directly to the general public but instead is offered as an underlying investment option for variable insurance contracts. In addition to payments described above, the fund and its related companies may make payments to the sponsoring insurance company (or its affiliates) for distribution and/or other services. These payments may be a factor that the insurance company considers in including the fund as an underlying investment option in the variable insurance contract. The prospectus (or other offering document) for your variable insurance contract may contain additional information about these payments.
American Funds Insurance Series / Prospectus 14
Investment objectives, strategies and risks
Global Growth Fund The fund’s investment objective is to provide long-term growth of capital. While it has no present intention to do so, the fund’s board may change the fund’s investment objective without shareholder approval upon 60 days’ written notice to shareholders.
The fund invests primarily in common stocks of companies around the world that the investment adviser believes have the potential for growth. As a fund that seeks to invest globally, the fund will allocate its assets among securities of companies domiciled in various countries, including the United States and countries with emerging markets (but in no fewer than three countries). Under normal market conditions, the fund will invest significantly in issuers domiciled outside the United States (i.e., at least 40% of its net assets, unless market conditions are not deemed favorable by the fund’s investment adviser, in which case the fund would invest at least 30% of its net assets in issuers outside the United States). Although the fund focuses on investments in medium to larger capitalization companies, the fund’s investments are not limited to a particular capitalization size.
The fund is designed for investors seeking capital appreciation through investments in stocks. Investors in the fund should have a long-term perspective and be able to tolerate potentially sharp declines in value.
The fund may also hold cash or money market instruments, including commercial paper and short-term securities issued by the U.S. government, its agencies and instrumentalities. The percentage of the fund invested in such holdings varies and depends on various factors, including market conditions and purchases and redemptions of fund shares. The investment adviser may determine that it is appropriate to invest a substantial portion of the fund’s assets in such instruments in response to certain circumstances, such as periods of market turmoil. In addition, for temporary defensive purposes, the fund may invest without limitation in such instruments. A larger amount of such holdings could moderate a fund’s investment results in a period of rising market prices. Alternatively, a larger percentage of such holdings could reduce the magnitude of a fund’s loss in a period of falling market prices and provide liquidity to make additional investments or to meet redemptions.
The following are principal risks associated with the fund’s investment strategies.
Market conditions — The prices of, and the income generated by, the common stocks and other securities held by the fund may decline – sometimes rapidly or unpredictably – due to various factors, including events or conditions affecting the general economy or particular industries; overall market changes; local, regional or global political, social or economic instability; governmental or governmental agency responses to economic conditions; and currency exchange rate, interest rate and commodity price fluctuations.
Issuer risks — The prices of, and the income generated by, securities held by the fund may decline in response to various factors directly related to the issuers of such securities, including reduced demand for an issuer’s goods or services, poor management performance and strategic initiatives such as mergers, acquisitions or dispositions and the market response to any such initiatives.
Investing in growth-oriented stocks — Growth-oriented common stocks and other equity-type securities (such as preferred stocks, convertible preferred stocks and convertible bonds) may involve larger price swings and greater potential for loss than other types of investments.
Investing outside the United States — Securities of issuers domiciled outside the United States, or with significant operations or revenues outside the United States, may lose value because of adverse political, social, economic or market developments (including social instability, regional conflicts, terrorism and war) in the countries or regions in which the issuers operate or generate revenue. These securities may also lose value due to changes in foreign currency exchange rates against the U.S. dollar and/or currencies of other countries. Issuers of these securities may be more susceptible to actions of foreign governments, such as the imposition of price controls or punitive taxes, that could adversely impact the value of these securities. Securities markets in certain countries may be more volatile and/or less liquid than those in the United States. Investments outside the United States may also be subject to different accounting practices and different regulatory, legal and reporting standards and practices, and may be more difficult to value, than those in the United States. In addition, the value of investments outside the United States may be reduced by foreign taxes, including foreign withholding taxes on interest and dividends. Further, there may be increased risks of delayed settlement of securities purchased or sold by the fund. The risks of investing outside the United States may be heightened in connection with investments in emerging markets.
Investing in emerging markets — Investing in emerging markets may involve risks in addition to and greater than those generally associated with investing in the securities markets of developed countries. For instance, developing countries may have less developed legal and accounting systems than those in developed countries. The governments of these countries may be less stable and more likely to impose capital controls, nationalize a company or industry, place restrictions on foreign ownership and on withdrawing sale proceeds of securities from the country, and/or impose punitive taxes that could adversely affect the prices of securities. In addition, the economies of these countries may be dependent on relatively few industries that are more susceptible to local and global changes. Securities markets in these countries can also be relatively small and have substantially lower trading volumes. As a result, securities issued in these countries may be more volatile and less liquid, and may be more difficult to value, than securities issued in countries with more developed economies and/or markets. Less certainty with respect to security valuations may lead to additional challenges and risks in calculating the fund’s net asset value. Additionally, there may be increased settlement risks for transactions in local securities.

15 American Funds Insurance Series / Prospectus
Management — The investment adviser to the fund actively manages the fund’s investments. Consequently, the fund is subject to the risk that the methods and analyses employed by the investment adviser in this process may not produce the desired results. This could cause the fund to lose value or its investment results to lag relevant benchmarks or other funds with similar objectives.
The following are certain additional risks associated with the fund’s investment strategies.
Exposure to country, region, industry or sector — Subject to the fund’s investment limitations, the fund may have significant exposure to a particular country, region, industry or sector. Such exposure may cause the fund to be more impacted by risks relating to the country, region, industry or sector than a fund without such levels of exposure. For example, if the fund has significant exposure in a particular country, then social, economic, regulatory or other issues that negatively affect that country may have a greater impact on the fund than on a fund that is more geographically diversified.
Liquidity risk — Certain fund holdings may be deemed to be less liquid or illiquid because they cannot be readily sold without significantly impacting the value of the holdings. Liquidity risk may result from the lack of an active market for a holding, legal or contractual restrictions on resale, or the reduced number and capacity of market participants to make a market in such holding. Market prices for less liquid or illiquid holdings may be volatile, and reduced liquidity may have an adverse impact on the market price of such holdings. Additionally, the sale of less liquid or illiquid holdings may involve substantial delays (including delays in settlement) and additional costs and the fund may be unable to sell such holdings when necessary to meet its liquidity needs.
In addition to the principal investment strategies described above, the fund has other investment practices that are described in the statement of additional information, which includes a description of other risks related to the fund’s principal investment strategies and other investment practices. The fund’s investment results will depend on the ability of the fund’s investment adviser to navigate the risks discussed above as well as those described in the statement of additional information.
Fund comparative indexes — The MSCI All Country World Index is a free float-adjusted market capitalization-weighted index that is designed to measure equity market results in the global developed and emerging markets, consisting of more than 40 developed and emerging market country indexes. Results reflect dividends gross of withholding taxes through December 31, 2000, and dividends net of withholding taxes thereafter. This index is unmanaged, and its results include reinvested dividends and/or distributions but do not reflect the effect of sales charges, commissions, account fees, expenses or U.S. federal income taxes. The Lipper Global Funds Index is an equally weighted index of funds that invest at least 25% of their portfolios in securities traded outside the United States and may own U.S. securities as well. The results of the underlying funds in the index include the reinvestment of dividends and capital gain distributions, as well as brokerage commissions paid by the funds for portfolio transactions and other fund expenses, but do not reflect the effect of sales charges, account fees or U.S. federal income taxes.
Growth Fund The fund’s investment objective is to provide growth of capital. While it has no present intention to do so, the fund’s board may change the fund’s investment objective without shareholder approval upon 60 days’ written notice to shareholders.
The fund invests primarily in common stocks and seeks to invest in companies that appear to offer superior opportunities for growth of capital. The fund may invest up to 25% of its assets in common stocks and other securities of issuers domiciled outside the United States, including, to a more limited extent, in emerging markets. Although the fund focuses on investments in medium to larger capitalization companies, the fund’s investments are not limited to a particular capitalization size. The fund may also invest in other equity type securities, such as preferred stocks, convertible preferred stocks and convertible bonds.
The fund is designed for investors seeking capital appreciation through investments in stocks. Investors in the fund should have a long-term perspective and be able to tolerate potentially sharp declines in value.
The fund may also hold cash or money market instruments, including commercial paper and short-term securities issued by the U.S. government, its agencies and instrumentalities. The percentage of the fund invested in such holdings varies and depends on various factors, including market conditions and purchases and redemptions of fund shares. The investment adviser may determine that it is appropriate to invest a substantial portion of the fund’s assets in such instruments in response to certain circumstances, such as periods of market turmoil. In addition, for temporary defensive purposes, the fund may invest without limitation in such instruments. A larger amount of such holdings could moderate a fund’s investment results in a period of rising market prices. Alternatively, a larger percentage of such holdings could reduce the magnitude of a fund’s loss in a period of falling market prices and provide liquidity to make additional investments or to meet redemptions.
The following are principal risks associated with the fund’s investment strategies.
Market conditions — The prices of, and the income generated by, the common stocks and other securities held by the fund may decline – sometimes rapidly or unpredictably – due to various factors, including events or conditions affecting the general economy or particular industries; overall market changes; local, regional or global political, social or economic instability; governmental or governmental agency responses to economic conditions; and currency exchange rate, interest rate and commodity price fluctuations.
Issuer risks — The prices of, and the income generated by, securities held by the fund may decline in response to various factors directly related to the issuers of such securities, including reduced demand for an issuer’s goods or services, poor management performance and strategic initiatives such as mergers, acquisitions or dispositions and the market response to any such initiatives.
Investing in growth-oriented stocks — Growth-oriented common stocks and other equity-type securities (such as preferred stocks, convertible preferred stocks and convertible bonds) may involve larger price swings and greater potential for loss than other types of investments. These risks may be even greater in the case of smaller capitalization stocks.

American Funds Insurance Series / Prospectus 16
Investing outside the United States — Securities of issuers domiciled outside the United States, or with significant operations or revenues outside the United States, may lose value because of adverse political, social, economic or market developments (including social instability, regional conflicts, terrorism and war) in the countries or regions in which the issuers operate or generate revenue. These securities may also lose value due to changes in foreign currency exchange rates against the U.S. dollar and/or currencies of other countries. Issuers of these securities may be more susceptible to actions of foreign governments, such as the imposition of price controls or punitive taxes, that could adversely impact the value of these securities. Securities markets in certain countries may be more volatile and/or less liquid than those in the United States. Investments outside the United States may also be subject to different accounting practices and different regulatory, legal and reporting standards and practices, and may be more difficult to value, than those in the United States. In addition, the value of investments outside the United States may be reduced by foreign taxes, including foreign withholding taxes on interest and dividends. Further, there may be increased risks of delayed settlement of securities purchased or sold by the fund. The risks of investing outside the United States may be heightened in connection with investments in emerging markets.
Management — The investment adviser to the fund actively manages the fund’s investments. Consequently, the fund is subject to the risk that the methods and analyses employed by the investment adviser in this process may not produce the desired results. This could cause the fund to lose value or its investment results to lag relevant benchmarks or other funds with similar objectives.
The following are certain additional risks associated with the fund’s investment strategies.
Investing in small companies — Investing in smaller companies may pose additional risks. For example, it is often more difficult to value or dispose of small company stocks and more difficult to obtain information about smaller companies than about larger companies. Furthermore, smaller companies often have limited product lines, operating histories, markets and/or financial resources, may be dependent on one or a few key persons for management, and can be more susceptible to losses. Moreover, the prices of their stocks may be more volatile than stocks of larger, more established companies.
Exposure to country, region, industry or sector — Subject to the fund’s investment limitations, the fund may have significant exposure to a particular country, region, industry or sector. Such exposure may cause the fund to be more impacted by risks relating to the country, region, industry or sector than a fund without such levels of exposure. For example, if the fund has significant exposure in a particular country, then social, economic, regulatory or other issues that negatively affect that country may have a greater impact on the fund than on a fund that is more geographically diversified.
Liquidity risk — Certain fund holdings may be deemed to be less liquid or illiquid because they cannot be readily sold without significantly impacting the value of the holdings. Liquidity risk may result from the lack of an active market for a holding, legal or contractual restrictions on resale, or the reduced number and capacity of market participants to make a market in such holding. Market prices for less liquid or illiquid holdings may be volatile, and reduced liquidity may have an adverse impact on the market price of such holdings. Additionally, the sale of less liquid or illiquid holdings may involve substantial delays (including delays in settlement) and additional costs and the fund may be unable to sell such holdings when necessary to meet its liquidity needs.
In addition to the principal investment strategies described above, the fund has other investment practices that are described in the statement of additional information, which includes a description of other risks related to the fund’s principal investment strategies and other investment practices. The fund’s investment results will depend on the ability of the fund’s investment adviser to navigate the risks discussed above as well as those described in the statement of additional information.
Fund comparative indexes — The S&P 500 Index is a market capitalization-weighted index based on the results of 500 widely held common stocks. This index is unmanaged, and its results include reinvested dividends and/or distributions but do not reflect the effect of sales charges, commissions, account fees, expenses or U.S. federal income taxes. The Lipper Growth Funds Index is an equally weighted index of growth funds, as defined by each fund’s related prospectus. The results of the underlying funds in the index include the reinvestment of dividends and capital gain distributions, as well as brokerage commissions paid by the funds for portfolio transactions and other fund expenses, but do not reflect the effect of sales charges, account fees or U.S. federal income taxes. The Lipper Capital Appreciation Funds Index is an equally weighted index of funds that aim for maximum capital appreciation. The results of the underlying funds in both Lipper indexes include the reinvestment of dividends and capital gain distributions, as well as brokerage commissions paid by the funds for portfolio transactions and other fund expenses, but do not reflect the effect of sales charges, account fees or U.S. federal income taxes.
Growth-Income Fund The fund’s investment objectives are to achieve long-term growth of capital and income. While it has no present intention to do so, the fund’s board may change the fund’s investment objectives without shareholder approval upon 60 days’ written notice to shareholders.
The fund invests primarily in common stocks or other equity type securities, such as preferred stocks, convertible preferred stocks and convertible bonds, that the investment adviser believes demonstrate the potential for appreciation and/or dividends. Although the fund focuses on investments in medium to larger capitalization companies, the fund’s investments are not limited to a particular capitalization size. The fund may invest up to 15% of its assets, at the time of purchase, in securities of issuers domiciled outside the United States, including, to a more limited extent, in emerging markets. The fund is designed for investors seeking both capital appreciation and income.
Investors in the fund should have a long-term perspective and be able to tolerate potentially sharp declines in value.
The fund may also hold cash or money market instruments, including commercial paper and short-term securities issued by the U.S. government, its agencies and instrumentalities. The percentage of the fund invested in such holdings varies and depends on various factors, including market conditions and purchases and redemptions of fund shares. The investment adviser may determine that it is appropriate to invest a substantial portion of the fund’s assets in such instruments in response to certain circumstances, such as periods of market turmoil. In addition, for temporary defensive purposes, the fund may invest without limitation in such instruments. A larger amount

17 American Funds Insurance Series / Prospectus
of such holdings could moderate a fund’s investment results in a period of rising market prices. Alternatively, a larger percentage of such holdings could reduce the magnitude of a fund’s loss in a period of falling market prices and provide liquidity to make additional investments or to meet redemptions.
The following are principal risks associated with the fund’s investment strategies.
Market conditions — The prices of, and the income generated by, the common stocks and other securities held by the fund may decline – sometimes rapidly or unpredictably – due to various factors, including events or conditions affecting the general economy or particular industries; overall market changes; local, regional or global political, social or economic instability; governmental or governmental agency responses to economic conditions; and currency exchange rate, interest rate and commodity price fluctuations.
Issuer risks — The prices of, and the income generated by, securities held by the fund may decline in response to various factors directly related to the issuers of such securities, including reduced demand for an issuer’s goods or services, poor management performance and strategic initiatives such as mergers, acquisitions or dispositions and the market response to any such initiatives.
Investing in growth-oriented stocks — Growth-oriented common stocks and other equity-type securities (such as preferred stocks, convertible preferred stocks and convertible bonds) may involve larger price swings and greater potential for loss than other types of investments.
Investing in income-oriented stocks — Income provided by the fund may be reduced by changes in the dividend policies of, and the capital resources available for dividend payments at, the companies in which the fund invests.
Investing outside the United States — Securities of issuers domiciled outside the United States, or with significant operations or revenues outside the United States, may lose value because of adverse political, social, economic or market developments (including social instability, regional conflicts, terrorism and war) in the countries or regions in which the issuers operate or generate revenue. These securities may also lose value due to changes in foreign currency exchange rates against the U.S. dollar and/or currencies of other countries. Issuers of these securities may be more susceptible to actions of foreign governments, such as the imposition of price controls or punitive taxes, that could adversely impact the value of these securities. Securities markets in certain countries may be more volatile and/or less liquid than those in the United States. Investments outside the United States may also be subject to different accounting practices and different regulatory, legal and reporting standards and practices, and may be more difficult to value, than those in the United States. In addition, the value of investments outside the United States may be reduced by foreign taxes, including foreign withholding taxes on interest and dividends. Further, there may be increased risks of delayed settlement of securities purchased or sold by the fund. The risks of investing outside the United States may be heightened in connection with investments in emerging markets.
Management — The investment adviser to the fund actively manages the fund’s investments. Consequently, the fund is subject to the risk that the methods and analyses employed by the investment adviser in this process may not produce the desired results. This could cause the fund to lose value or its investment results to lag relevant benchmarks or other funds with similar objectives.
The following are certain additional risks associated with the fund’s investment strategies.
Investing in debt instruments — The prices of, and the income generated by, bonds and other debt securities held by the fund may be affected by changing interest rates and by changes in the effective maturities and credit ratings of these securities.
Rising interest rates will generally cause the prices of bonds and other debt securities to fall. Falling interest rates may cause an issuer to redeem, call or refinance a debt security before its stated maturity, which may result in the fund having to reinvest the proceeds in lower yielding securities. Longer maturity debt securities generally have greater sensitivity to changes in interest rates and may be subject to greater price fluctuations than shorter maturity debt securities.
Bonds and other debt securities are also subject to credit risk, which is the possibility that the credit strength of an issuer will weaken and/or an issuer of a debt security will fail to make timely payments of principal or interest and the security will go into default. Lower quality debt securities generally have higher rates of interest and may be subject to greater price fluctuations than higher quality debt securities. Credit risk is gauged, in part, by the credit ratings of the debt securities in which the fund invests. However, ratings are only the opinions of the rating agencies issuing them and are not guarantees as to credit quality or an evaluation of market risk. The fund’s investment adviser relies on its own credit analysts to research issuers and issues in seeking to mitigate various credit and default risks.
Exposure to country, region, industry or sector — Subject to the fund’s investment limitations, the fund may have significant exposure to a particular country, region, industry or sector. Such exposure may cause the fund to be more impacted by risks relating to the country, region, industry or sector than a fund without such levels of exposure. For example, if the fund has significant exposure in a particular country, then social, economic, regulatory or other issues that negatively affect that country may have a greater impact on the fund than on a fund that is more geographically diversified.
Liquidity risk — Certain fund holdings may be deemed to be less liquid or illiquid because they cannot be readily sold without significantly impacting the value of the holdings. Liquidity risk may result from the lack of an active market for a holding, legal or contractual restrictions on resale, or the reduced number and capacity of market participants to make a market in such holding. Market prices for less liquid or illiquid holdings may be volatile, and reduced liquidity may have an adverse impact on the market price of such holdings. Additionally, the sale of less liquid or illiquid holdings may involve substantial delays (including delays in settlement) and additional costs and the fund may be unable to sell such holdings when necessary to meet its liquidity needs.
In addition to the principal investment strategies described above, the fund has other investment practices that are described in the statement of additional information, which includes a description of other risks related to the fund’s principal investment strategies and

American Funds Insurance Series / Prospectus 18
other investment practices. The fund’s investment results will depend on the ability of the fund’s investment adviser to navigate the risks discussed above as well as those described in the statement of additional information.
Fund comparative indexes — The S&P 500 Index is a market capitalization-weighted index based on the results of 500 widely held common stocks. This index is unmanaged, and its results include reinvested dividends and/or distributions but do not reflect the effect of sales charges, commissions, account fees, expenses or U.S. federal income taxes. The Lipper Growth and Income Funds Index is an equally weighted index of funds that combines a growth-of-earnings orientation and an income requirement for level and/or rising dividends. The results of the underlying funds in the index include the reinvestment of dividends and capital gain distributions, as well as brokerage commissions paid by the funds for portfolio transactions and other fund expenses, but do not reflect the effect of sales charges, account fees or U.S. federal income taxes.
Asset Allocation Fund The fund’s investment objective is to provide high total return (including income and capital gains) consistent with preservation of capital over the long term. While it has no present intention to do so, the fund’s board may change the fund’s investment objective without shareholder approval upon 60 days’ written notice to shareholders.
The fund invests in a diversified portfolio of common stocks and other equity securities, bonds and other intermediate and long-term debt securities, and money market instruments (debt securities maturing in one year or less). In seeking to pursue its investment objective, the fund varies its mix of equity securities, debt securities and money market instruments. Although the fund focuses on investments in medium to larger capitalization companies, the fund’s investments are not limited to a particular capitalization size. Under normal market conditions, the fund’s investment adviser expects (but is not required) to maintain an investment mix falling within the following ranges: 40%-80% in equity securities, 20%-50% in debt securities and 0%-40% in money market instruments and cash. As of December 31, 2016, the fund was approximately 65% invested in equity securities, 27% invested in debt securities and 8% invested in money market instruments and cash. The proportion of equities, debt and money market securities held by the fund varies with market conditions and the investment adviser’s assessment of their relative attractiveness as investment opportunities.
The fund may invest up to 15% of its assets in common stocks and other equity securities of issuers domiciled outside the United States and up to 5% of its assets in debt securities of issuers domiciled outside the United States. In addition, the fund may invest up to 25% of its debt assets in lower quality debt securities (rated Ba1 or below and BB+ or below by Nationally Recognized Statistical Rating Organizations designated by the fund’s investment adviser or unrated but determined to be of equivalent quality by the fund’s investment adviser). Such securities are sometimes referred to as “junk bonds.”
Investors in the fund should have a long-term perspective and be able to tolerate potentially sharp declines in value.
The fund may also invest in certain derivative instruments. A derivative is a financial contract, the value of which is based on the value of an underlying financial asset (such as a stock, bond or currency), a reference rate or a market index. The fund may invest in a derivative only if, in the opinion of the investment adviser, the expected risks and rewards of the proposed investment are consistent with the investment objectives and strategies of the fund as disclosed in this prospectus and in the fund’s statement of additional information.
Among other derivative instrument types, the fund may invest in futures contracts and interest rate swaps in order to seek to manage the fund’s sensitivity to interest rates. A futures contract is a standardized exchange-traded agreement to buy or sell a specific quantity of an underlying asset, rate or index at an agreed-upon price at a stipulated future date. An interest rate swap is an agreement between two parties to exchange or swap payments based on changes in one or more interest rates, one of which is typically fixed and the other of which is typically a floating rate based on a designated short-term interest rate, such as the London Interbank Offered Rate, a prime rate or other benchmark.
The fund may also hold cash or money market instruments, including commercial paper and short-term securities issued by the U.S. government, its agencies and instrumentalities. The percentage of the fund invested in such holdings varies and depends on various factors, including market conditions and purchases and redemptions of fund shares. The investment adviser may determine that it is appropriate to invest a substantial portion of the fund’s assets in such instruments in response to certain circumstances, such as periods of market turmoil. In addition, for temporary defensive purposes, the fund may invest without limitation in such instruments. A larger amount of such holdings could moderate a fund’s investment results in a period of rising market prices. Alternatively, a larger percentage of such holdings could reduce the magnitude of a fund’s loss in a period of falling market prices and provide liquidity to make additional investments or to meet redemptions.
The following are principal risks associated with the fund’s investment strategies.
Market conditions — The prices of, and the income generated by, the common stocks, bonds and other securities held by the fund may decline – sometimes rapidly or unpredictably – due to various factors, including events or conditions affecting the general economy or particular industries; overall market changes; local, regional or global political, social or economic instability; governmental or governmental agency responses to economic conditions; and currency exchange rate, interest rate and commodity price fluctuations.
Issuer risks — The prices of, and the income generated by, securities held by the fund may decline in response to various factors directly related to the issuers of such securities, including reduced demand for an issuer’s goods or services, poor management performance and strategic initiatives such as mergers, acquisitions or dispositions and the market response to any such initiatives.
Investing in growth-oriented stocks — Growth-oriented common stocks and other equity-type securities (such as preferred stocks, convertible preferred stocks and convertible bonds) may involve larger price swings and greater potential for loss than other types of investments.
Investing in income-oriented stocks — Income provided by the fund may be reduced by changes in the dividend policies of, and the capital resources available for dividend payments at, the companies in which the fund invests.
19 American Funds Insurance Series / Prospectus
Investing in debt instruments — The prices of, and the income generated by, bonds and other debt securities held by the fund may be affected by changing interest rates and by changes in the effective maturities and credit ratings of these securities.
Rising interest rates will generally cause the prices of bonds and other debt securities to fall. Falling interest rates may cause an issuer to redeem, call or refinance a debt security before its stated maturity, which may result in the fund having to reinvest the proceeds in lower yielding securities. Longer maturity debt securities generally have greater sensitivity to changes in interest rates and may be subject to greater price fluctuations than shorter maturity debt securities.
Bonds and other debt securities are also subject to credit risk, which is the possibility that the credit strength of an issuer will weaken and/or an issuer of a debt security will fail to make timely payments of principal or interest and the security will go into default. Lower quality debt securities generally have higher rates of interest and may be subject to greater price fluctuations than higher quality debt securities. Credit risk is gauged, in part, by the credit ratings of the debt securities in which the fund invests. However, ratings are only the opinions of the rating agencies issuing them and are not guarantees as to credit quality or an evaluation of market risk. The fund’s investment adviser relies on its own credit analysts to research issuers and issues in seeking to mitigate various credit and default risks.
Investing in lower rated debt instruments — Lower rated bonds and other lower rated debt securities generally have higher rates of interest and involve greater risk of default or price declines due to changes in the issuer’s creditworthiness than those of higher quality debt securities. The market prices of these securities may fluctuate more than the prices of higher quality debt securities and may decline significantly in periods of general economic difficulty. These risks may be increased with respect to investments in junk bonds.
Investing in securities backed by the U.S. government — Securities backed by the U.S. Treasury or the full faith and credit of the U.S. government are guaranteed only as to the timely payment of interest and principal when held to maturity. Accordingly, the current market values for these securities will fluctuate with changes in interest rates. Securities issued by government-sponsored entities and federal agencies and instrumentalities that are not backed by the full faith and credit of the U.S. government are neither issued nor guaranteed by the U.S. government.
Liquidity risk — Certain fund holdings may be deemed to be less liquid or illiquid because they cannot be readily sold without significantly impacting the value of the holdings. Liquidity risk may result from the lack of an active market for a holding, legal or contractual restrictions on resale, or the reduced number and capacity of market participants to make a market in such holding. Market prices for less liquid or illiquid holdings may be volatile, and reduced liquidity may have an adverse impact on the market price of such holdings. Additionally, the sale of less liquid or illiquid holdings may involve substantial delays (including delays in settlement) and additional costs and the fund may be unable to sell such holdings when necessary to meet its liquidity needs.
Investing outside the United States — Securities of issuers domiciled outside the United States, or with significant operations or revenues outside the United States, may lose value because of adverse political, social, economic or market developments (including social instability, regional conflicts, terrorism and war) in the countries or regions in which the issuers operate or generate revenue. These securities may also lose value due to changes in foreign currency exchange rates against the U.S. dollar and/or currencies of other countries. Issuers of these securities may be more susceptible to actions of foreign governments, such as the imposition of price controls or punitive taxes, that could adversely impact the value of these securities. Securities markets in certain countries may be more volatile and/or less liquid than those in the United States. Investments outside the United States may also be subject to different accounting practices and different regulatory, legal and reporting standards and practices, and may be more difficult to value, than those in the United States. In addition, the value of investments outside the United States may be reduced by foreign taxes, including foreign withholding taxes on interest and dividends. Further, there may be increased risks of delayed settlement of securities purchased or sold by the fund. The risks of investing outside the United States may be heightened in connection with investments in emerging markets.
Asset allocation — The fund’s percentage allocation to equity securities, debt securities and money market instruments could cause the fund to underperform relative to relevant benchmarks and other funds with similar investment objectives.
Management — The investment adviser to the fund actively manages the fund’s investments. Consequently, the fund is subject to the risk that the methods and analyses employed by the investment adviser in this process may not produce the desired results. This could cause the fund to lose value or its investment results to lag relevant benchmarks or other funds with similar objectives.
The following are certain additional risks associated with the fund’s investment strategies.
Interest rate risk — The values and liquidity of the securities held by the fund may be affected by changing interest rates. For example, the values of these securities may decline when interest rates rise and increase when interest rates fall. Longer maturity debt securities generally have greater sensitivity to changes in interest rates and may be subject to greater price fluctuations than shorter maturity debt securities. The fund may invest in variable and floating rate securities. Although the values of such securities are generally less sensitive to interest rate changes than those of other debt securities, the value of variable and floating rate securities may decline if their interest rates do not rise as quickly, or as much, as general interest rates. Conversely, floating rate securities will not generally increase in value if interest rates decline. During periods of extremely low short-term interest rates, the fund may not be able to maintain a positive yield and, given the current historically low interest rate environment, risks associated with rising rates are currently heightened.
Investing in derivatives — The use of derivatives involves a variety of risks, which may be different from, or greater than, the risks associated with investing in traditional cash securities, such as stocks and bonds. Changes in the value of a derivative may not correlate perfectly with, and may be more sensitive to market events than, the underlying asset, rate or index, and a derivative instrument may expose the fund to losses in excess of its initial investment. Derivatives may be difficult for the fund to buy or sell at an opportune time or price and may be difficult to terminate or otherwise offset. The fund’s use of derivatives may result in losses to the fund, and investing in derivatives may reduce the fund’s returns and increase the fund’s price volatility. The fund’s counterparty to a derivative transaction (including, if applicable, the fund’s clearing broker, the derivatives exchange or the clearinghouse) may be unable or unwilling to honor its financial
American Funds Insurance Series / Prospectus 20
obligations in respect of the transaction. A description of the derivative instruments in which the fund may invest and the various risks associated with those derivatives is included in the fund’s statement of additional information under “Description of certain securities, investment techniques and risks.”
Investing in futures contracts — In addition to the risks generally associated with investing in derivative instruments, futures contracts are subject to the creditworthiness of the clearing organizations, exchanges and futures commission merchants with which the fund transacts. Additionally, although futures require only a small initial investment in the form of a deposit of initial margin, the amount of a potential loss on a futures contract could greatly exceed the initial amount invested. While futures contracts are generally liquid instruments, under certain market conditions futures may be deemed to be illiquid. For example, the fund may be temporarily prohibited from closing out its position in a futures contract if intraday price change limits or limits on trading volume imposed by the applicable futures exchange are triggered. If the fund is unable to close out a position on a futures contract, the fund would remain subject to the risk of adverse price movements until the fund is able to close out the futures position. The ability of the fund to successfully utilize futures contracts may depend in part upon the ability of the fund’s investment adviser to accurately forecast interest rates and other economic factors and to assess and predict the impact of such economic factors on the futures in which the fund invests. If the investment adviser incorrectly forecasts economic developments or incorrectly predicts the impact of such developments on the futures in which it invests, the fund could be exposed to the risk of loss.
Investing in swaps — Swaps, including interest rate swaps and credit default swap indices, or CDX, are subject to many of the risks generally associated with investing in derivative instruments. Additionally, although swaps require no or only a small initial investment in the form of a deposit of initial margin, the amount of a potential loss on a swap contract could greatly exceed the initial amount invested. The use of swaps involves the risk that the investment adviser will not accurately predict anticipated changes in interest rates or other economic factors, which may result in losses to the fund. To the extent the fund enters into a bilaterally negotiated swap transaction, there is a possibility that the counterparty will fail to perform in accordance with the terms of the swap agreement. If a counterparty defaults on its obligations under a swap agreement, the fund may lose any amount it expected to receive from the counterparty, potentially including amounts in excess of the fund’s initial investment. Certain swap transactions are subject to mandatory central clearing or may be eligible for voluntary central clearing. Although clearing interposes a central clearinghouse as the ultimate counterparty to each participant’s swap, central clearing will not eliminate (but may decrease) counterparty risk relative to uncleared bilateral swaps. Some swaps, such as CDX, may be dependent on both the individual credit of the fund’s counterparty and on the credit of one or more issuers of any underlying assets. If the fund does not correctly evaluate the creditworthiness of its counterparty and, where applicable, of issuers of any underlying reference assets, the fund’s investment in a swap may result in losses to the fund.
Exposure to country, region, industry or sector — Subject to the fund’s investment limitations, the fund may have significant exposure to a particular country, region, industry or sector. Such exposure may cause the fund to be more impacted by risks relating to the country, region, industry or sector than a fund without such levels of exposure. For example, if the fund has significant exposure in a particular country, then social, economic, regulatory or other issues that negatively affect that country may have a greater impact on the fund than on a fund that is more geographically diversified.
In addition to the principal investment strategies described above, the fund has other investment practices that are described in the statement of additional information, which includes a description of other risks related to the fund’s principal investment strategies and other investment practices. The fund’s investment results will depend on the ability of the fund’s investment adviser to navigate the risks discussed above as well as those described in the statement of additional information.
Fund comparative indexes — The S&P 500 Index is a market capitalization-weighted index based on the results of 500 widely held common stocks. This index is unmanaged, and its results include reinvested dividends and/or distributions but do not reflect the effect of sales charges, commissions, account fees, expenses or U.S. federal income taxes. The Bloomberg Barclays U.S. Aggregate Index represents the U.S. investment-grade fixed-rate bond market. This index is unmanaged, and its results include reinvested dividends and/or distributions but do not reflect the effect of sales charges, commissions, account fees, expenses or U.S. federal income taxes. The 60%/40% S&P 500 Index/Bloomberg Barclays U.S. Aggregate Index blends the S&P 500 Index with the Bloomberg Barclays U.S. Aggregate Index by weighting their cumulative total returns at 60% and 40%, respectively. This assumes the blend is rebalanced monthly. The Lipper Balanced Funds Index is an equally weighted index of funds that seek to conserve principal by maintaining a balanced portfolio of both stocks and bonds. The results of the underlying funds in the index include the reinvestment of dividends and capital gain distributions, as well as brokerage commissions paid by the funds for portfolio transactions and other fund expenses, but do not reflect the effect of sales charges, account fees or U.S. federal income taxes.
21 American Funds Insurance Series / Prospectus
Management and organization Investment adviser Capital Research and Management Company, an experienced investment management organization founded in 1931, serves as the investment adviser to the Series and other mutual funds, including the American Funds. Capital Research and Management Company is a wholly owned subsidiary of The Capital Group Companies, Inc. and is located at 333 South Hope Street, Los Angeles, California 90071. Capital Research and Management Company manages the investment portfolios and business affairs of the Series. The total management fee paid by each fund to its investment adviser for the most recent fiscal year, in each case expressed as a percentage of average net assets of that fund, appears in the Annual Fund Operating Expenses table for each fund. Please see the statement of additional information for further details. A discussion regarding the basis for the approval of the Series’ Investment Advisory and Service Agreement by the Series’ board of trustees is contained in the Series’ annual report to shareholders for the fiscal year ended December 31, 2016.
Capital Research and Management Company manages equity assets through three equity investment divisions and fixed-income assets through its fixed-income investment division, Capital Fixed Income Investors. The three equity investment divisions — Capital World Investors, Capital Research Global Investors and Capital International Investors — make investment decisions independently of one another.
The equity investment divisions may, in the future, be incorporated as wholly owned subsidiaries of Capital Research and Management Company. In that event, Capital Research and Management Company would continue to be the investment adviser, and day-to-day investment management of equity assets would continue to be carried out through one or more of these subsidiaries. Although not currently contemplated, Capital Research and Management Company could incorporate its fixed-income investment division in the future and engage it to provide day-to-day investment management of fixed-income assets. Capital Research and Management Company and each of the funds it advises have received an exemptive order from the U.S. Securities and Exchange Commission that allows Capital Research and Management Company to use, upon approval of the funds’ boards, its management subsidiaries and affiliates to provide day-to-day investment management services to the funds, including making changes to the management subsidiaries and affiliates providing such services. The Series’ shareholders approved this arrangement; however, there is no assurance that Capital Research and Management Company will incorporate its investment divisions or exercise any authority granted to it under the exemptive order.
In addition, shareholders of the Series approved a proposal to reorganize the Series into a Delaware statutory trust. However, the Series reserves the right to delay implementing the reorganization.
Portfolio holdings A description of the funds’ policies and procedures regarding disclosure of information about their portfolio holdings is available in the statement of additional information.
The Capital SystemSM Capital Research and Management Company uses a system of multiple portfolio managers in managing mutual fund assets. Under this approach, the portfolio of a fund is divided into segments managed by individual managers who decide how their respective segments will be invested. In addition to the portfolio managers below, Capital Research and Management Company’s investment analysts may make investment decisions with respect to a portion of a fund’s portfolio. Investment decisions are subject to a fund’s objective(s), policies and restrictions and the oversight of the appropriate investment-related committees of Capital Research and Management Company and its investment divisions.
Certain senior members of Capital Fixed Income Investors, the investment adviser’s fixed-income investment division, serve on the Portfolio Strategy Group. The group utilizes a research-driven process with input from the investment adviser’s analysts, portfolio managers and economists to define investment themes on a range of macroeconomic factors, including duration, yield curve and sector allocation. Where applicable, the investment decisions made by a fund’s fixed-income portfolio managers are informed by the investment themes discussed by the group.

American Funds Insurance Series / Prospectus 22
The primary individual portfolio managers for each of the funds are:
Portfolio manager for the Series/Title (if applicable)
Primary title with investment adviser (or affiliate) and investment experience
Portfolio manager’s role in management of, and experience in, the fund(s)
Donald D. O’Neal Vice Chairman of the Board Partner – Capital Research Global Investors Investment professional for 32 years, all with Capital Research and Management Company or affiliate
Serves as an equity portfolio manager for: Growth-Income Fund — 12 years
Alan N. Berro President Partner – Capital World Investors Investment professional for 31 years in total; 26 years with Capital Research and Management Company or affiliate
Serves as an equity portfolio manager for: Asset Allocation Fund — 17 years
Carl M. Kawaja Vice President Partner – Capital World Investors Investment professional for 30 years in total; 26 years with Capital Research and Management Company or affiliate
Serves as an equity portfolio manager for: New World Fund — 18 years
Sung Lee Vice President Partner – Capital Research Global Investors Investment professional for 23 years, all with Capital Research and Management Company or affiliate
Serves as an equity portfolio manager for: International Fund — 11 years International Growth and Income Fund — 9 years
Dylan Yolles Vice President Partner – Capital International Investors Investment professional for 20 years in total; 17 years with Capital Research and Management Company or affiliate
Serves as an equity portfolio manager for: Growth-Income Fund — 12 years (plus 5 years of prior experience as an investment analyst for the fund)
Hilda L. Applbaum Partner – Capital World Investors Investment professional for 30 years in total; 22 years with Capital Research and Management Company or affiliate
Serves as an equity/fixed-income portfolio manager for: Global Balanced Fund — 6 years
Pramod Atluri Vice President – Capital Fixed Income Investors Investment professional for 19 years in total; 1 year with Capital Research and Management Company or affiliate
Serves as a fixed-income portfolio manager for: Bond Fund — 1 year
David C. Barclay Partner – Capital Fixed Income Investors Investment professional for 36 years in total; 29 years with Capital Research and Management Company or affiliate
Serves as a fixed-income portfolio manager for: High-Income Bond Fund — 24 years
L. Alfonso Barroso Partner – Capital Research Global Investors Investment professional for 23 years, all with Capital Research and Management Company or affiliate
Serves as an equity portfolio manager for: International Fund — 8 years
David J. Betanzos Partner – Capital Fixed Income Investors Investment professional for 17 years in total; 15 years with Capital Research and Management Company or affiliate
Serves as a fixed-income portfolio manager for: Capital Income Builder — 3 years Mortgage Fund — 3 years U.S. Government/AAA-Rated Securities Fund — 2 years
Mark A. Brett Partner – Capital Fixed Income Investors Investment professional for 38 years in total; 24 years with Capital Research and Management Company or affiliate
Serves as a fixed-income portfolio manager for: Global Balanced Fund — 6 years Global Bond Fund — 2 years
Christopher D. Buchbinder Partner – Capital Research Global Investors Investment professional for 22 years, all with Capital Research and Management Company or affiliate
Serves as an equity portfolio manager for: Blue Chip Income and Growth Fund — 10 years
J. David Carpenter Partner – Capital World Investors Investment professional for 23 years in total; 19 years with Capital Research and Management Company or affiliate
Serves as an equity portfolio manager for: Asset Allocation Fund — 4 years
Mark L. Casey Partner – Capital World Investors Investment professional for 17 years, all with Capital Research and Management Company or affiliate
Serves as an equity portfolio manager for: Growth Fund — Less than 1 year (plus 11 years of prior experience as an investment analyst for the fund)
Thomas H. Chow Vice President – Capital Fixed Income Investors Investment professional for 28 years in total; 2 years with Capital Research and Management Company or affiliate
Serves as a fixed-income portfolio manager for: High-Income Bond Fund — 2 years
Patrice Collette Partner – Capital World Investors Investment professional for 23 years in total, 17 years with Capital Research and Management Company or affiliate
Serves as an equity portfolio manager for: Global Growth Fund — 2 years (plus 14 years of prior experience as an investment analyst for the fund)
David A. Daigle Partner – Capital Fixed Income Investors Investment professional for 23 years, all with Capital Research and Management Company or affiliate
Serves as a fixed-income portfolio manager for: Asset Allocation Fund — 8 years Global Bond Fund — 2 years High-Income Bond Fund — 8 years (plus 9 years of prior experience as an investment analyst for the fund)
Isabelle de Wismes Partner – Capital World Investors Investment professional for 33 years in total; 24 years with Capital Research and Management Company or affiliate
Serves as an equity portfolio manager for: Global Growth Fund — 5 years (plus 14 years of prior experience as an investment analyst for the fund)
Gerald Du Manoir Partner – Capital International Investors Investment professional for 27 years, all with Capital Research and Management Company or affiliate
Serves as a fixed-income portfolio manager for: Capital Income Builder — Less than 1 year
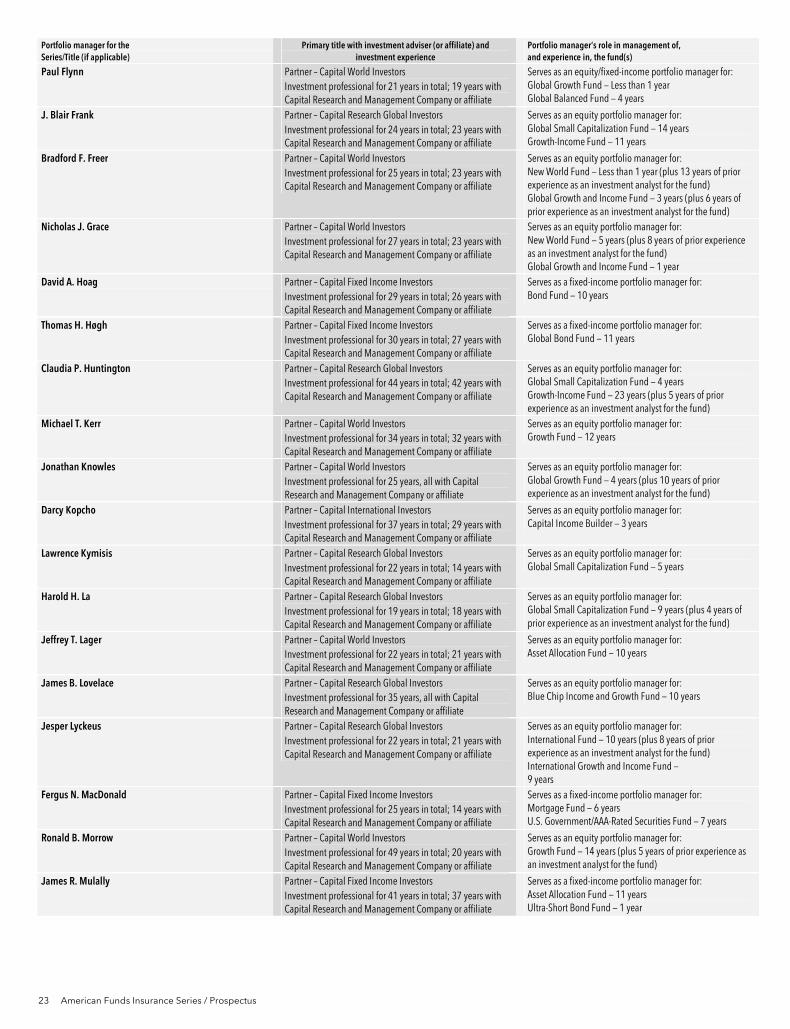
23 American Funds Insurance Series / Prospectus
Portfolio manager for the Series/Title (if applicable)
Primary title with investment adviser (or affiliate) and investment experience
Portfolio manager’s role in management of, and experience in, the fund(s)
Paul Flynn Partner – Capital World Investors Investment professional for 21 years in total; 19 years with Capital Research and Management Company or affiliate
Serves as an equity/fixed-income portfolio manager for: Global Growth Fund — Less than 1 year Global Balanced Fund — 4 years
J. Blair Frank Partner – Capital Research Global Investors Investment professional for 24 years in total; 23 years with Capital Research and Management Company or affiliate
Serves as an equity portfolio manager for: Global Small Capitalization Fund — 14 years Growth-Income Fund — 11 years
Bradford F. Freer Partner – Capital World Investors Investment professional for 25 years in total; 23 years with Capital Research and Management Company or affiliate
Serves as an equity portfolio manager for: New World Fund — Less than 1 year (plus 13 years of prior experience as an investment analyst for the fund) Global Growth and Income Fund — 3 years (plus 6 years of prior experience as an investment analyst for the fund)
Nicholas J. Grace Partner – Capital World Investors Investment professional for 27 years in total; 23 years with Capital Research and Management Company or affiliate
Serves as an equity portfolio manager for: New World Fund — 5 years (plus 8 years of prior experience as an investment analyst for the fund) Global Growth and Income Fund — 1 year
David A. Hoag Partner – Capital Fixed Income Investors Investment professional for 29 years in total; 26 years with Capital Research and Management Company or affiliate
Serves as a fixed-income portfolio manager for: Bond Fund — 10 years
Thomas H. Høgh Partner – Capital Fixed Income Investors Investment professional for 30 years in total; 27 years with Capital Research and Management Company or affiliate
Serves as a fixed-income portfolio manager for: Global Bond Fund — 11 years
Claudia P. Huntington Partner – Capital Research Global Investors Investment professional for 44 years in total; 42 years with Capital Research and Management Company or affiliate
Serves as an equity portfolio manager for: Global Small Capitalization Fund — 4 years Growth-Income Fund — 23 years (plus 5 years of prior experience as an investment analyst for the fund)
Michael T. Kerr Partner – Capital World Investors Investment professional for 34 years in total; 32 years with Capital Research and Management Company or affiliate
Serves as an equity portfolio manager for: Growth Fund — 12 years
Jonathan Knowles Partner – Capital World Investors Investment professional for 25 years, all with Capital Research and Management Company or affiliate
Serves as an equity portfolio manager for: Global Growth Fund — 4 years (plus 10 years of prior experience as an investment analyst for the fund)
Darcy Kopcho Partner – Capital International Investors Investment professional for 37 years in total; 29 years with Capital Research and Management Company or affiliate
Serves as an equity portfolio manager for: Capital Income Builder — 3 years
Lawrence Kymisis Partner – Capital Research Global Investors Investment professional for 22 years in total; 14 years with Capital Research and Management Company or affiliate
Serves as an equity portfolio manager for: Global Small Capitalization Fund — 5 years
Harold H. La Partner – Capital Research Global Investors Investment professional for 19 years in total; 18 years with Capital Research and Management Company or affiliate
Serves as an equity portfolio manager for: Global Small Capitalization Fund — 9 years (plus 4 years of prior experience as an investment analyst for the fund)
Jeffrey T. Lager Partner – Capital World Investors Investment professional for 22 years in total; 21 years with Capital Research and Management Company or affiliate
Serves as an equity portfolio manager for: Asset Allocation Fund — 10 years
James B. Lovelace Partner – Capital Research Global Investors Investment professional for 35 years, all with Capital Research and Management Company or affiliate
Serves as an equity portfolio manager for: Blue Chip Income and Growth Fund — 10 years
Jesper Lyckeus Partner – Capital Research Global Investors Investment professional for 22 years in total; 21 years with Capital Research and Management Company or affiliate
Serves as an equity portfolio manager for: International Fund — 10 years (plus 8 years of prior experience as an investment analyst for the fund) International Growth and Income Fund — 9 years
Fergus N. MacDonald Partner – Capital Fixed Income Investors Investment professional for 25 years in total; 14 years with Capital Research and Management Company or affiliate
Serves as a fixed-income portfolio manager for: Mortgage Fund — 6 years U.S. Government/AAA-Rated Securities Fund — 7 years
Ronald B. Morrow Partner – Capital World Investors Investment professional for 49 years in total; 20 years with Capital Research and Management Company or affiliate
Serves as an equity portfolio manager for: Growth Fund — 14 years (plus 5 years of prior experience as an investment analyst for the fund)
James R. Mulally Partner – Capital Fixed Income Investors Investment professional for 41 years in total; 37 years with Capital Research and Management Company or affiliate
Serves as a fixed-income portfolio manager for: Asset Allocation Fund — 11 years Ultra-Short Bond Fund — 1 year

American Funds Insurance Series / Prospectus 24
Portfolio manager for the Series/Title (if applicable)
Primary title with investment adviser (or affiliate) and investment experience
Portfolio manager’s role in management of, and experience in, the fund(s)
Robert H. Neithart Partner – Capital Fixed Income Investors Investment professional for 30 years, all with Capital Research and Management Company or affiliate
Serves as a fixed-income portfolio manager for: New World Fund — 5 years (plus 2 years of prior experience as an investment analyst for the fund) Global Balanced Fund — 6 years Global Bond Fund — 4 years
Aidan O’Connell Partner – Capital Research Global Investors Investment professional for 19 years in total; 13 years with Capital Research and Management Company or affiliate
Serves as an equity portfolio manager for: Global Small Capitalization Fund — 3 years (plus 9 years of prior experience as an investment analyst for the fund)
John R. Queen Vice President – Capital Fixed Income Investors Investment professional for 26 years in total; 14 years with Capital Research and Management Company or affiliate
Serves as a fixed-income portfolio manager for: Asset Allocation Fund — 1 year
Andraz Razen Partner – Capital World Investors Investment professional for 19 years in total; 13 years with Capital Research and Management Company or affiliate
Serves as an equity portfolio manager for: Growth Fund — 4 years (plus 3 years of prior experience as an investment analyst for the fund)
David M. Riley Partner – Capital Research Global Investors Investment professional for 23 years, all with Capital Research and Management Company or affiliate
Serves as an equity portfolio manager for: International Growth and Income Fund — 9 years
William L. Robbins Partner – Capital International Investors Investment professional for 25 years in total; 22 years with Capital Research and Management Company or affiliate
Serves as an equity portfolio manager for: Growth-Income Fund — 5 years (plus 12 years of prior experience as an investment analyst for the fund)
Martin Romo Partner – Capital World Investors Investment professional for 25 years in total; 24 years with Capital Research and Management Company or affiliate
Serves as an equity portfolio manager for: Growth Fund — 1 year (plus 15 years of prior experience as an investment analyst for the fund) Global Growth and Income Fund — 8 years (plus 1 year of prior experience as an investment analyst for the fund)
Andrew B. Suzman Partner – Capital World Investors Investment professional for 24 years, all with Capital Research and Management Company or affiliate
Serves as an equity portfolio manager for: Global Growth and Income Fund — 8 years
Tomonori Tani Partner – Capital World Investors Investment professional for 16 years in total; 13 years with Capital Research and Management Company or affiliate
Serves as an equity portfolio manager for: Global Balanced Fund — Less than 1 year
James Terrile Partner – Capital Research Global Investors Investment professional for 22 years in total; 21 years with Capital Research and Management Company or affiliate
Serves as an equity portfolio manager for: Blue Chip Income and Growth Fund — 5 years
Christopher Thomsen Partner – Capital Research Global Investors Investment professional for 20 years, all with Capital Research and Management Company or affiliate
Serves as an equity portfolio manager for: International Fund — 11 years
Ritchie Tuazon Vice President – Capital Fixed Income Investors Investment professional for 17 years in total; 6 years with Capital Research and Management Company or affiliate
Serves as a fixed-income portfolio manager for: U.S. Government/AAA-Rated Securities Fund — 2 years
Gregory W. Wendt Partner – Capital Research Global Investors Investment professional for 30 years, all with Capital Research and Management Company or affiliate
Serves as an equity portfolio manager for: Global Small Capitalization Fund — 5 years (plus 14 years of prior experience as an investment analyst for the fund)
Alan J. Wilson Partner – Capital World Investors Investment professional for 32 years in total; 26 years with Capital Research and Management Company or affiliate
Serves as an equity portfolio manager for: Growth Fund — 3 years
Philip Winston Partner – Capital International Investors Investment professional for 32 years in total; 20 years with Capital Research and Management Company or affiliate
Serves as an equity portfolio manager for: Capital Income Builder — 3 years
Information regarding the portfolio managers’ compensation, their ownership of securities in the Series and other accounts they manage is in the statement of additional information.

25 American Funds Insurance Series / Prospectus
Purchases and redemptions of shares Shares of the Series are currently offered only to insurance company separate accounts as well as so-called “feeder funds” under master-feeder arrangements sponsored by insurance companies as underlying investments for such insurance companies’ variable annuity contracts and variable life insurance policies. All such shares may be purchased or redeemed by the insurance company separate accounts (or feeder funds) at net asset value without any sales or redemption charges. These purchases and redemptions are made at the price next determined after such purchases and redemptions of units of the separate accounts (or feeder funds).
Frequent trading of fund shares The Series and American Funds Distributors, Inc., the Series’ distributor, reserve the right to reject any purchase order for any reason. The funds are not designed to serve as vehicles for frequent trading. Frequent trading of fund shares may lead to increased costs to the funds and less efficient management of the funds’ portfolios, potentially resulting in dilution of the value of the shares held by long-term shareholders. Accordingly, purchases, including those that are part of exchange activity, that the Series or American Funds Distributors has determined could involve actual or potential harm to a fund may be rejected.
The Series, through its transfer agent, American Funds Service Company, has agreements with the Series’ insurance relationships to maintain its surveillance procedures that are designed to detect frequent trading in fund shares. The agreements generally require the insurance companies to (i) provide, upon request from a fund, the Series or their agent, certain identifying and account information regarding contract owners who invest in fund shares through an insurance company account and (ii) execute instructions from a fund, the Series or their agent to restrict further purchases or exchanges of fund shares by a contract owner who the Series has identified as having engaged in potentially harmful market timing or frequent trading. Under these procedures, various analytics are used to evaluate factors that may be indicative of frequent trading. For example, transactions in fund shares that exceed certain monetary thresholds may be scrutinized. American Funds Service Company may work with the insurance company separate accounts or feeder funds to apply their procedures that American Funds Service Company believes are reasonably designed to enforce the frequent trading policies of the Series. You should refer to disclosures provided by the insurance company with which you have a contract to determine the specific trading restrictions that apply to you.
Under its procedures, American Funds Service Company also may review transactions that occur close in time to other transactions in the same account or in multiple accounts under common ownership or influence. Trading activity that is identified through these procedures or as a result of any other information available to the funds will be evaluated to determine whether such activity might constitute frequent trading. These procedures may be modified from time to time as appropriate to improve the detection of frequent trading, to facilitate monitoring for frequent trading in particular retirement plans or other accounts and to comply with applicable laws.
In addition to the Series’ broad ability to restrict potentially harmful trading as described previously, the Series’ board of trustees has adopted a “purchase blocking policy” under which any contract owner redeeming units representing a beneficial interest in any fund other than Ultra-Short Bond Fund (including redemptions that are part of an exchange transaction) having a value of $5,000 or more will be precluded from investing units of beneficial interest in that fund (including investments that are part of an exchange transaction) for 30 calendar days after the redemption transaction. Under this purchase blocking policy, certain purchases will not be prevented and certain redemptions will not trigger a purchase block, such as:
• purchases and redemptions of units representing a beneficial interest in a fund having a value of less than $5,000;
• retirement plan contributions, loans and distributions (including hardship withdrawals) identified as such on the retirement plan recordkeeper’s system;
• purchase transactions involving in-kind transfers of fund shares, if the entity maintaining the contract owner’s account is able to identify the transaction as one of these types of transactions; and
• systematic redemptions and purchases if the entity maintaining the contract owner’s account is able to identify the transaction as a systematic redemption or purchase.
Generally, purchases and redemptions will not be considered “systematic” unless the transaction is prescheduled for a specific date.
The Series reserves the right to waive the purchase blocking policy if American Funds Service Company determines that its surveillance procedures are adequate to detect frequent trading in fund shares in such accounts.
If American Funds Service Company identifies any activity that may constitute frequent trading, it reserves the right to contact the insurance company separate account or feeder fund and request that the separate account or feeder fund either provide information regarding an account owner’s transactions or restrict the account owner’s trading. If American Funds Service Company is not satisfied that insurance company separate account or feeder fund has taken appropriate action, American Funds Service Company may terminate the separate account’s or feeder fund’s ability to transact in fund shares.
There is no guarantee that all instances of frequent trading in fund shares will be prevented.
Notwithstanding the Series’ surveillance procedures and purchase blocking policy described above, all transactions in fund shares remain subject to the right of the Series, American Funds Distributors and American Funds Service Company to restrict potentially abusive trading generally (including the types of transactions described above that will not be prevented or trigger a block under the purchase blocking policy). See the statement of additional information for more information about how American Funds Service Company may address other potentially abusive trading activity in the Series.

American Funds Insurance Series / Prospectus 26
Valuing shares The net asset value of each share class of a fund is the value of a single share of that class. Each fund calculates the net asset value each day the New York Stock Exchange is open for trading as of approximately 4 p.m. New York time, the normal close of regular trading. If, for example, the New York Stock Exchange closes at 1 p.m. New York time, the funds’ net asset values would still be determined as of 4 p.m. New York time. In this example, portfolio securities traded on the New York Stock Exchange would be valued at their closing prices unless the investment adviser determines that a “fair value” adjustment is appropriate due to subsequent events.
Equity securities are valued primarily on the basis of market quotations, and debt securities are valued primarily on the basis of prices from third-party pricing services. Futures contracts are valued primarily on the basis of settlement prices. The funds have adopted procedures for making fair value determinations if market quotations or prices from third-party pricing services, as applicable, are not readily available or are not considered reliable. For example, if events occur between the close of markets outside the United States and the close of regular trading on the New York Stock Exchange that, in the opinion of the investment adviser, materially affect the value of any of the funds’ equity securities that trade principally in those international markets, those securities will be valued in accordance with fair value procedures. Similarly, fair value procedures may be employed if an issuer defaults on its debt securities and there is no market for its securities. Use of these procedures is intended to result in more appropriate net asset values and, where applicable, to reduce potential arbitrage opportunities otherwise available to short-term investors.
Because certain of the funds may hold securities that are listed primarily on foreign exchanges that trade on weekends or days when the funds do not price their shares, the values of securities held in the funds may change on days when you will not be able to purchase or redeem fund shares.
Shares of the funds will be purchased or sold at the net asset value next determined after receipt of requests from the appropriate insurance company. Requests received by the appropriate insurance company prior to 4 p.m. New York time and communicated by the insurance company to the Series or its agent will be purchased or sold at that day’s net asset value.
27 American Funds Insurance Series / Prospectus
Plan of distribution The Series has not adopted (and does not presently intend to adopt) a plan of distribution or “12b-1 plan” for Class 1 shares.
Fund expenses In periods of market volatility, assets of the funds may decline significantly, causing total annual fund operating expenses (as a percentage of the value of your investment) to become higher than the numbers shown in the Annual Fund Operating Expenses tables in this prospectus.
The “Other expenses” items in the Annual Fund Operating Expenses tables in this prospectus are based on expenses as of each fund’s most recently completed fiscal year. These items include third-party expenses, such as custodial, legal, audit, accounting, regulatory reporting and pricing vendor services, and an administrative services fee payable to the Series’ investment adviser for administrative services provided by the Series’ investment adviser and its affiliates.
Investment results All fund results in the “Investment results” section of this prospectus reflect the reinvestment of dividends and capital gains distributions, if any. Unless otherwise noted, fund results reflect any fee waivers and/or expense reimbursements in effect during the period presented.
Distributions and taxes Each fund of the Series intends to qualify as a “regulated investment company” under the Internal Revenue Code. In any fiscal year in which a fund so qualifies and distributes to shareholders its investment company taxable income and net realized capital gain, the fund itself is relieved of federal income tax.
It is the Series’ policy to distribute to the shareholders (the insurance company separate accounts) all of its investment company taxable income and capital gain for each fiscal year.
See the applicable contract prospectus for information regarding the federal income tax treatment of the contracts and distributions to the separate accounts.
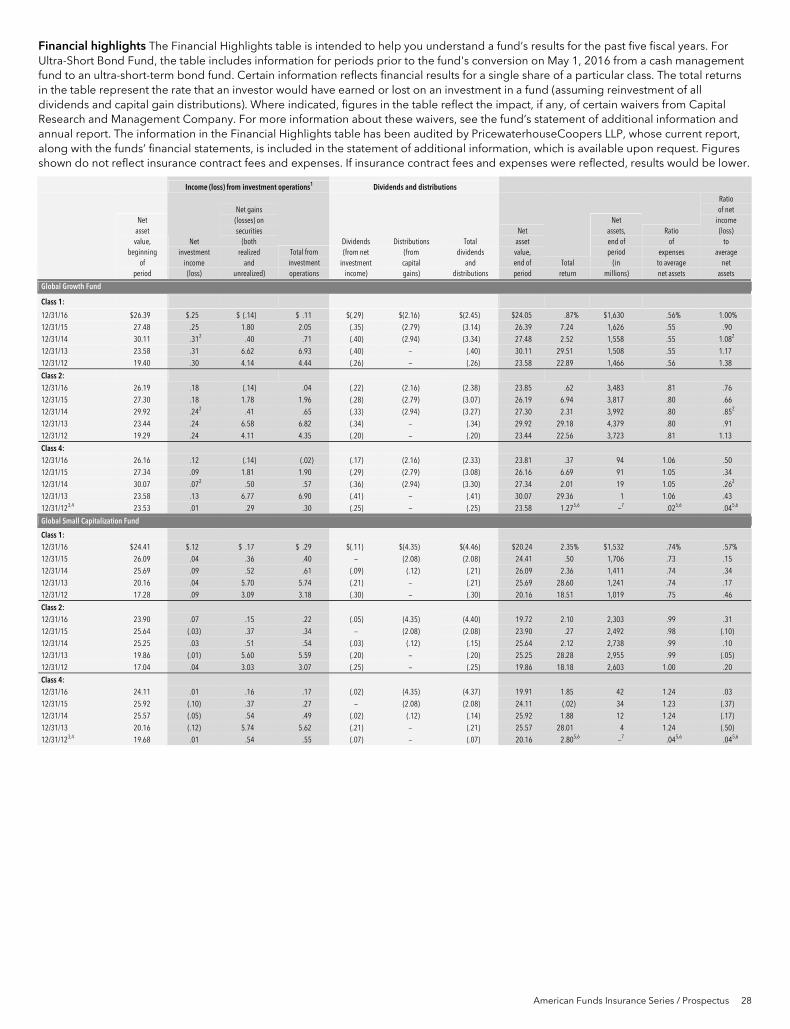
American Funds Insurance Series / Prospectus 28
Financial highlights The Financial Highlights table is intended to help you understand a fund’s results for the past five fiscal years. For Ultra-Short Bond Fund, the table includes information for periods prior to the fund's conversion on May 1, 2016 from a cash management fund to an ultra-short-term bond fund. Certain information reflects financial results for a single share of a particular class. The total returns in the table represent the rate that an investor would have earned or lost on an investment in a fund (assuming reinvestment of all dividends and capital gain distributions). Where indicated, figures in the table reflect the impact, if any, of certain waivers from Capital Research and Management Company. For more information about these waivers, see the fund’s statement of additional information and annual report. The information in the Financial Highlights table has been audited by PricewaterhouseCoopers LLP, whose current report, along with the funds’ financial statements, is included in the statement of additional information, which is available upon request. Figures shown do not reflect insurance contract fees and expenses. If insurance contract fees and expenses were reflected, results would be lower.
Income (loss) from investment operations1 Dividends and distributions
Net asset value,
beginning of
period
Net investment
income (loss)
Net gains (losses) on securities
(both realized
and unrealized)
Total from investment operations
Dividends (from net
investment income)
Distributions (from capital gains)
Total dividends
and distributions
Net asset value, end of period
Total return
Net assets, end of period
(in millions)
Ratio of
expenses to average net assets
Ratio of net
income (loss)
to average
net assets
Global Growth Fund
Class 1:
12/31/16 $26.39 $.25 $ (.14) $ .11 $(.29) $(2.16) $(2.45) $24.05 .87% $1,630 .56% 1.00% 12/31/15 27.48 .25 1.80 2.05 (.35) (2.79) (3.14) 26.39 7.24 1,626 .55 .90 12/31/14 30.11 .312 .40 .71 (.40) (2.94) (3.34) 27.48 2.52 1,558 .55 1.082 12/31/13 23.58 .31 6.62 6.93 (.40) — (.40) 30.11 29.51 1,508 .55 1.17 12/31/12 19.40 .30 4.14 4.44 (.26) — (.26) 23.58 22.89 1,466 .56 1.38
Class 2:
12/31/16 26.19 .18 (.14) .04 (.22) (2.16) (2.38) 23.85 .62 3,483 .81 .76 12/31/15 27.30 .18 1.78 1.96 (.28) (2.79) (3.07) 26.19 6.94 3,817 .80 .66 12/31/14 29.92 .242 .41 .65 (.33) (2.94) (3.27) 27.30 2.31 3,992 .80 .852 12/31/13 23.44 .24 6.58 6.82 (.34) — (.34) 29.92 29.18 4,379 .80 .91 12/31/12 19.29 .24 4.11 4.35 (.20) — (.20) 23.44 22.56 3,723 .81 1.13
Class 4: 12/31/16 26.16 .12 (.14) (.02) (.17) (2.16) (2.33) 23.81 .37 94 1.06 .50 12/31/15 27.34 .09 1.81 1.90 (.29) (2.79) (3.08) 26.16 6.69 91 1.05 .34 12/31/14 30.07 .072 .50 .57 (.36) (2.94) (3.30) 27.34 2.01 19 1.05 .262 12/31/13 23.58 .13 6.77 6.90 (.41) — (.41) 30.07 29.36 1 1.06 .43 12/31/123,4 23.53 .01 .29 .30 (.25) — (.25) 23.58 1.275,6 —7 .025,6 .045,6
Global Small Capitalization Fund
Class 1: 12/31/16 $24.41 $.12 $ .17 $ .29 $(.11) $(4.35) $(4.46) $20.24 2.35% $1,532 .74% .57% 12/31/15 26.09 .04 .36 .40 — (2.08) (2.08) 24.41 .50 1,706 .73 .15 12/31/14 25.69 .09 .52 .61 (.09) (.12) (.21) 26.09 2.36 1,411 .74 .34 12/31/13 20.16 .04 5.70 5.74 (.21) — (.21) 25.69 28.60 1,241 .74 .17 12/31/12 17.28 .09 3.09 3.18 (.30) — (.30) 20.16 18.51 1,019 .75 .46
Class 2: 12/31/16 23.90 .07 .15 .22 (.05) (4.35) (4.40) 19.72 2.10 2,303 .99 .31 12/31/15 25.64 (.03) .37 .34 — (2.08) (2.08) 23.90 .27 2,492 .98 (.10) 12/31/14 25.25 .03 .51 .54 (.03) (.12) (.15) 25.64 2.12 2,738 .99 .10 12/31/13 19.86 (.01) 5.60 5.59 (.20) — (.20) 25.25 28.28 2,955 .99 (.05) 12/31/12 17.04 .04 3.03 3.07 (.25) — (.25) 19.86 18.18 2,603 1.00 .20
Class 4: 12/31/16 24.11 .01 .16 .17 (.02) (4.35) (4.37) 19.91 1.85 42 1.24 .03 12/31/15 25.92 (.10) .37 .27 — (2.08) (2.08) 24.11 (.02) 34 1.23 (.37) 12/31/14 25.57 (.05) .54 .49 (.02) (.12) (.14) 25.92 1.88 12 1.24 (.17) 12/31/13 20.16 (.12) 5.74 5.62 (.21) — (.21) 25.57 28.01 4 1.24 (.50) 12/31/123,4 19.68 .01 .54 .55 (.07) — (.07) 20.16 2.805,6 —7 .045,6 .045,6
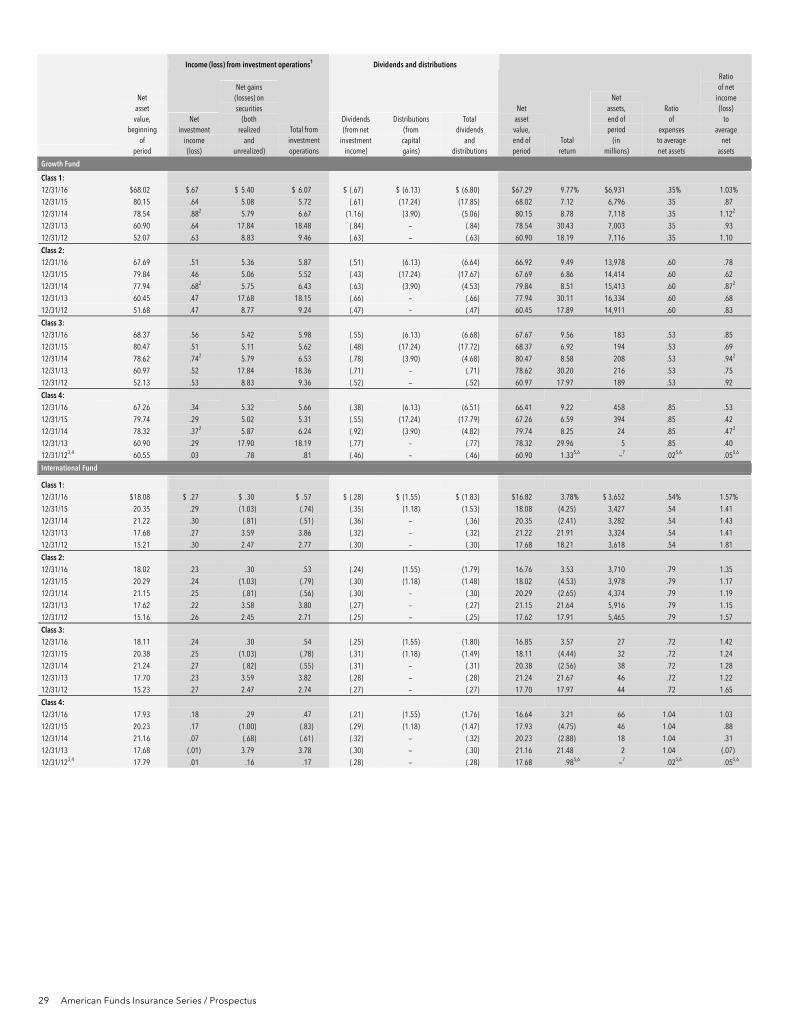
29 American Funds Insurance Series / Prospectus
Income (loss) from investment operations1 Dividends and distributions
Net asset value,
beginning of
period
Net investment
income (loss)
Net gains (losses) on securities
(both realized
and unrealized)
Total from investment operations
Dividends (from net
investment income)
Distributions (from capital gains)
Total dividends
and distributions
Net asset value, end of period
Total return
Net assets, end of period
(in millions)
Ratio of
expenses to average net assets
Ratio of net
income (loss)
to average
net assets
Growth Fund
Class 1: 12/31/16 $68.02 $.67 $ 5.40 $ 6.07 $ (.67) $ (6.13) $ (6.80) $67.29 9.77% $6,931 .35% 1.03% 12/31/15 80.15 .64 5.08 5.72 (.61) (17.24) (17.85) 68.02 7.12 6,796 .35 .87 12/31/14 78.54 .882 5.79 6.67 (1.16) (3.90) (5.06) 80.15 8.78 7,118 .35 1.122 12/31/13 60.90 .64 17.84 18.48 (.84) — (.84) 78.54 30.43 7,003 .35 .93 12/31/12 52.07 .63 8.83 9.46 (.63) — (.63) 60.90 18.19 7,116 .35 1.10
Class 2: 12/31/16 67.69 .51 5.36 5.87 (.51) (6.13) (6.64) 66.92 9.49 13,978 .60 .78 12/31/15 79.84 .46 5.06 5.52 (.43) (17.24) (17.67) 67.69 6.86 14,414 .60 .62 12/31/14 77.94 .682 5.75 6.43 (.63) (3.90) (4.53) 79.84 8.51 15,413 .60 .872 12/31/13 60.45 .47 17.68 18.15 (.66) — (.66) 77.94 30.11 16,334 .60 .68 12/31/12 51.68 .47 8.77 9.24 (.47) — (.47) 60.45 17.89 14,911 .60 .83
Class 3: 12/31/16 68.37 .56 5.42 5.98 (.55) (6.13) (6.68) 67.67 9.56 183 .53 .85 12/31/15 80.47 .51 5.11 5.62 (.48) (17.24) (17.72) 68.37 6.92 194 .53 .69 12/31/14 78.62 .742 5.79 6.53 (.78) (3.90) (4.68) 80.47 8.58 208 .53 .942 12/31/13 60.97 .52 17.84 18.36 (.71) — (.71) 78.62 30.20 216 .53 .75 12/31/12 52.13 .53 8.83 9.36 (.52) — (.52) 60.97 17.97 189 .53 .92
Class 4:
12/31/16 67.26 .34 5.32 5.66 (.38) (6.13) (6.51) 66.41 9.22 458 .85 .53 12/31/15 79.74 .29 5.02 5.31 (.55) (17.24) (17.79) 67.26 6.59 394 .85 .42 12/31/14 78.32 .372 5.87 6.24 (.92) (3.90) (4.82) 79.74 8.25 24 .85 .472 12/31/13 60.90 .29 17.90 18.19 (.77) — (.77) 78.32 29.96 5 .85 .40 12/31/123,4 60.55 .03 .78 .81 (.46) — (.46) 60.90 1.335,6 —7 .025,6 .055,6
International Fund
Class 1: 12/31/16 $18.08 $ .27 $ .30 $ .57 $ (.28) $ (1.55) $ (1.83) $16.82 3.78% $ 3,652 .54% 1.57% 12/31/15 20.35 .29 (1.03) (.74) (.35) (1.18) (1.53) 18.08 (4.25) 3,427 .54 1.41 12/31/14 21.22 .30 (.81) (.51) (.36) — (.36) 20.35 (2.41) 3,282 .54 1.43 12/31/13 17.68 .27 3.59 3.86 (.32) — (.32) 21.22 21.91 3,324 .54 1.41 12/31/12 15.21 .30 2.47 2.77 (.30) — (.30) 17.68 18.21 3,618 .54 1.81
Class 2: 12/31/16 18.02 .23 .30 .53 (.24) (1.55) (1.79) 16.76 3.53 3,710 .79 1.35 12/31/15 20.29 .24 (1.03) (.79) (.30) (1.18) (1.48) 18.02 (4.53) 3,978 .79 1.17 12/31/14 21.15 .25 (.81) (.56) (.30) — (.30) 20.29 (2.65) 4,374 .79 1.19 12/31/13 17.62 .22 3.58 3.80 (.27) — (.27) 21.15 21.64 5,916 .79 1.15 12/31/12 15.16 .26 2.45 2.71 (.25) — (.25) 17.62 17.91 5,465 .79 1.57
Class 3: 12/31/16 18.11 .24 .30 .54 (.25) (1.55) (1.80) 16.85 3.57 27 .72 1.42 12/31/15 20.38 .25 (1.03) (.78) (.31) (1.18) (1.49) 18.11 (4.44) 32 .72 1.24 12/31/14 21.24 .27 (.82) (.55) (.31) — (.31) 20.38 (2.56) 38 .72 1.28 12/31/13 17.70 .23 3.59 3.82 (.28) — (.28) 21.24 21.67 46 .72 1.22 12/31/12 15.23 .27 2.47 2.74 (.27) — (.27) 17.70 17.97 44 .72 1.65
Class 4:
12/31/16 17.93 .18 .29 .47 (.21) (1.55) (1.76) 16.64 3.21 66 1.04 1.03 12/31/15 20.23 .17 (1.00) (.83) (.29) (1.18) (1.47) 17.93 (4.75) 46 1.04 .88 12/31/14 21.16 .07 (.68) (.61) (.32) — (.32) 20.23 (2.88) 18 1.04 .31 12/31/13 17.68 (.01) 3.79 3.78 (.30) — (.30) 21.16 21.48 2 1.04 (.07) 12/31/123,4 17.79 .01 .16 .17 (.28) — (.28) 17.68 .985,6 —7 .025,6 .055,6
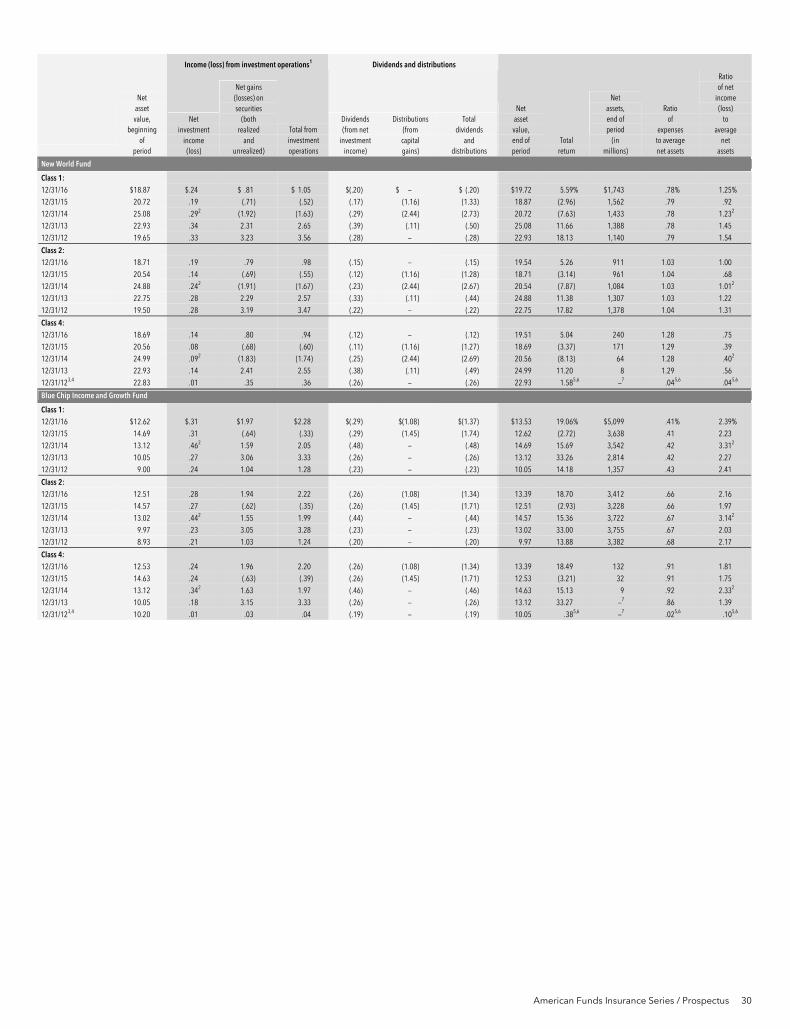
American Funds Insurance Series / Prospectus 30
Income (loss) from investment operations1 Dividends and distributions
Net asset value,
beginning of
period
Net investment
income (loss)
Net gains (losses) on securities
(both realized
and unrealized)
Total from investment operations
Dividends (from net
investment income)
Distributions (from capital gains)
Total dividends
and distributions
Net asset value, end of period
Total return
Net assets, end of period
(in millions)
Ratio of
expenses to average net assets
Ratio of net
income (loss)
to average
net assets
New World Fund
Class 1: 12/31/16 $18.87 $.24 $ .81 $ 1.05 $(.20) $ — $ (.20) $19.72 5.59% $1,743 .78% 1.25% 12/31/15 20.72 .19 (.71) (.52) (.17) (1.16) (1.33) 18.87 (2.96) 1,562 .79 .92 12/31/14 25.08 .292 (1.92) (1.63) (.29) (2.44) (2.73) 20.72 (7.63) 1,433 .78 1.232 12/31/13 22.93 .34 2.31 2.65 (.39) (.11) (.50) 25.08 11.66 1,388 .78 1.45 12/31/12 19.65 .33 3.23 3.56 (.28) — (.28) 22.93 18.13 1,140 .79 1.54
Class 2: 12/31/16 18.71 .19 .79 .98 (.15) — (.15) 19.54 5.26 911 1.03 1.00 12/31/15 20.54 .14 (.69) (.55) (.12) (1.16) (1.28) 18.71 (3.14) 961 1.04 .68 12/31/14 24.88 .242 (1.91) (1.67) (.23) (2.44) (2.67) 20.54 (7.87) 1,084 1.03 1.012 12/31/13 22.75 .28 2.29 2.57 (.33) (.11) (.44) 24.88 11.38 1,307 1.03 1.22 12/31/12 19.50 .28 3.19 3.47 (.22) — (.22) 22.75 17.82 1,378 1.04 1.31
Class 4: 12/31/16 18.69 .14 .80 .94 (.12) — (.12) 19.51 5.04 240 1.28 .75 12/31/15 20.56 .08 (.68) (.60) (.11) (1.16) (1.27) 18.69 (3.37) 171 1.29 .39 12/31/14 24.99 .092 (1.83) (1.74) (.25) (2.44) (2.69) 20.56 (8.13) 64 1.28 .402 12/31/13 22.93 .14 2.41 2.55 (.38) (.11) (.49) 24.99 11.20 8 1.29 .56 12/31/123,4 22.83 .01 .35 .36 (.26) — (.26) 22.93 1.585,6 —7 .045,6 .045,6
Blue Chip Income and Growth Fund
Class 1: 12/31/16 $12.62 $.31 $1.97 $2.28 $(.29) $(1.08) $(1.37) $13.53 19.06% $5,099 .41% 2.39% 12/31/15 14.69 .31 (.64) (.33) (.29) (1.45) (1.74) 12.62 (2.72) 3,638 .41 2.23 12/31/14 13.12 .462 1.59 2.05 (.48) — (.48) 14.69 15.69 3,542 .42 3.312 12/31/13 10.05 .27 3.06 3.33 (.26) — (.26) 13.12 33.26 2,814 .42 2.27 12/31/12 9.00 .24 1.04 1.28 (.23) — (.23) 10.05 14.18 1,357 .43 2.41
Class 2: 12/31/16 12.51 .28 1.94 2.22 (.26) (1.08) (1.34) 13.39 18.70 3,412 .66 2.16 12/31/15 14.57 .27 (.62) (.35) (.26) (1.45) (1.71) 12.51 (2.93) 3,228 .66 1.97 12/31/14 13.02 .442 1.55 1.99 (.44) — (.44) 14.57 15.36 3,722 .67 3.142 12/31/13 9.97 .23 3.05 3.28 (.23) — (.23) 13.02 33.00 3,755 .67 2.03 12/31/12 8.93 .21 1.03 1.24 (.20) — (.20) 9.97 13.88 3,382 .68 2.17
Class 4: 12/31/16 12.53 .24 1.96 2.20 (.26) (1.08) (1.34) 13.39 18.49 132 .91 1.81 12/31/15 14.63 .24 (.63) (.39) (.26) (1.45) (1.71) 12.53 (3.21) 32 .91 1.75 12/31/14 13.12 .342 1.63 1.97 (.46) — (.46) 14.63 15.13 9 .92 2.332 12/31/13 10.05 .18 3.15 3.33 (.26) — (.26) 13.12 33.27 —7 .86 1.39 12/31/123,4 10.20 .01 .03 .04 (.19) — (.19) 10.05 .385,6 —7 .025,6 .105,6

31 American Funds Insurance Series / Prospectus
Income (loss) from investment operations1 Dividends and distributions
Net asset value,
beginning of
period
Net investment
income (loss)
Net gains (losses) on securities
(both realized
and unrealized)
Total from investment operations
Dividends (from net
investment income)
Distributions (from capital gains)
Total dividends
and distributions
Net asset value, end of period
Total return
Net assets, end of period
(in millions)
Ratio of
expenses to average net assets
Ratio of net
income (loss)
to average
net assets
Global Growth and Income Fund
Class 1: 12/31/16 $12.35 $.28 $ .66 $ .94 $(.27) $ — $(.27) $13.02 7.61% $ 571 .63% 2.18% 12/31/15 12.78 .368 (.50)8 (.14) (.29) — (.29) 12.35 (1.14) 293 .64 2.798 12/31/14 12.53 .432 .31 .74 (.49) — (.49) 12.78 6.00 200 .63 3.342 12/31/13 10.56 .39 2.00 2.39 (.42) — (.42) 12.53 22.81 206 .62 3.35 12/31/12 9.20 .25 1.39 1.64 (.28) — (.28) 10.56 17.93 180 .62 2.56
Class 2: 12/31/16 12.33 .25 .65 .90 (.23) — (.23) 13.00 7.34 1,405 .88 1.98 12/31/15 12.75 .228 (.39)8 (.17) (.25) — (.25) 12.33 (1.34) 1,479 .89 1.738 12/31/14 12.51 .412 .29 .70 (.46) — (.46) 12.75 5.64 1,685 .88 3.222 12/31/13 10.54 .36 2.00 2.36 (.39) — (.39) 12.51 22.54 1,822 .87 3.09 12/31/12 9.19 .23 1.38 1.61 (.26) — (.26) 10.54 17.56 1,837 .87 2.31
Class 4: 12/31/16 12.26 .21 .65 .86 (.23) — (.23) 12.89 7.04 16 1.13 1.63 12/31/15 12.71 .178 (.37)8 (.20) (.25) — (.25) 12.26 (1.60) 5 1.14 1.328 12/31/14 12.50 .302 .37 .67 (.46) — (.46) 12.71 5.41 1 1.13 2.302 12/31/13 10.55 .28 2.09 2.37 (.42) — (.42) 12.50 22.60 1 1.12 2.27 12/31/123,4 10.64 .01 .13 .14 (.23) — (.23) 10.55 1.275,6 —7 .035,6 .085,6
Growth-Income Fund
Class 1: 12/31/16 $45.40 $.79 $ 4.09 $ 4.88 $(.75) $(5.12) $(5.87) $44.41 11.80% $12,588 .29% 1.79% 12/31/15 52.76 .79 .37 1.16 (.75) (7.77) (8.52) 45.40 1.72 10,747 .29 1.59 12/31/14 50.72 .81 4.57 5.38 (.80) (2.54) (3.34) 52.76 10.91 10,812 .29 1.56 12/31/13 38.48 .66 12.31 12.97 (.73) — (.73) 50.72 33.82 9,857 .29 1.49 12/31/12 33.27 .66 5.25 5.91 (.70) — (.70) 38.48 17.79 9,782 .29 1.79
Class 2: 12/31/16 45.04 .67 4.05 4.72 (.64) (5.12) (5.76) 44.00 11.51 12,854 .54 1.54 12/31/15 52.41 .66 .37 1.03 (.63) (7.77) (8.40) 45.04 1.45 12,895 .54 1.34 12/31/14 50.40 .67 4.55 5.22 (.67) (2.54) (3.21) 52.41 10.63 14,337 .54 1.31 12/31/13 38.24 .55 12.23 12.78 (.62) — (.62) 50.40 33.50 14,980 .54 1.25 12/31/12 33.07 .56 5.22 5.78 (.61) — (.61) 38.24 17.48 13,403 .54 1.53
Class 3: 12/31/16 45.46 .71 4.09 4.80 (.67) (5.12) (5.79) 44.47 11.59 156 .47 1.61 12/31/15 52.82 .70 .37 1.07 (.66) (7.77) (8.43) 45.46 1.53 161 .47 1.41 12/31/14 50.77 .71 4.59 5.30 (.71) (2.54) (3.25) 52.82 10.71 185 .47 1.38 12/31/13 38.52 .58 12.32 12.90 (.65) — (.65) 50.77 33.58 193 .47 1.32 12/31/12 33.30 .59 5.26 5.85 (.63) — (.63) 38.52 17.59 168 .47 1.60
Class 4: 12/31/16 44.82 .56 4.02 4.58 (.55) (5.12) (5.67) 43.73 11.25 495 .79 1.29 12/31/15 52.39 .58 .33 .91 (.71) (7.77) (8.48) 44.82 1.21 410 .79 1.25 12/31/14 50.56 .58 4.51 5.09 (.72) (2.54) (3.26) 52.39 10.34 30 .79 1.11 12/31/13 38.47 .45 12.33 12.78 (.69) — (.69) 50.56 33.32 3 .79 .96 12/31/123,4 38.65 .01 .39 .40 (.58) — (.58) 38.47 1.025,6 —7 .015,6 .035,6
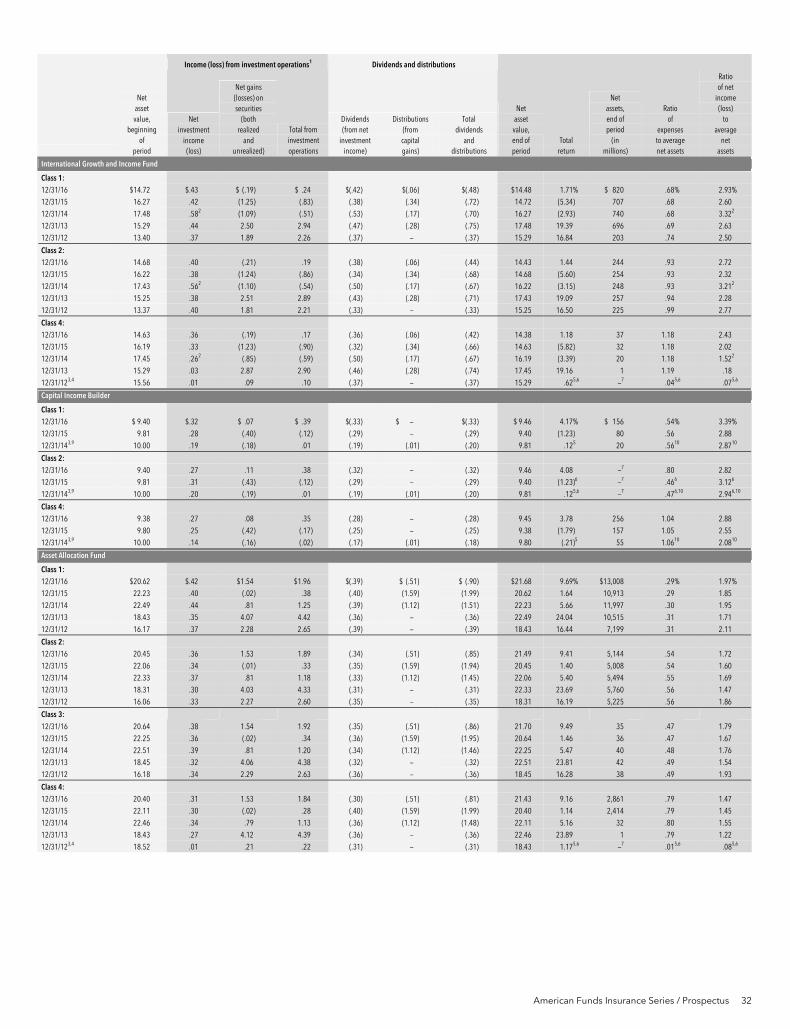
American Funds Insurance Series / Prospectus 32
Income (loss) from investment operations1 Dividends and distributions
Net asset value,
beginning of
period
Net investment
income (loss)
Net gains (losses) on securities
(both realized
and unrealized)
Total from investment operations
Dividends (from net
investment income)
Distributions (from capital gains)
Total dividends
and distributions
Net asset value, end of period
Total return
Net assets, end of period
(in millions)
Ratio of
expenses to average net assets
Ratio of net
income (loss)
to average
net assets
International Growth and Income Fund
Class 1: 12/31/16 $14.72 $.43 $ (.19) $ .24 $(.42) $(.06) $(.48) $14.48 1.71% $ 820 .68% 2.93% 12/31/15 16.27 .42 (1.25) (.83) (.38) (.34) (.72) 14.72 (5.34) 707 .68 2.60 12/31/14 17.48 .582 (1.09) (.51) (.53) (.17) (.70) 16.27 (2.93) 740 .68 3.322 12/31/13 15.29 .44 2.50 2.94 (.47) (.28) (.75) 17.48 19.39 696 .69 2.63 12/31/12 13.40 .37 1.89 2.26 (.37) — (.37) 15.29 16.84 203 .74 2.50
Class 2: 12/31/16 14.68 .40 (.21) .19 (.38) (.06) (.44) 14.43 1.44 244 .93 2.72 12/31/15 16.22 .38 (1.24) (.86) (.34) (.34) (.68) 14.68 (5.60) 254 .93 2.32 12/31/14 17.43 .562 (1.10) (.54) (.50) (.17) (.67) 16.22 (3.15) 248 .93 3.212 12/31/13 15.25 .38 2.51 2.89 (.43) (.28) (.71) 17.43 19.09 257 .94 2.28 12/31/12 13.37 .40 1.81 2.21 (.33) — (.33) 15.25 16.50 225 .99 2.77
Class 4: 12/31/16 14.63 .36 (.19) .17 (.36) (.06) (.42) 14.38 1.18 37 1.18 2.43 12/31/15 16.19 .33 (1.23) (.90) (.32) (.34) (.66) 14.63 (5.82) 32 1.18 2.02 12/31/14 17.45 .262 (.85) (.59) (.50) (.17) (.67) 16.19 (3.39) 20 1.18 1.522 12/31/13 15.29 .03 2.87 2.90 (.46) (.28) (.74) 17.45 19.16 1 1.19 .18 12/31/123,4 15.56 .01 .09 .10 (.37) — (.37) 15.29 .625,6 —7 .045,6 .075,6
Capital Income Builder
Class 1: 12/31/16 $ 9.40 $.32 $ .07 $ .39 $(.33) $ — $(.33) $ 9.46 4.17% $ 156 .54% 3.39% 12/31/15 9.81 .28 (.40) (.12) (.29) — (.29) 9.40 (1.23) 80 .56 2.88 12/31/143,9 10.00 .19 (.18) .01 (.19) (.01) (.20) 9.81 .125 20 .5610 2.8710
Class 2: 12/31/16 9.40 .27 .11 .38 (.32) — (.32) 9.46 4.08 —7 .80 2.82 12/31/15 9.81 .31 (.43) (.12) (.29) — (.29) 9.40 (1.23)6 —7 .466 3.126 12/31/143,9 10.00 .20 (.19) .01 (.19) (.01) (.20) 9.81 .125,6 —7 .476,10 2.946,10
Class 4: 12/31/16 9.38 .27 .08 .35 (.28) — (.28) 9.45 3.78 256 1.04 2.88 12/31/15 9.80 .25 (.42) (.17) (.25) — (.25) 9.38 (1.79) 157 1.05 2.55 12/31/143,9 10.00 .14 (.16) (.02) (.17) (.01) (.18) 9.80 (.21)5 55 1.0610 2.0810
Asset Allocation Fund
Class 1: 12/31/16 $20.62 $.42 $1.54 $1.96 $(.39) $ (.51) $ (.90) $21.68 9.69% $13,008 .29% 1.97% 12/31/15 22.23 .40 (.02) .38 (.40) (1.59) (1.99) 20.62 1.64 10,913 .29 1.85 12/31/14 22.49 .44 .81 1.25 (.39) (1.12) (1.51) 22.23 5.66 11,997 .30 1.95 12/31/13 18.43 .35 4.07 4.42 (.36) — (.36) 22.49 24.04 10,515 .31 1.71 12/31/12 16.17 .37 2.28 2.65 (.39) — (.39) 18.43 16.44 7,199 .31 2.11
Class 2: 12/31/16 20.45 .36 1.53 1.89 (.34) (.51) (.85) 21.49 9.41 5,144 .54 1.72 12/31/15 22.06 .34 (.01) .33 (.35) (1.59) (1.94) 20.45 1.40 5,008 .54 1.60 12/31/14 22.33 .37 .81 1.18 (.33) (1.12) (1.45) 22.06 5.40 5,494 .55 1.69 12/31/13 18.31 .30 4.03 4.33 (.31) — (.31) 22.33 23.69 5,760 .56 1.47 12/31/12 16.06 .33 2.27 2.60 (.35) — (.35) 18.31 16.19 5,225 .56 1.86
Class 3:
12/31/16 20.64 .38 1.54 1.92 (.35) (.51) (.86) 21.70 9.49 35 .47 1.79 12/31/15 22.25 .36 (.02) .34 (.36) (1.59) (1.95) 20.64 1.46 36 .47 1.67 12/31/14 22.51 .39 .81 1.20 (.34) (1.12) (1.46) 22.25 5.47 40 .48 1.76 12/31/13 18.45 .32 4.06 4.38 (.32) — (.32) 22.51 23.81 42 .49 1.54 12/31/12 16.18 .34 2.29 2.63 (.36) — (.36) 18.45 16.28 38 .49 1.93
Class 4: 12/31/16 20.40 .31 1.53 1.84 (.30) (.51) (.81) 21.43 9.16 2,861 .79 1.47 12/31/15 22.11 .30 (.02) .28 (.40) (1.59) (1.99) 20.40 1.14 2,414 .79 1.45 12/31/14 22.46 .34 .79 1.13 (.36) (1.12) (1.48) 22.11 5.16 32 .80 1.55 12/31/13 18.43 .27 4.12 4.39 (.36) — (.36) 22.46 23.89 1 .79 1.22 12/31/123,4 18.52 .01 .21 .22 (.31) — (.31) 18.43 1.175,6 —7 .015,6 .085,6
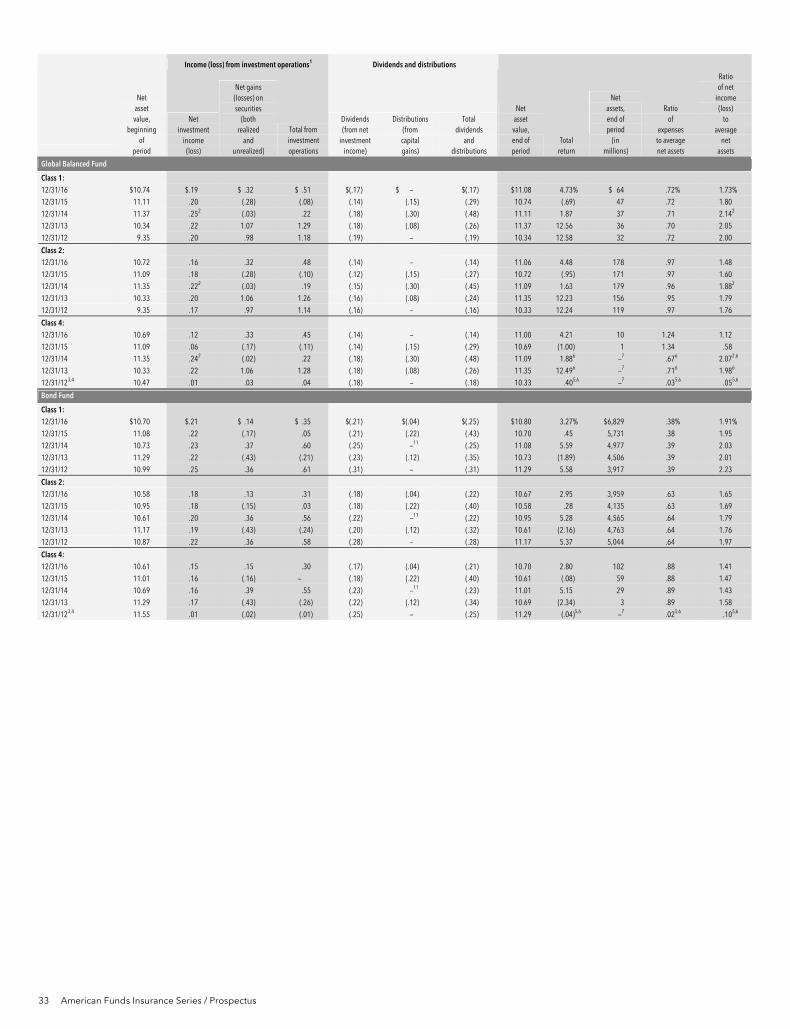
33 American Funds Insurance Series / Prospectus
Income (loss) from investment operations1 Dividends and distributions
Net asset value,
beginning of
period
Net investment
income (loss)
Net gains (losses) on securities
(both realized
and unrealized)
Total from investment operations
Dividends (from net
investment income)
Distributions (from capital gains)
Total dividends
and distributions
Net asset value, end of period
Total return
Net assets, end of period
(in millions)
Ratio of
expenses to average net assets
Ratio of net
income (loss)
to average
net assets
Global Balanced Fund
Class 1: 12/31/16 $10.74 $.19 $ .32 $ .51 $(.17) $ — $(.17) $11.08 4.73% $ 64 .72% 1.73% 12/31/15 11.11 .20 (.28) (.08) (.14) (.15) (.29) 10.74 (.69) 47 .72 1.80 12/31/14 11.37 .252 (.03) .22 (.18) (.30) (.48) 11.11 1.87 37 .71 2.142 12/31/13 10.34 .22 1.07 1.29 (.18) (.08) (.26) 11.37 12.56 36 .70 2.05 12/31/12 9.35 .20 .98 1.18 (.19) — (.19) 10.34 12.58 32 .72 2.00
Class 2: 12/31/16 10.72 .16 .32 .48 (.14) — (.14) 11.06 4.48 178 .97 1.48 12/31/15 11.09 .18 (.28) (.10) (.12) (.15) (.27) 10.72 (.95) 171 .97 1.60 12/31/14 11.35 .222 (.03) .19 (.15) (.30) (.45) 11.09 1.63 179 .96 1.882 12/31/13 10.33 .20 1.06 1.26 (.16) (.08) (.24) 11.35 12.23 156 .95 1.79 12/31/12 9.35 .17 .97 1.14 (.16) — (.16) 10.33 12.24 119 .97 1.76
Class 4: 12/31/16 10.69 .12 .33 .45 (.14) — (.14) 11.00 4.21 10 1.24 1.12 12/31/15 11.09 .06 (.17) (.11) (.14) (.15) (.29) 10.69 (1.00) 1 1.34 .58 12/31/14 11.35 .242 (.02) .22 (.18) (.30) (.48) 11.09 1.886 —7 .676 2.072,6 12/31/13 10.33 .22 1.06 1.28 (.18) (.08) (.26) 11.35 12.496 —7 .716 1.986 12/31/123,4 10.47 .01 .03 .04 (.18) — (.18) 10.33 .405,6 —7 .035,6 .055,6
Bond Fund
Class 1: 12/31/16 $10.70 $.21 $ .14 $ .35 $(.21) $(.04) $(.25) $10.80 3.27% $6,829 .38% 1.91% 12/31/15 11.08 .22 (.17) .05 (.21) (.22) (.43) 10.70 .45 5,731 .38 1.95 12/31/14 10.73 .23 .37 .60 (.25) —11 (.25) 11.08 5.59 4,977 .39 2.03 12/31/13 11.29 .22 (.43) (.21) (.23) (.12) (.35) 10.73 (1.89) 4,506 .39 2.01 12/31/12 10.99 .25 .36 .61 (.31) — (.31) 11.29 5.58 3,917 .39 2.23
Class 2: 12/31/16 10.58 .18 .13 .31 (.18) (.04) (.22) 10.67 2.95 3,959 .63 1.65 12/31/15 10.95 .18 (.15) .03 (.18) (.22) (.40) 10.58 .28 4,135 .63 1.69 12/31/14 10.61 .20 .36 .56 (.22) —11 (.22) 10.95 5.28 4,565 .64 1.79 12/31/13 11.17 .19 (.43) (.24) (.20) (.12) (.32) 10.61 (2.16) 4,763 .64 1.76 12/31/12 10.87 .22 .36 .58 (.28) — (.28) 11.17 5.37 5,044 .64 1.97
Class 4: 12/31/16 10.61 .15 .15 .30 (.17) (.04) (.21) 10.70 2.80 102 .88 1.41 12/31/15 11.01 .16 (.16) — (.18) (.22) (.40) 10.61 (.08) 59 .88 1.47 12/31/14 10.69 .16 .39 .55 (.23) —11 (.23) 11.01 5.15 29 .89 1.43 12/31/13 11.29 .17 (.43) (.26) (.22) (.12) (.34) 10.69 (2.34) 3 .89 1.58 12/31/123,4 11.55 .01 (.02) (.01) (.25) — (.25) 11.29 (.04)5,6 —7 .025,6 .105,6
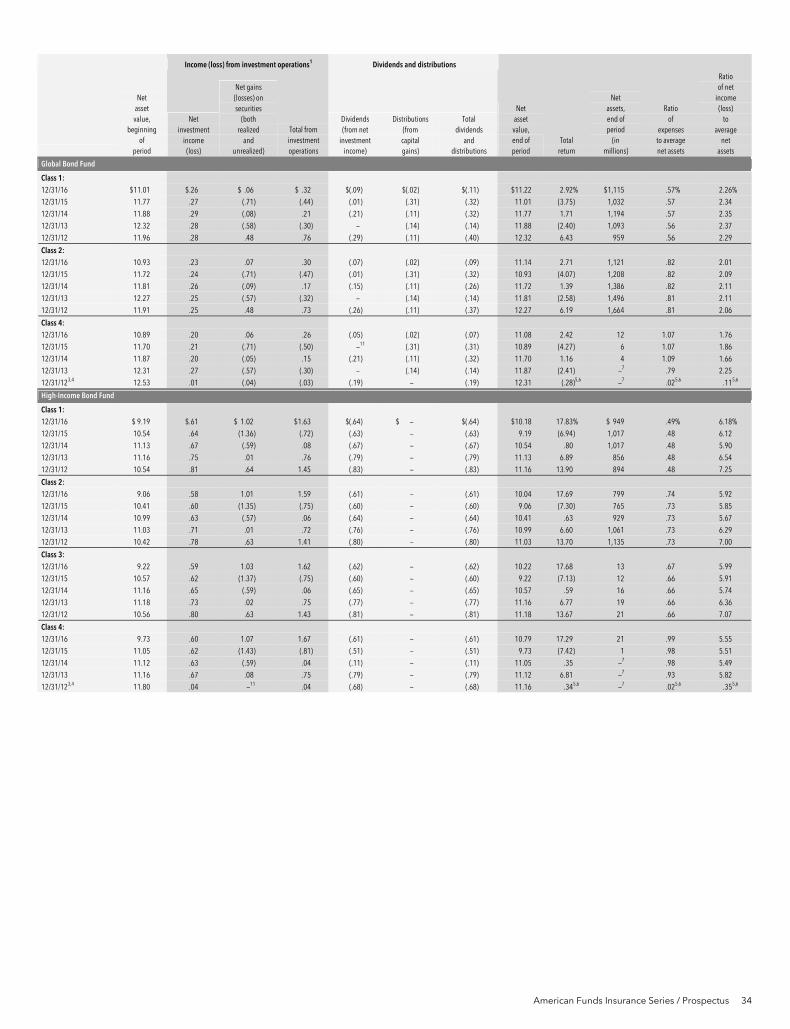
American Funds Insurance Series / Prospectus 34
Income (loss) from investment operations1 Dividends and distributions
Net asset value,
beginning of
period
Net investment
income (loss)
Net gains (losses) on securities
(both realized
and unrealized)
Total from investment operations
Dividends (from net
investment income)
Distributions (from capital gains)
Total dividends
and distributions
Net asset value, end of period
Total return
Net assets, end of period
(in millions)
Ratio of
expenses to average net assets
Ratio of net
income (loss)
to average
net assets
Global Bond Fund
Class 1: 12/31/16 $11.01 $.26 $ .06 $ .32 $(.09) $(.02) $(.11) $11.22 2.92% $1,115 .57% 2.26% 12/31/15 11.77 .27 (.71) (.44) (.01) (.31) (.32) 11.01 (3.75) 1,032 .57 2.34 12/31/14 11.88 .29 (.08) .21 (.21) (.11) (.32) 11.77 1.71 1,194 .57 2.35 12/31/13 12.32 .28 (.58) (.30) — (.14) (.14) 11.88 (2.40) 1,093 .56 2.37 12/31/12 11.96 .28 .48 .76 (.29) (.11) (.40) 12.32 6.43 959 .56 2.29
Class 2: 12/31/16 10.93 .23 .07 .30 (.07) (.02) (.09) 11.14 2.71 1,121 .82 2.01 12/31/15 11.72 .24 (.71) (.47) (.01) (.31) (.32) 10.93 (4.07) 1,208 .82 2.09 12/31/14 11.81 .26 (.09) .17 (.15) (.11) (.26) 11.72 1.39 1,386 .82 2.11 12/31/13 12.27 .25 (.57) (.32) — (.14) (.14) 11.81 (2.58) 1,496 .81 2.11 12/31/12 11.91 .25 .48 .73 (.26) (.11) (.37) 12.27 6.19 1,664 .81 2.06
Class 4: 12/31/16 10.89 .20 .06 .26 (.05) (.02) (.07) 11.08 2.42 12 1.07 1.76 12/31/15 11.70 .21 (.71) (.50) —11 (.31) (.31) 10.89 (4.27) 6 1.07 1.86 12/31/14 11.87 .20 (.05) .15 (.21) (.11) (.32) 11.70 1.16 4 1.09 1.66 12/31/13 12.31 .27 (.57) (.30) — (.14) (.14) 11.87 (2.41) —7 .79 2.25 12/31/123,4 12.53 .01 (.04) (.03) (.19) — (.19) 12.31 (.28)5,6 —7 .025,6 .115,6
High-Income Bond Fund
Class 1: 12/31/16 $ 9.19 $.61 $ 1.02 $1.63 $(.64) $ — $(.64) $10.18 17.83% $ 949 .49% 6.18% 12/31/15 10.54 .64 (1.36) (.72) (.63) — (.63) 9.19 (6.94) 1,017 .48 6.12 12/31/14 11.13 .67 (.59) .08 (.67) — (.67) 10.54 .80 1,017 .48 5.90 12/31/13 11.16 .75 .01 .76 (.79) — (.79) 11.13 6.89 856 .48 6.54 12/31/12 10.54 .81 .64 1.45 (.83) — (.83) 11.16 13.90 894 .48 7.25
Class 2: 12/31/16 9.06 .58 1.01 1.59 (.61) — (.61) 10.04 17.69 799 .74 5.92 12/31/15 10.41 .60 (1.35) (.75) (.60) — (.60) 9.06 (7.30) 765 .73 5.85 12/31/14 10.99 .63 (.57) .06 (.64) — (.64) 10.41 .63 929 .73 5.67 12/31/13 11.03 .71 .01 .72 (.76) — (.76) 10.99 6.60 1,061 .73 6.29 12/31/12 10.42 .78 .63 1.41 (.80) — (.80) 11.03 13.70 1,135 .73 7.00
Class 3: 12/31/16 9.22 .59 1.03 1.62 (.62) — (.62) 10.22 17.68 13 .67 5.99 12/31/15 10.57 .62 (1.37) (.75) (.60) — (.60) 9.22 (7.13) 12 .66 5.91 12/31/14 11.16 .65 (.59) .06 (.65) — (.65) 10.57 .59 16 .66 5.74 12/31/13 11.18 .73 .02 .75 (.77) — (.77) 11.16 6.77 19 .66 6.36 12/31/12 10.56 .80 .63 1.43 (.81) — (.81) 11.18 13.67 21 .66 7.07
Class 4: 12/31/16 9.73 .60 1.07 1.67 (.61) — (.61) 10.79 17.29 21 .99 5.55 12/31/15 11.05 .62 (1.43) (.81) (.51) — (.51) 9.73 (7.42) 1 .98 5.51 12/31/14 11.12 .63 (.59) .04 (.11) — (.11) 11.05 .35 —7 .98 5.49 12/31/13 11.16 .67 .08 .75 (.79) — (.79) 11.12 6.81 —7 .93 5.82 12/31/123,4 11.80 .04 —11 .04 (.68) — (.68) 11.16 .345,6 —7 .025,6 .355,6
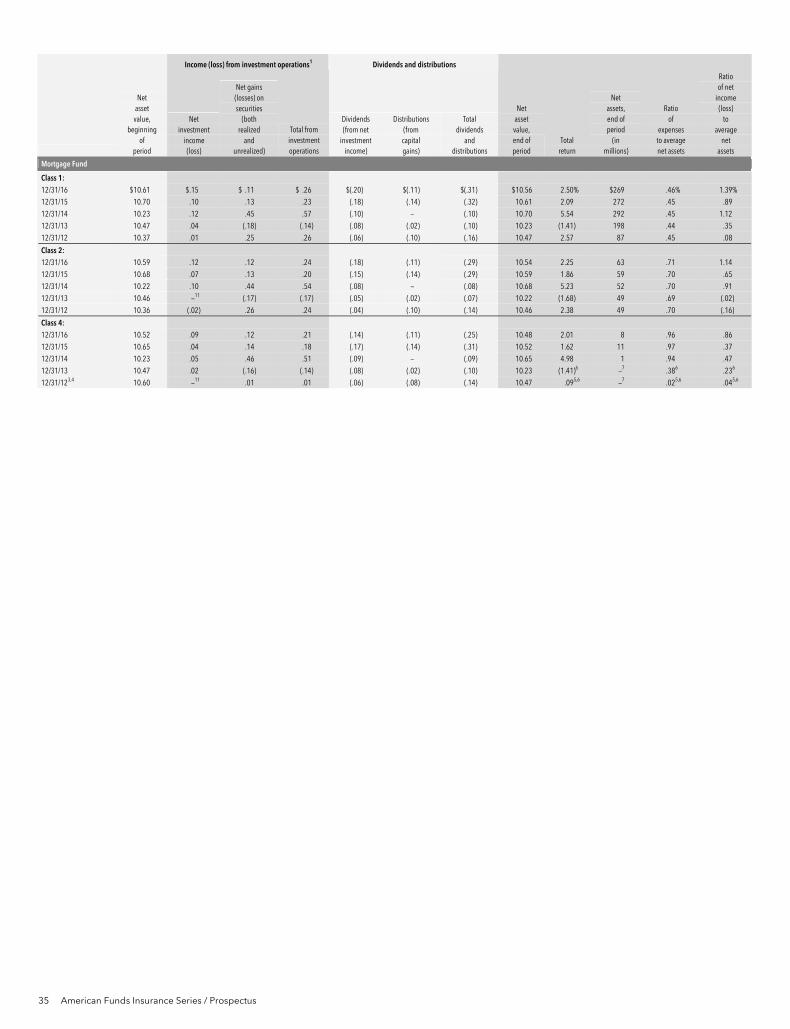
35 American Funds Insurance Series / Prospectus
Income (loss) from investment operations1 Dividends and distributions
Net asset value,
beginning of
period
Net investment
income (loss)
Net gains (losses) on securities
(both realized
and unrealized)
Total from investment operations
Dividends (from net
investment income)
Distributions (from capital gains)
Total dividends
and distributions
Net asset value, end of period
Total return
Net assets, end of period
(in millions)
Ratio of
expenses to average net assets
Ratio of net
income (loss)
to average
net assets
Mortgage Fund
Class 1: 12/31/16 $10.61 $.15 $ .11 $ .26 $(.20) $(.11) $(.31) $10.56 2.50% $269 .46% 1.39% 12/31/15 10.70 .10 .13 .23 (.18) (.14) (.32) 10.61 2.09 272 .45 .89 12/31/14 10.23 .12 .45 .57 (.10) — (.10) 10.70 5.54 292 .45 1.12 12/31/13 10.47 .04 (.18) (.14) (.08) (.02) (.10) 10.23 (1.41) 198 .44 .35 12/31/12 10.37 .01 .25 .26 (.06) (.10) (.16) 10.47 2.57 87 .45 .08
Class 2: 12/31/16 10.59 .12 .12 .24 (.18) (.11) (.29) 10.54 2.25 63 .71 1.14 12/31/15 10.68 .07 .13 .20 (.15) (.14) (.29) 10.59 1.86 59 .70 .65 12/31/14 10.22 .10 .44 .54 (.08) — (.08) 10.68 5.23 52 .70 .91 12/31/13 10.46 —11 (.17) (.17) (.05) (.02) (.07) 10.22 (1.68) 49 .69 (.02) 12/31/12 10.36 (.02) .26 .24 (.04) (.10) (.14) 10.46 2.38 49 .70 (.16)
Class 4: 12/31/16 10.52 .09 .12 .21 (.14) (.11) (.25) 10.48 2.01 8 .96 .86 12/31/15 10.65 .04 .14 .18 (.17) (.14) (.31) 10.52 1.62 11 .97 .37 12/31/14 10.23 .05 .46 .51 (.09) — (.09) 10.65 4.98 1 .94 .47 12/31/13 10.47 .02 (.16) (.14) (.08) (.02) (.10) 10.23 (1.41)6 —7 .386 .236 12/31/123,4 10.60 —11 .01 .01 (.06) (.08) (.14) 10.47 .095,6 —7 .025,6 .045,6
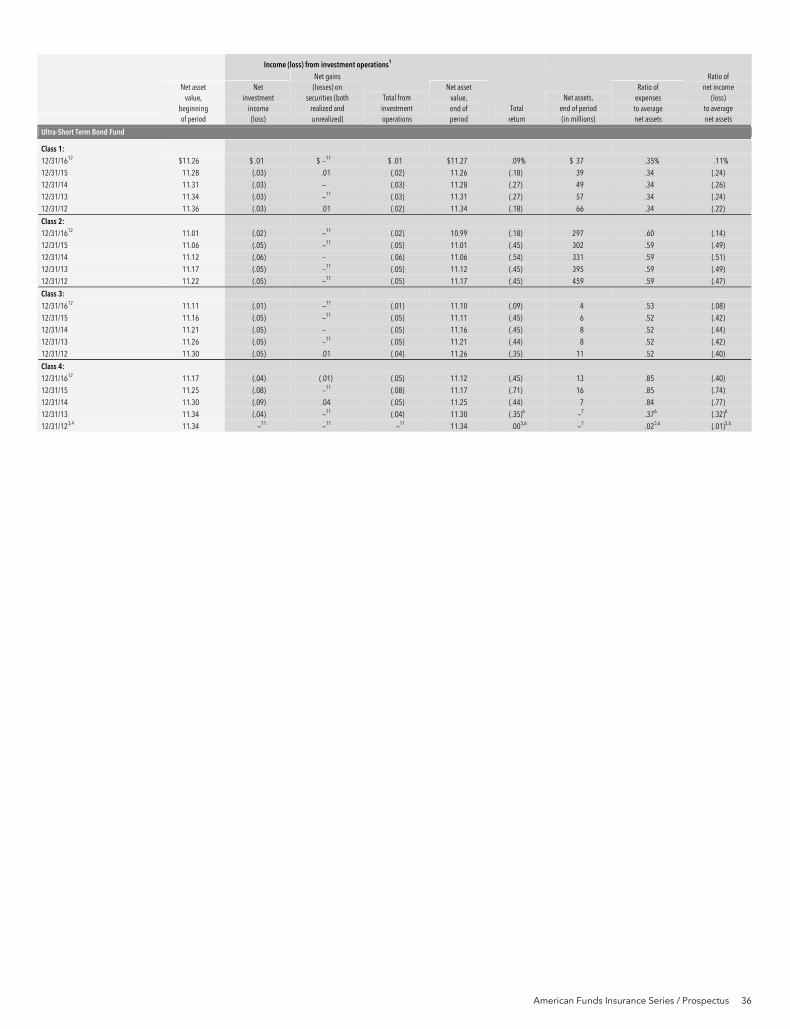
American Funds Insurance Series / Prospectus 36
Income (loss) from investment operations1
Net asset value,
beginning of period
Net investment
income (loss)
Net gains (losses) on
securities (both realized and unrealized)
Total from investment operations
Net asset value, end of period
Total return
Net assets, end of period (in millions)
Ratio of expenses to average net assets
Ratio of net income
(loss) to average net assets
Ultra-Short Term Bond Fund
Class 1:
12/31/1612 $11.26 $ .01 $ —11 $ .01 $11.27 .09% $ 37 .35% .11% 12/31/15 11.28 (.03) .01 (.02) 11.26 (.18) 39 .34 (.24) 12/31/14 11.31 (.03) — (.03) 11.28 (.27) 49 .34 (.26) 12/31/13 11.34 (.03) —11 (.03) 11.31 (.27) 57 .34 (.24) 12/31/12 11.36 (.03) .01 (.02) 11.34 (.18) 66 .34 (.22)
Class 2: 12/31/1612 11.01 (.02) —11 (.02) 10.99 (.18) 297 .60 (.14) 12/31/15 11.06 (.05) —11 (.05) 11.01 (.45) 302 .59 (.49) 12/31/14 11.12 (.06) — (.06) 11.06 (.54) 331 .59 (.51) 12/31/13 11.17 (.05) —11 (.05) 11.12 (.45) 395 .59 (.49) 12/31/12 11.22 (.05) —11 (.05) 11.17 (.45) 459 .59 (.47)
Class 3:
12/31/1612 11.11 (.01) —11 (.01) 11.10 (.09) 4 .53 (.08) 12/31/15 11.16 (.05) —11 (.05) 11.11 (.45) 6 .52 (.42) 12/31/14 11.21 (.05) — (.05) 11.16 (.45) 8 .52 (.44) 12/31/13 11.26 (.05) —11 (.05) 11.21 (.44) 8 .52 (.42) 12/31/12 11.30 (.05) .01 (.04) 11.26 (.35) 11 .52 (.40)
Class 4: 12/31/1612 11.17 (.04) (.01) (.05) 11.12 (.45) 13 .85 (.40) 12/31/15 11.25 (.08) —11 (.08) 11.17 (.71) 16 .85 (.74) 12/31/14 11.30 (.09) .04 (.05) 11.25 (.44) 7 .84 (.77) 12/31/13 11.34 (.04) —11 (.04) 11.30 (.35)6 —7 .376 (.32)6 12/31/123,4 11.34 —11 —11 —11 11.34 .005,6 —7 .025,6 (.01)5,6
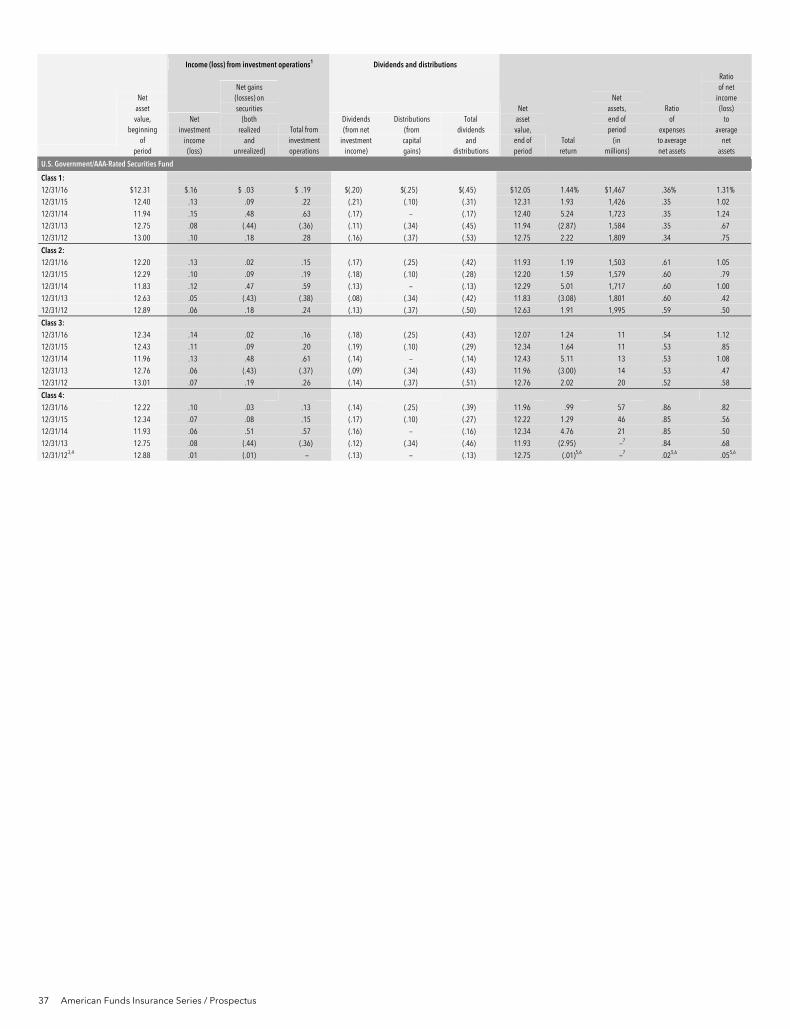
37 American Funds Insurance Series / Prospectus
Income (loss) from investment operations1 Dividends and distributions
Net asset value,
beginning of
period
Net investment
income (loss)
Net gains (losses) on securities
(both realized
and unrealized)
Total from investment operations
Dividends (from net
investment income)
Distributions (from capital gains)
Total dividends
and distributions
Net asset value, end of period
Total return
Net assets, end of period
(in millions)
Ratio of
expenses to average net assets
Ratio of net
income (loss)
to average
net assets
U.S. Government/AAA-Rated Securities Fund
Class 1: 12/31/16 $12.31 $.16 $ .03 $ .19 $(.20) $(.25) $(.45) $12.05 1.44% $1,467 .36% 1.31% 12/31/15 12.40 .13 .09 .22 (.21) (.10) (.31) 12.31 1.93 1,426 .35 1.02 12/31/14 11.94 .15 .48 .63 (.17) — (.17) 12.40 5.24 1,723 .35 1.24 12/31/13 12.75 .08 (.44) (.36) (.11) (.34) (.45) 11.94 (2.87) 1,584 .35 .67 12/31/12 13.00 .10 .18 .28 (.16) (.37) (.53) 12.75 2.22 1,809 .34 .75
Class 2: 12/31/16 12.20 .13 .02 .15 (.17) (.25) (.42) 11.93 1.19 1,503 .61 1.05 12/31/15 12.29 .10 .09 .19 (.18) (.10) (.28) 12.20 1.59 1,579 .60 .79 12/31/14 11.83 .12 .47 .59 (.13) — (.13) 12.29 5.01 1,717 .60 1.00 12/31/13 12.63 .05 (.43) (.38) (.08) (.34) (.42) 11.83 (3.08) 1,801 .60 .42 12/31/12 12.89 .06 .18 .24 (.13) (.37) (.50) 12.63 1.91 1,995 .59 .50
Class 3: 12/31/16 12.34 .14 .02 .16 (.18) (.25) (.43) 12.07 1.24 11 .54 1.12 12/31/15 12.43 .11 .09 .20 (.19) (.10) (.29) 12.34 1.64 11 .53 .85 12/31/14 11.96 .13 .48 .61 (.14) — (.14) 12.43 5.11 13 .53 1.08 12/31/13 12.76 .06 (.43) (.37) (.09) (.34) (.43) 11.96 (3.00) 14 .53 .47 12/31/12 13.01 .07 .19 .26 (.14) (.37) (.51) 12.76 2.02 20 .52 .58
Class 4:
12/31/16 12.22 .10 .03 .13 (.14) (.25) (.39) 11.96 .99 57 .86 .82 12/31/15 12.34 .07 .08 .15 (.17) (.10) (.27) 12.22 1.29 46 .85 .56 12/31/14 11.93 .06 .51 .57 (.16) — (.16) 12.34 4.76 21 .85 .50 12/31/13 12.75 .08 (.44) (.36) (.12) (.34) (.46) 11.93 (2.95) —7 .84 .68 12/31/123,4 12.88 .01 (.01) — (.13) — (.13) 12.75 (.01)5,6 —7 .025,6 .055,6
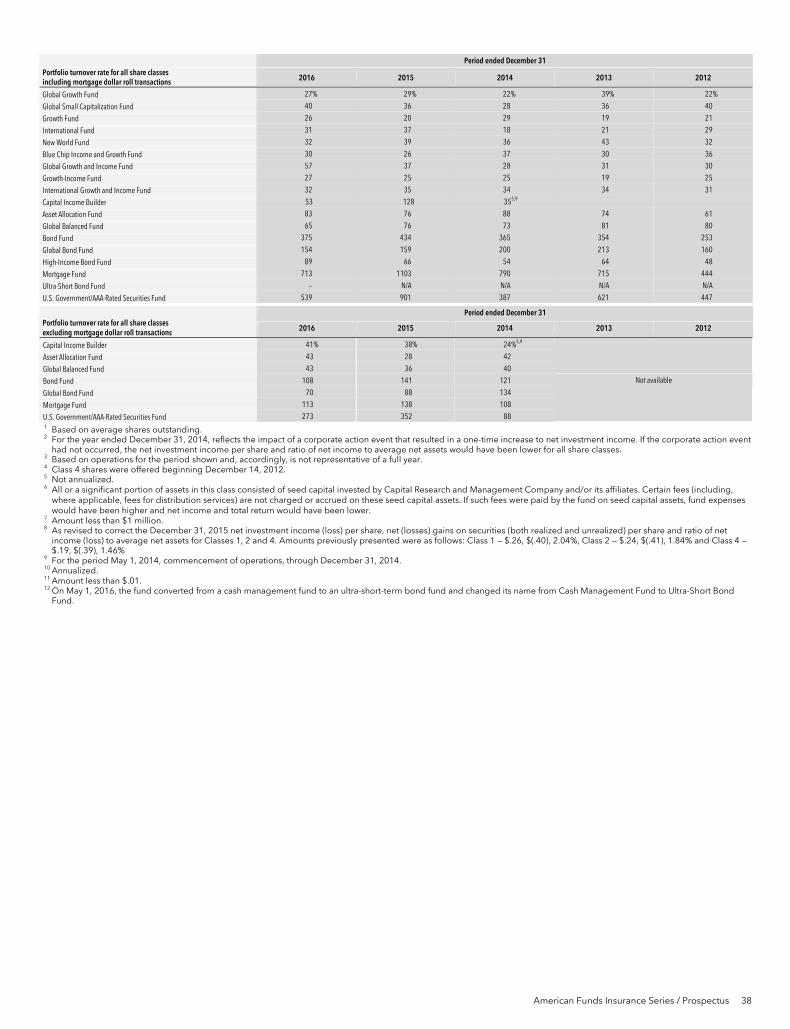
American Funds Insurance Series / Prospectus 38
Period ended December 31 Portfolio turnover rate for all share classes including mortgage dollar roll transactions 2016 2015 2014 2013 2012
Global Growth Fund 27% 29% 22% 39% 22%
Global Small Capitalization Fund 40 36 28 36 40
Growth Fund 26 20 29 19 21
International Fund 31 37 18 21 29
New World Fund 32 39 36 43 32
Blue Chip Income and Growth Fund 30 26 37 30 36
Global Growth and Income Fund 57 37 28 31 30
Growth-Income Fund 27 25 25 19 25
International Growth and Income Fund 32 35 34 34 31
Capital Income Builder 53 128 355,9
Asset Allocation Fund 83 76 88 74 61
Global Balanced Fund 65 76 73 81 80
Bond Fund 375 434 365 354 253
Global Bond Fund 154 159 200 213 160
High-Income Bond Fund 89 66 54 64 48
Mortgage Fund 713 1103 790 715 444
Ultra-Short Bond Fund — N/A N/A N/A N/A
U.S. Government/AAA-Rated Securities Fund 539 901 387 621 447
Period ended December 31 Portfolio turnover rate for all share classes excluding mortgage dollar roll transactions 2016 2015 2014 2013 2012
Capital Income Builder 41% 38% 24%5,9
Asset Allocation Fund 43 28 42
Global Balanced Fund 43 36 40
Bond Fund 108 141 121
Global Bond Fund 70 88 134
Mortgage Fund 113 138 108
U.S. Government/AAA-Rated Securities Fund 273 352 88
Not available
1 Based on average shares outstanding. 2 For the year ended December 31, 2014, reflects the impact of a corporate action event that resulted in a one-time increase to net investment income. If the corporate action event
had not occurred, the net investment income per share and ratio of net income to average net assets would have been lower for all share classes. 3 Based on operations for the period shown and, accordingly, is not representative of a full year. 4 Class 4 shares were offered beginning December 14, 2012. 5 Not annualized. 6 All or a significant portion of assets in this class consisted of seed capital invested by Capital Research and Management Company and/or its affiliates. Certain fees (including,
where applicable, fees for distribution services) are not charged or accrued on these seed capital assets. If such fees were paid by the fund on seed capital assets, fund expenses would have been higher and net income and total return would have been lower.
7 Amount less than $1 million. 8 As revised to correct the December 31, 2015 net investment income (loss) per share, net (losses) gains on securities (both realized and unrealized) per share and ratio of net
income (loss) to average net assets for Classes 1, 2 and 4. Amounts previously presented were as follows: Class 1 — $.26, $(.40), 2.04%, Class 2 — $.24, $(.41), 1.84% and Class 4 — $.19, $(.39), 1.46%
9 For the period May 1, 2014, commencement of operations, through December 31, 2014. 10 Annualized. 11 Amount less than $.01. 12 On May 1, 2016, the fund converted from a cash management fund to an ultra-short-term bond fund and changed its name from Cash Management Fund to Ultra-Short Bond
Fund.

Investment Company File No. 811-03857
Other fund information Shares of the Series are currently offered to insurance company separate accounts funding both variable annuity contracts and variable life insurance policies. Interests of various contract owners participating in the Series may be in conflict. The board of trustees of the Series will monitor for the existence of any material conflicts and determine what action, if any, should be taken. Shares may be purchased or redeemed by the separate accounts without any sales or redemption charges at net asset value.
Annual/Semi-annual report to shareholders The shareholder reports contain additional information about the Series, including financial statements, investment results, portfolio holdings, a discussion of market conditions and the Series’ investment strategies, and the independent registered public accounting firm’s report (in the annual report).
Statement of additional information (SAI) and codes of ethics The current SAI, as amended from time to time, contains more detailed information about the Series, including the funds’ financial statements, and is incorporated by reference into this prospectus. This means that the current SAI, for legal purposes, is part of this prospectus. The codes of ethics describe the personal investing policies adopted by the Series, the Series’ investment adviser and its affiliated companies.
The codes of ethics and current SAI are on file with the U.S. Securities and Exchange Commission (SEC). These and other related materials about the Series are available for review or to be copied at the SEC’s Public Reference Room in Washington, D.C., (202) 551-8090, on the EDGAR database on the SEC’s website at sec.gov or, after payment of a duplicating fee, via email request to [email protected] or by writing to the SEC’s Public Reference Section, 100 F Street, NE, Washington, D.C. 20549-1520.
The current SAI and annual/semi-annual reports to shareholders can be found online at americanfunds.com/afis and may be available on the website of the company that issued your insurance contract. You also may request a free copy of these documents or the codes of ethics by calling American Funds at (800) 421-9900, ext. 65413 or writing to the Secretary at 333 South Hope Street, Los Angeles, California 90071.
Managed Risk Asset Allocation Fund
Table of contents
Managed Risk Asset Allocation Fund 1
Investment objectives, strategies and risks 7
Management and organization 12Purchases and redemptions of shares 14Plan of distribution 16Fund expenses 16Investment results 16Distributions and taxes 16Financial highlights 17
American Funds Insurance Series®
Prospectus Class P1 shares
May 1, 2017
Neither the U.S. Securities and Exchange Commission nor the Commodity Futures Trading Commission has approved or disapproved of these securities or determined that this prospectus is truthful or complete. Any representation to the contrary is a criminal offense.

1 American Funds Insurance Series — Managed Risk Funds / Prospectus
Managed Risk Asset Allocation Fund Investment objective The fund’s investment objective is to provide high total return (including income and capital gains) consistent with preservation of capital over the long term while seeking to manage volatility and provide downside protection.
Fees and expenses of the fund This table describes the fees and expenses that you may pay if you buy and hold an interest in Class P1 shares of the fund. It does not reflect insurance contract fees and expenses. If insurance contract fees and expenses were reflected, expenses shown would be higher.
Annual fund operating expenses (expenses that you pay each year as a percentage of the value of your investment) Class P1 Management fees 0.15% Distribution fees None Other expenses 0.28 Acquired (underlying) fund fees and expenses 0.27 Total annual fund operating expenses 0.70 Fee waiver and/or expense reimbursement* 0.05 Total annual fund operating expenses after fee waiver and/or expense reimbursement 0.65
* The investment adviser is currently waiving a portion of its management fee equal to .05% of the fund’s net assets. This waiver will be in effect through at least May 1, 2018, unless modified or terminated by the fund’s board. The waiver may only be modified or terminated with the approval of the fund’s board.
Example This example is intended to help you compare the cost of investing in Class P1 shares of the fund with the cost of investing in other mutual funds.
The example assumes that you invest $10,000 in the fund for the time periods indicated and then redeem all of your shares at the end of those periods. The example also assumes that your investment has a 5% return each year and that the fund’s operating expenses remain the same. The example does not reflect insurance contract expenses. If insurance contract expenses were reflected, expenses shown would be higher. Although your actual costs may be higher or lower, based on these assumptions your costs would be:
1 year 3 years 5 years 10 years Class P1 $66 $219 $385 $866
Portfolio turnover The fund pays transaction costs, such as commissions, when it buys and sells securities and other instruments (or “turns over” its portfolio). A higher portfolio turnover rate may indicate higher transaction costs. These costs, which are not reflected in annual fund operating expenses or in the example, affect the fund’s investment results. During the most recent fiscal year, the fund’s portfolio turnover rate was 3% of the average value of its portfolio.
Principal investment strategies The fund pursues its investment objective by investing in shares of an underlying fund, the American Funds Insurance Series Asset Allocation FundSM, while seeking to manage portfolio volatility and provide downside protection primarily through the use of exchange-traded futures contracts.
The investment objective of the underlying fund is to provide investors with high total returns (including income and capital gains) consistent with preservation of capital over the long term. The underlying fund invests in a diversified portfolio of common stocks and other equity securities, bonds and other intermediate and long-term debt securities, and money market instruments (debt securities maturing in one year or less). The underlying fund varies its mix of equity securities, debt securities and money market instruments. Under normal market conditions, the underlying fund’s investment adviser expects (but is not required) to maintain an investment mix falling within the following ranges: 40%-80% in equity securities, 20%-50% in debt securities and 0%-40% in money market instruments and cash. As of December 31, 2016, the fund was approximately 65% invested in equity securities, 27% invested in debt securities and 8% invested in money market instruments and cash. The proportion of equities, debt and money market securities held by the underlying fund varies with market conditions and the investment adviser’s assessment of their relative attractiveness as investment opportunities.
The underlying fund may invest up to 15% of its assets in common stocks and other equity securities of issuers domiciled outside the United States and up to 5% of its assets in debt securities of issuers domiciled outside the United States. In addition, the underlying fund may invest up to 25% of its debt assets in lower quality debt securities (rated Ba1 or below and BB+ or below by Nationally Recognized Statistical Rating Organizations designated by the fund’s investment adviser or unrated but determined to be of equivalent quality by the fund’s investment adviser). Such securities are sometimes referred to as “junk bonds.”
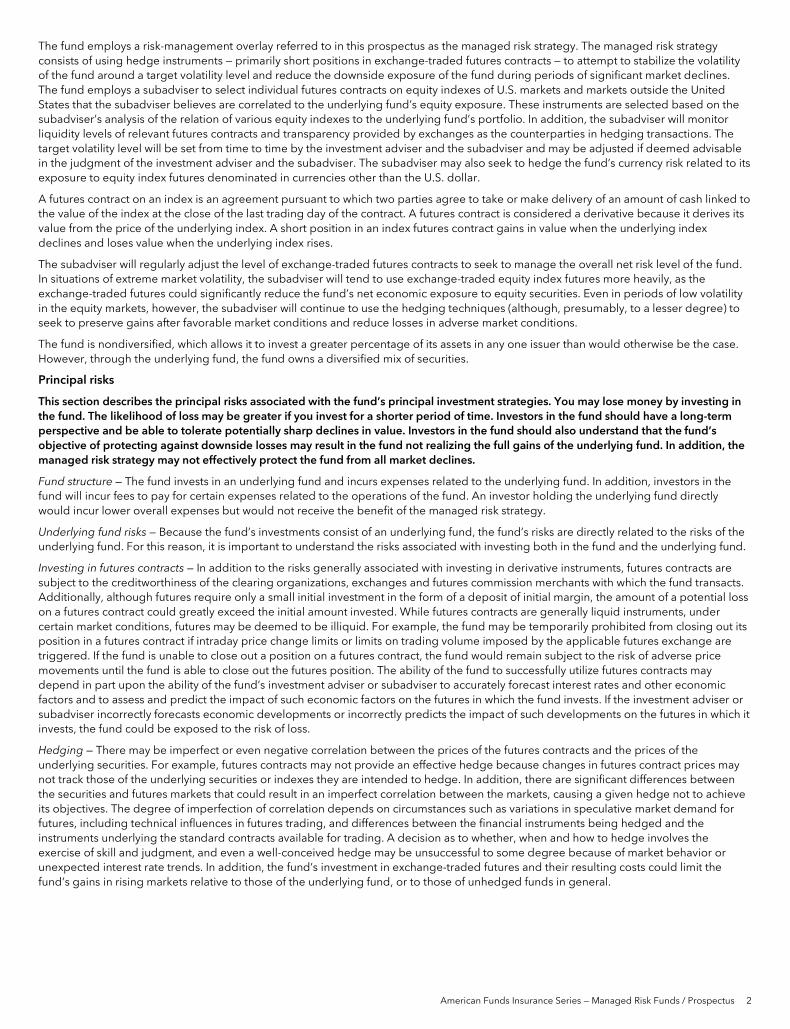
American Funds Insurance Series — Managed Risk Funds / Prospectus 2
The fund employs a risk-management overlay referred to in this prospectus as the managed risk strategy. The managed risk strategy consists of using hedge instruments — primarily short positions in exchange-traded futures contracts — to attempt to stabilize the volatility of the fund around a target volatility level and reduce the downside exposure of the fund during periods of significant market declines. The fund employs a subadviser to select individual futures contracts on equity indexes of U.S. markets and markets outside the United States that the subadviser believes are correlated to the underlying fund’s equity exposure. These instruments are selected based on the subadviser’s analysis of the relation of various equity indexes to the underlying fund’s portfolio. In addition, the subadviser will monitor liquidity levels of relevant futures contracts and transparency provided by exchanges as the counterparties in hedging transactions. The target volatility level will be set from time to time by the investment adviser and the subadviser and may be adjusted if deemed advisable in the judgment of the investment adviser and the subadviser. The subadviser may also seek to hedge the fund’s currency risk related to its exposure to equity index futures denominated in currencies other than the U.S. dollar.
A futures contract on an index is an agreement pursuant to which two parties agree to take or make delivery of an amount of cash linked to the value of the index at the close of the last trading day of the contract. A futures contract is considered a derivative because it derives its value from the price of the underlying index. A short position in an index futures contract gains in value when the underlying index declines and loses value when the underlying index rises.
The subadviser will regularly adjust the level of exchange-traded futures contracts to seek to manage the overall net risk level of the fund. In situations of extreme market volatility, the subadviser will tend to use exchange-traded equity index futures more heavily, as the exchange-traded futures could significantly reduce the fund’s net economic exposure to equity securities. Even in periods of low volatility in the equity markets, however, the subadviser will continue to use the hedging techniques (although, presumably, to a lesser degree) to seek to preserve gains after favorable market conditions and reduce losses in adverse market conditions.
The fund is nondiversified, which allows it to invest a greater percentage of its assets in any one issuer than would otherwise be the case. However, through the underlying fund, the fund owns a diversified mix of securities.
Principal risks
This section describes the principal risks associated with the fund’s principal investment strategies. You may lose money by investing in the fund. The likelihood of loss may be greater if you invest for a shorter period of time. Investors in the fund should have a long-term perspective and be able to tolerate potentially sharp declines in value. Investors in the fund should also understand that the fund’s objective of protecting against downside losses may result in the fund not realizing the full gains of the underlying fund. In addition, the managed risk strategy may not effectively protect the fund from all market declines.
Fund structure — The fund invests in an underlying fund and incurs expenses related to the underlying fund. In addition, investors in the fund will incur fees to pay for certain expenses related to the operations of the fund. An investor holding the underlying fund directly would incur lower overall expenses but would not receive the benefit of the managed risk strategy.
Underlying fund risks — Because the fund’s investments consist of an underlying fund, the fund’s risks are directly related to the risks of the underlying fund. For this reason, it is important to understand the risks associated with investing both in the fund and the underlying fund.
Investing in futures contracts — In addition to the risks generally associated with investing in derivative instruments, futures contracts are subject to the creditworthiness of the clearing organizations, exchanges and futures commission merchants with which the fund transacts. Additionally, although futures require only a small initial investment in the form of a deposit of initial margin, the amount of a potential loss on a futures contract could greatly exceed the initial amount invested. While futures contracts are generally liquid instruments, under certain market conditions, futures may be deemed to be illiquid. For example, the fund may be temporarily prohibited from closing out its position in a futures contract if intraday price change limits or limits on trading volume imposed by the applicable futures exchange are triggered. If the fund is unable to close out a position on a futures contract, the fund would remain subject to the risk of adverse price movements until the fund is able to close out the futures position. The ability of the fund to successfully utilize futures contracts may depend in part upon the ability of the fund’s investment adviser or subadviser to accurately forecast interest rates and other economic factors and to assess and predict the impact of such economic factors on the futures in which the fund invests. If the investment adviser or subadviser incorrectly forecasts economic developments or incorrectly predicts the impact of such developments on the futures in which it invests, the fund could be exposed to the risk of loss.
Hedging — There may be imperfect or even negative correlation between the prices of the futures contracts and the prices of the underlying securities. For example, futures contracts may not provide an effective hedge because changes in futures contract prices may not track those of the underlying securities or indexes they are intended to hedge. In addition, there are significant differences between the securities and futures markets that could result in an imperfect correlation between the markets, causing a given hedge not to achieve its objectives. The degree of imperfection of correlation depends on circumstances such as variations in speculative market demand for futures, including technical influences in futures trading, and differences between the financial instruments being hedged and the instruments underlying the standard contracts available for trading. A decision as to whether, when and how to hedge involves the exercise of skill and judgment, and even a well-conceived hedge may be unsuccessful to some degree because of market behavior or unexpected interest rate trends. In addition, the fund’s investment in exchange-traded futures and their resulting costs could limit the fund’s gains in rising markets relative to those of the underlying fund, or to those of unhedged funds in general.
3 American Funds Insurance Series — Managed Risk Funds / Prospectus
Short positions — Losses from short positions in futures contracts occur when the underlying index increases in value. As the underlying index increases in value, the holder of the short position in the corresponding futures contract is required to pay the difference in value of the futures contract resulting from the increase in the index on a daily basis. Losses from a short position in an index futures contract could potentially be very large if the value of the underlying index rises dramatically in a short period of time.
Market conditions — The prices of, and the income generated by, the securities held by the underlying fund may decline – sometimes rapidly or unpredictably – due to various factors, including events or conditions affecting the general economy or particular industries; overall market changes; local, regional or global political, social or economic instability; governmental or governmental agency responses to economic conditions; and currency exchange rate, interest rate and commodity price fluctuations.
Issuer risks — The prices of, and the income generated by, securities held by the underlying fund may decline in response to various factors directly related to the issuers of such securities, including reduced demand for an issuer’s goods or services, poor management performance and strategic initiatives such as mergers, acquisitions or dispositions and the market response to any such initiatives.
Investing in growth-oriented stocks — Growth-oriented common stocks and other equity-type securities (such as preferred stocks, convertible preferred stocks and convertible bonds) may involve larger price swings and greater potential for loss than other types of investments. These risks may be even greater in the case of smaller capitalization stocks.
Investing in income-oriented stocks — Income provided by the underlying fund may be reduced by changes in the dividend policies of, and the capital resources available for dividend payments at, the companies in which the underlying fund invests.
Investing in debt instruments — The prices of, and the income generated by, bonds and other debt securities held by the underlying fund may be affected by changing interest rates and by changes in the effective maturities and credit ratings of these securities.
Rising interest rates will generally cause the prices of bonds and other debt securities to fall. Falling interest rates may cause an issuer to redeem, call or refinance a debt security before its stated maturity, which may result in the fund having to reinvest the proceeds in lower yielding securities. Longer maturity debt securities generally have greater sensitivity to changes in interest rates and may be subject to greater price fluctuations than shorter maturity debt securities.
Bonds and other debt securities are also subject to credit risk, which is the possibility that the credit strength of an issuer will weaken and/or an issuer of a debt security will fail to make timely payments of principal or interest and the security will go into default. Lower quality debt securities generally have higher rates of interest and may be subject to greater price fluctuations than higher quality debt securities. Credit risk is gauged, in part, by the credit ratings of the debt securities in which the underlying fund invests. However, ratings are only the opinions of the rating agencies issuing them and are not guarantees as to credit quality or an evaluation of market risk. The fund’s investment adviser relies on its own credit analysts to research issuers and issues in seeking to mitigate various credit and default risks.
Investing in lower rated debt instruments — Lower rated bonds and other lower rated debt securities generally have higher rates of interest and involve greater risk of default or price declines due to changes in the issuer’s creditworthiness than those of higher quality debt securities. The market prices of these securities may fluctuate more than the prices of higher quality debt securities and may decline significantly in periods of general economic difficulty. These risks may be increased with respect to investments in junk bonds.
Investing in securities backed by the U.S. government — Securities backed by the U.S. Treasury or the full faith and credit of the U.S. government are guaranteed only as to the timely payment of interest and principal when held to maturity. Accordingly, the current market values for these securities will fluctuate with changes in interest rates. Securities issued by government-sponsored entities and federal agencies and instrumentalities that are not backed by the full faith and credit of the U.S. government are neither issued nor guaranteed by the U.S. government.
Liquidity risk — Certain underlying fund holdings may be deemed to be less liquid or illiquid because they cannot be readily sold without significantly impacting the value of the holdings. Liquidity risk may result from the lack of an active market for a holding, legal or contractual restrictions on resale, or the reduced number and capacity of market participants to make a market in such holding. Market prices for less liquid or illiquid holdings may be volatile, and reduced liquidity may have an adverse impact on the market price of such holdings. Additionally, the sale of less liquid or illiquid holdings may involve substantial delays (including delays in settlement) and additional costs and the underlying fund may be unable to sell such holdings when necessary to meet its liquidity needs.

American Funds Insurance Series — Managed Risk Funds / Prospectus 4
Investing outside the United States — Securities of issuers domiciled outside the United States, or with significant operations or revenues outside the United States, may lose value because of adverse political, social, economic or market developments (including social instability, regional conflicts, terrorism and war) in the countries or regions in which the issuers operate or generate revenue. These securities may also lose value due to changes in foreign currency exchange rates against the U.S. dollar and/or currencies of other countries. Issuers of these securities may be more susceptible to actions of foreign governments, such as the imposition of price controls or punitive taxes, that could adversely impact the value of these securities. Securities markets in certain countries may be more volatile and/or less liquid than those in the United States. Investments outside the United States may also be subject to different accounting practices and different regulatory, legal and reporting standards and practices, and may be more difficult to value, than those in the United States. In addition, the value of investments outside the United States may be reduced by foreign taxes, including foreign withholding taxes on interest and dividends. Further, there may be increased risks of delayed settlement of securities purchased or sold by the underlying fund. The risks of investing outside the United States may be heightened in connection with investments in emerging markets.
Asset allocation — The underlying fund’s percentage allocation to equity securities, debt securities and money market instruments could cause the fund to underperform relative to relevant benchmarks and other funds with similar investment objectives.
Nondiversification risk — As a nondiversified fund, the fund has the ability to invest a larger percentage of its assets in the securities of a smaller number of issuers than a diversified fund. Therefore, poor performance by a single large holding could adversely impact the fund’s investment results more than if the fund were invested in a larger number of issuers.
Management — The investment adviser to the fund and to the underlying fund actively manages the underlying fund’s investments. Consequently, the underlying fund is subject to the risk that the methods and analyses employed by the investment adviser in this process may not produce the desired results. In addition, the fund is subject to the risk that the methods employed by the subadviser in implementing the managed risk strategy may not produce the desired results. The occurrence of either or both of these events could cause the fund to lose value or its investment results to lag relevant benchmarks or other funds with similar objectives.
Your investment in the fund is not a bank deposit and is not insured or guaranteed by the Federal Deposit Insurance Corporation or any other governmental agency, entity or person. You should consider how this fund fits into your overall investment program.
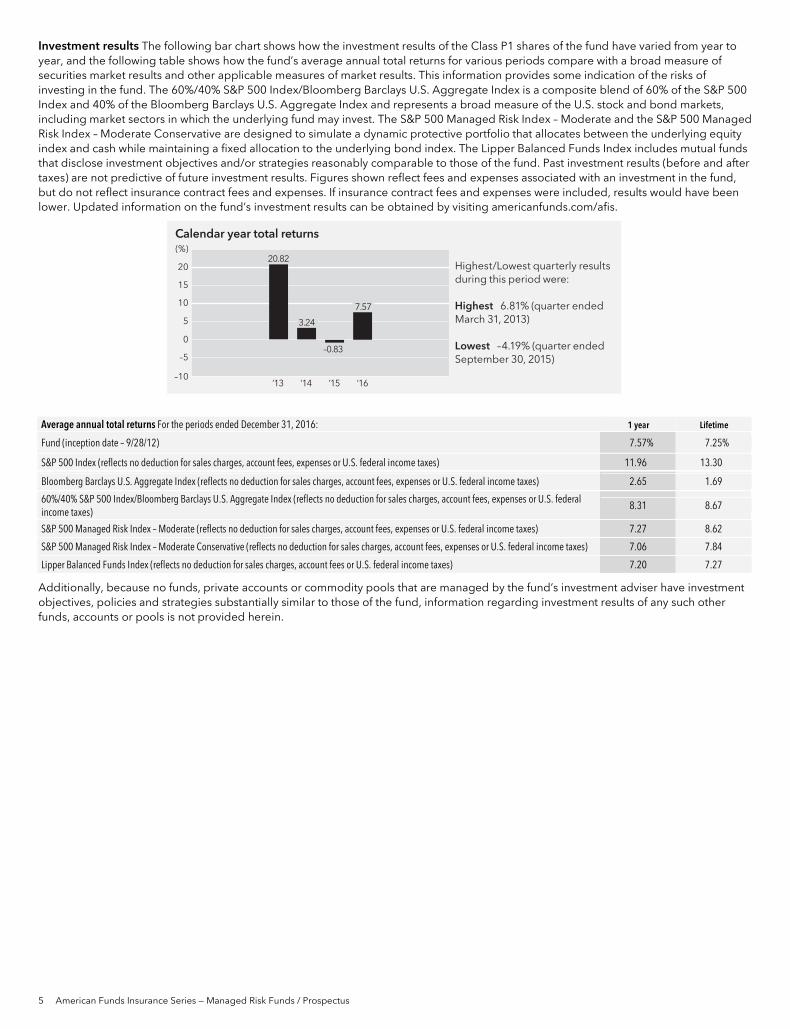
5 American Funds Insurance Series — Managed Risk Funds / Prospectus
Investment results The following bar chart shows how the investment results of the Class P1 shares of the fund have varied from year to year, and the following table shows how the fund’s average annual total returns for various periods compare with a broad measure of securities market results and other applicable measures of market results. This information provides some indication of the risks of investing in the fund. The 60%/40% S&P 500 Index/Bloomberg Barclays U.S. Aggregate Index is a composite blend of 60% of the S&P 500 Index and 40% of the Bloomberg Barclays U.S. Aggregate Index and represents a broad measure of the U.S. stock and bond markets, including market sectors in which the underlying fund may invest. The S&P 500 Managed Risk Index – Moderate and the S&P 500 Managed Risk Index – Moderate Conservative are designed to simulate a dynamic protective portfolio that allocates between the underlying equity index and cash while maintaining a fixed allocation to the underlying bond index. The Lipper Balanced Funds Index includes mutual funds that disclose investment objectives and/or strategies reasonably comparable to those of the fund. Past investment results (before and after taxes) are not predictive of future investment results. Figures shown reflect fees and expenses associated with an investment in the fund, but do not reflect insurance contract fees and expenses. If insurance contract fees and expenses were included, results would have been lower. Updated information on the fund’s investment results can be obtained by visiting americanfunds.com/afis.
Calendar year total returns
Highest/Lowest quarterly results during this period were:
Highest 6.81% (quarter ended March 31, 2013)
Lowest –4.19% (quarter ended September 30, 2015)
(%)
0
5
10
20
15
–5
’13–10
20.82
’14
3.24
’15
–0.83
7.57
’16
Average annual total returns For the periods ended December 31, 2016: 1 year Lifetime
Fund (inception date – 9/28/12) 7.57% 7.25%
S&P 500 Index (reflects no deduction for sales charges, account fees, expenses or U.S. federal income taxes) 11.96 13.30
Bloomberg Barclays U.S. Aggregate Index (reflects no deduction for sales charges, account fees, expenses or U.S. federal income taxes) 2.65 1.69
60%/40% S&P 500 Index/Bloomberg Barclays U.S. Aggregate Index (reflects no deduction for sales charges, account fees, expenses or U.S. federal income taxes)
8.31 8.67
S&P 500 Managed Risk Index – Moderate (reflects no deduction for sales charges, account fees, expenses or U.S. federal income taxes) 7.27 8.62
S&P 500 Managed Risk Index – Moderate Conservative (reflects no deduction for sales charges, account fees, expenses or U.S. federal income taxes) 7.06 7.84
Lipper Balanced Funds Index (reflects no deduction for sales charges, account fees or U.S. federal income taxes) 7.20 7.27
Additionally, because no funds, private accounts or commodity pools that are managed by the fund’s investment adviser have investment objectives, policies and strategies substantially similar to those of the fund, information regarding investment results of any such other funds, accounts or pools is not provided herein.
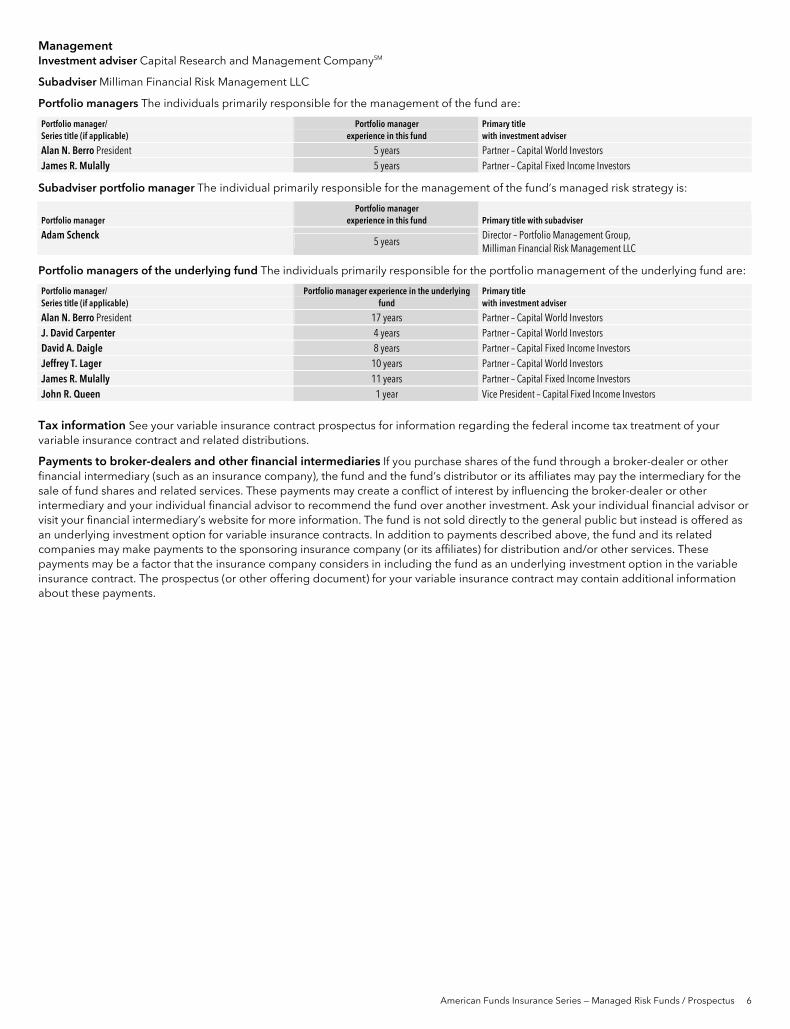
American Funds Insurance Series — Managed Risk Funds / Prospectus 6
Management Investment adviser Capital Research and Management CompanySM
Subadviser Milliman Financial Risk Management LLC
Portfolio managers The individuals primarily responsible for the management of the fund are:
Portfolio manager/ Series title (if applicable)
Portfolio manager experience in this fund
Primary title with investment adviser
Alan N. Berro President 5 years Partner – Capital World Investors James R. Mulally 5 years Partner – Capital Fixed Income Investors
Subadviser portfolio manager The individual primarily responsible for the management of the fund’s managed risk strategy is:
Portfolio manager Portfolio manager
experience in this fund Primary title with subadviser
Adam Schenck 5 years
Director – Portfolio Management Group, Milliman Financial Risk Management LLC
Portfolio managers of the underlying fund The individuals primarily responsible for the portfolio management of the underlying fund are:
Portfolio manager/ Series title (if applicable)
Portfolio manager experience in the underlying fund
Primary title with investment adviser
Alan N. Berro President 17 years Partner – Capital World Investors J. David Carpenter 4 years Partner – Capital World Investors David A. Daigle 8 years Partner – Capital Fixed Income Investors Jeffrey T. Lager 10 years Partner – Capital World Investors James R. Mulally 11 years Partner – Capital Fixed Income Investors John R. Queen 1 year Vice President – Capital Fixed Income Investors
Tax information See your variable insurance contract prospectus for information regarding the federal income tax treatment of your variable insurance contract and related distributions.
Payments to broker-dealers and other financial intermediaries If you purchase shares of the fund through a broker-dealer or other financial intermediary (such as an insurance company), the fund and the fund’s distributor or its affiliates may pay the intermediary for the sale of fund shares and related services. These payments may create a conflict of interest by influencing the broker-dealer or other intermediary and your individual financial advisor to recommend the fund over another investment. Ask your individual financial advisor or visit your financial intermediary’s website for more information. The fund is not sold directly to the general public but instead is offered as an underlying investment option for variable insurance contracts. In addition to payments described above, the fund and its related companies may make payments to the sponsoring insurance company (or its affiliates) for distribution and/or other services. These payments may be a factor that the insurance company considers in including the fund as an underlying investment option in the variable insurance contract. The prospectus (or other offering document) for your variable insurance contract may contain additional information about these payments.
7 American Funds Insurance Series — Managed Risk Funds / Prospectus
Investment objectives, strategies and risks
Managed Risk Asset Allocation Fund The fund’s investment objective is to provide high total return (including income and capital gains) consistent with preservation of capital over the long term while seeking to manage volatility and provide downside protection. While it has no present intention to do so, the fund’s board may change the fund’s investment objective without shareholder approval upon 60 days’ written notice to shareholders. The fund pursues its investment objective by investing in Class 1 shares of the American Funds Insurance Series Asset Allocation Fund, while seeking to manage portfolio volatility and risk of loss primarily through the use of exchange-traded futures contracts.
The investment objective of the underlying fund is to provide investors with high total returns (including income and capital gains) consistent with preservation of capital over the long term. The underlying fund invests in a diversified portfolio of common stocks and other equity securities, bonds and other intermediate and long-term debt securities, and money market instruments (debt securities maturing in one year or less). The underlying fund varies its mix of equity securities, debt securities and money market instruments. Under normal market conditions, the underlying fund’s investment adviser expects (but is not required) to maintain an investment mix falling within the following ranges: 40%-80% in equity securities, 20%-50% in debt securities and 0%-40% in money market instruments and cash. As of December 31, 2016, the fund was approximately 65% invested in equity securities, 27% invested in debt securities and 8% invested in money market instruments and cash. The proportion of equities, debt and money market securities held by the underlying fund varies with market conditions and the investment adviser’s assessment of their relative attractiveness as investment opportunities.
Although the underlying fund focuses on investments in medium to larger capitalization companies, its investments are not limited to a particular capitalization size. The underlying fund may invest up to 15% of its assets in common stocks and other equity securities of issuers domiciled outside the United States and up to 5% of its assets in debt securities of issuers domiciled outside the United States. In addition, the underlying fund may invest up to 25% of its debt assets in lower quality debt securities (rated Ba1 or below and BB+ or below by Nationally Recognized Statistical Rating Organizations designated by the fund’s investment adviser or unrated but determined to be of equivalent quality by the fund’s investment adviser). Such securities are sometimes referred to as “junk bonds.”
The underlying fund may also invest in certain derivative instruments. A derivative is a financial contract, the value of which is based on the value of an underlying financial asset (such as a stock, bond or currency), a reference rate or a market index. The underlying fund may invest in a derivative only if, in the opinion of its investment adviser, the expected risks and rewards of the proposed investment are consistent with the investment objectives and strategies of the underlying fund.
Among other derivative instrument types, the underlying fund may invest in futures contracts and interest rate swaps in order to seek to manage the underlying fund’s sensitivity to interest rates. As described in further detail below, a futures contract is a standardized exchange-traded agreement to buy or sell a specific quantity of an underlying asset, rate or index at an agreed-upon price at a stipulated future date. An interest rate swap is an agreement between two parties to exchange or swap payments based on changes in one or more interest rates, one of which is typically fixed and the other of which is typically a floating rate based on a designated short-term interest rate, such as the London Interbank Offered Rate, a prime rate or other benchmark.
The fund employs a risk-management overlay or managed risk strategy. The managed risk strategy consists of using hedge instruments — primarily short positions in exchange-traded futures contracts — to attempt to stabilize the volatility of the fund around a target volatility level and reduce the downside exposure of the fund during periods of significant market declines. “Volatility” in this context means variance in the fund’s investment results. The fund employs a subadviser to select individual futures contracts on equity indexes of U.S. markets and markets outside the United States that the subadviser believes are correlated to the underlying fund’s equity exposure. These instruments are selected based on the subadviser’s analysis of the relation of various equity indexes to the underlying fund’s portfolio. In addition, the subadviser will monitor liquidity levels of relevant futures contracts and transparency provided by exchanges as the counterparties in hedging transactions. The target volatility level will be set from time to time by the investment adviser and the subadviser and may be adjusted if deemed advisable in the judgment of the investment adviser and the subadviser. The subadviser will regularly adjust the level of exchange-traded futures contracts to seek to manage the overall net risk level of the fund. The subadviser may also seek to hedge the fund’s currency risk related to its exposure to equity index futures denominated in currencies other than the U.S. dollar.
A futures contract is an agreement between two parties to buy or sell a financial instrument for a set price on a future date. The short equity futures contracts increase in value as equity markets decline. The subadviser will purchase or sell futures contracts through a futures commission merchant, or FCM. Upon entering into a futures contract, the fund will be required to deposit with the FCM an amount of cash for collateral, or initial margin, that will be held at the clearinghouse or exchange in the name of the FCM. On a daily basis, the fund will be required to post additional cash with the FCM if a futures contract loses value or will receive cash if a futures contract gains in value. This cash, known as variation margin, may be held intraday at the FCM.
During periods of generally rising equity security prices, the subadviser will increase the target level of protection in the fund to seek to protect the growing value of the fund’s portfolio. During or after severe market downturns, however, the fund’s subadviser will realize gains for the fund on the fund’s short futures positions and the amount of short futures held by the fund will decrease. Even in periods of low volatility in the equity markets, the subadviser may continue to use the hedging techniques to seek to preserve gains in favorable market conditions and reduce losses in adverse market conditions. In the event of a sudden market dislocation, the managed risk strategy may not provide the same downside protection as in other periods. In addition, under certain market conditions, the subadviser reserves the right to purchase or sell exchange-traded interest rate futures, including futures contracts on U.S. Treasury bonds, to seek to manage interest rate risk.
Due to recent regulatory changes, the market for swaps is likely to move from a largely over-the-counter market to an exchange-traded market. If, in the judgment of the fund’s investment adviser and the subadviser, the exchange-traded swaps market becomes similar in depth and substance to that of the exchange-traded futures market, the subadviser may use exchange-traded swaps to seek to hedge
American Funds Insurance Series — Managed Risk Funds / Prospectus 8
interest rate risk. A swap is an agreement pursuant to which two parties agree to exchange the returns, or differential in rates of returns, earned or realized on particular predetermined interest rates, investments or instruments over a predetermined period. The risks of investing in exchange-traded swaps will be substantially similar to those of investing in exchange-traded futures.
The fund may be required to own cash or other liquid assets and post these assets with an FCM or broker as collateral to cover the fund’s obligations under its futures contracts. In situations of extreme market volatility, the short positions held in exchange-traded equity index futures could significantly reduce the fund’s net economic exposure to equity securities. In addition, during severe market dislocations the fund may adjust its managed risk strategy if advisable in the judgment of the fund’s investment adviser and subadviser. Before adjusting the fund’s managed risk strategy, the fund’s investment adviser and subadviser may consult with insurance companies that offer the fund as an underlying investment option for variable contracts; provided, however that any adjustment will be made in the judgment of the investment adviser and the subadviser. Any such adjustment may not have the desired positive effect, and could potentially have further adverse effects, on the fund’s investment results.
The success of the fund will be impacted by the results of the underlying fund. For this reason, it is important to understand the risks associated with investing both in the fund and the underlying fund.
The fund or the underlying fund may also hold cash or money market instruments, including commercial paper and short-term securities issued by the U.S. government, its agencies and instrumentalities. The fund may also hold money market fund shares as part of its cash position. The percentage of the fund or the underlying fund invested in such holdings varies and depends on various factors, including market conditions and purchases and redemptions of fund shares. The investment adviser may determine that it is appropriate to invest a substantial portion of the fund’s assets in such instruments in response to certain circumstances, such as periods of market turmoil. In addition, for temporary defensive purposes, the fund or the underlying fund may invest without limitation in such instruments. A larger amount of such holdings could moderate a fund’s investment results in a period of rising market prices. Alternatively, a larger percentage of such holdings could reduce the magnitude of a fund’s loss in a period of falling market prices and provide liquidity to make additional investments or to meet redemptions.
The fund is nondiversified, which allows it to invest a greater percentage of its assets in any one issuer than would otherwise be the case. However, through the underlying fund, the fund owns a diversified mix of securities.
The following are principal risks associated with the fund’s investment strategies.
Investing in futures contracts — In addition to the risks generally associated with investing in derivative instruments, futures contracts are subject to the creditworthiness of the clearing organizations, exchanges and futures commission merchants with which the fund transacts. Additionally, although futures require only a small initial investment in the form of a deposit of initial margin, the amount of a potential loss on a futures contract could greatly exceed the initial amount invested. While futures contracts are generally liquid instruments, under certain market conditions, futures may be deemed to be illiquid. For example, the fund may be temporarily prohibited from closing out its position in a futures contract if intraday price change limits or limits on trading volume imposed by the applicable futures exchange are triggered. If the fund is unable to close out a position on a futures contract, the fund would remain subject to the risk of adverse price movements until the fund is able to close out the futures position. The ability of the fund to successfully utilize futures contracts may depend in part upon the ability of the fund’s investment adviser or subadviser to accurately forecast interest rates and other economic factors and to assess and predict the impact of such economic factors on the futures in which the fund invests. If the investment adviser or subadviser incorrectly forecasts economic developments or incorrectly predicts the impact of such developments on the futures in which it invests, the fund could be exposed to the risk of loss.
Hedging — There may be imperfect or even negative correlation between the prices of the futures contracts and the prices of the underlying securities. For example, futures contracts may not provide an effective hedge because changes in futures contract prices may not track those of the underlying securities or indexes they are intended to hedge. In addition, there are significant differences between the securities and futures markets that could result in an imperfect correlation between the markets, causing a given hedge not to achieve its objectives. The degree of imperfection of correlation depends on circumstances such as variations in speculative market demand for futures, including technical influences in futures trading, and differences between the financial instruments being hedged and the instruments underlying the standard contracts available for trading. A decision as to whether, when and how to hedge involves the exercise of skill and judgment, and even a well-conceived hedge may be unsuccessful to some degree because of market behavior or unexpected interest rate trends. In addition, the fund’s investment in exchange-traded futures and their resulting costs could limit the fund’s gains in rising markets relative to those of the underlying fund, or to those of unhedged funds in general.
Short positions — Losses from short positions in futures contracts occur when the underlying index increases in value. As the underlying index increases in value, the holder of the short position in the corresponding futures contract is required to pay the difference in value of the futures contract resulting from the increase in the index on a daily basis. Losses from a short position in an index futures contract could potentially be very large if the value of the underlying index rises dramatically in a short period of time.
Market conditions — The prices of, and the income generated by, the securities held by the underlying fund may decline – sometimes rapidly or unpredictably – due to various factors, including events or conditions affecting the general economy or particular industries; overall market changes; local, regional or global political, social or economic instability; governmental or governmental agency responses to economic conditions; and currency exchange rate, interest rate and commodity price fluctuations.
Issuer risks — The prices of, and the income generated by, securities held by the underlying fund may decline in response to various factors directly related to the issuers of such securities, including reduced demand for an issuer’s goods or services, poor management performance and strategic initiatives such as mergers, acquisitions or dispositions and the market response to any such initiatives.
9 American Funds Insurance Series — Managed Risk Funds / Prospectus
Investing in growth-oriented stocks — Growth-oriented common stocks and other equity-type securities (such as preferred stocks, convertible preferred stocks and convertible bonds) may involve larger price swings and greater potential for loss than other types of investments. These risks may be even greater in the case of smaller capitalization stocks.
Investing in income-oriented stocks — Income provided by the underlying fund may be reduced by changes in the dividend policies of, and the capital resources available for dividend payments at, the companies in which the underlying fund invests.
Investing in debt instruments — The prices of, and the income generated by, bonds and other debt securities held by the underlying fund may be affected by changing interest rates and by changes in the effective maturities and credit ratings of these securities.
Rising interest rates will generally cause the prices of bonds and other debt securities to fall. Falling interest rates may cause an issuer to redeem, call or refinance a debt security before its stated maturity, which may result in the fund having to reinvest the proceeds in lower yielding securities. Longer maturity debt securities generally have greater sensitivity to changes in interest rates and may be subject to greater price fluctuations than shorter maturity debt securities.
Bonds and other debt securities are also subject to credit risk, which is the possibility that the credit strength of an issuer will weaken and/or an issuer of a debt security will fail to make timely payments of principal or interest and the security will go into default. Lower quality debt securities generally have higher rates of interest and may be subject to greater price fluctuations than higher quality debt securities. Credit risk is gauged, in part, by the credit ratings of the debt securities in which the underlying fund invests. However, ratings are only the opinions of the rating agencies issuing them and are not guarantees as to credit quality or an evaluation of market risk. The fund’s investment adviser relies on its own credit analysts to research issuers and issues in seeking to mitigate various credit and default risks.
Investing in lower rated debt instruments — Lower rated bonds and other lower rated debt securities generally have higher rates of interest and involve greater risk of default or price declines due to changes in the issuer’s creditworthiness than those of higher quality debt securities. The market prices of these securities may fluctuate more than the prices of higher quality debt securities and may decline significantly in periods of general economic difficulty. These risks may be increased with respect to investments in junk bonds.
Investing in securities backed by the U.S. government — Securities backed by the U.S. Treasury or the full faith and credit of the U.S. government are guaranteed only as to the timely payment of interest and principal when held to maturity. Accordingly, the current market values for these securities will fluctuate with changes in interest rates. Securities issued by government-sponsored entities and federal agencies and instrumentalities that are not backed by the full faith and credit of the U.S. government are neither issued nor guaranteed by the U.S. government.
Liquidity risk — Certain underlying fund holdings may be deemed to be less liquid or illiquid because they cannot be readily sold without significantly impacting the value of the holdings. Liquidity risk may result from the lack of an active market for a holding, legal or contractual restrictions on resale, or the reduced number and capacity of market participants to make a market in such holding. Market prices for less liquid or illiquid holdings may be volatile, and reduced liquidity may have an adverse impact on the market price of such holdings. Additionally, the sale of less liquid or illiquid holdings may involve substantial delays (including delays in settlement) and additional costs and the underlying fund may be unable to sell such holdings when necessary to meet its liquidity needs.
Investing outside the United States — Securities of issuers domiciled outside the United States, or with significant operations or revenues outside the United States, may lose value because of adverse political, social, economic or market developments (including social instability, regional conflicts, terrorism and war) in the countries or regions in which the issuers operate or generate revenue. These securities may also lose value due to changes in foreign currency exchange rates against the U.S. dollar and/or currencies of other countries. Issuers of these securities may be more susceptible to actions of foreign governments, such as the imposition of price controls or punitive taxes, that could adversely impact the value of these securities. Securities markets in certain countries may be more volatile and/or less liquid than those in the United States. Investments outside the United States may also be subject to different accounting practices and different regulatory, legal and reporting standards and practices, and may be more difficult to value, than those in the United States. In addition, the value of investments outside the United States may be reduced by foreign taxes, including foreign withholding taxes on interest and dividends. Further, there may be increased risks of delayed settlement of securities purchased or sold by the underlying fund. The risks of investing outside the United States may be heightened in connection with investments in emerging markets.
Asset allocation — The underlying fund’s percentage allocation to equity securities, debt securities and money market instruments could cause the fund to underperform relative to relevant benchmarks and other funds with similar investment objectives.
Nondiversification risk — As a nondiversified fund, the fund has the ability to invest a larger percentage of its assets in the securities of a smaller number of issuers than a diversified fund. Therefore, poor performance by a single large holding could adversely impact the fund’s investment results more than if the fund were invested in a larger number of issuers.
Management — The investment adviser to the fund and to the underlying fund actively manages the underlying fund’s investments. Consequently, the underlying fund is subject to the risk that the methods and analyses employed by the investment adviser in this process may not produce the desired results. In addition, the fund is subject to the risk that the methods employed by the subadviser in implementing the managed risk strategy may not produce the desired results. The occurrence of either or both of these events could cause the fund to lose value or its investment results to lag relevant benchmarks or other funds with similar objectives.
The following are certain additional risks associated with the fund’s investment strategies.
Interest rate risk — The values and liquidity of the securities held by the fund may be affected by changing interest rates. For example, the values of these securities may decline when interest rates rise and increase when interest rates fall. Longer maturity debt securities generally have greater sensitivity to changes in interest rates and may be subject to greater price fluctuations than shorter maturity debt
American Funds Insurance Series — Managed Risk Funds / Prospectus 10
securities. The fund may invest in variable and floating rate securities. Although the values of such securities are generally less sensitive to interest rate changes than those of other debt securities, the value of variable and floating rate securities may decline if their interest rates do not rise as quickly, or as much, as general interest rates. Conversely, floating rate securities will not generally increase in value if interest rates decline. During periods of extremely low short-term interest rates, the fund may not be able to maintain a positive yield and, given the current historically low interest rate environment, risks associated with rising rates are currently heightened.
Investing in derivatives — The use of derivatives involves a variety of risks, which may be different from, or greater than, the risks associated with investing in traditional cash securities, such as stocks and bonds. Changes in the value of a derivative may not correlate perfectly with, and may be more sensitive to market events than, the underlying asset, rate or index, and a derivative instrument may expose the fund or the underlying fund to losses in excess of its initial investment. Derivatives may be difficult for the fund or the underlying fund to buy or sell at an opportune time or price and may be difficult to terminate or otherwise offset. A fund’s use of derivatives may result in losses to the fund, and investing in derivatives may reduce the fund’s returns and increase the fund’s price volatility. A fund’s counterparty to a derivative transaction (including, if applicable, the fund’s clearing broker, the derivatives exchange or the clearinghouse) may be unable or unwilling to honor its financial obligations in respect of the transaction. A description of the derivative instruments in which the fund or the underlying fund may invest and the various risks associated with those derivatives is included in the fund’s statement of additional information under “Description of certain securities, investment techniques and risks.”
Investing in futures contracts — In addition to the risks generally associated with investing in derivative instruments, futures contracts are subject to the creditworthiness of the clearing organizations, exchanges and futures commission merchants with which the fund or the underlying fund transacts. Additionally, although futures require only a small initial investment in the form of a deposit of initial margin, the amount of a potential loss on a futures contract could greatly exceed the initial amount invested. While futures contracts are generally liquid instruments, under certain market conditions futures may be deemed to be illiquid. For example, the fund or the underlying fund may be temporarily prohibited from closing out its position in a futures contract if intraday price change limits or limits on trading volume imposed by the applicable futures exchange are triggered. If a fund is unable to close out a position on a futures contract, the fund would remain subject to the risk of adverse price movements until the fund is able to close out the futures position. The ability of the fund or the underlying fund to successfully utilize futures contracts may depend in part upon the ability of the fund’s investment adviser to accurately forecast interest rates and other economic factors and to assess and predict the impact of such economic factors on the futures in which the fund invests. If the investment adviser incorrectly forecasts economic developments or incorrectly predicts the impact of such developments on the futures in which it invests, the fund or the underlying fund could be exposed to the risk of loss.
Investing in swaps — Swaps, including interest rate swaps and credit default swap indices, or CDX, are subject to many of the risks generally associated with investing in derivative instruments. Additionally, although swaps require no or only a small initial investment in the form of a deposit of initial margin, the amount of a potential loss on a swap contract could greatly exceed the initial amount invested. The use of swaps involves the risk that the investment adviser will not accurately predict anticipated changes in interest rates or other economic factors, which may result in losses to the underlying fund. To the extent the underlying fund enters into a bilaterally negotiated swap transaction, there is a possibility that the counterparty will fail to perform in accordance with the terms of the swap agreement. If a counterparty defaults on its obligations under a swap agreement, the underlying fund may lose any amount it expected to receive from the counterparty, potentially including amounts in excess of the underlying fund’s initial investment. Certain swap transactions are subject to mandatory central clearing or may be eligible for voluntary central clearing. Although clearing interposes a central clearinghouse as the ultimate counterparty to each participant’s swap, central clearing will not eliminate (but may decrease) counterparty risk relative to uncleared bilateral swaps. Some swaps, such as CDX, may be dependent on both the individual credit of the underlying fund’s counterparty and on the credit of one or more issuers of any underlying assets. If the underlying fund does not correctly evaluate the creditworthiness of its counterparty and, where applicable, of issuers of any underlying reference assets, the underlying fund’s investment in a swap may result in losses to the underlying fund.
Exposure to country, region, industry or sector — Subject to its investment limitations, the underlying fund may have significant exposure to a particular country, region, industry or sector. Such exposure may cause the underlying fund to be more impacted by risks relating to the country, region, industry or sector than a fund without such levels of exposure. For example, if the underlying fund has significant exposure in a particular country, then social, economic, regulatory or other issues that negatively affect that country may have a greater impact on the underlying fund than on a fund that is more geographically diversified.
In addition to the principal investment strategies described above, the fund has other investment practices that are described in the statement of additional information, which includes a description of other risks related to the fund’s principal investment strategies and other investment practices. The fund’s investment results will depend on the ability of the fund’s investment adviser to navigate the risks discussed above as well as those described in the statement of additional information.

11 American Funds Insurance Series — Managed Risk Funds / Prospectus
Fund comparative indexes — The S&P 500 Index is a market capitalization-weighted index based on the results of 500 widely held common stocks. This index is unmanaged, and its results include reinvested dividends and/or distributions but do not reflect the effect of sales charges, commissions, account fees, expenses or U.S. federal income taxes. The Bloomberg Barclays U.S. Aggregate Index represents the U.S. investment-grade fixed-rate bond market. This index is unmanaged, and its results include reinvested dividends and/or distributions but do not reflect the effect of sales charges, commissions, account fees, expenses or U.S. federal income taxes. The 60%/40% S&P 500 Index/Bloomberg Barclays U.S. Aggregate Index blends the S&P 500 Index with the Bloomberg Barclays U.S. Aggregate Index by weighting their cumulative total returns at 60% and 40%, respectively. This assumes the blend is rebalanced monthly. The S&P Managed Risk Index Series is designed to simulate a dynamic protective portfolio that allocates between the underlying equity index and cash, based on realized volatilities of the underlying equity and bond indices, while maintaining a fixed allocation to the underlying bond index. These indices are generated and published under agreements between Standard and Poor’s Dow Jones Indices and Milliman Financial Risk Management LLC. These indices are unmanaged, and their results include reinvested dividends and/or distributions but do not reflect the effect of sales charges, commissions, account fees, expenses or U.S. federal income taxes. The Lipper Balanced Funds Index is an equally weighted index of funds that seek to conserve principal by maintaining a balanced portfolio of both stocks and bonds. The results of the underlying funds in the index include the reinvestment of dividends and capital gain distributions, as well as brokerage commissions paid by the funds for portfolio transactions and other fund expenses, but do not reflect the effect of sales charges, account fees or U.S. federal income taxes.
Information regarding the underlying funds For additional and more current information regarding the underlying funds, investors should read the current prospectus of the applicable underlying funds. Each of the funds described in this prospectus relies on the professional judgment of the investment adviser to the funds and to the underlying funds to make decisions about the underlying funds’ respective portfolio investments. The basic investment philosophy of the investment adviser is to seek to invest in attractively valued companies that, in its opinion, represent good, long-term investment opportunities. The investment adviser believes that an important way to accomplish this is through fundamental analysis, which may include meeting with company executives and employees, suppliers, customers and competitors. Securities may be sold when the investment adviser believes that they no longer represent relatively attractive investment opportunities.
American Funds Insurance Series — Managed Risk Funds / Prospectus 12
Management and organization Investment adviser Capital Research and Management Company, an experienced investment management organization founded in 1931, serves as the investment adviser to the Series and other mutual funds, including each of the underlying funds and the American Funds. Capital Research and Management Company is a wholly owned subsidiary of The Capital Group Companies, Inc. and is located at 333 South Hope Street, Los Angeles, California 90071. The total management fee paid by each fund to its investment adviser for the most recent fiscal year, in each case expressed as a percentage of average net assets of that fund, appears in the Annual Fund Operating Expenses table for each fund. Please see the statement of additional information for further details. A discussion regarding the basis for the approval of the Series’ Investment Advisory and Service Agreement by the Series’ board of trustees is contained in the Series’ annual report to shareholders for the fiscal year ended December 31, 2016.
Capital Research and Management Company manages equity assets through three equity investment divisions and fixed-income assets through its fixed-income investment division, Capital Fixed Income Investors. The three equity investment divisions — Capital World Investors, Capital Research Global Investors and Capital International Investors — make investment decisions independently of one another.
The equity investment divisions may, in the future, be incorporated as wholly owned subsidiaries of Capital Research and Management Company. In that event, Capital Research and Management Company would continue to be the investment adviser, and day-to-day investment management of equity assets would continue to be carried out through one or more of these subsidiaries. Although not currently contemplated, Capital Research and Management Company could incorporate its fixed-income investment division in the future and engage it to provide day-to-day investment management of fixed-income assets. Capital Research and Management Company and each of the funds it advises have received an exemptive order from the U.S. Securities and Exchange Commission that allows Capital Research and Management Company to use, upon approval of the funds’ boards, its management subsidiaries and affiliates to provide day-to-day investment management services to the funds, including making changes to the management subsidiaries and affiliates providing such services. The Series’ shareholders approved this arrangement; however, there is no assurance that Capital Research and Management Company will incorporate its investment divisions or exercise any authority granted to it under the exemptive order.
In addition, shareholders of the Series approved a proposal to reorganize the Series into a Delaware statutory trust. However, the Series reserves the right to delay implementing the reorganization.
Portfolio holdings A description of the funds’ policies and procedures regarding disclosure of information about their portfolio holdings is available in the statement of additional information.
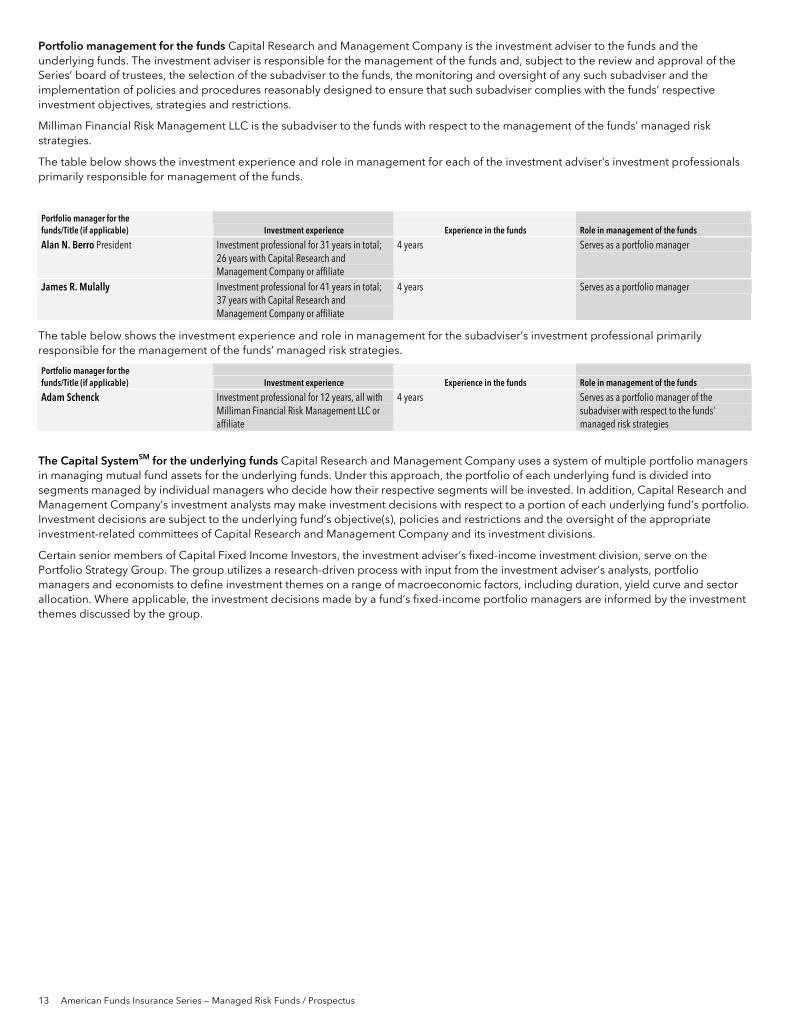
13 American Funds Insurance Series — Managed Risk Funds / Prospectus
Portfolio management for the funds Capital Research and Management Company is the investment adviser to the funds and the underlying funds. The investment adviser is responsible for the management of the funds and, subject to the review and approval of the Series’ board of trustees, the selection of the subadviser to the funds, the monitoring and oversight of any such subadviser and the implementation of policies and procedures reasonably designed to ensure that such subadviser complies with the funds’ respective investment objectives, strategies and restrictions.
Milliman Financial Risk Management LLC is the subadviser to the funds with respect to the management of the funds’ managed risk strategies.
The table below shows the investment experience and role in management for each of the investment adviser’s investment professionals primarily responsible for management of the funds.
Portfolio manager for the funds/Title (if applicable) Investment experience Experience in the funds Role in management of the funds
Alan N. Berro President Investment professional for 31 years in total; 26 years with Capital Research and Management Company or affiliate
4 years Serves as a portfolio manager
James R. Mulally Investment professional for 41 years in total; 37 years with Capital Research and Management Company or affiliate
4 years Serves as a portfolio manager
The table below shows the investment experience and role in management for the subadviser’s investment professional primarily responsible for the management of the funds’ managed risk strategies.
Portfolio manager for the funds/Title (if applicable) Investment experience Experience in the funds Role in management of the funds
Adam Schenck Investment professional for 12 years, all with Milliman Financial Risk Management LLC or affiliate
4 years Serves as a portfolio manager of the subadviser with respect to the funds’ managed risk strategies
The Capital SystemSM for the underlying funds Capital Research and Management Company uses a system of multiple portfolio managers in managing mutual fund assets for the underlying funds. Under this approach, the portfolio of each underlying fund is divided into segments managed by individual managers who decide how their respective segments will be invested. In addition, Capital Research and Management Company’s investment analysts may make investment decisions with respect to a portion of each underlying fund’s portfolio. Investment decisions are subject to the underlying fund’s objective(s), policies and restrictions and the oversight of the appropriate investment-related committees of Capital Research and Management Company and its investment divisions.
Certain senior members of Capital Fixed Income Investors, the investment adviser’s fixed-income investment division, serve on the Portfolio Strategy Group. The group utilizes a research-driven process with input from the investment adviser’s analysts, portfolio managers and economists to define investment themes on a range of macroeconomic factors, including duration, yield curve and sector allocation. Where applicable, the investment decisions made by a fund’s fixed-income portfolio managers are informed by the investment themes discussed by the group.
American Funds Insurance Series — Managed Risk Funds / Prospectus 14
Purchases and redemptions of shares Shares of the Series are currently offered only to insurance company separate accounts as well as so-called “feeder funds” under master-feeder arrangements sponsored by insurance companies as underlying investments for such insurance companies’ variable annuity contracts and variable life insurance policies. All such shares may be purchased or redeemed by the insurance company separate accounts (or feeder funds) at net asset value without any sales or redemption charges. These purchases and redemptions are made at the price next determined after such purchases and redemptions of units of the separate accounts (or feeder funds).
Frequent trading of fund shares The Series and American Funds Distributors, Inc., the Series’ distributor, reserve the right to reject any purchase order for any reason. The funds are not designed to serve as vehicles for frequent trading. Frequent trading of fund shares may lead to increased costs to the funds and less efficient management of the funds’ portfolios, potentially resulting in dilution of the value of the shares held by long-term shareholders. Accordingly, purchases, including those that are part of exchange activity, that the Series or American Funds Distributors has determined could involve actual or potential harm to a fund may be rejected.
The Series, through its transfer agent, American Funds Service Company, has agreements with the Series’ insurance relationships to maintain its surveillance procedures that are designed to detect frequent trading in fund shares. The agreements generally require the insurance companies to (i) provide, upon request from a fund, the Series or their agent, certain identifying and account information regarding contract owners who invest in fund shares through an insurance company account and (ii) execute instructions from a fund, the Series or their agent to restrict further purchases or exchanges of fund shares by a contract owner who the Series has identified as having engaged in potentially harmful market timing or frequent trading. Under these procedures, various analytics are used to evaluate factors that may be indicative of frequent trading. For example, transactions in fund shares that exceed certain monetary thresholds may be scrutinized. American Funds Service Company may work with the insurance company separate accounts or feeder funds to apply their procedures that American Funds Service Company believes are reasonably designed to enforce the frequent trading policies of the Series. You should refer to disclosures provided by the insurance company with which you have a contract to determine the specific trading restrictions that apply to you.
Under its procedures, American Funds Service Company also may review transactions that occur close in time to other transactions in the same account or in multiple accounts under common ownership or influence. Trading activity that is identified through these procedures or as a result of any other information available to the funds will be evaluated to determine whether such activity might constitute frequent trading. These procedures may be modified from time to time as appropriate to improve the detection of frequent trading, to facilitate monitoring for frequent trading in particular retirement plans or other accounts and to comply with applicable laws.
In addition to the Series’ broad ability to restrict potentially harmful trading as described previously, the Series’ board of trustees has adopted a “purchase blocking policy” under which any contract owner redeeming units representing a beneficial interest in any fund (including redemptions that are part of an exchange transaction) having a value of $5,000 or more will be precluded from investing units of beneficial interest in that fund (including investments that are part of an exchange transaction) for 30 calendar days after the redemption transaction. Under this purchase blocking policy, certain purchases will not be prevented and certain redemptions will not trigger a purchase block, such as:
• purchases and redemptions of units representing a beneficial interest in a fund having a value of less than $5,000;
• retirement plan contributions, loans and distributions (including hardship withdrawals) identified as such on the retirement plan recordkeeper’s system;
• purchase transactions involving in-kind transfers of fund shares, if the entity maintaining the contract owner’s account is able to identify the transaction as one of these types of transactions; and
• systematic redemptions and purchases if the entity maintaining the contract owner’s account is able to identify the transaction as a systematic redemption or purchase.
Generally, purchases and redemptions will not be considered “systematic” unless the transaction is prescheduled for a specific date.
The Series reserves the right to waive the purchase blocking policy if American Funds Service Company determines that its surveillance procedures are adequate to detect frequent trading in fund shares in such accounts.
If American Funds Service Company identifies any activity that may constitute frequent trading, it reserves the right to contact the insurance company separate account or feeder fund and request that the separate account or feeder fund either provide information regarding an account owner’s transactions or restrict the account owner’s trading. If American Funds Service Company is not satisfied that insurance company separate account or feeder fund has taken appropriate action, American Funds Service Company may terminate the separate account’s or feeder fund’s ability to transact in fund shares.
There is no guarantee that all instances of frequent trading in fund shares will be prevented.
Notwithstanding the Series’ surveillance procedures and purchase blocking policy described above, all transactions in fund shares remain subject to the right of the Series, American Funds Distributors and American Funds Service Company to restrict potentially abusive trading generally (including the types of transactions described above that will not be prevented or trigger a block under the purchase blocking policy). See the statement of additional information for more information about how American Funds Service Company may address other potentially abusive trading activity in the Series.
15 American Funds Insurance Series — Managed Risk Funds / Prospectus
Valuing shares The net asset value of each share class of each fund is calculated based in part upon the net asset value of the share class of the underlying funds in which the fund invests. The prospectus for each underlying fund explains the circumstances under which the underlying fund will use fair value pricing and the effects of using fair value pricing. The net asset value of each share class of a fund is the value of a single share of that class. Each fund calculates the net asset value each day the New York Stock Exchange is open for trading as of approximately 4 p.m. New York time, the normal close of regular trading. If, for example, the New York Stock Exchange closes at 1 p.m. New York time, the funds’ net asset values would still be determined as of 4 p.m. New York time. In this example, portfolio securities traded on the New York Stock Exchange would be valued at their closing prices unless the investment adviser determines that a “fair value” adjustment is appropriate due to subsequent events.
Equity securities are valued primarily on the basis of market quotations, and debt securities are valued primarily on the basis of prices from third-party pricing services. Futures contracts are valued primarily on the basis of settlement prices. The underlying funds have adopted procedures for making fair value determinations if market quotations or prices from third-party pricing services, as applicable, are not readily available or are not considered reliable. For example, if events occur between the close of markets outside the United States and the close of regular trading on the New York Stock Exchange that, in the opinion of the investment adviser, materially affect the value of any of the underlying funds’ equity securities that trade principally in those international markets, those securities will be valued in accordance with fair value procedures. Similarly, fair value procedures may be employed if an issuer defaults on its debt securities and there is no market for its securities. Use of these procedures is intended to result in more appropriate net asset values and, where applicable, to reduce potential arbitrage opportunities otherwise available to short-term investors.
Because the underlying funds may hold securities that are listed primarily on foreign exchanges that trade on weekends or days when the funds do not price their shares, the values of securities held in the funds may change on days when you will not be able to purchase or redeem fund shares.
Shares of the funds will be purchased or sold at the net asset value next determined after receipt of requests from the appropriate insurance company. Requests received by the appropriate insurance company prior to 4 p.m. New York time and communicated by the insurance company to the Series or its agent will be purchased or sold at that day’s net asset value.

American Funds Insurance Series — Managed Risk Funds / Prospectus 16
Plan of distribution The Series has adopted a plan of distribution for Class P1 shares under which it may finance activities intended primarily to sell shares, provided that the categories of expenses are approved in advance by the Series’ board of trustees. The plan provides for annual expenses of .25% for Class P1 shares; however, the Series’ board of trustees has not authorized any payments under the plan.
Fund expenses In periods of market volatility, assets of the funds and/or the applicable underlying funds may decline significantly, causing total annual fund operating expenses (as a percentage of the value of your investment) to become higher than the numbers shown in the Annual Fund Operating Expenses tables in this prospectus.
Each fund will invest in Class 1 shares of the applicable underlying fund. Accordingly, fees and expenses of the underlying fund reflect current expenses of the Class 1 shares of the underlying fund. The “Other expenses” items in the Annual Fund Operating Expenses tables in this prospectus are based on expenses as of each fund’s most recently completed fiscal year. These items include third-party expenses, such as custodial, legal, audit, accounting, regulatory reporting and pricing vendor services, and an administrative services fee provided by the insurance companies that include the funds as an underlying investment in their variable contracts. Each fund will pay an insurance administration fee of .25% to these insurance companies for providing certain services pursuant to an insurance administrative services plan adopted by the Series.
Investment results All fund results in the “Investment results” section of this prospectus reflect the reinvestment of dividends and capital gains distributions, if any. Unless otherwise noted, fund results reflect any fee waivers and/or expense reimbursements in effect during the period presented.
Distributions and taxes Each fund of the Series intends to qualify as a “regulated investment company” under the Internal Revenue Code. In any fiscal year in which a fund so qualifies and distributes to shareholders its investment company taxable income and net realized capital gain, the fund itself is relieved of federal income tax.
It is the Series’ policy to distribute to the shareholders (the insurance company separate accounts) all of its investment company taxable income and capital gain for each fiscal year.
See the applicable contract prospectus for information regarding the federal income tax treatment of the contracts and distributions to the separate accounts.
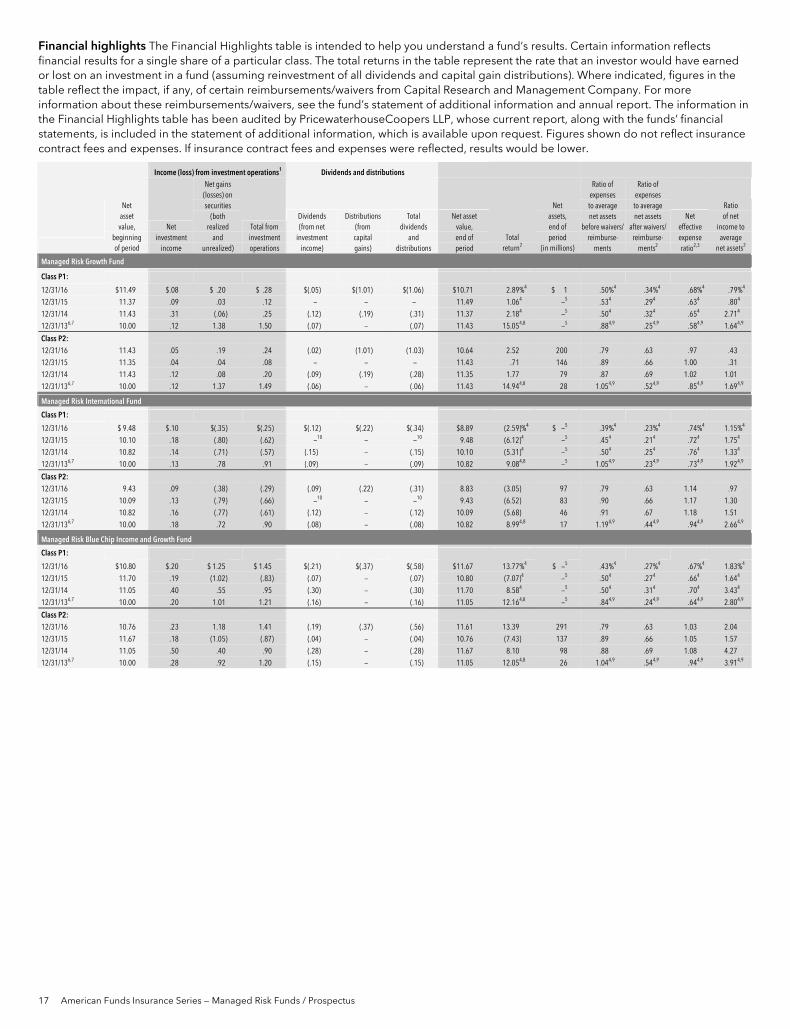
17 American Funds Insurance Series — Managed Risk Funds / Prospectus
Financial highlights The Financial Highlights table is intended to help you understand a fund’s results. Certain information reflects financial results for a single share of a particular class. The total returns in the table represent the rate that an investor would have earned or lost on an investment in a fund (assuming reinvestment of all dividends and capital gain distributions). Where indicated, figures in the table reflect the impact, if any, of certain reimbursements/waivers from Capital Research and Management Company. For more information about these reimbursements/waivers, see the fund’s statement of additional information and annual report. The information in the Financial Highlights table has been audited by PricewaterhouseCoopers LLP, whose current report, along with the funds’ financial statements, is included in the statement of additional information, which is available upon request. Figures shown do not reflect insurance contract fees and expenses. If insurance contract fees and expenses were reflected, results would be lower.
Income (loss) from investment operations1 Dividends and distributions
Net asset value,
beginning of period
Net investment
income
Net gains (losses) on securities
(both realized
and unrealized)
Total from investment operations
Dividends (from net
investment income)
Distributions (from capital gains)
Total dividends
and distributions
Net asset value, end of period
Total return2
Net assets, end of period
(in millions)
Ratio of expenses to average net assets
before waivers/ reimburse-
ments
Ratio of expenses
to average net assets
after waivers/ reimburse-
ments2
Net effective expense ratio2,3
Ratio of net
income to average
net assets2
Managed Risk Growth Fund
Class P1: 12/31/16 $11.49 $.08 $ .20 $ .28 $(.05) $(1.01) $(1.06) $10.71 2.89%4 $ 1 .50%4 .34%4 .68%4 .79%4 12/31/15 11.37 .09 .03 .12 — — — 11.49 1.064 —5 .534 .294 .634 .804 12/31/14 11.43 .31 (.06) .25 (.12) (.19) (.31) 11.37 2.184 —5 .504 .324 .654 2.714 12/31/136,7 10.00 .12 1.38 1.50 (.07) — (.07) 11.43 15.054,8 —5 .884,9 .254,9 .584,9 1.644,9
Class P2: 12/31/16 11.43 .05 .19 .24 (.02) (1.01) (1.03) 10.64 2.52 200 .79 .63 .97 .43 12/31/15 11.35 .04 .04 .08 — — — 11.43 .71 146 .89 .66 1.00 .31 12/31/14 11.43 .12 .08 .20 (.09) (.19) (.28) 11.35 1.77 79 .87 .69 1.02 1.01 12/31/136,7 10.00 .12 1.37 1.49 (.06) — (.06) 11.43 14.944,8 28 1.054,9 .524,9 .854,9 1.694,9
Managed Risk International Fund
Class P1: 12/31/16 $ 9.48 $.10 $(.35) $(.25) $(.12) $(.22) $(.34) $8.89 (2.59)%4 $ —5 .39%4 .23%4 .74%4 1.15%4 12/31/15 10.10 .18 (.80) (.62) —10 — —10 9.48 (6.12)4 —5 .454 .214 .724 1.754 12/31/14 10.82 .14 (.71) (.57) (.15) — (.15) 10.10 (5.31)4 —5 .504 .254 .764 1.334 12/31/136,7 10.00 .13 .78 .91 (.09) — (.09) 10.82 9.084,8 —5 1.054,9 .234,9 .734,9 1.924,9
Class P2: 12/31/16 9.43 .09 (.38) (.29) (.09) (.22) (.31) 8.83 (3.05) 97 .79 .63 1.14 .97 12/31/15 10.09 .13 (.79) (.66) —10 — —10 9.43 (6.52) 83 .90 .66 1.17 1.30 12/31/14 10.82 .16 (.77) (.61) (.12) — (.12) 10.09 (5.68) 46 .91 .67 1.18 1.51 12/31/136,7 10.00 .18 .72 .90 (.08) — (.08) 10.82 8.994,8 17 1.194,9 .444,9 .944,9 2.664,9
Managed Risk Blue Chip Income and Growth Fund
Class P1:
12/31/16 $10.80 $.20 $ 1.25 $ 1.45 $(.21) $(.37) $(.58) $11.67 13.77%4 $ —5 .43%4 .27%4 .67%4 1.83%4 12/31/15 11.70 .19 (1.02) (.83) (.07) — (.07) 10.80 (7.07)4 —5 .504 .274 .664 1.644 12/31/14 11.05 .40 .55 .95 (.30) — (.30) 11.70 8.584 —5 .504 .314 .704 3.434 12/31/136,7 10.00 .20 1.01 1.21 (.16) — (.16) 11.05 12.164,8 —5 .844,9 .244,9 .644,9 2.804,9
Class P2: 12/31/16 10.76 .23 1.18 1.41 (.19) (.37) (.56) 11.61 13.39 291 .79 .63 1.03 2.04 12/31/15 11.67 .18 (1.05) (.87) (.04) — (.04) 10.76 (7.43) 137 .89 .66 1.05 1.57 12/31/14 11.05 .50 .40 .90 (.28) — (.28) 11.67 8.10 98 .88 .69 1.08 4.27 12/31/136,7 10.00 .28 .92 1.20 (.15) — (.15) 11.05 12.054,8 26 1.044,9 .544,9 .944,9 3.914,9
American Funds Insurance Series — Managed Risk Funds / Prospectus 18
Income (loss) from investment operations1 Dividends and distributions
Net asset value,
beginning of period
Net investment
income
Net gains (losses) on securities
(both realized
and unrealized)
Total from investment operations
Dividends (from net
investment income)
Distributions (from capital gains)
Total dividends
and distributions
Net asset value, end of period
Total return2
Net assets, end of period
(in millions)
Ratio of expenses to average net assets
before waivers/ reimburse-
ments
Ratio of expenses
to average net assets
after waivers/ reimburse-
ments2
Net effective expense ratio2,3
Ratio of net
income to average
net assets2
Managed Risk Growth-Income Fund
Class P1:
12/31/16 $11.25 $ .16 $ .52 $ .68 $(.16) $(.70) $(.86) $11.07 6.49%4 $ 1 .52%4 .36%4 .64%4 1.46%4 12/31/15 11.67 .25 (.63) (.38) (.04) — (.04) 11.25 (3.27)4 1 .564 .314 .594 2.174 12/31/14 11.50 .35 .21 .56 (.14) (.25) (.39) 11.67 4.854 —5 .454 .254 .524 2.944 12/31/136,7 10.00 .14 1.47 1.61 (.11) — (.11) 11.50 16.154,8 —5 .924,9 .234,9 .504,9 2.014,9
Class P2: 12/31/16 11.22 .12 .52 .64 (.14) (.70) (.84) 11.02 6.08 160 .79 .63 .91 1.13 12/31/15 11.65 .12 (.54) (.42) (.01) — (.01) 11.22 (3.64) 122 .89 .66 .94 1.04 12/31/14 11.50 .16 .35 .51 (.11) (.25) (.36) 11.65 4.42 76 .87 .69 .96 1.38 12/31/136,7 10.00 .20 1.40 1.60 (.10) — (.10) 11.50 16.044,8 24 1.094,9 .504,9 .774,9 2.734,9
Managed Risk Asset Allocation Fund
Class P1: 12/31/16 $11.72 $.19 $ .67 $ .86 $(.19) $(.37) $(.56) $12.02 7.57% $1,217 .43% .38% .66% 1.65% 12/31/15 12.29 .25 (.34) (.09) (.22) (.26) (.48) 11.72 (.83) 712 .54 .40 .68 2.06 12/31/14 11.93 .13 .26 .39 (.03) — (.03) 12.29 3.24 277 .53 .48 .76 1.04 12/31/13 9.99 .27 1.81 2.08 (.14) — (.14) 11.93 20.824 112 .554 .474 .754 2.374 12/31/126,11 10.00 .15 (.03) .12 (.13) — (.13) 9.99 1.244,8 —5 .154,9 .074,9 .374,9 1.724,9
Class P2:
12/31/16 11.71 .14 .69 .83 (.16) (.37) (.53) 12.01 7.27 2,342 .68 .63 .91 1.20 12/31/15 12.27 .14 (.26) (.12) (.18) (.26) (.44) 11.71 (1.07) 1,953 .79 .66 .94 1.16 12/31/14 11.93 .16 .19 .35 (.01) — (.01) 12.27 2.91 1,780 .79 .73 1.01 1.33 12/31/13 9.99 .28 1.77 2.05 (.11) — (.11) 11.93 20.584 795 .804 .734 1.014 2.434 12/31/126,11 10.00 .17 (.05) .12 (.13) — (.13) 9.99 1.214,8 —5 .244,9 .114,9 .414,9 2.384,9
Period ended December 31 Portfolio turnover rate for all share classes 2016 2015 2014 2013 2012
Managed Risk Growth Fund 15% 16% 22% 10%7,8
Managed Risk International Fund 26 15 22 67,8
Managed Risk Blue Chip Income and Growth Fund 9 20 22 37,8
Managed Risk Growth-Income Fund 14 11 28 27,8
Managed Risk Asset Allocation Fund 3 3 3 3 —8,11,12
1 Based on average shares outstanding. 2 This column reflects the impact of certain waivers/reimbursements by Capital Research and Management Company. Capital Research and Management Company
waived a portion of investment advisory services and reimbursed a portion of miscellaneous fees and expenses for the managed risk funds. 3 Ratio reflects weighted average net expense ratio of the underlying fund for the period presented. See Expense Example for further information regarding fees and
expenses. 4 All or a significant portion of assets in this class consisted of seed capital invested by Capital Research and Management Company and/or its affiliates. Certain fees
(including, where applicable, fees for distribution services) are not charged or accrued on these seed capital assets. If such fees were paid by the fund on seed capital assets, fund expenses would have been higher and net income and total return would have been lower.
5 Amount less than $1 million. 6 Based on operations for the period shown and, accordingly, is not representative of a full year. 7 For the period May 1, 2013, commencement of operations, through December 31, 2013. 8 Not annualized. 9 Annualized. 10 Amount less than $.01. 11 For the period September 28, 2012, commencement of operations, through December 31, 2012. 12 Amount less than 1%.

[THIS PAGE INTENTIONALLY LEFT BLANK.]

Investment Company File No. 811-03857
Other fund information Shares of the Series are currently offered to insurance company separate accounts funding both variable annuity contracts and variable life insurance policies. Interests of various contract owners participating in the Series may be in conflict. The board of trustees of the Series will monitor for the existence of any material conflicts and determine what action, if any, should be taken. Shares may be purchased or redeemed by the separate accounts without any sales or redemption charges at net asset value.
Annual/Semi-annual report to shareholders The shareholder reports contain additional information about the Series, including financial statements, investment results, portfolio holdings, a discussion of market conditions and the Series’ investment strategies, and the independent registered public accounting firm’s report (in the annual report).
Statement of additional information (SAI) and codes of ethics The current SAI, as amended from time to time, contains more detailed information about the Series, including the funds’ financial statements, and is incorporated by reference into this prospectus. This means that the current SAI, for legal purposes, is part of this prospectus. The codes of ethics describe the personal investing policies adopted by the Series, the Series’ investment adviser and its affiliated companies.
The codes of ethics and current SAI are on file with the U.S. Securities and Exchange Commission (SEC). These and other related materials about the Series are available for review or to be copied at the SEC’s Public Reference Room in Washington, D.C., (202) 551-8090, on the EDGAR database on the SEC’s website at sec.gov or, after payment of a duplicating fee, via email request to [email protected] or by writing to the SEC’s Public Reference Section, 100 F Street, NE, Washington, D.C. 20549-1520.
The current SAI and annual/semi-annual reports to shareholders can be found online at americanfunds.com/afis and may be available on the website of the company that issued your insurance contract. You also may request a free copy of these documents or the codes of ethics by calling American Funds at (800) 421-9900, ext. 65413 or writing to the Secretary at 333 South Hope Street, Los Angeles, California 90071.
M3179MF.6 (05/17)