saturn sa-3 flight evaluation volume i, mpr-sat-63...
TRANSCRIPT
r._...... MPR_Si%T163_ 1
"" .january 8, 1963
i" i"
8P,dC£FLICHT HUNTSVILLE, ALABAMA
CENTER
SATURN SA-3 FLIGHT EVALUATION
VOLUME I
Zs<
-J-_-3/
o/-o_-__ _SFC _P_- 5,qTo_3-1 f_ 5_r C_d_ ) i_ C
NATIONALAERONAUTICSANDSPACEADMINISTRATION
MBIeC - Fwm 774 (Re,e lrelMuas.y Ig61)

<i_!/
!
SECURITY NOTE
This document contains information affecting the national
defense of the United States within the meaning of the Espionage Law,
Title 18, U.S.C., Sections 793 and 794 as amended. The revelationof its contents in any manner to an unauthorized person is prohibited
by law.
GEORGE C. MARSHALL SPACE FLIGHT CENTER
MPR-SAT- 63 -I
i
I SATURN SA-3 FLIGHT EVALUATION0
By Saturn Flight Evaluation Working Group
(U) ABSTRACT
The evaluation of the Saturn SA-3 test flight is presented in two
volumes. The first volmne contains the results of the early engineer-
ing evaluation and the second volume contalns supporting informationand information related to the evaluation of the flight. In these
volumes the performance of each major vehicle system is discussed with
special emphasis on malfunctions and deviations.
The SA-3 flight test was a complete success with all missions of
the test being accomplished. No major malfunctions or deviations whichwould be considered a serious system failure or design deficiency
occurred.
_!!_ Any questions or comments pertaining to the information contained
_ in this report are invited and should be directed to
Director, George C. Marshall Space Flight Center
Huntsville, Alah_aAttention: Chairman_ Flight Evaluation Working Group,
M-AERO-F (Phone 876-2701)
o,
GEORGE C. MARSHALL SPACE FLIGHT CENTER
_ MPR-SAT-63-1
VOLI_IE I
SATURN SA-3 FLIGHT EVALUATION (U)
\
WORKING GROUP

(v) ACKNOWLEDGEMENT
Acknowledgement is made to the various divisions and elements of
MSFC and Launch Operations Center for their contributions to this
report. Without the assistance and cooperation of these elements this
integrated report would not have been possible. The Saturn Flight
Evaluation Working Group is especially indebted to the followingbranches (of MSFC) which have made major contributions:
Aeroballlstics Division
Aerodynsmics Branch
Aerophysies and Astrophysics Branch
Dynamic Analysis Branch
Flight Evaluation Branch
Astriunics Division
Electrical Systems Integration BranchFlight Dynamics Branch
Guidance and Control _ystems BranchGyro and Stabilizer Branch
instrumentation Development Branch
Computation Division
Data Reduction Branch
Launch Vehicle Operations Division
Electronic Engineering, Measuring and Tracking OfficeMechanical, Structural and Propulsion Office
Propulsion and Vehicle Engineering Division
Propulsion and Mechanics BranchStructures Branch
Vehicle Engineering Branch
i_ (u) TABLE OF CONTENTS
Page
1.0 Flight Test Summary z 1i.I Flight Test Results 1
,_ • 1.2 Test Objectives 3
_ _ 1.3 Times of Flight Events 5
2.0 Introduction 7
3.0 Launch Operations 8
3.1 Smnmary 83.2 Prelaunch Milestones 8
3.3 Prelaunch Atmospheric Surface Conditions 93.4 Countdown 93.5 Holddown ii
3.6 Launch Complex and Ground Support Equipment Ii
4.0 Trajectory 144.1 Stmmnary 14
4.2 Trajectory Analysis 14
4.3 Actual and Predicted Trajectory 14
4.3.1 Powered Flight 144.3.2 Cutoff 15
4.4 Retro Rockets 22
4.5 Water Release (Destruct) 22
5.0 Propulsion 23
5.1 Summary 23
5.2 Individual Engine Performance 23
5.3 Vehicle Propulsion System Performance 24
5.4 Pressurization Systems 325.4.1 Fuel Tank Pressurization 32
5.4.2 LOX Tank Pressurization 32
5.4.3 Control Pressure System 33
5.4.4 Air Bearing Supply 33
5.5 Vehicle Propellant Utilization 33
5.6 Hydraulic System 355.7 Retro Rocket Performance 35
__ 6.0 Mass Characteristics 39
6.1 Vehicle Weights 39
6.2 Vehicle Center of Gravity and Moments of Inertia 39
v

TLE OFCOS (CONT')
Page
7.0 Control 43
7.1 Summary 43
7.2 S-I Control Analysis 447.2.1 Pitch Plane 44
7.2.2 Yaw Plane 50
7.2.3 Roll Plane 50
7.2.4 Attitude and Control After Cutoff 56
7.3 Functional Analysis 577.3.1 Control Sensors 57
7.3.2 Control Computer 627.3.3 Actuators 62
7.3.4 ST-124P Stabilized Platform Attit_des 647.4 Propellant Sloshing 68
8.0 Guidance 73
8.1 Su.mmry 73
8.2 Description of Guidance System 73
8.2.1 STy90 Guidance System 73
8.2.2 ST-124P Guidance System 74
8.3 Operational Analysis 75
8.3.1 Guidance Intelligence Errors 75
8.3.2 Accelerometer Outputs (ST-90) 75
8.3.3 Accelerometer Outputs (ST-124P) 798.4 Functional Analysis 82
8.4.1 Guidance Sensors 82
8.4.2 Velocity Encoders and Signal Processor
Repeaters 838.4.3 ST-90 Stabilized Platform 85
9.0 Vehicle Electrical System 88
9.1 Su_nary 88
9.2 Flight Results 88
i0.0 Structures and Vibrations 91
10.1 Summary 91
10.2 BendlngMoments and Normal Load Factors 9110.2.1 Instrumentation 91
10.2.2 Moment Loads 91 .
10.3 Longitudinal Loads 92
10.4 Bending Oscillations 9710.5 Vibrations 97
I
vi
....
(u) TABLEOFcocrmvrs (cmcr')
Page
10.5.1 Smm.ary of Vibration Data 9710.5.2 Instrumentation 102
_ • 10.5.3 Discussion of Vibration Measurements 10210.6 Vehicle Acoustic Measurements 106
11.0 Environmental Temperatures and Pressures i08
. ii.I Summary 10811.2 Tail Section 108
11.2.1 Base Environment 108
11.2.2 Engine Compartment 11911.2.3 Forward Heat and Flame Shield 119
11.3 Skin 119
11.4 Instrument Canister 122
11.4.1 Canister Pressure 122
11.4.2 Canister Temperature 122
12.0 Aerodynamics 12512. I Summary 125
12.2 Ratio of Gradients of Angular Acceleration
(Stability Ratio) 12512.3 Gradient of Normal Force Coefficient and
Center of Pressure Location 125
12.4 Surface Pressure 127
12.4.1 Station 205 Measurements 12712.4.2 Station 860 and 863 Measurements 127
12.4.3 Station 989 and 1019 131
12.4.4 Centaur Simulation Pressures 131
13.0 Instrumentation 136
13.1 Su_mary 136
13.2 Measuring Analysis 136
13.3 Telemetry Systems Analysis 138
13.4 RF SystemsAnalysis 139
13.4.1 Telemetry 13913.4.2 UDOP 141
: 13.4.3 Azusa 14313.4.4 C-Band Radar 146
i 14.O Summary of Malfunctions and Deviations 148_ vii
(_) TABLEoF CONTENTS(cotrr')
Page
15.0 Special Missions 15115.1 Project Highwater 15115.2 Horizon Scanner 151
15.3 Other Special Missions 151
viii
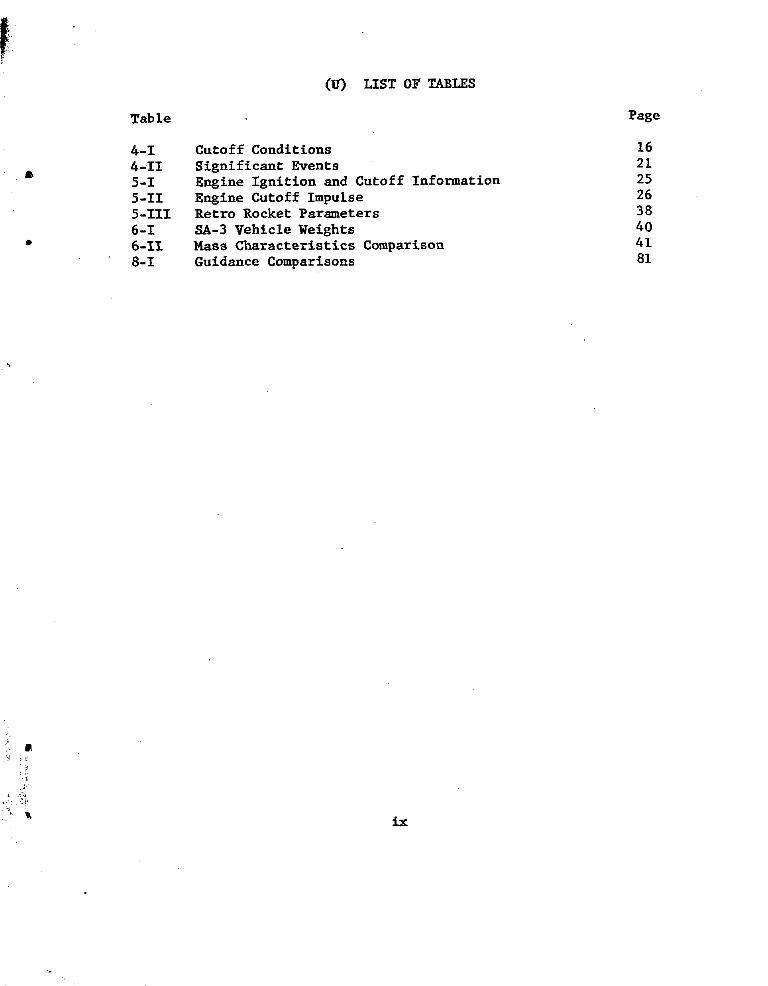
!i(U) LIST OF TABLES
Table Page
4-I Cutoff Conditions 16
4-II Significant Events 2185-I Engine Ignition and Cutoff Information 25
5-II Engine Cutoff Impulse 265-I_I Retro Rocket Parameters 38
6-I SA-3 Vehicle Weights 40
• 6-II Mass Characteristics Comparison 418-I Guidance Comparisons 81
L? _ ix
_ (u) LiarOF FIGm_S
Figure Page
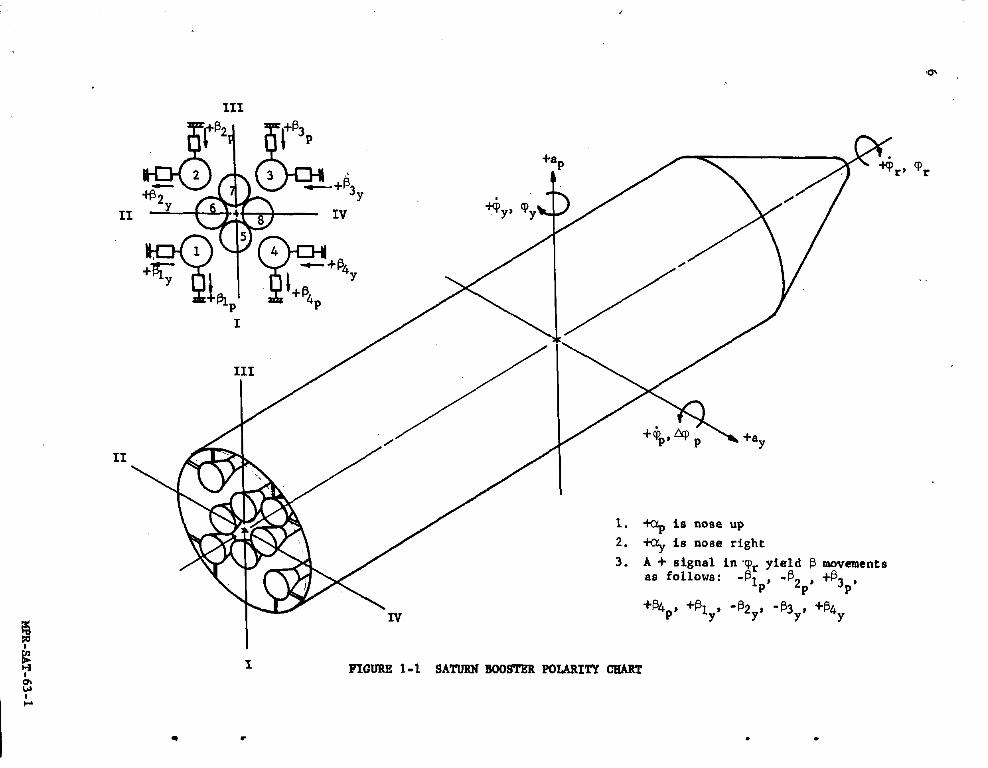
I-i Saturn Booster Polarity Chart 63-1 Countdown Time In Minutes i0
4-i Trajectory i 17
4-2 Earth-Fixed Velocity 18
4-3 Dynamic Pressure and Mach Number 19
4-4 Longitudinal Acceleration 20
5-1 Chamber Pressure Build-Up 28
5"-2 Outboard EngineThrust Decay 29
5-3 Vehicle Thrust and Specific Impulse 305-4 Vehicle Mixture Ratio and Total Plow Rate- 31
5_5 Typical Retro Rocket Chamber Thrust 36
6-1 Vehicle Weight, Longitudinal Center of Gravity andMass Moments of Inertia Versus Range Time 42
• 7-1 Pitch Attitude, Angular Velocity and Average ActuatorPosition 45
7-2 Tilt Program and Pitch Velocity Vector Angle 46
7-3 Pitch Plane WindComponents and Free-StreamAngle-of-Attack 48
7-4 Pitch Angle Design Criteria (8 Englnes Operating
with 7 Engine Tilt Program) 49
7-5 Yaw Attitude, Angular.Velocity and AverageActuator Position 51
7-6 Yaw Plane Wind Component and Free-Stream
Angle-of-Attack 52
7-7 Roll Attitude and Average Actuator Positions 54
7-8 Comparison of Roll Angle Deviations for SA-I, SA-2and SA-3 55
7-9 Roll During Retro Rocket Firing 58_: 7-10 Pitch and Yaw Control Acceleratlons 59
7-11 Pitch and Yaw Local Angles-of-Attack 61
7_12 Representative Actuator Loads 63
7-13 Non-Control Actuator Loads, SA-3 65
•7-14 Hydraulic Source Pressure and Level 667-15 Attitude DifferenCes Between ST-90 and ST-124P 67
7-16 Center LOX Tank Telemetered Sloshing Amplitudes• After I00 Seconds 71
7-17 Sloshing Frequencies 72
8-1 Guidance Velocity Comparison (ST-90)
(Telemetered - Calculated) 76 "
8-2 Telemetered Cross Range and Slant Altitude Velocity,
ST-90 Guidance System 78
x
| ii_ (u) LIST OF FIGURES (co_rr')
Figure. Page
8-3 Guidance Comparisons, ST-124P Guidance System 80
_. 8-4 Incremental Velocity Pulse Patterns, ST-124P
i_ _ Cross Range 84?,_!_ 8-5 Simplified Schematic of Cross Range Signal Processor 86
9-1 Distributor Connections and Unit 9 Measuring Supply 89
i0-I Bending Moment and Normal Load Factor 93
10-2 Bending Moment' at Station 979, Angle-of-Attack,
and Gimhal Angle vs Range Time 94
10-3 Longitudinal Load at Station 979 95
10-4 MaxlmumDynamic Response 96
i0-5 SA-3 System Frequency Trend 98
10-6 SA-3 Bending Mode - First Mode, Yaw at Liftoff 99
10-7 SA-3 Bending Mode - First Mode, Pitch and Yaw
(53 to 57 sec) i00
10-8 Bending Mode - First Mode, Pitch (151 to 152.5 sec) I0110-9 _ihration Envelope of Structure, Canister and
Engine Compartment Measurements 105I0-i0 SA-3 Vehicle Acoustics 107
II-I Base Pressure Minus Ambient Pressure Versus
Altitude 109
11-2 Flame Shield Pressure Comparison Versus Altitude 10911-3 Ratios of Base Pressure to Amblent Pressure Versus
Math Number 109
iI-4_ Comparison of Gas Temperatures on Heat and FlameShield, SA-2 and SA-3 112
11-5 Total Heat Rate roSA-3 Base 114
11-6 Total Heat Rate to M-31 Panel Compared to
SA-I and SA-2 Rates 114
-,- 11-7 Total Heating Rate on Flame Shield, SA-I, SA-2and SA-3 117
11-8 Radiant Heating Rates for SA-3 Flight Comparing
Preflight and Inflight Data Correction Techniques 118
11-9 Engine Compartment Structural Temperatures 120
II_I0 Environment, Forward Side of Flame Shield 120:!" II--ii Base Environment, Forward Side of Heat Shield 120
f_: 11-12 Propellant Tank Skin Temperature at Station 745 12111-13 Propellant Tank Skin Temperature 121
11-14 Temperature Measurement on Dummy S-IV Stageand Interstage 123
11-15 Temperature Measurement on Dummy S-IV Stageand Interstage 123
xl
(U) LIST OF FIGURES (CONT')
_igure Page
12-1 Ratio of Gradients of Angular Accelerations
Versus Range Time 12612-2 Center of Pressure Location and Gradient of Normal
Force Coefficient Versus Math Number 128
12-3 Ratios of Surface Pressure to Ambient Pressure
Versus Mach Number 129
12-4 Ratios of Surface Pressure to Ambient Pressure
Versus Mach Number 130
12-5 Ratios of Surface Pressure to Ambient Pressure
• Versus Mach Number on Interstage 13212-6 Pressure Coefficient Versus Mach Number on
Centaur - Simulation Panel 134
12-7 Pressure Coefficient Versus Vehicle Station at
Various Mach Numbers on Centaur - Simulation
Panel 135
13-1 Telemetry Signal Strength (Cape Telemetry 2) 14013-2 Telemetry Signal Strength (Green Mountain and
Mandy) 142
13-3 UDOP Signal Strength 144
13--4 Azusa and Radar Signal Strength 145
15-1 Picture Sequence of Project Highwater Experiment 153
xii

s
CONVERSION FACTORS FOE _MSFCMEASURING_ITS
_. fiuantitZ
,., b - Multiply B_ To Obtai.
i. Acceleration ft/s2 3.04800x10 "I m/s 2
. 2. Area in26-4516xi0 -4 m2
3. Density 15_82
5"25539xi01 k -s2
slug £t3 5.25539xi01_T
' 4. Energy BT_ 2"51996xi0-I kcal5. Force
ib4"53592xi0-i kg
6. Length in 2"54000xi0-2 m
7. Mass ib_s 2
7-- 1.4.816t = _Um
8. Mass Flow Race lh-s
.488169. Pressure ib/in2 m
7.03067xi0 "2 kE/cm 210. Temperature oF_32 o
5.55556xi0 "I oc
Ii. Velocity ft/s 3"04800xi0"I m/s12. Vo,lu_e
gal (_.S.) 3.78543xi0. 3 m3
ft3 2.83168xi0- 2 m313. Volume Flow
.,i. ft31s
!:i_ 2"83168xi0-2 m3/s
gal/s 3.78543x10_3 m3/s
Xfii
GEORGE C. MARSHALL SPACE FLIGH_ CENTER
MPR-SAT- 63-I
VOLUME Im
SATURN SA-3 FLIGHT EVALUATION
By Saturn Flight Evaluation Working Group
1.0 (C) FLIGHT TEST SUF_4ARY
• I.I FLIGHT TEST RESULTS
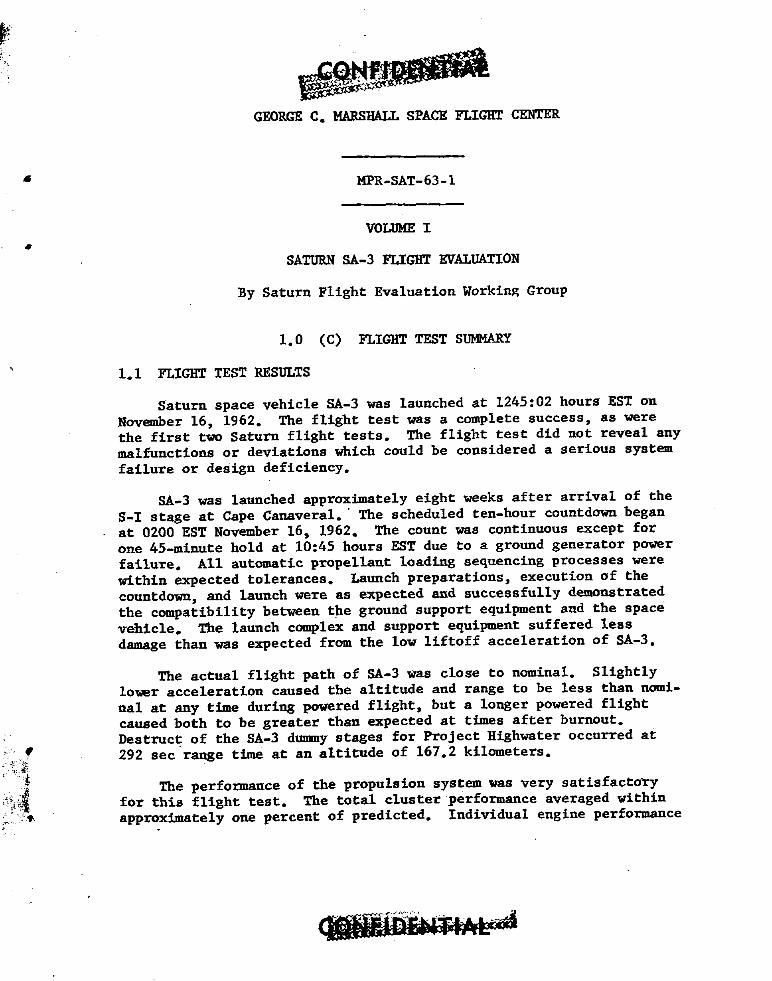
Saturn space vehicle SA-3 was launched at 1245:02 hours EST on
November 16, 1962. The flight test was a complete success, as werethe first two Saturn flight tests. The flight test did not reveal any
malfunctions or deviations which could be considered a serious system
failure or design deficiency.
SA-3 was launched approximately eight weeks after arrival of the
S-I stage at Cape Canaveral. The scheduled ten-hour countdown began
at 0200 EST November 16, 1962. The count was continuous except forone 45-mlnute hold at 10:45 hours EST due to a ground generator power
failure. All automatic propellant loading sequencing processes were
within expected tolerances. Launch preparations, execution of the
countdown, and launch were as expected and successfully demonstrated
the compatibility between the ground support equipment and the space
vehicle. The launch complex and support equipment suffered less
damage than was expected from the low llftoff acceleration of SA-3.
The actual flight path of SA-3 was close to nominal. SlightlyIo_er acceleration caused the altitude and range to he less than nomi-
nal at any time during powered flight, but a longer powered flightcaused both to be greater than expected at times after burnout.
Destruct of the SA-3 dummy stages for Project Highwater occurred at
_ @ 292 sec range time at an altitude of 167.2 kilometers.
The performance of the propulsion system was very satisfactory
_ for this flight test. The total cluster performance averaged within
i_:i_ approximately one percent of predicted. Individual engine performance
2 _
was satisfactory with no major deviations from predicted values being
noted. The propellant tank pressurization systems functioned properly,
with good results from the increased propellant load to simulate Block
71 gas ullage. All hydraullc systems operated well within the expected •limits.
The control system for the Saturn vehicle SA-3 was esaentlallythe same as that used in SA-I and SA-2. ]1owever, the control gains
(aO and bo) were different. These were changed because of the increased_propellant loading to maintain the same correlation with the vehiclemass as on SA-I and SA-2.
Engine deflections, attitude angles, and angles-of-attack wereless than those observed on SA-1 and SA- 2 flights primarily due to the
trajectory shape. The wind magnitude was almost the same in the pitch
• plane as experienced on SA-2.
Operation of the hydraulic actuators and the control computerswas satisfactory.
The Saturn SA-3 vehicle was flown without active path guidance.
However, passenger hardware for both ST-90 and ST-124P (Prototype)guidance systems was onboard to establish the operational capabilitles
of the guidance equipment in the Saturn flight environment. The tele-metered data as well as a trajectory comparison indicate satisfactory
performance of the ST-90 guidance system throughout powered flight.
The operation df the ST-124P guidance system, as an engineering test,
was quite satisfactory.
Erroneous outputs from the cross range accelerometer system
mounted on the ST-124P platform were noted before ignition. No correc-tion was made and the cross range measurement contained extraneous
signals throughout flight. These extraneous signals were eliminatedfrom the telemetered accelerometer output and valid cross range Infor-
mation was deducted from the measurement.
The flight data indicated that the SA-3 vibration levels were
generally similar to those recorded during the previous two Saturn
flights.
The l0 bending accelerometers flown on SA-2 showed response at
frequencies in the range of first and second vehicle bending. These
frequencies were present in both pitch and yaw direction with a maxi-
mmn amplitude at liftoff on the nose cone of 0.016 gts single amplitudefor first mode of 2.0 cps. At OECO a forced response of 0.095 grs

single amplitude occurred at a coupled frequency of 2.7 cps. The
response is lower than on SA-2 before OECO.
The base region enviromaent during the SA-3 flight was similar tothat encountered on the two previous flights. Radiation heating rates
on SA-3 are in good agreement with values obtained on the previous
Saturn flights and are considered representative for the Saturn C-l_Block I vehicle.6
A total of 607 flight measurements was flown on SA-3. Of these
measurements_ fourteen were completely unusable, six were partially
usable and one was questionable. The signal strength of all RF systems,
except C-band radar, was very close to the expected values.
1.2 TEST OETECTIVES
The objectives of the Saturn SA-3 flight test were as follows:
First Objective - Booster
Prove the propulsion system, structural design, and control system
of the high thrust booster - achieved.
Second 0b_ective - Ground Support Equipment
Prove the operational concept of the associated supporting launchfacilities for Saturn class vehicles; which include propellant systems,
automatic checkout equipment, special instrumentation, launch pedestal
with holddown arms, and other necessary handling and launching equip-ment - achieved.
Third Objective - Vehicle in l_li_ht
(a) Aeroballistlcs
Confirm values of aerodynamic characteristics, correlating
predicted stability and performancewith that encountered in flight -achieved.
,@ (b) Propulsion
Prove that the booster stage is capable of providing the pro-per thrust to propel the Block I vehicle through the desired trajectory• at the required velocity. Determine the Inflight performance of all
eight engines, the controlling movements of the four outboard gimballed
engines, engines' cutoff, propellant utilization, and other desired
propulsion data - achieved.
(c) Structural and Mechanical
Verify the structural integrity of the Block I airframe, bycorrelating theoretical calculations and specification requirements
with conditions encountered during flight. Specifically, to determine
the inflight stress, vibration levels, and associated frequency contentat various locations throughout the vehicle structure, so that the
dynamic increments to the shear and bending moments may be calculated
and component vibration envirornnent may be determined. Measure the
overall structural response to define critical dynamic occurrences.
Evaluate the presence of any excessive strain, body bending effects,, and accumulate data which may be used to determine the mode shape of
the bending curve during flight - achieved.
(d) Guidance and Control
To demonstrate the capability of the G & C system (a modified
ST-90 stabilized platform) to perform the required control, guidance,
and operational sequence for the Block I flight tests. Specifically,
to prove that the system will establish an accurate space-fixed coordi-
nate reference for determining vehicle attitude and providing an
accurate coordinate velocity signal - achieved.
Fourth 0b_ective - Pro_ect "Hi_hwater"
A water cloud experiment (similar to the experiment conducted on
SA-2) will be accomplished by in_ecting the upper stages' 87,329 kg
(192,528 Ib) of water ballast into the upper atmosphere, at an altitude
of approximately 167 km, by rupturing the upper stages with primacord -achieved.

5
1.3 TIMES OF FLIGHT EVENTS
Event Actual Range Predicted Act -Pred
Time (set) (set)
Ignition Command -3.79 -3.57 -0.22
Thrust Commit -0.49 ....
Launch Commit -0.08 ....
First Motion * 0.I0 0.i0 0
Liftoff Signal 0.33 ....
(Start Program Device)
Begin Tilt I0.33 ....
Mach I Reached 68. I0 68.03 0.07
Maximum Dynamic Pressure 78.60 78.28 0.32
Inboard Engine Cutoff 141.66 140.34 1.32
End of First Thrust Decay 144.25 ....
Outboard Engine Cutoff 149.09 147.95 i.14
End of Second Thrust Decay 152.78 150.48 2.30
Retro Rockets Ignite 153.66 152.34 i.32
Project '_Highwater" 292.00 292.00 0
Loss of Telemetry Signal 292.00 292.00 0
• Reference point for comparison
8-
0
+4-
+_
+
__J
I_a'
+
t
/I-4I-I
I-"1
MP
R-SA
T-63-1
7
2.0 (U) _NTRODUCTION
Saturn space vehicle SA-3 was launched at 1255:02 EST on November
16, 1962_ from Saturn Launch Complex 34, Atlantic Missile Range, Cape
Canaveral, Florida. SA-3 was the third vehicle to be flight tested in
the Saturn C-I P.&D program. The major objective of this test was to
evaluate the designs of the propulsion system_ control system, and
s_ructure of the 590,000 kg (1.3 million ib) thrust booster.
This report presents the results of the Early Engineering Evalua-
tion of the SA-3 test flight. The performance of each major vehicle
system is discussed with speclal emphasis on malfunctions and devia-
tions. The report is presented in two volumes covering all vehicle
systems and ground support equipment. Important aspects concerningthe flight and the malfunctions and deviations are discussed in the
• first volume. Supporting data for all the sections of Volume I are
presented in Volume If.
This report is published by the SaturuFlight Evaluation Working
Group, whose members are representatives from all Marshall Space Flight
Center Divisions. Therefore the report represents the official MSFC
position at this tlme.. This report will not be followed by a similarly
integrated report unless continued analysis and/or new evidence should
prove the conclusions presented here partly or wholly wrong. Final
evaluation reports will, however, be published by the MSFC Divisions
covering some of the major systems and/or special subjects.

8
3.0 (U) LAUNCH OPERATIONS
3.I SUMMARY
Saturn vehicle SA-3, scheduled for launching at 1200 hours EST on
November 16, 1962_ was launched at 1245:02 hours EST, on that date.The vehicle was launched on an azimuth of i00 degrees East of North
from complex 34, Geodetic Latitude 28.52153 degrees N and Longitude •
80.56136 degrees W.
The scheduled 10-hour countdown began at 0200 EST, November 16,
1962. The count was continuous except for one hold at 1045 hours EST.
There was a ground generator power failure at this time. The holdcontinued for 45 minutes and the count was resumed at 1130 hours EST.
All automatic propellant loading sequencing processes were within ex-
pected tolerances. Launch preparations, execution of the countdown,and launch were as expected and successfully demonstrated the compati-
bility between the ground support equipment and the flight configura-tion. The complex and support equipment suffered less damage than was
expected from the low liftoff acceleration of SA-3.
3.2 PRELAUNCHMILESTONES
Date Event
September 19, 1962 S-I stage arrived at Cape Canaveralon Saturn barge "Promise".
September 21, 1962 S-I booster erected on launch pedestalat pad 34.
September 24, 1962 Dummy stages S-IV, S-V, and payloadassembled to the S-I booster.
October 19_ 1962 Service Structure removed for RF check.
October 31_ 1962 Fuel test completed; S-IVD, S-VDwater loading completed.
November 2, 1962 LOX loading test completed
November 6, 1962 Overall test No. 4 completed
November 9, 1962 Retro Rocket installation completed t
November 13, 1962 Simulated flight test performed
November 14, 1962 RP-I fuel loaded
_ November 16, 1962 Launch
3.3 PRELAUNCEA_OSPKERIC SURFACE CONDITIONS
• General weather conditions around Cape Canaveral at the time of
launch were exceptionally good. There was no precipitation. There
were no clouds along the flight path. The visibility was 16 km (i0
miles) or better. Barometric pressure was 764 mm of mercury (1018.5
mbs), relative humidity 36%, and temperature 24.7°C. Surface windswere from 215 degrees (SW) at 3 m/s. For detailed and more complete
atmospheric data, refer to Volume II.%
3.4 COUNTDOWN
Holds
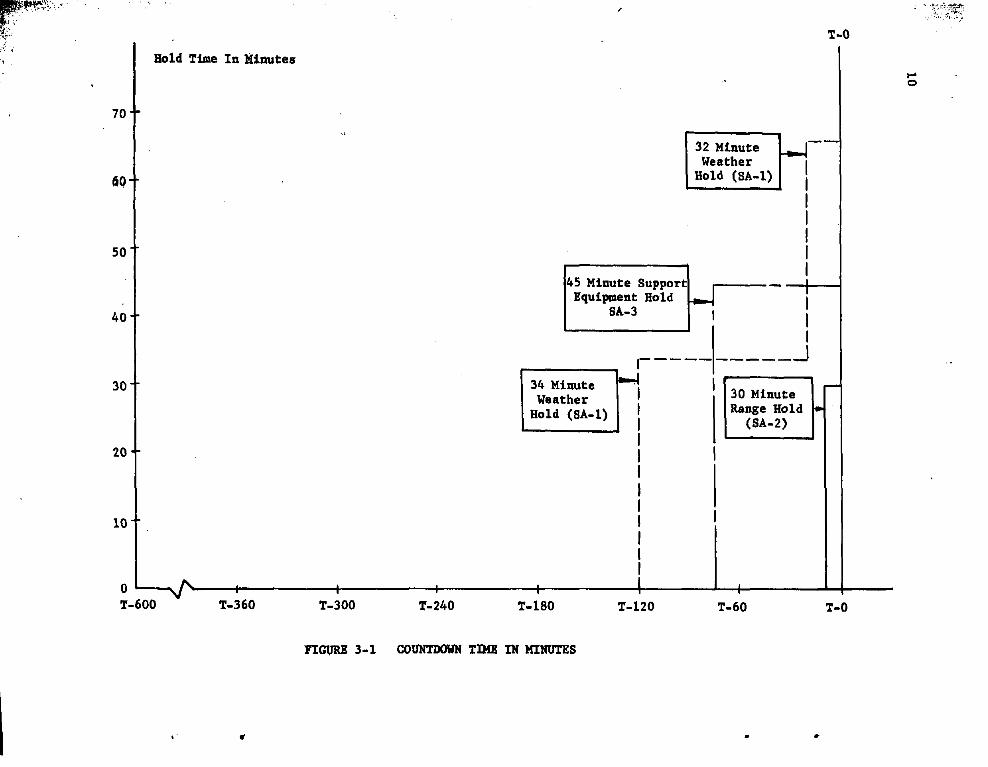
Launch countdown began at T-600 minutes at 0200 EST on November
16,.1962 and was continuous except for one 45-minute hold caused byground generator power failure at T-75 minutes (Figure 3-1). Network
generator number 2 dropped out, apparently due to the over-voltage
sensing circuit, causing the hold. The nominal value for activation
of the over-voltage device is 37 volts; however, it was found that the
over-voltage sensing device for this generator had shifted to 35 volts
(aPProximately the terminal voltage of the generator at the moment of
dropout). The sensing device was replaced. The over-voltage bypasscircuits for all generators (normally energized at "LOX bubbling com-
" plete") were then jumpered for the remainder of the countdown to avoidfurther difficulties in this area. The count was resumed at 1130 hours
EST and continued until launch.
Automatic Countdown
The automatic countdown sequence was initiated by the firing com-
mand 363.45 sec prior to ignition command (T-O). This is 10.55 sec
_ later than the firing command on SA-2, due primarily to the time dif-
ference in LOX tank pressurization. The LOX tank pressurization time
was shorter on SA-3 due to the smaller gas ullage associated with the
full propellant loading for this vehicle as compared to the partial
loading on SA-I and SA-2. Comparisons of predicted and actual times
for ground sequence events are listed in Volume II. The times shown
it:
I0
_ ii
were read from sequence records. No digital output for events was
available due to a computer malfunction.
3.5 HOLDDOWN
Engine start and transition were smooth with all engines receiving
a positive ignition from a LOX lead in the gas generator ignition sys-tem. All critical blockhouse measurements were within the establishedredline values. Maximum and minimum values observed during the count-
down are included in Volume II.
Two events from the sequence records show irregular signals. The
"Support Retract Pressure OK" switch cycled several times about 500 ms
after all engines were running. This could be due to vibration on oneor more of the four switches. The function of these four switches
(one on each support arm assembly at the pressure source) is to showthat pressure is available to move the support retract arm. Theswitches were wired in series and vibration on any one switch would
cause the cycling noted. This possible problem was noted early in the
Saturn program and these switches were taken out of the cutoff circuit.
The other irregular signal showed that the LOX bubbling valve stayed
open for 137 sec instead of the expected 60 seconds. This is consid-ered a measuring error since other parameters (such as LOX temperaturein the tanks and at the pump inlet) did not reflect this long bubbling
time.
Detailed environmental measurements on Launch Complex 34 will be
included in Volume II.
3.6 lAUNCH COMPLEX AND GROUND SUPPORT EQUIPMENT
All items of ground support equipment functioned normally with
the exception of the LOX fill mast, which failed to retract on command.This failure to retract did not interfere with the subsequent liftoff
of the space vehicle. However, the failure to retract on commandresulted in the ultimate failure of the LOX fill mast because of the
vehicle blast breaking the mast cylinder mount with the subsequent for-
ward motion of the upper mast assembly. Post launch investigations ofthe cause of the mast failure to retract have been inconclusive.
Sequence and event records show that the command for the mast to retract_i__ was received and responded to by the solenoid valve in the LOX fill
¢ :_ mast assembly valve box. The actuation of this solenoid valve should
__ have resulted in the application of pneumatic pressures to the retract
!_ cylinder, which would result in the ultimate retraction of the mast._ The response of the solenoid valve to command was demonstrated during
12
components test on T-I day. The correct mechanical connections to the
_ retract cylinder were verified prior to launch and reverified during
the post launch investigation. The post launch analysis so far pointsmost strongly to a theory which indicates that the retract cylinder
failed to stroke subsequent to the application of pressure. This fail- Q
ure could be due to two possibilities. The first would be a mechanical
"freezing" of the retract cylinder piston within its cylinder. The
second possibility would be that of a failure of the "cushion' regula-tor or that one of the two-way "button" valyes, used for remote cou- •
_pling, could have leaked. Either of these possibilities would result
in a net force toward the forward position rather than the retract
position. The circumstances of the LOX fill mast failure to retract
are being investigated to determine the most likely cause of failure
and what steps can be taken to prevent its recurrence.
The complex and support equipment suffered less damage than was
expected from the low liftoff acceleration of SA-3. Film coverage
shows that SA-3 took approximately 3.2 sec longer to reach 93 m alti-
tude than either of the two previous Saturn vehicles. At this altitude,
the exhaust flame and jets cease to "flare out". Therefore, since SA-3
remained in close contact with the pad approximately 307_ longer than
either SA-I or SA-2, more pad damage would be expected from SA-3.
Examination of the launcher and ground support equipment after the
launch of Saturn vehicle SA-3 revealed that the damage was of a level
comparable to the damage observed after the launch of SA-I and SA-2.
The only observed damage readily attributable to the low liftoff accel-
eration was increased damage to the torus ring retaining bands and a
noticeable larger increment of flame deflector warping. A damaged area
of interest was the tubing on the exposed wall of the umbilical tower
base room. This tubing was ripped loose from the wall and severelydistorted. Although this tubing damage did not occur on the launches
of SA-I or SA-2, it would be difficult to associate the damage withany launch characteristic peculiar to SA-3. It is believed that this
damage resulted from the mounting system being weakened during previous
launches. Saturn vehlcle SA-3 was the flrst to use an umbilical swingarm instead of the long cable mast assembly. The long cable mast assem-
bly was essentially destroyed during the SA-I and SA-2 launches. The
umbilical swing arm installation used to service SA-3 sustained veryminor damage during the launch and can be reused with minor refurbish-ment.
Following is a detailed assessment of damage to individual GSEitems.
13
Short Cable Mast and Tail Cable Mast Assemblies
This equipment should be subject to refurbishment with a majority
of the mechanical components being salvageable. The umbilical swing
arm should be subject to refurbishment with minimum effort, The umbili-cal disconnect plate sustained damage to one ejection pin. The bungee
cord redundant retract system, used on the umbilical disconnect plate,
was burned away. The umbilical swing arm service platform sustained
minor damage. Electrical cabling, in general, evidenced heat input but
possibly will be reused, subject to qualification testing.
Fuel Loadin_ Mast
This mast should be subject to refurbishment with a majority of
the mechanical components being reuseable. Flexible hose assemblies,
electrical harnesses, and the retractable coupling are subject to
replacement.
LOX Fill Mast
This sustained major damage, with very few components, other thanthe steel base and the valve box assembly, subject to salvage.
Retractable Support Arms
These support arms sustained minor damage consisting of randomfailure of tubing which is exposed nearly directly to the blast.
Holddown Arms and Associate Valve Panel
This equipment sustained minor damage consisting primarily of
tubing and flex hose assemblies being burned away.
Flame Deflector
This can be reused. It suffered a pronounced increment of warp-
age; however, this warpage is not considered so severe as to compro-mise its usefulness.
_i The launch again proved the comparability of the vehicle and the
"__ ground support equipment. In addition, it also proved that a vehicle_i" with low liftoff acceleration (11.4 m/s 2 compared to 13.6 m/s 2 for
,_ normal flights) would not damage the launch complex to an excessive
amount.
_ 14
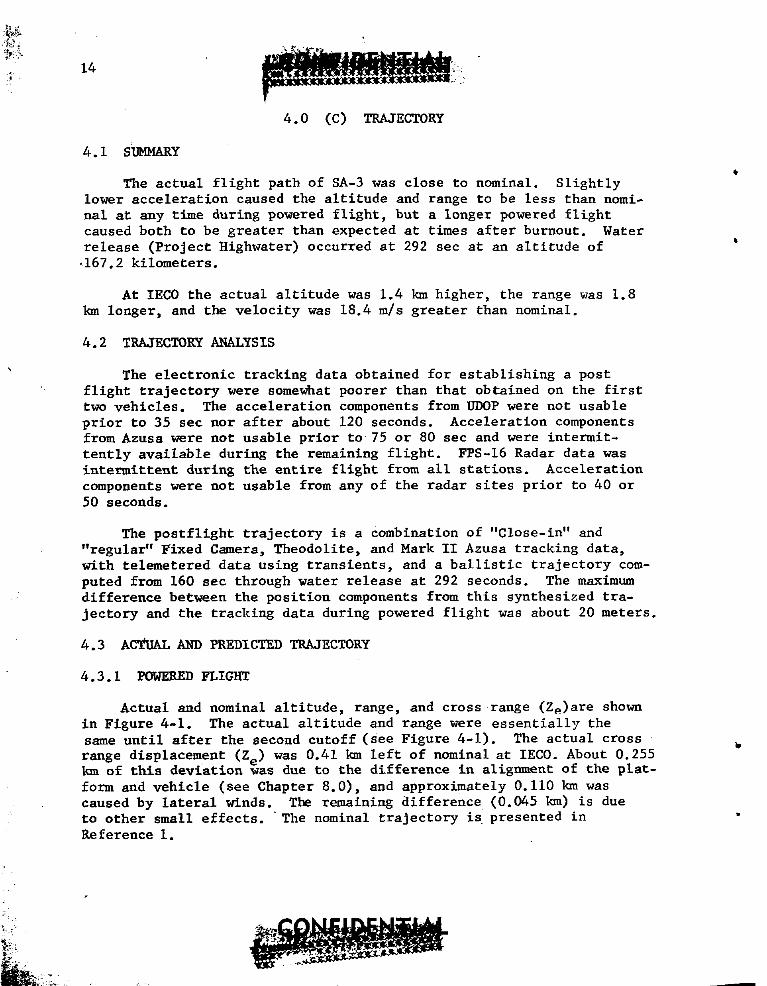
4.0 (C) TRAJECTORY
4. I SI_4ARY
The actual flight path of SA-3 was close to nominal. Slightlylower acceleration caused the altitude and range to be less than nomi-
nal at any time during powered flight, hut a longer powered flightcaused both to be greater than expected at times after burnout. Water
release (Project Highwater) occurred at 292 sec at an altitude of_167.2 kilometers.
At IEC0 the actual altitude was 1.4 km higher, the range was 1.8
km longer, and the velocity was 18.4 m/s greater than nominal.
4.2 TRAJECTORY ANALYSIS
The electronic tracking data obtained for establishing a post
flight trajectory were somewhat poorer than that obtained on the firsttwo vehicles. The acceleration components from UDOP were not usable
prior to 35 sec nor after about 120 seconds. Acceleration componentsfrom Azusa were not usable prior to 75 or 80 sec and were intermit-
tently available during the remaining flight. FPS-16 Radar data wasintermittent during the entire flight from all stations. Acceleration
components were not usable from any of the radar sites prior to 40 or50 seconds.
The postflight trajectory is a Combination of "Close-in" and
"regular" Fixed Camera, Theodolite, and Mark II Azusa tracking data,
with telemetered data using transients, and a ballistic trajectory com-
puted from 160 sec through water release at 292 seconds. The maximumdifference between the position components from this synthesized tra-
jectory and the tracking data during powered flight was about 20 meters.
4.3 ACTIIALANDPREDICTEDTRAJECTORY
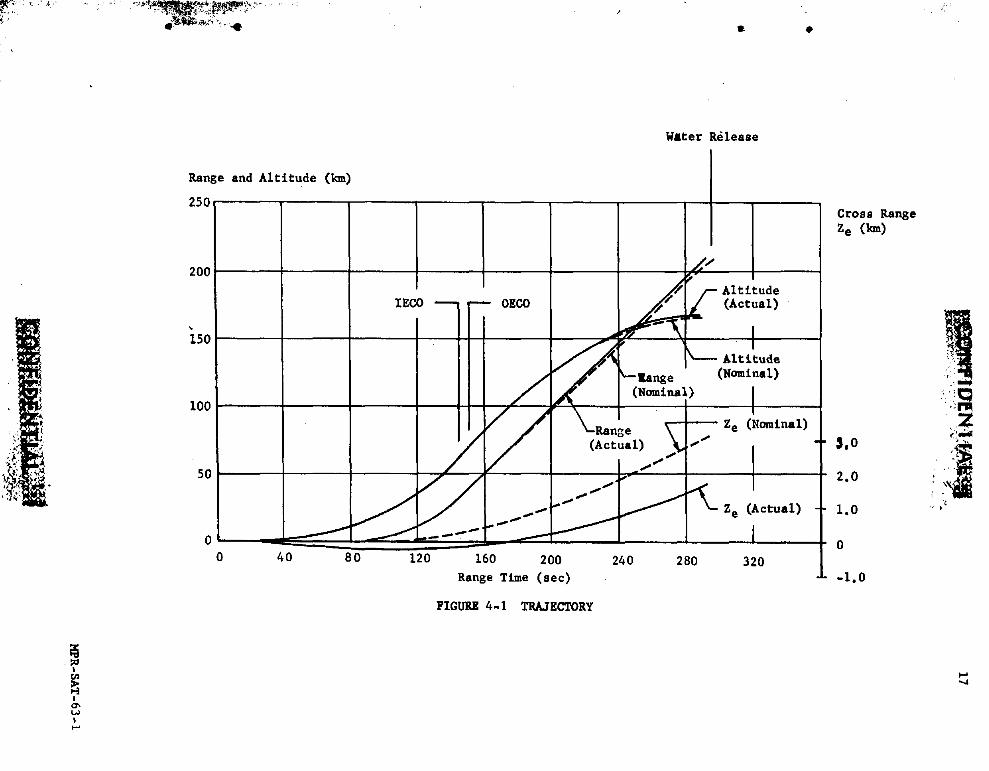
4.3.1 POWERED FLIGHT
Actual and nominal altitude, range, and cross range (Ze)are shown
in Figure 4-1. The actual altitude and range were essentially thesame until after the second cutoff (see Figure 4-1). The actual cross
range displacement (Ze) was 0.41 km left of nominal at IEC0. About 0.255km of this deviation was due to the difference in alignment of the plat-
form and vehicle (see Chapter 8.0), and approximately 0.Ii0 km was
caused by lateral winds. The remaining difference (0.045 km) is dueto other small effects. "The nominal trajectory is presented in
Reference i.

The longitudinal acceleration was up to about 1.2 m/s 2 less than
expected during the power flight, however the maximum longitudinalacceleration was only 0.5 m/s z lower than nominal. The velocity at first
6 cutoff was 18.4 m/s more than expected since actual cutoff occurred 1.3sec later. The earth-fixed velocity is shown in Figure 4-2.
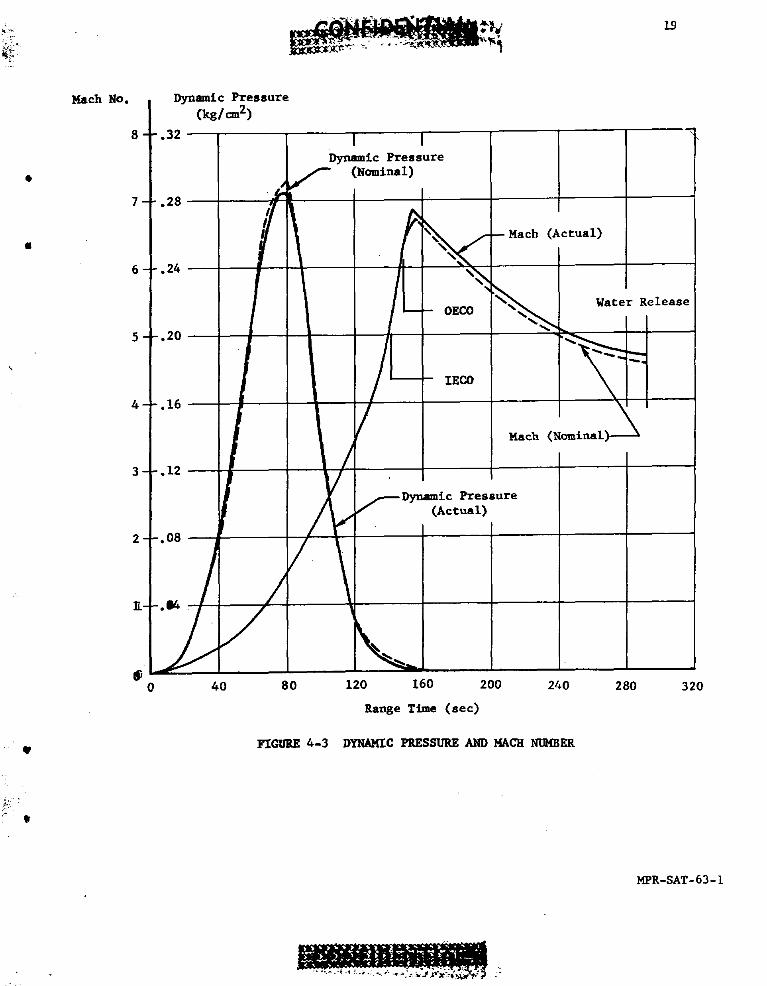
Actual and nominal Mach number and dynamic pressure are shown in
Figure 4-3. These two parameters were calculated using measured meteor-
ological data to an altitude of approximately 33.4 kilometers. Between
33.4 and 47.0 km altitude the measured data was gradually adjusted to
the 1959 ARDC atmosphere, above which the 1959 ARI_ was use_. Theactual peak dynamic pressure was slightly less (0.006 kg/cm ) than nom-inal _1_e to a lower velocity.
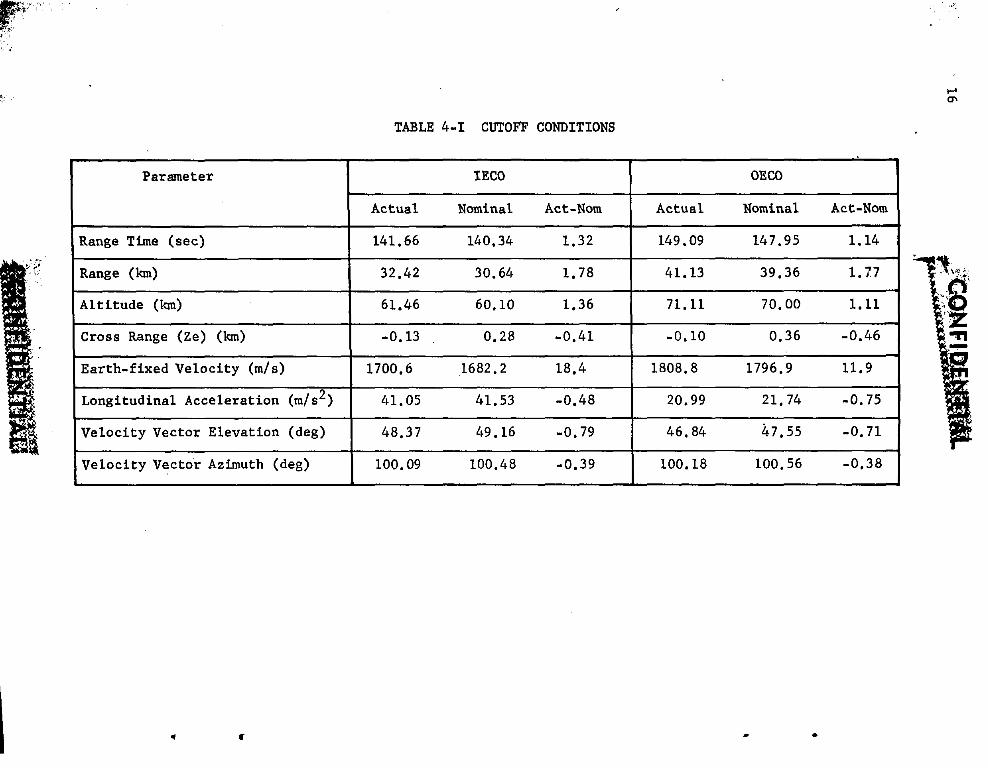
4.3.2 CUTOFF
A comparison of actual and nominal parameters at both inboard andoutboard cutoff is shown in Table 4-1. At OECO the actual altitude
was i.i lua higher, range was 1.8 km longer, and velocity was 11.9 m/s
greater than predicted. The time interval between the two cutoff times
was 7.43 sec for the actual, and 7.61 sec for the nominal. The accel-eration level of both actual and nominal was about 21 m/s 2. Since
the actual burning time between IECO and OECO was 0.2 sec less than
nominal, the velocity comparison would be expected to change by about4 m/s between IECO and OECO. This would mean that the expected dif-
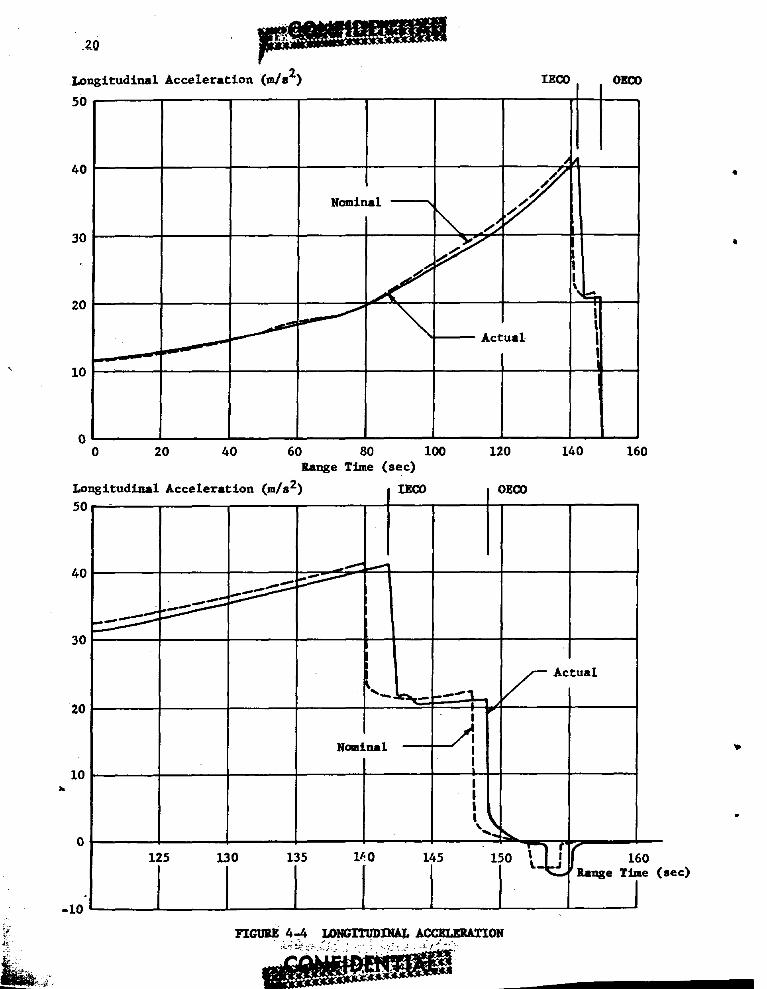
ference between actual and nominal velocity at OECO would be 14.4 m/s,instead of the 11.9 m/s observed. Figure 4-4 indicates that the accel-
eration level during outboard engine operation is less than nominal,
resulting in an increasing velocity deficit from predicted.
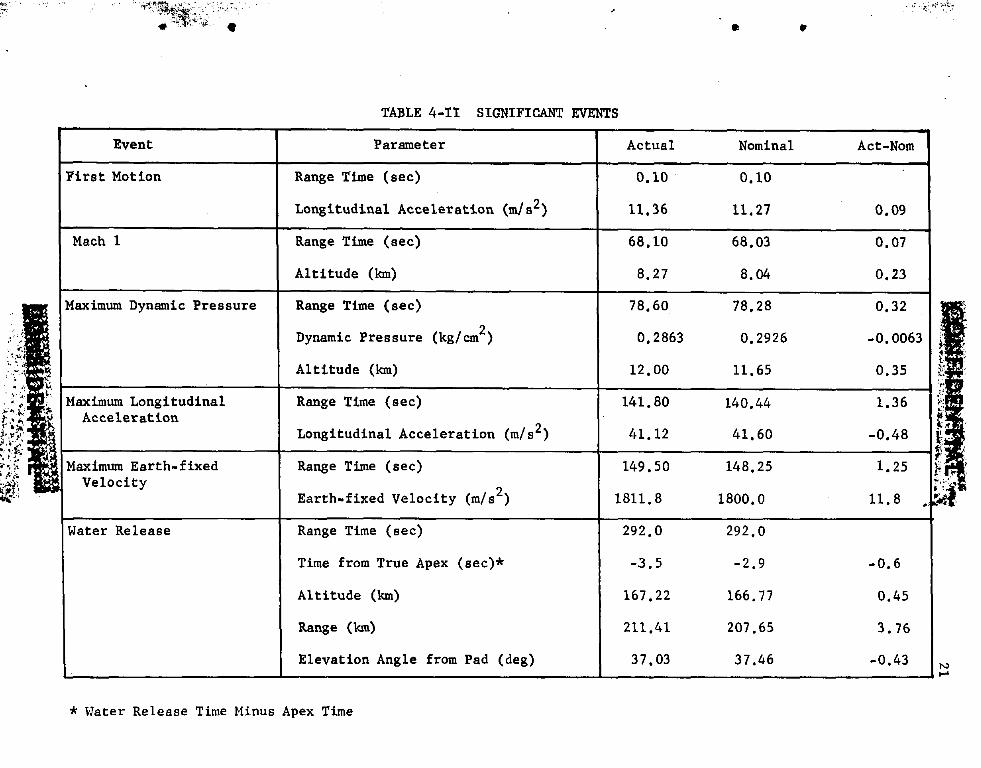
Comparisons of actual and nominal parameters at significant event
times are given in Table 4-11.
.,_rus,t Deca 7
The actual velocity gain during outboard engine thrust decay was
7.9 m/s and the nominal velocity gain was 7.6 m/s. A comparison of the
two has no significance since LOX depletio_ occurred. In addition,
the time of actual OECO was obtained from a commutated telemetry trace,
which may be in error by as much as _ 83 milliseconds. This time errorUis equivalent to a _ 1.7 m/s uncertainty in the velocity gain.
_/"
16
.....
/M
PR
-SAT
-63-1
2'

Earth-fixed veloclty (m/s)
2000
1800
16"00 , __
1400 I _ Actuall_omlnal
1ooo IWater Release
800
600
200 _,
J0 .
0 40 80 120 160 200 240 280 320
Range Time (sec)
FIGURE 4- 2 EARTH-FLXED VELOCITY
MPR-SAT-63-1
Mach No. Dynamic Pressure
(kg/m2)
' '-DynamicPressure
. ._Lw/" (N_i_.t)7 I-
X_X_ Water Release
-- OECO
/4 - -.16
Mach (Nominal> -----A
..o_- / __1:_°_'_re
0 40 80 120 160 200 24-0 280 320
Range Time (set)
FI_ 4-3 DYNAMIC PRESSURE AND HACH N'tR_ER
*
MPR-SAT-63-1
Longitudinal Acceleration (m/s 2) IECO OECO
30
40 •
30
20
• -- Actual-
10
00 20 40 60 80 I00 120 140 160
Range Time (sec)
Longltudinal Acceleration (m/s 2) IECO OECO
'°I4O
3O
Actual
20
%
0
125 130 135 I_0 145 150 160
I II_ FI_ 4-4 L01_I_II}II_ ACC_0N
22 ...._....
4.4 RETRO ROCKETS
SA-3 was the first Saturn vehicle to use retro rockets. The mea-
sured longitudinal acceleration (F7-13) during retro rocket operation •is shown in the lower part of Figure 4-4. The velocity lost due to
retro rocket operation was about 9 m/s or approximately the velocity
loss predicted. Deviating from the Block II separation sequence, this
velocity loss applies to the entire (non-separated) SA-3 vehicle.Q
4.5 WATER RELEASE (DESTRUCT)
Water release occurred at 292.0 sec range time. The vehicle was
0.45 km higher and 3.76 km further in range than was expected.
5.0 (C) PROPULSION
5.1 SmeARY
Vehicle propulsion system performance throughout the flight test
of Saturn SA-3 was _iI _thin satisfactory limits. Performance of
individual e_ines, h_raulic systems, and propellant tank pressuriza-
tion systems did not deviate s_nificantly from the predicted values.6 The vehicle longitudinal th_st was 0.15 percent lower and specific
_pulse i.i0 percent higher than corresponding predicted values.
All missions, includi_ primary, secondary, and special missions,
_re accomplished. Results of the special missions of particular
significance to the vehicle propulsion system are described below:
1. The full propellant load simulating Block II ullage volumes
presented no problem to the propellant loadi_ system, the pressuriza-
tion system, and engine operation.
2. The th_st OK cutoff of outboard engines due to LOX depletion
achieved a significant increase in propellant utilization with no prob-
lems in engine shutdown and vehicle control.
3. The retro rockets ignited and operated satisfactorily at the
end of S-I stage powered flight.
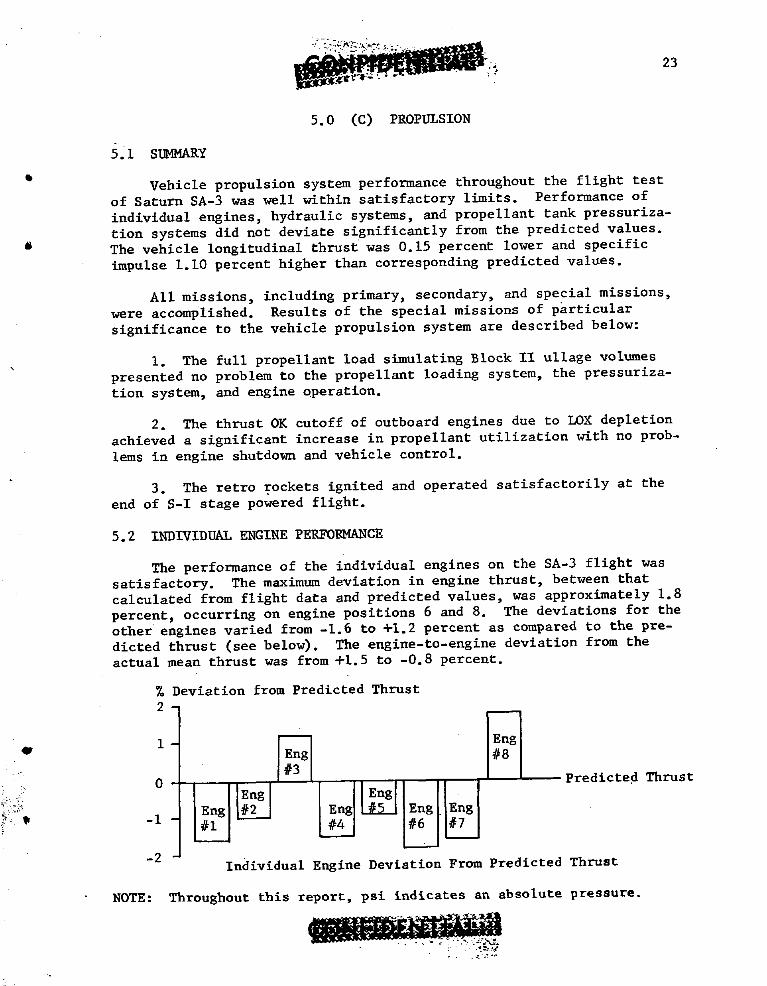
5.2 INDIVIDUAL ENGINE PERFORMANCE
The performance of the _dividual e_ines on the SA-3 flight was
satisfactory. The m_imum deviation in engine thrust, between that
calculated from flight data and predicted values, was approximately 1.8
percent, occurring on engine positions 6 and 8. The deviations for theother engines varied from -1.6 to +1.2 percent as compared to the pre-
dicted th_st (see beloW. The engine-to-engine deviation from the
actual mean th_st was from +1.5 to -0.8 percent.
% Deviation from Predicted Thrust
2
, H0 Predicte¢ Thrust
t____J'-----"-2 Individual E_ine Deviation From Predicted Th_st
NOTE: Throughout this report, psi indicates an _solute pressure.
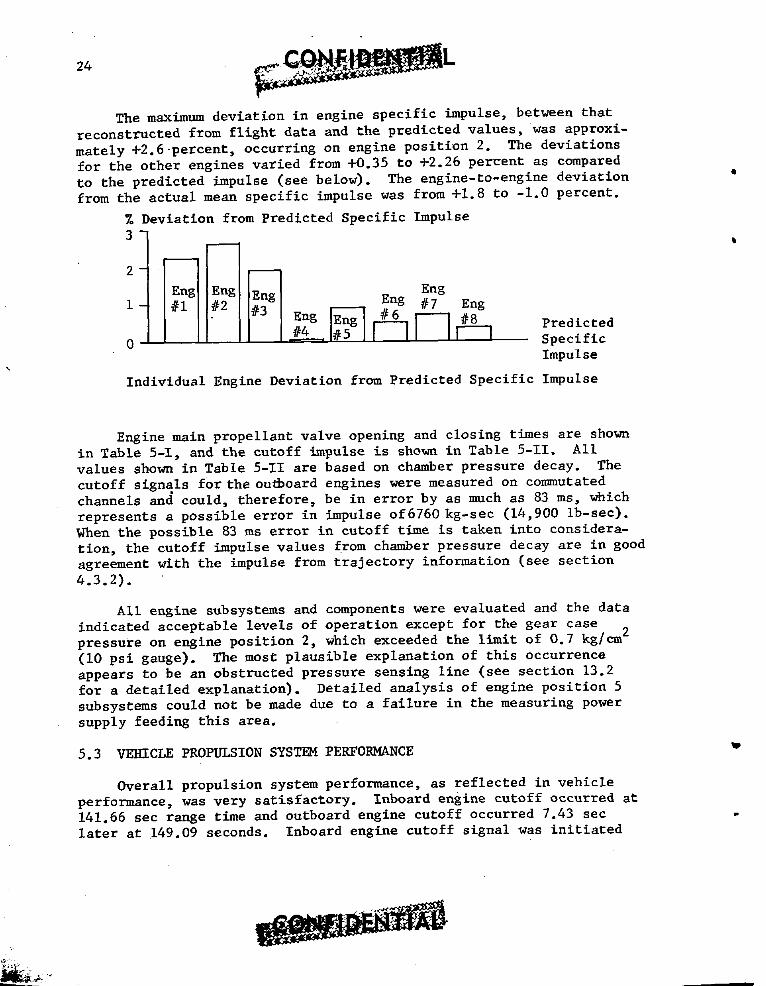
The maximum deviation in engine specific impulse, between that
reconstructed from flight data and the predicted values, was approxi-
mately +2.6 percent, occurring on engine position 2. The deviationsfor the other engines varied from +0.35 to +2.26 percent as compared
to the predicted impulse (see beloW. The engine-to-engine deviationfrom the actual mean specific impulse was from +1.8 to -I.0 percent.
% Deviation from Predicted Specific Impulse3
2
Eng
IEngl Eng Eng #7 Eng
i-,#i , #2 #4Eng_ _--_'6_ #8___ Predicted0 _ Specific
Impulse
Individual Engine Deviation from Predicted Specific Impulse
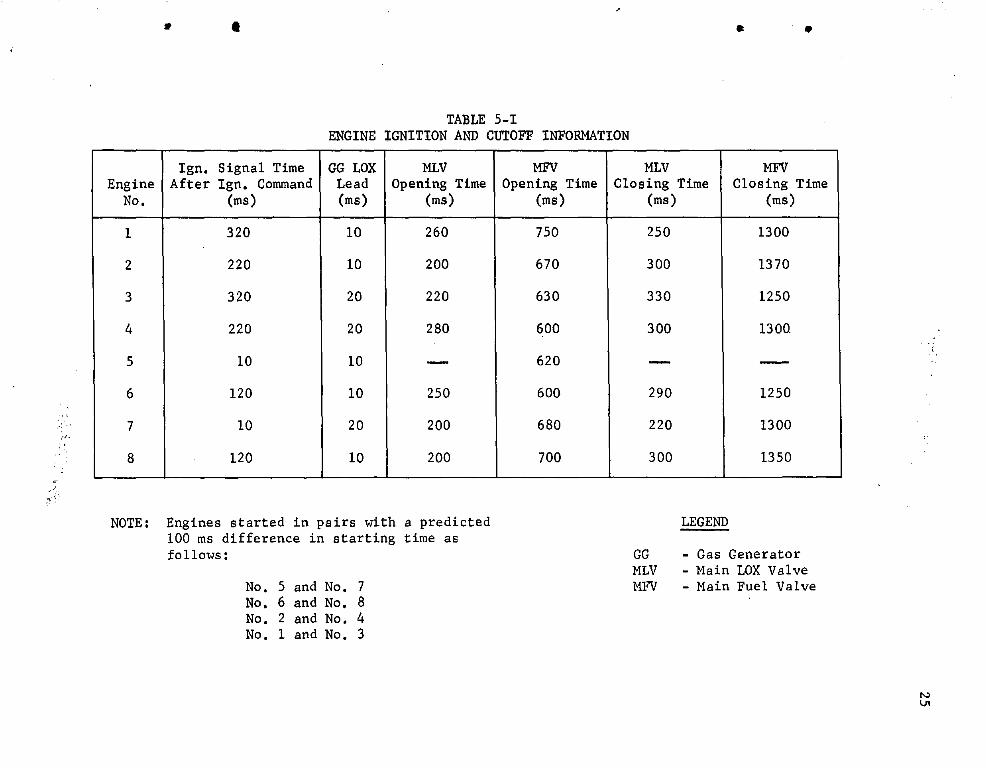
Engine main propellant valve opening and closing times are shown
in Table 5-I, and the cutoff impulse is shown in Table 5-11. All
values shown in Table 5-II are based on chamber pressure decay. The
cutoff signals for the ou_oard engines were measured on commutatedchannels and could, therefore, be in error by as much as 83 ms, whichrepresents a possible error in impulse of 6760 kg-sec (14,900 Ib-sec).
When the possible 83 ms error in cutoff time is taken into considera-
tion, the cutoff impulse values from chamber pressure decay are in good
agreement with the impulse from trajectory information (see section
4.3.2).
All engine subsystems and components were evaluated and the data
indicated acceptable levels of operation except for the gear case
pressure on engine position 2, which exceeded the limit of 0.7 kg/cm 2(I0 psi gauge). The most plausible explanation of this occurrence
appears to be an obstructed pressure sensing llne (see section 13.2
for a detailed explanation). Detailed analysis of engine position 5
subsystems could not be made due to a failure in the measuring power
supply feeding this area.
5.3 VEHICLE PROPULSION SYSTEM PERFORMANCE w
Overall propulsion system performance, as reflected in vehicle
performance, was very satisfactory. Inboard engine cutoff occurred at
141.66 sec range time and outboard engine cutoff occurred 7.43 seclater at 149.09 seconds. Inboard engine cutoff signal was initiated
•25

:, - _ .... , -
TABLE 5-11
ENGINE CUTOFF IMPULSE
Engine Engine Cutoff Impulse Comparison with Nominal
Position (kg-sec) (lb-sec) (kg-sec) (ib-sec)
I 32,997 see Note 3 72,746 See Note 5
2 28,817 see Note 3 63,530 See Note 5
3 24,725 see Note 3 54,510 See Note 5
_ _ _
5 25,348 55,883 -7038 -15,517
6 25,437 56,079 -6949 -15,321
7 24,281 53,530 -8106 -17,870
8 24,547 54,118 -7839 -17,282
NOTES:
I. The nominal cutoff impulse is 32,400 _ 2400 kg-sec (71,4005200 lh-sec) for a one sigma confidence level.
2. All values are based on chamber pressure decay data.
3. The cutoff signal for engines I, 2, and 3 was commutated and
could be in error by 83 ms, which represents an error in
cutoff impulse of 6760 kg-sec (14,900 ib-sec) or 21 percent.
4. The cutoff impulse for engine 4 could not be calculated due to
measurement failure; however, cutoff of engine 4 appears tohave been normal.
5. The LOX depletion cutoff on the outboard engines prevents a
comparison with nominal.
27
by the LOX tank 04 liquid level sensor. Outboard engine cutoff signalcame from the "thrust OK" switch on engine position 3, due to L0X deple-
tion. Engine position 3 feeds from LOX tank 04. Engine positions I, 2,
and 3 had already entered the thrust decay period when the cutoff sig-
nal was given by engine position 3.
The engine starting sequence was within expected values of pre-
dicted. Figure 5-1 shows the chamber pressure build-up of all engines.
The starting pairs by position number were 5, 7; 6, 8; 2, 4; and I, 3with a programed i00 ms delay between pairs. The maximum deviation
in chamber pressure build-up of approximately 40 ms occurred between
engines I and 3. This deviation is within expected engine-to-engine
repeatability limits.
Inboard engine shutdown was normal on all four engines. The out-
board engine cutoff characteristic was modified slightly by the LOX
depletion cutoff (see Figure 5-2).
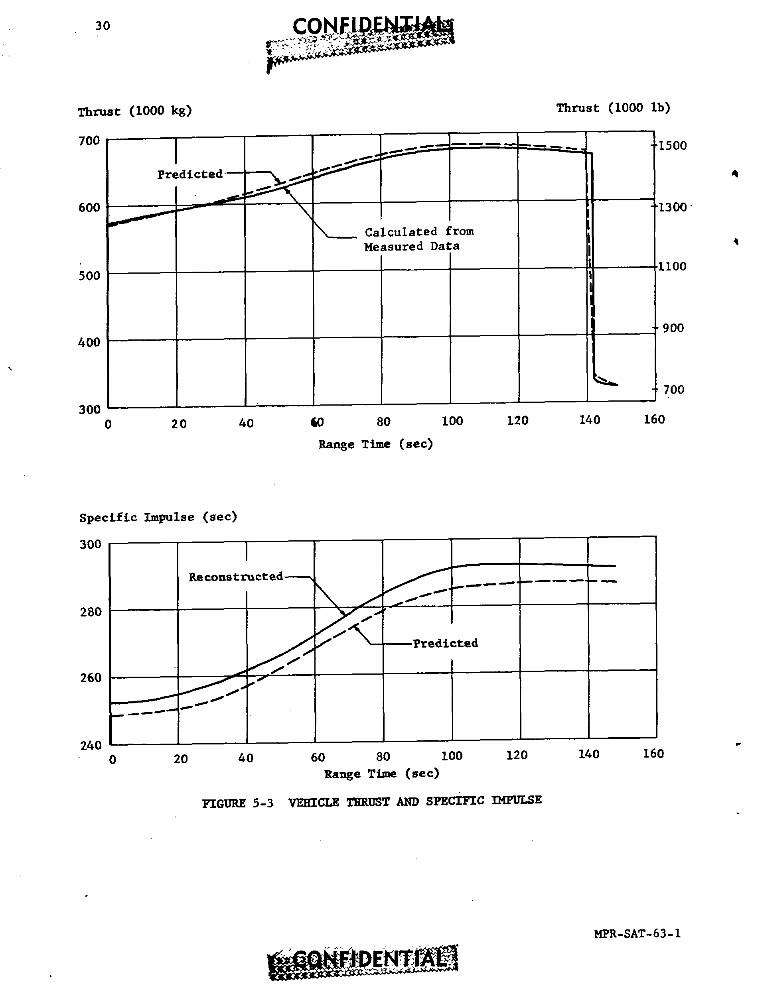
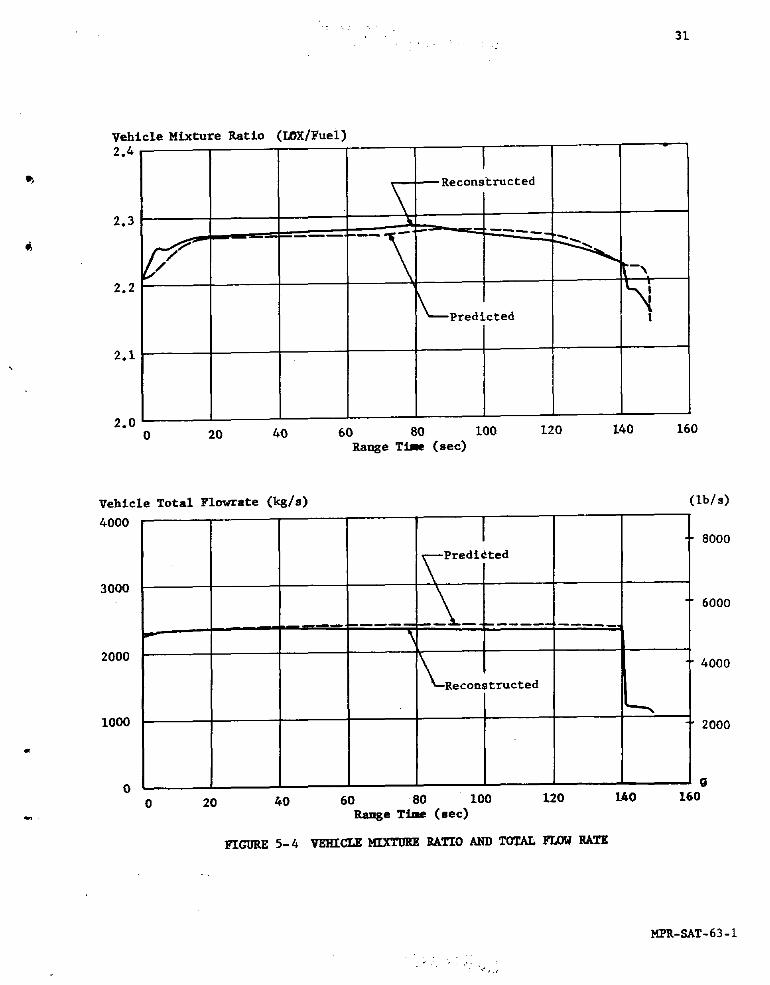
Actual and predicted vehicle longitudinal thrust, total flow rate,
mixture ratio, and specific impulse are shown in Figures 5-3 and 5-4.
There were two approaches used to evaluate the vehicle propulsion
system performance. The first method compares propulsion system in-flight measurements to corresponding predicted information. The vehi-cle thrust curve was calculated from measured combustion chamber pres-
sures. The vehicle total propellant flow is defined as total propel-
lant expended by the vehicle to include engine flows, lube fuel flows,and vented GOX. The engine flows are reconstructed from flight para-meters and discrete liquid level data and are considered more accurate
than the flows determined from flow meters. However, the latter flows
are important for the recognition of the flow transients. The vehicle
specific impulse was determined from vehicle thrust and total propel-lant flow described above. The second approach is through the flight
simulation method, which is a computer program with a differential cor-
rection procedure used to obtain adjustments to the propulsion param-
eter inputs which will produce a trajectory that matches the actual
trajectory.
The percent deviation from predicted, along with the estimated
accuracy limitations of each parameter from both approaches, is shownbelow.
Flight Propulsion Flight Simulation
Thrust -0.15% _ 1% -0.15% ± 0.25?0_Total Flow Rate -1.63% _ 17o -1.24% _ 0.25%
Specific Impulse +1.5_/_ _ 1% +1.10% _ 0.25%

MP
R-SA
T-63-1

..-_.
29
.....r.
""-°'._
M_R-SAT-63-i
. _-.- .o_=;__'_:_.
Th_st (I000 _) _st (i000 lb)
700
--_ 1500
Predicted__ _'_'_ 4600 13_"
Calculated fromMe,_suredData
500 .... II00
400 900
700300
0 20 40 60 80 100 120 140 160
Range Time (sec)
Specific Impulse (sec)
300
28o / --Predicted
260 Jd _
2400 20 40 60 80 100 120 140 160
Range Time (sec)
FIGURE 5-3 VEHICLE THRUSTAND SPECIFIC DiI'ULSE
MPR-SAT-63-1
"7 .:
• 31
Vehicle Mixture Ratio [EX/Fuel2.4,
---- Reconstructed
2.3 _-
2.2
_---Predicted
2.1 ='
2.00 20 40 60 80 I00 120 140 160
Range Time (sec)
Vehicle Total FlowraCe (kgls) (Ib/s)4000
8000
3000 ____edi_ted 6000
2000 __
4000
Reconstructed
I0002000
e_
o J 00 20 40 60 80 100 120 140 160
- Range T/me (sec)
FIGURE 5-4 VEHICLE MIXTURE _TIO _ TOTAL FLOW _TK
MPR-SAT-63-1
32
The deviations shown above are computed by subtracting predicted
from actual and dividing by predicted. The largest deviation between
the two approaches is only 0.4%, which is well within expected resultsfrom the two methods.
5.4 PRESSURIZATION SYSTEMS
5.4. I FUEL TANK PRESSURIZATION
The fuel tank pressurization system (see Volume II) operated satis-
factorily during flight. Gaseous nitrogen, supplied by 48 high pres-
sure spheres, showed a pressure of 205 kg/cm 2 (2920 psi gauge) at lift-
off and decayed as expected to approximately 77.3 kg/cm 2 (ii00 psi
gauge) at OECO. During two time intervals the sphere pressure showed
slight increases. The first increase occurred between 60 and 80 sec-
onds. At 106 to 115 seconds, pressure again increased slightly.These small increases in pressure result from heat transferred through
the sphere walls to the nitrogen at a time in flight when little or no
gas is being used from the spheres. The spheres showed a rest pres-
sure of 70 kg/cm 2 (i000 psi gauge) at 160 seconds.
5.4.2 LOX TANK PRESSURIZATION
Initial pressurization of the LOX tanks, which was the final func-tion in the automatic sequence prior to ignition start timer, was pro-
vided by helium from a ground source. Pressurization was begun at
approximately T-II5 see and was stopped2bY the LOX tank pressure switchat T-39 sec at a pressure of 4.25 kg/cm (60.4 psi). The pressurizingtime of 76 sec was Ii sec shorter than the pressurizing time for Saturn
SA-2, due primarily to smaller initial volumes on SA-3 caused by theincreased propellant loading.
LOX tank pressurization throughout flight was as expected. The
small ullage volumes associated with this flight caused some problem
in accurately predicting the characteristics of the LOX tank pressure
curves. The prediction technique will be refined for Block II v_hicles,based on results of this flight.
The pressurization system is designed to maintain a differential
pressure between the center and outboard LOX tanks. The differential
pressure is necessary to cause d_pletion of the center tank prior to
depletion of the outboard tanks to prevent trapping of usable LOX inthe center tank. The required differential pressure is maintained by
orifices located in the pressurizing interconnect lines. The pressure
drop across these orifices was approximately 0.09 kg/cm 2 (1.3 psi)
lower than predicted at IECO.

33
5.4.3 CONTROL PRESSURE SYSTEH
The control pressure system operated as expected throughout the
SA-3 flight.
Blockhouse records showed the high-pressure-supply-sphere pressure
to be 195 kg/cm 2 (2780 psi gauge) at liftoff. This pressure graduallydecayed over flight to 144 kg/cm2_(2050 psi gauge) at 150 seconds.
Regulated pressure was 54.5 kg/cm _ (775 psi) at liftoff and gradually
decayed to 53.6 kg/cm 2 (762 psi) at 150 seconds. This absolute pres-
sure decay is expected with a gauge type regulator.
5.4.4 AIR BEARING SUPPLY
The purpose of the air bearing supply was to provide clean gaseous
nitrogen at a predetermined flow, temperature, and pressure to the air
" bearings of the ST-90 and ST-124P stabilized platforms.
Blockhouse records show that the air bearing high pressure supply
was maintained prior to launch at approximately 210 kg/cm 2 (2990 psi
gauge) for the ST-90 and 209_kg/cm Z (2970 psi gauge) for the ST-124P,which was within the redline limits of 220 kg/cm Z (3200 psi gauge)
maximum and 183 kg/cm 2 (2600 psi gauge) minimum. The low pressure air
to the air bearings of the ST-90 decayed slightly from 2.41 kg/cm 2
(34.3 psi) at 32 sec range time to 2.37 kg/cm 2 (33.7 psi) at 150 sec-
onds. The low pressure supply to the ST-124P remained constant at
2.24 kg/cm 2 (31.8 psi).
Specifications for the air bearing inlet air temperature stated
that the temperature must be maintained at 25 _ l°C. Blockhouse records
show that this temperature was maintained within specified limits.
Blockhouse records showed a cycling in the air bearing inlet air tem-
perature of approximately 8.9 cycles per minute, which was the effect
of a cycling of the thermostatically controlled inlet air heater.
5.5 VEHICLE PROPELLANT UTILIZATION
Overall vehicle propellant utilization (PU) for the flight of SA-3
was one of the most significant results of the test. An evaluation of
the PU, utilizing various types "of flight data, indicates that 99.4%
a of predicted total usable propellant was consumed during the flight.
The high percentage of propellant utilization resulted from the out-
board engines being allowed to deplete the LOX tanks before cutoff bythe "thrust OK" pressure switch. Center LOX tank depletion (gas break-
through), which should have occurred near IECO, occurred approximately
0.7 sec after IECO, due to a 0.09 kg/cm 2 (1.3 psi) lower-than-predicted
differential pressure between center and outboard L0X tanks.
An evaluation of vehicle propellant utilization indicates that
2145 kg (4,728 ib) of LOX and 3892 kg (8,581 Ib) of fuel remained on-board the vehicle at the end of outboard engine thrust decay. This
compares well with the predicted residuals which were 1454 kg (3197 Ib)of LOX and 2248 kg (4957 ib) of fuel. Of the 3892 kg (8,581 Ib) of
fuel left onboard, approximately 900 kg (2000 Ib) was loaded as extra
fuel, part of which is considered bias to insure the burning of anyextra LOX in the event it is usable and thereby assuring LOX depletion.
If the same cutoff timer had been used on SA-3 as was used on SA-I and
SA-2, cutoff would ha_e occurred 6 sec after IECO and the LOX and fuelresiduals would have been 4,765 kg (10,504 Ib) and 3443 kg (7,5911b)
_espectively, showing a substantial increase in performance for adepletion type cutoff.
In order to check overall vehicle propellant utilization, twelve
liquid level probes were located in each tank to indicate discrete
propellant levels during the flight. The most useful information ob-tained from the flight however, was the weight of propellant onboard
at the end of flight. Flow information during flight, based on the
liquid level probes, has not been entirely satisfactory. Various tech-
niques are being investigated to obtain reliable continuous flow infor-
mation from the liquid level probe signals.
A propellant utilization (PU) system was carried on the SA-3 flight
test (as on SA-I and SA-2) to determine system performance and reli-
ability and was not a control feature of the Saturn first stage. Re-suits from the PU system indicate that the propellant consumption rate
was close to predicted. Inboard engine cutoff (IECO) was initiated by
the level cutoff probe in LOX tank 04 at 141.66 sec range time, or 1.32
sec later than predicted. The late cutoff might be attributed to dis-
persion in performance parameters such as variables in engine callbra-
tion, container pressures, propellant loading and densities.
LOX container AP transducer output indicated a hlgher-than-pre-
dicted differential pressure throughout powered flight except duringthe time from II0 to 135 seconds. The fuel container _P transducer
output indicated a higher-than-predicted differential pressure through-
out powered flight. The _P ratio calculated from the LOX and fuel
container _P data was generally below predicted, particularly in the
period of 90 to 140 seconds. However, this correlates with the indi-
vidual propellant level and _P data and may therefore, be attributed
to performance dispersion.
Data from the liqui d level probes in the propellant tank may be
used to compare PU system performance. Fuel level probe data correlate
well with the PU system data. However, L0X level probe data indicate
35
that the PU system results do not correlate up to approximately i00
seconds. This difference in system results might be attributed to
difficulty in determining a valid LOX density, since the density error
on the PU system results would be greatest during the first portion of
flight, where the liquid column is highest, and would tend to diminishnear the end of powered flight, where the liquid column is lowest.
Overall propellant utilization system performance was considered
satisfactory although some disagreement was prevalent from the LOX dis-
crete level probe data. Some PU system performance data also varies
from predicted data; however, this may be attributed to performance
dispersion.
5.6 HYDRAULIC SYSTEM
The telemetered data from SA-3 flight indicated that operation of
all four hydraulic systems was satisfactory. All temperature, level,
and pressure measurements remained within acceptable operating limits.
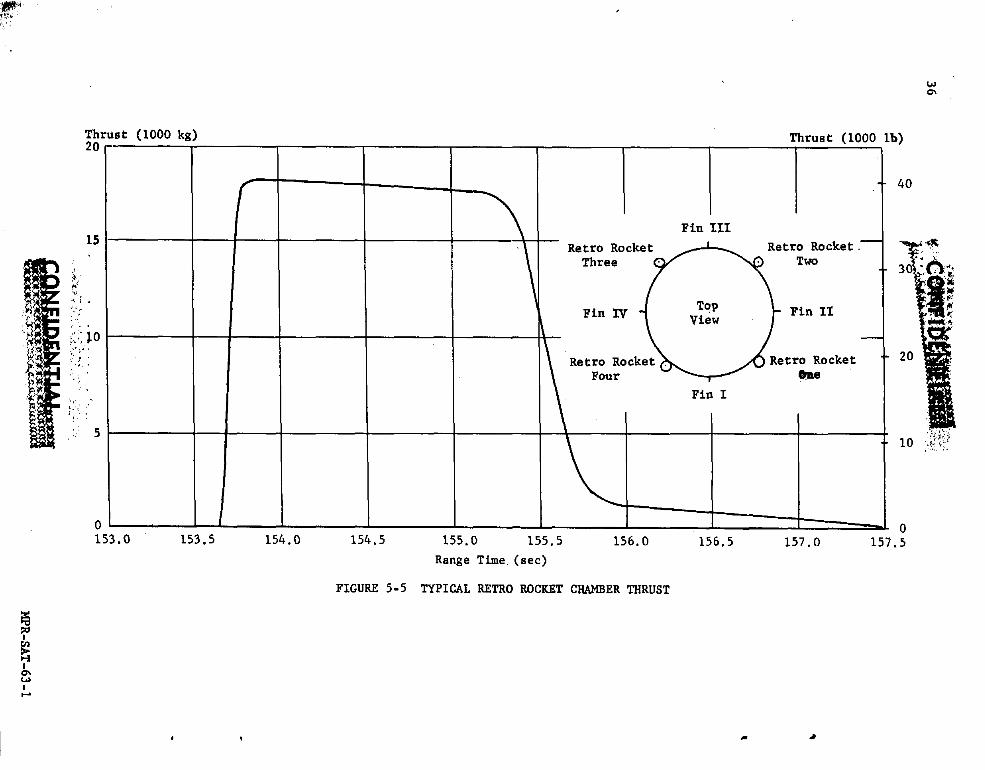
5.7 RETRO ROCKET PERFORMANCE
Four solid propellant retro rockets were flown on Saturn SA-3
vehicle; these retro rockets were the only active part of the S-I/S-I_
stage separation system flight tested on SA-3. The retro rockets were
mounted 90 deg apart on the spider beam at the top of the S-I stage.
Retro rocket thrust vectors were directed through the S-I stage center
of pressure. The rocket motors were directed downward and canted 12
deg from the vehicle centerline. Retro rocket locations are shown in
Figure 5-5. Retro rocket firing command (153.66 sec range time) was
given as scheduled, 12 sec after inboard engine cutoff on SA-3 vehicle.
A typical retro rocket thrust curve is shown in Figure 5-5.
Telemetered retro rocket chamber pressure data indicated satisfactory
retro rocket performance and approximately equal performance levels
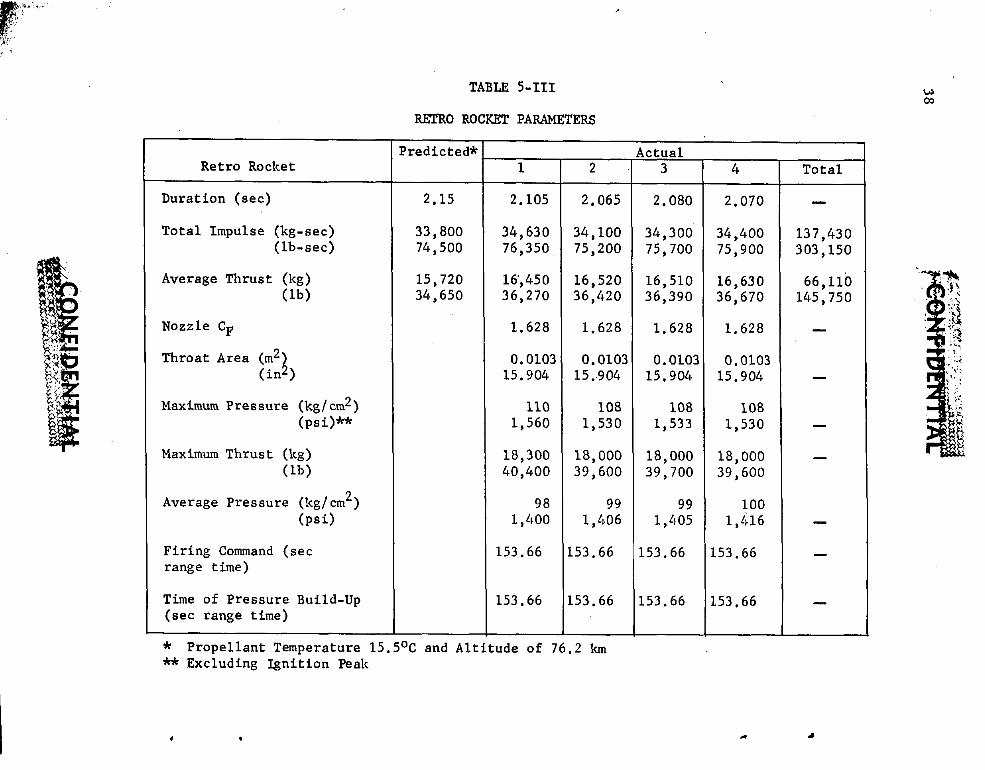
for the four retro rockets. The performance of the retro rockets was
within expected limits of the predicted, with total impulse as calcu-
lated from measured chamber pressures being about 1.77o higher than pre-
dicted. The performance as calculated from chamber pressures is sub-
stantiated by flight mechanical measurements (see Section 4.4). Mea-
sured and calculated retro rocket performance parameters are listed in
, Table 5-III along with some predicted values.
During retro rocket operation, a vehicle roll (clockwise viewed
from the rear) of approximately 4.3 deg/s occurred and is attributed
to a retro rocket misalignment of approximately 0.3 deg for each rocket.
- 37
The ST-90 platform roll limit of 15 deg was reached at 158.4 sec range
time. Retro rocket specifications did not require alignment to preventroll moments on the SA-3 vehicle. The misalignment of retro rockets
on SA-3 is not considered significant because S-l/S-IV separation was
not scheduled. Proper al±gnment of retro rockets on future Saturn
vehicles scheduling S-l/S-IV stage separation will he significant in
preventing possible S-I/S-IV stage interaction during separation.
, .. . ._-.
O0
.00
.IJoI
__
II
II
II
I
.... .
_ 39
6.0 (C) MASS CI_ARACTERISTICS
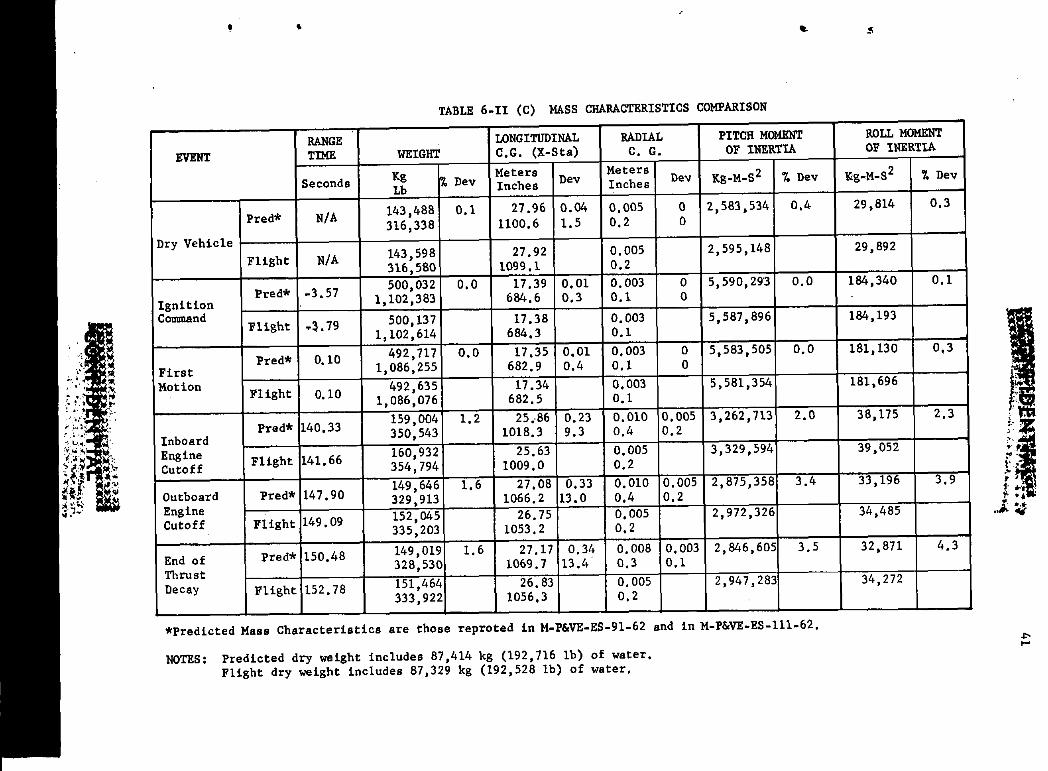
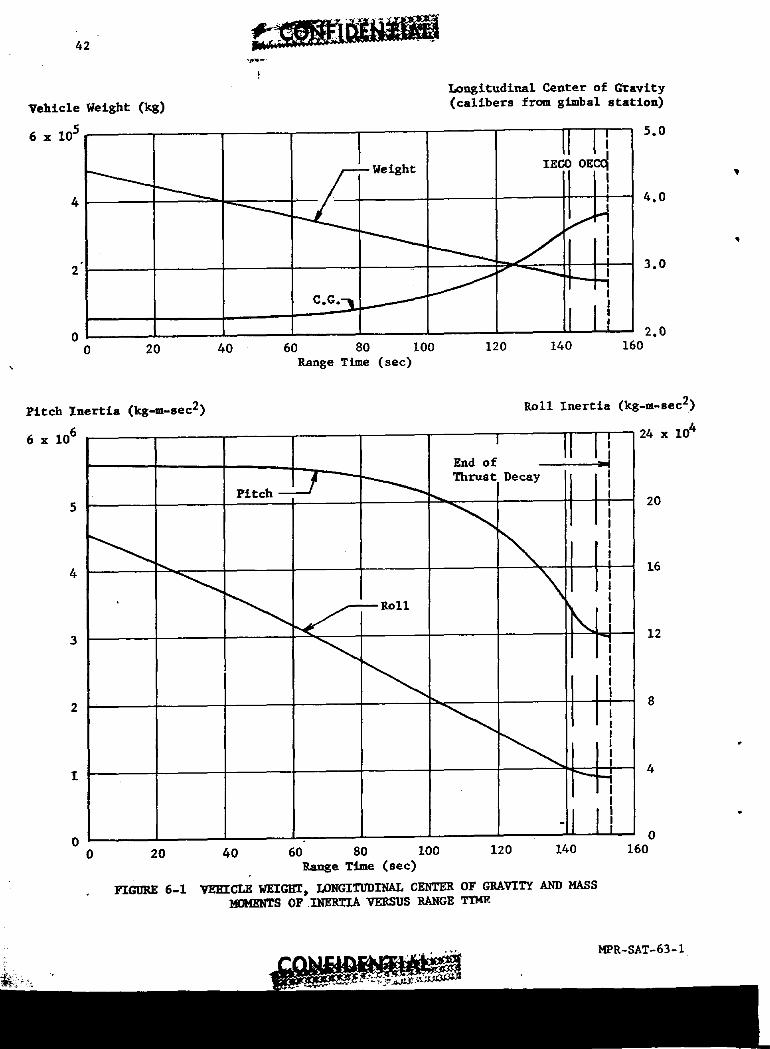
6.1 VEHICLE WEIGHTS
The total vehicle weight was approximately 500,137 kg (1,102,614
Ib) at ignition co_nand. Approximately 348,219 kg (767,692 ib) of
propellant were consumed during the S-I powered phase of flight (see
Figure 6-i). Table 6-I indicates weights at various flight events.
6.2 VEHICLE CENTER OF GRAVITY AND MOMENTS OF INERTIA
Longitudinal and radial center of gravity and pitch and rollmoments of inertia are given in Table 6-II. These parameters are also
plotted versus range time in Figure 6-1.

40_i:ii....
.,:
._-.....
_._:..._/!
.."
:..i
_._4
_'._,_
I.-4
;:3
0¢_I
0¢_
0,..4
.,'4
_:,-,dd®"
oo..........................
oo
oo
oo
oo
oo
oo
oo
oo
_',_d_Z
"_
•.
°•
°•
••
•°
°°.
••
o°
°•
•°
°•
°
®_
o_o
__
_aJ
t
Longitudinal Center of G_avityVehicle Weight: (kg) (calibers from gimbal station)
6 x 10 5 , 5.0If ,
1 "2" I 3.0
I!0 I 2.020 40 60 80 100 120 140 160
Range Time (sec)
Pitch Inertia (kg-m-sec 2) Roll Inertia (kg-m-sec 2)
6 x 10⁶ _ ] V -- 24 x 104
__ End of
5 _ _Thrust Decay _ _I 20
4 _ 16
3 12
2 8
I 4
I
0 • 00 20 40 60 80 I00 120 140 160
Rathe Time (sec)
FIGURE 6-1 VEHICLE WEIGHT, LONGqTUDINAL CEZ_"ER OF GRAVTTYANDMASS/_0MENTS OF INERTIAVERSUS RANGE TYM_
MPR- SAT- 63-1
• _ • _6_ _ _
43
;. o (u) co_,rn_.oL
7.1 SUMMARY
The control system for the Saturn vehicle SA-3 was essentiallythe same as that used in SA-I and SA-2. However, the control gains
(ao and bo) were changed because of the increased propellant loadingin order to maintain the same correlation with the vehicle mass as on
B SA-I and SA-2.
The tilt program for the ST-90 platform was generated by a syn-chronous motor driven cam as on SA-2. Transients which appeared in
the pitch actuator deflections on SA-2_ due to a periodic resistance
encountered by the cam generating the tilt program, did not occur onSA-3.
Engine deflections, attitude angles, and angles-of-attack wereless than those observed on SA-I and SA-2 flights primarily due to the
trajectory shape. The greatest wind speeds occurred in the pitch planedirection and were nearly the same as experienced on SA-2.
The Statham control accelerometers, which were flown for opera-
tional study purposes for the first time on SA-3, indicate that theyshould be satisfactory'for closed loop operation. Statham accelero-
meters will be in closed loop o_eration on SA-4. The control rate gyro
package also performed properly. The usual vibration effects were pre-
sent, although not detrimental with proper filtering if the rate gyropackage was used as an active control sensor in its present location.
Angle-of-attack measuring systems all performed satisfactorily.
An "upwash effect" was noticed at subsonic speeds on the Q-ball angle-of-attack sensor. With this properly taken into account the Q-ball
could have been used for control up to I00-II0 sec of flight.
The operations of the hydraulic actuators and the control compu-ter were satisfactory.
The attitude measurements from the passenger ST-124P platform
were satisfactory except for some differences which are explained bythe fact that the ST-124P was not aligned accurately in azimuth and the
• resolver cha%n was not "trimmed" as will be done for SA-4.
44
7.2 S-I CONTROL ANALYSIS
7.2.1 PITCH PLANE
The maximum pitch plane control parameters for the SA-3 powered
flight were:
Parameter Magnitude Range Time (sec)
Attitude 1.8 deg 88.5
Angle-of-Attack (Free-stream) -6.8 deg 115.0
Angular Velocity -I.0 deg/s 101.4Normal Acceleration -I.I m/s 2 83.3
Actuator Position -2.8 deg 83.3
Pitch attitude deviations were essentially zero prior to 50 sec
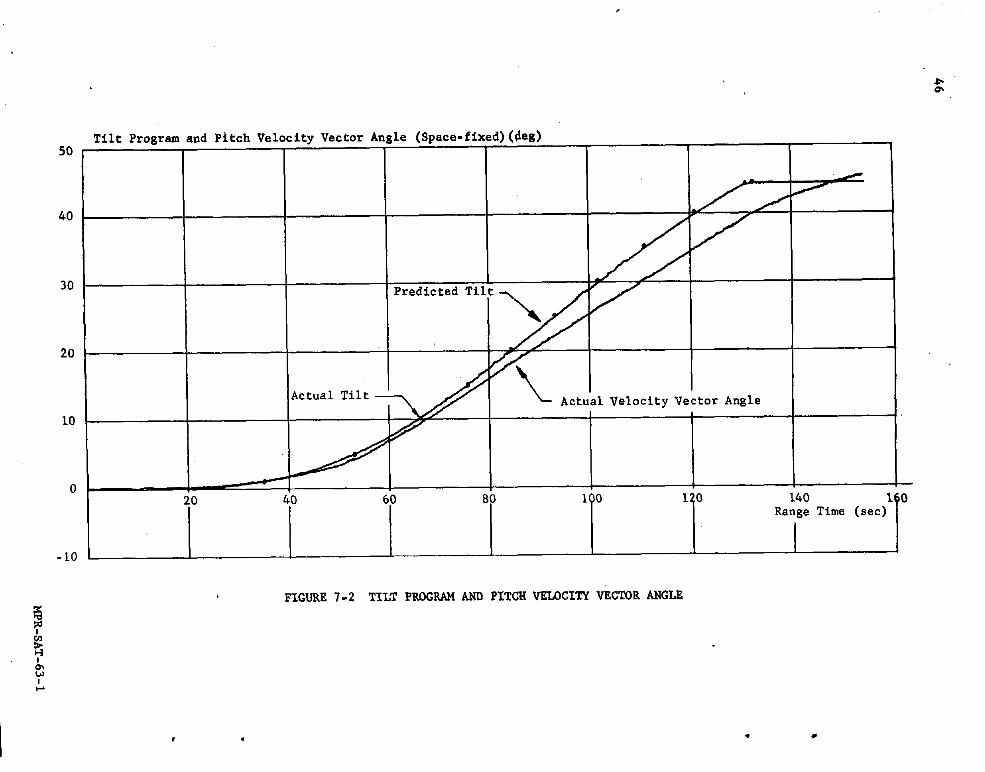
and after 115 sec (see Figure 7-1). Vehicle tilting was initiated by
the ST-90 tilt cam (similar to the one used on SA-2) at 10.33 seconds.
The tilting program (Figure 7-2) was based on eight engine operation
prior to 20 sec and seven engine operation for the remainder of the
flight, in order to minimize control requirements in the event of an
engine failure. According to measurements made of the ST-90 cam by
LVOD, the actual tilt program cut on the cam started differing from therequested tilt beginning around 90 seconds. Final tilt arrest occurredat 132.03 sec with the vehicle tilted 44.28 degrees from the launch
vertical.
The cam device provided continuous tilting from the time of in-
itiation at 10.33 sec, until tilt arrest at 132.03 sec, with the tilt
rate varying between zero and a maximum of 0.6 deg/s at 85 seconds.
Periodic transients, which occurred in the actuator position of SA-2due to the cam device, did not occur on SA-3.
The maximum actuator deflection of -2.8 degrees occurred at 83.3
see (Figure 7-1) as a result of a wind gradient of 0.023/s acting overan altitude increment of 390 meters. This gust had a velocity ihcre-
ment of 9.0 m/s as determined from the angle-of-attack winds compared
to 8.7 m/s from rawinsonde measurements. The wind component variation
with altitude for the pitch plane was very similar to previous Saturn
flights in both magnitude and direction (tail wind). Angles-of-attack
and engine deflections were lower, however, due to the different tra-
jectory flown by SA-3 and changed control gains.
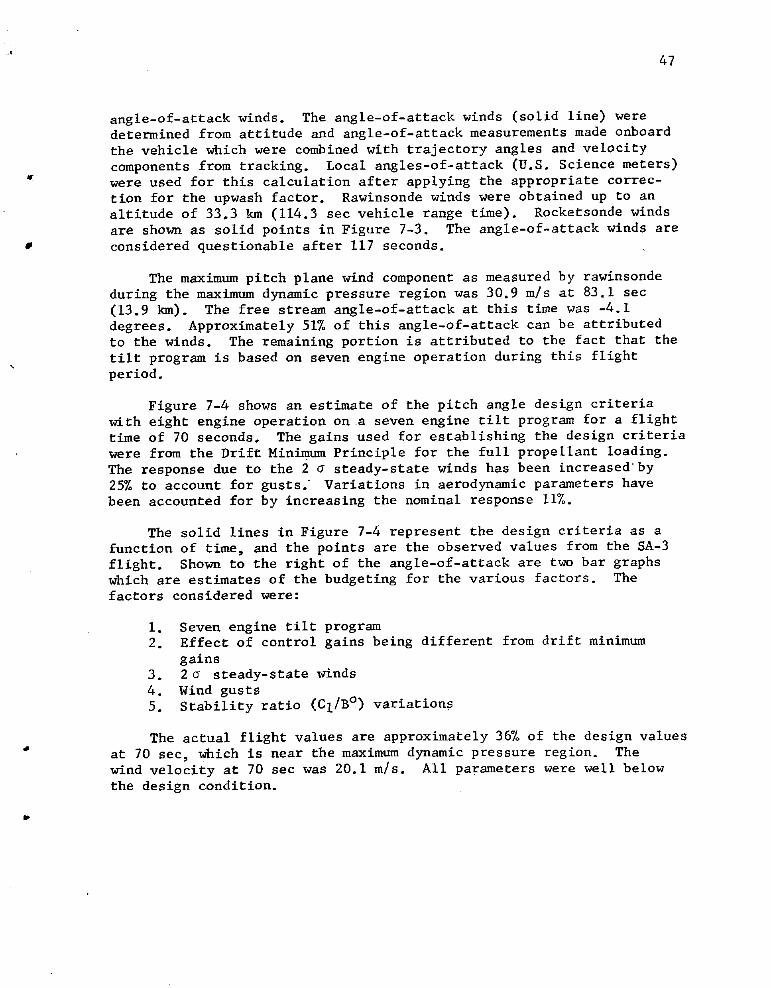
Shown in Figure 7-3 is a comparison of the pitch component windsas a function of time from three sources; rawinsonde, rocketsonde, and

45
46
47
angle-of-attack winds. The angle-of-attack winds (solid line) weredetermined from attitude and angle-of-attack measurements made onboard
the vehicle which were combined with trajectory angles and velocity
components from tracking. Local angles-of-attack (U.S. Science meters)were used for this calculation after applying the appropriate correc-
tion for the upwash factor. Rawinsonde winds were obtained up to an
altitude of 33.3 km (114.3 sec vehicle range time). Rocketsonde winds
are shown as solid points in Figure 7-3. The angle-of-attack winds are
u considered questionable after 117 seconds.
The maximum pitch plane wind component as measured by rawinsonde
during the maximum dynamic pressure region was 30.9 m/s at 83.1 sec
(13.9 km). The free stream angle-of-attack at this time was -4.1
degrees. Approximately 51% of this angle-of-attack can be attributedto the winds. The remaining portion is attributed to the fact that the
tilt program is based on seven engine operation during this flight
period.
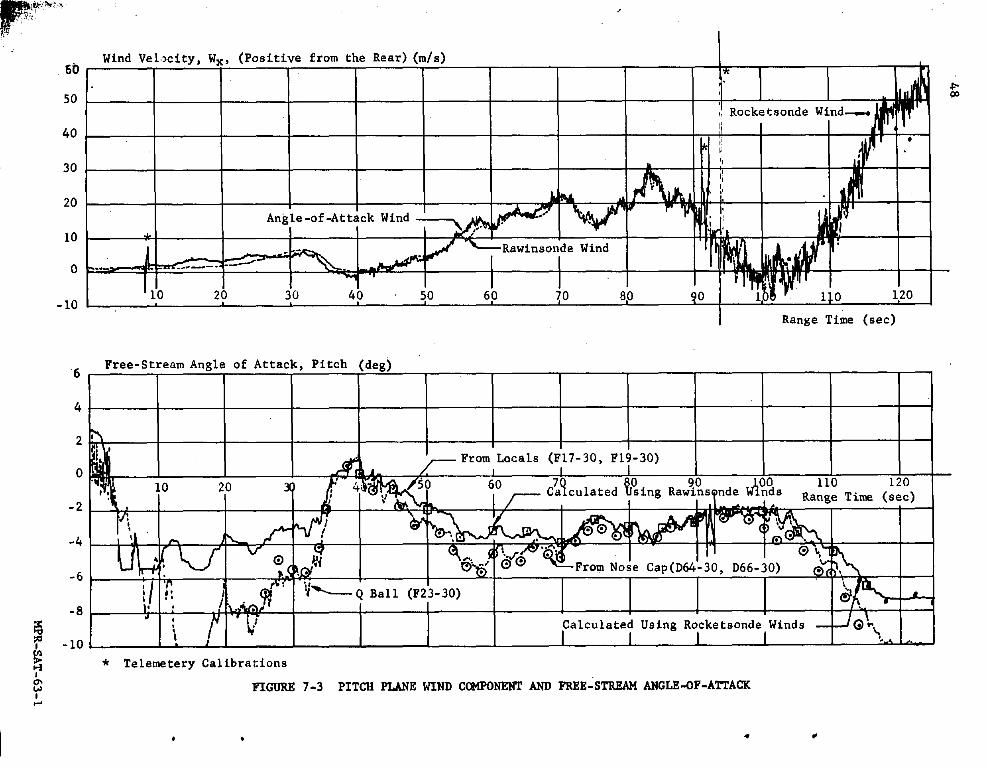
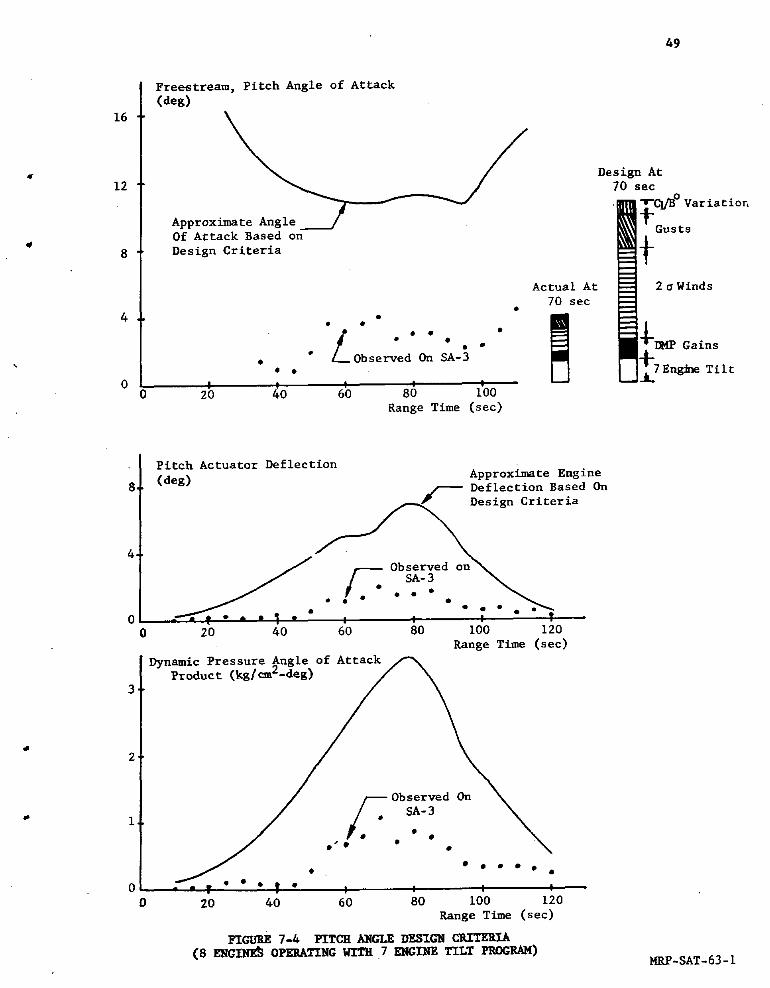
Figure 7-4 shows an estimate of the pitch angle design criteria
with eight engine operation on a seven engine tilt program for a flight
time of 70 seconds. The gains used for establishing the design criteriawere from the Drift Minimum Principle for the full propellant loading.
The response due to the 2 o steady-state winds has been increased by
25% to account for gusts. Variations in aerodynamic parameters have
been accounted for by increasing the nominal response 11%.
The solid lines in Figure 7-4 represent the design criteria as a
function of time, and the points are the observed values from the SA-3
flight. Shown to the right of the angle-of-attack are two bar graphswhich are estimates of the budgeting for the various factors. Thefactors considered were:
I. Seven engine tilt program2. Effect of control gains being different from drift minimum
gains3. 2 _ steady-state winds
4. Wind gusts5. Stability ratio (CI/B °) variation_
The actual flight values are approximately 36% of the design values
• at 70 sec, which is near the maximum dynamic pressure region. The
wind velocity at 70 sec was 20.1 m/s. All parameters were well below
the design condition.
-48
-I
_----
.C
'q
'°
_-e-
g_?-_
o-
.,!i
___._
oi
,,o
,_....
,
I
_=.
MP
R-SA
T-63
-I
49
Freestream, Pitch Angle of Attack(deg)
Design At12 70 sec
• __Cl/B 0 VariationApproxOf Attack Based on Gusts#
8 Design Criteria
Actual At 2 o Winds
70 sec4 • •
"L • • •
• • • Gains, • Observed On SA-
• • Tilt0 I o o o o
0 20 40 60 80 i00
Range Time (sec)
Pitch Actuator Deflection
8. (deg) Approximate Engine
F Deflection Based On
Des ign Criteria4-
F---- Observed on
I . SA-3 \./...-.
0 : _ : •0 20 40 60 80 100 120
Range Time (sec)
Dynamic Pressure Angle of AttackProdu
3
d
2
B i,
0 " " Y • • • _ • ! o I I0 20 _0 60 80 i00 120
Range Time (sec)
FI_u_RE 7-4 PITCH AIqGLE DEST.GN CI_.'rERT.A(8 ENGINE_ OPERATING WITH 7 ENGINE TILT PROGRAM)
MRP-SAT-63-1
50
7.2.2 YAW PLANE
The maximum yaw plane control parameters for the SA-3 powered
flight were:
Parameter Magnitude Range Time (sec)
Attitude -0.4 deg 80.6
Angle-of-Attack (Free-stream) 1.3 deg 79.5
Angular Velocity -0.6 deg/s 104.5Normal Acceleration 0.5 m/s 2 77.9
Actuator Position -1.7 deg 103.7
Small yaw deviations were observed throughout the powered flight
(Figure 7-5). Essentially all of these deviations were the results
of winds. Comparatively large actuator movements occurred around i00seconds. The largest actuator deflection was -1.7 deg at 103.7 sec as
a result of a wind gradient of 0.02/s over an altitude increment of
670 meters. This wind gust had a velocity increment of 13.5 m/s as
determined from angle-of-attack winds compared to 12.4 from rawinsondewinds.
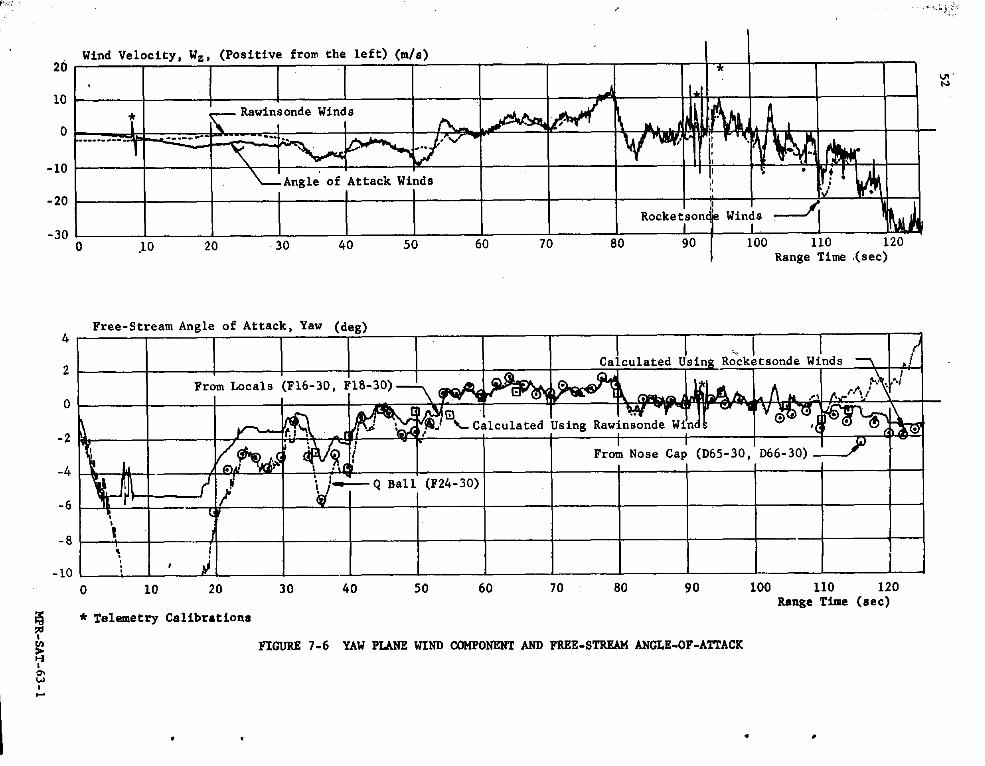
Yaw plane wind components (Figure 7-6) were very light throughoutthe flight. The maximum yaw plane wind component was 13.2 m/s (from
the left) at an altitude of 12.4 km (79.6 seconds). As in the pitch
plane, good agreement existed between the angle-of-attack winds (solidlines} and the rawinsonde winds (dashed lines). Rocketsonde winds
(solid points) were also in good agreement with both angle-of-attackand rawinsonde winds. The dynamic pressure at the point where the
angle-of-attack winds appear to be unreliable (122 sec) was 0.026
kg/cm 2.
7.2.3 ROLL PLANE
Roll attitude of the vehicle was maintained by differentially
deflecting the outboard control engines in both pitch and yaw.
The maximum roll plane control parameters for the SA-3 powered
flight were:
Parameter Magnitude Range Time (sec)
Attitude 0.7 deg 142,1
Angular Velocity -0.6 deg/s 143.0
Effective Engine Deflection -0. I deg 80.0

51
Ii°
•!
v
•;
o
o
ii
iI
MPR-SAT-63
-l
z_
-_
o....
o
o__
_,
Q0
¢.I
•oo
oo
oo
__
oe_
.._
_0a
oil
II
!
_R-SA
T-
63-
1
53
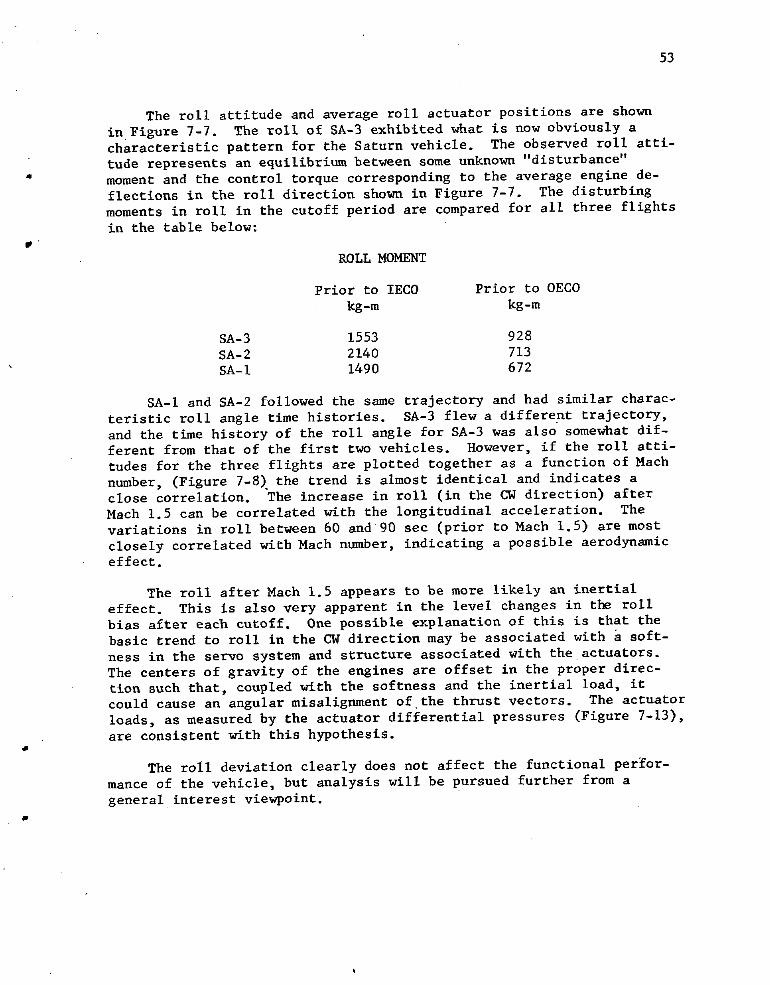
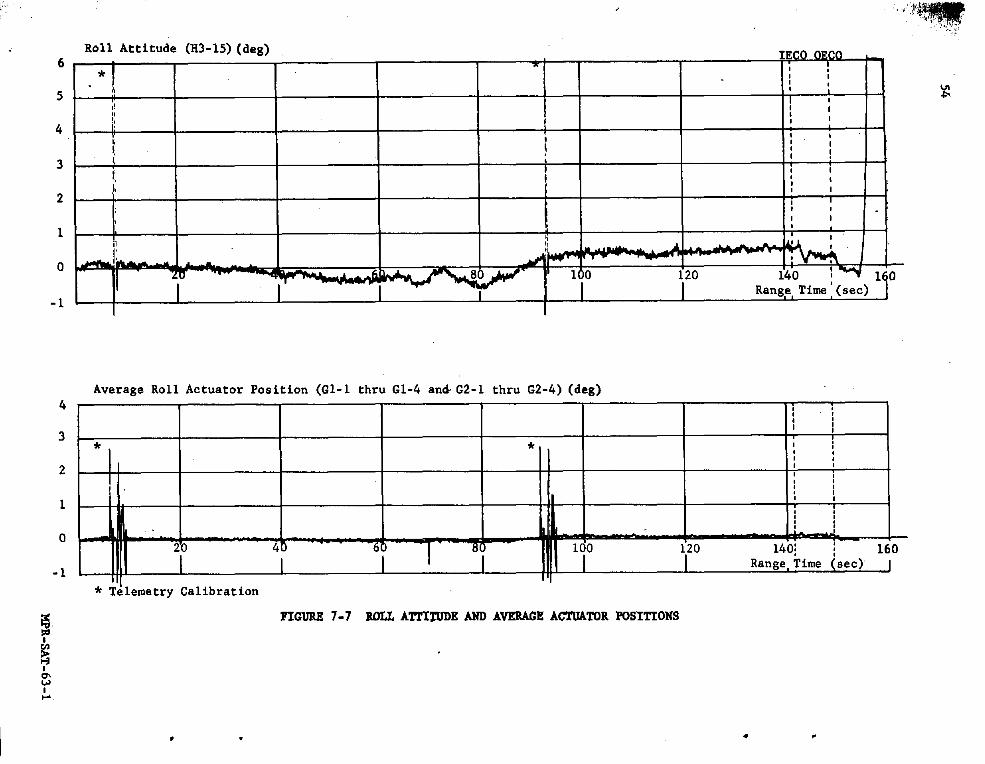
The roll attitude and average roll actuator positions are shown
inFigure 7-7. The roll of SA-3 exhibited what is now obviously acharacteristic pattern for the Saturn vehicle. The observed roll atti-
tude represents an equilibrium hetween some unknown "disturbance"
moment and the control torque corresponding to the average engine de-
flections in the roll direction shown in Figure 7-7. The disturbing
moments in roll in the cutoff period are compared for all three flightsin the table below:
f
ROLL MOMENT
Prior to IECO Prior to OECO
kg-m kg-m
SA-3 1553 928
SA-2 2140 713SA-I 1490 672
SA-I and SA-2 followed the same trajectory and had similar charac-
teristic roll angle time histories. SA-3 flew a different trajectory,
and the time history of the roll angle for SA-3 was also somewhat dif-
ferent from that of the first two vehicles. However, if the roll atti-
tudes for the three flights are plotted together as a function of Math
number, (Figure 7-8) the trend is almost identical and indicates aclose correlation. The increase in roll (in the CW direction) after
Math 1.5 can be correlated with the longitudinal acceleration. The
variations in roll between 60 and 90 see (prior to Math 1.5) are most
closely correlated with Math number, indicating a possible aerodynamiceffect.
The roll after Math 1.5 appears to be more likely an inertial
effect. This is also very apparent in the level changes in the roll
bias after each cutoff. One possible explanation of this is that the
basic trend to roll in the CW direction may be associated with a soft-
ness in the servo system and structure associated with the actuators.
The centers of gravity of the engines are offset in the proper direc-
tion such that, coupled with the softness and the inertial load, it
could cause an angular misalignment of the thrust vectors. The actuator
loads, as measured by the actuator differential pressures (Figure 7-13),
are consistent with this hypothesiS.4
The roll deviation clearly does not affect the functional perfor-
mance of the vehicle, but analysis will be pursued further from a
general interest viewpoint.
P-4
p--GI
........................._
.__
-_x
1o
_
•2
.I
e_t
.we_0
_m
_o0
_
o_
.__
-:,c
!!
MP
R-SA
T°63-i

55
MPR-SAT-63-1
56
7.2.4 ATTITUDE AND CONTROL AFTERCUTOFF
The cutoff of the outboard engines at 149.09 sec excited the vehi-
cle first bending mode in both pitch and yaw at a coupled frequency of
2.6 to 2.7 cps. The damping of the bending in yaw was approximately
2% of critical damping. Bending in pitch initially damped until 151
sec, after which the amplitude remained almost constant until ignition
of the retro rockets at 153.66 seconds. After this, damping was essen-
tially normal in both planes.
As the engine thrust decays, the first bending mode coupled rootapproaches the unstable region. A root locus analysis indicated that
at zero thrust the mode in pitch would be slightly unstable, which is
in agreement with the flight. There is a difference between pitchand yaw mounting constraints of the instrument canister containing the
platform, such that the control feedback gain in yaw was 0.5 to 0.6
, that in pitch. At zero thrust this would give an increasing damping
effect. However, this by itself would not explain the damping observedin yaw. There must be other effects. Some possibilities might be a
difference in structural damping in yaw, increased phase lag of the
servo system at small amplitudes, and other possible non-linearitiesin the complete system.
See Volume II for further discussion of the root locus analysis.
Since the effect of the thrust vector angularity of the engines
during thrust decay is of interest in future design, values have beenobtained for all three Saturn vehicle flights. The largest thrust vec-
tor angularity during any portion of the decay period that has beenconsidered occurred on SA-I and was 0.38 deg during the i_/o to 07o thrust
decay period. The values obtained for the SA~3 flight are listed
below. All values are well within the design angularity of one deg
allowed for in the S-IV stage separation design.
Thrust Vector Angularity During Cutoff Decay
Pitch (deg) Yaw (deg)
i00 to l0 Percent 0.21 0.08Thrust
l0 to 0 Percent 0.08 0.14
Thrust
I00 to 0 Percent 0.12 0.08Thrust
57
A large degree of uncertainty (estimated to be 0.75 deg) exists in the
above measurements due to the small deviations being analyzed.
Retro rockets were flown for the first time on SA-3 to test their
, functional performance prior to their use for separating the SI-SIV
stages on Block II vehicles. Close alignment tolerances for the retros
were waived for this flight and alignment was done to approximately
0.5 degrees.
At the time of retro rocket ignition (153.66 sec) a sharp roll
deviation began. At the end of retro rocket burning (155.73 sec), the
roll angular velocity had increased to 4.3 deg/s (Figure 7-9). To
obtain this roll rate an average misalignment of all four retro rockets
of 0.285 deg perpendicular to the cant angle planes, was required. If
there were any misalignments of the retro rockets in the pitch or yaw
planes, they were small and could not be determined. The roll attitude
angle measured on the $T-90 stabilized platform reached its mechanical
stop of 15 deg at 158.5 seconds. This forced the ST-90 out of refer-
ence in yaw and no usable vehicle attitude information was obtained
after this event. Figure 7-9 shows the simulation (dashed line) of
this event using the telemetered retro rocket chamber pressures, with
a misalignment of each retro rocket in the same direction in the roll
plane of 0.285 degrees.
7_3 FUNCTIONAL ANALYSIS
7.3.1 CONTROL SENSORS
7.3. I.I CONTROL ACCELEROMETERS
Two Statham control accelerometers (pitch and yaw) were flown for
operational study purposes for the first time on SA-3. The telemetered
accelerations (Figure 7-10) show proper operation of the equipment dur-
ing flight. These would have been acceptable for closed loop operation
in the flight control system. A comparison made between the telemetered
acceleration and that calculated from independent flight measurements
gives satisfactory agreement, less than 0.2 m/s 2, which is within the
error limits of the reduced data used in the comparison. A consider-
able amount of high frequency (approximately i0 to 15 cps) oscillations
appear on the measurements, but they are less than were experiencedfrom the Edcliff accelerometers flown in the same location on SA-I and
SA-2. Statham type control accelerometers will be flown in closed loop
control on SA-4, in place of the local angle-of-attack transducers.

., 58
Attitude Roll (I_3-15)(deS)
16 /-
J
' /
53 1: V+ 15 5 lJi6 1' 15 1:,9 1_Range Ti _e (sec)
-4
Angular Velocity Roll (F14-15) (deg/m)
4
Simulate_
3
/2
1 ,, ,,
f-0
t__4 _55 t__6 1: z 15, • 1.,9 1._Range Ti1_e (sec)
-1
I_GnBRE7-9 gOLL _ _ _OCXg¢
MPR-SAT-63°I
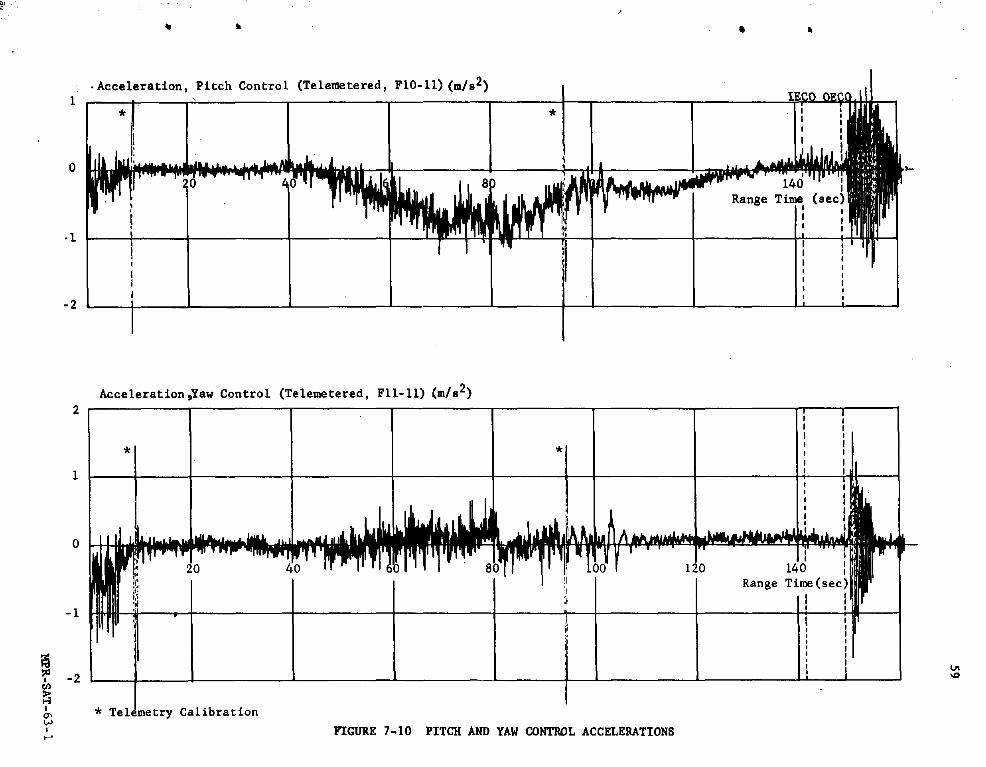
59
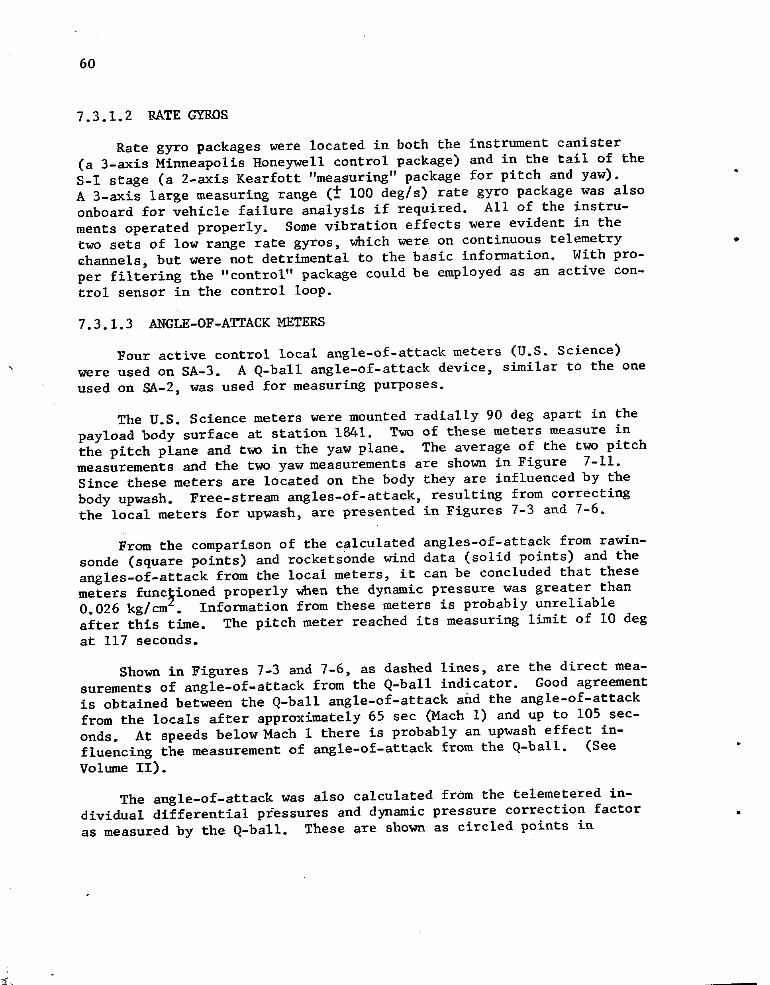
60
7.3.1.2 RATE GYROS
Rate gyro packages were located in both the instrument canister
(a 3-axis Minneapolis Honeywell control package) and in the tail of the
S-I stage (a 2-axis Kearfott "measuring" package for pitch and yaw).
A 3-axis large measuring range (_ I00 deg/s) rate gyro package was also
onboard for vehicle failure analysis if required. All of the instru-
ments operated properly. Some vibration effects were evident in the
two sets of low range rate gyros, which were on continuous telemetry
channels, but were not detrimental to the basic information. With pro-
per filtering the "control" package could be employed as an active con-trol sensor in the control loop.
7.3.1.3 ANGLE-OF-ATTACKMETERS
Four active control local angle-of-attack meters (U.S. Science)
were used on SA-3. A Q-ball angle-of-attack device, similar to the one
used on SA-2, was used for measuring purposes.
The U.S. Science meters were mounted radially 90 deg apart in the
payload body surface at station 1841. Two of these meters measure in
the pitch plane and two in the yaw plane. The average of the two pitch
measurements and the two yaw measurements are shown in Figure 7-11.
Since these meters are located on the body they are influenced by the
body npwash. Free-stream angles-of-attack, resulting from correcting
the local meters for upwash, are presented in Figures 7-3 and 7-6.
From the comparison of the calculated angles-of-attack from rawin-
sonde (square points) and rockets0nde wind data (solid points) and the
angles-of-attack from the local meters, it can be concluded that these
meters functioned properly when the dynamic pressure was greater than0.026 kg/cm . Information from these meters is probably unreliable
after this time. The pitch meter reached its measuring limit of i0 degat 117 seconds.
Shown in Figures 7-3 and 7-6, as dashed lines, are the direct mea-
surements of angle-of-attack from the Q-ball indicator. Good agreement
is obtained between the Q-ball angle-of-attack and the angle-of-attack
from the locals after approximately 65 sec (Mach I) and up to 105 sec-
onds, At speeds below Mach i there is probably an upwash effect in-
fluencing the measurement of angle-of-attack from the Q-ball. (See
Volume II).
The angle-of-attack was also calculated from the telemetered in-
dividual differential pressures and dynamic pressure correction factor
as measured by the Q-ball. These are shown as circled points in
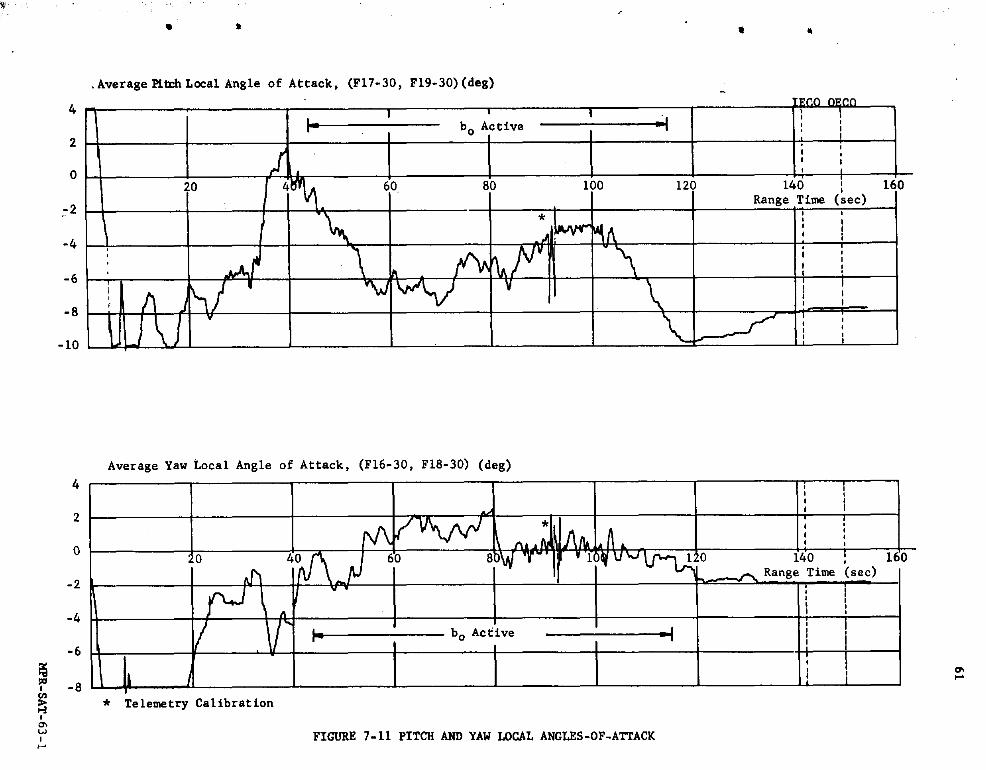
6i
v
..........
0_
.............................
_................
I
-5°,r
U
I_I
Ii
_I
Ii
iI
_R-SAT-63-1
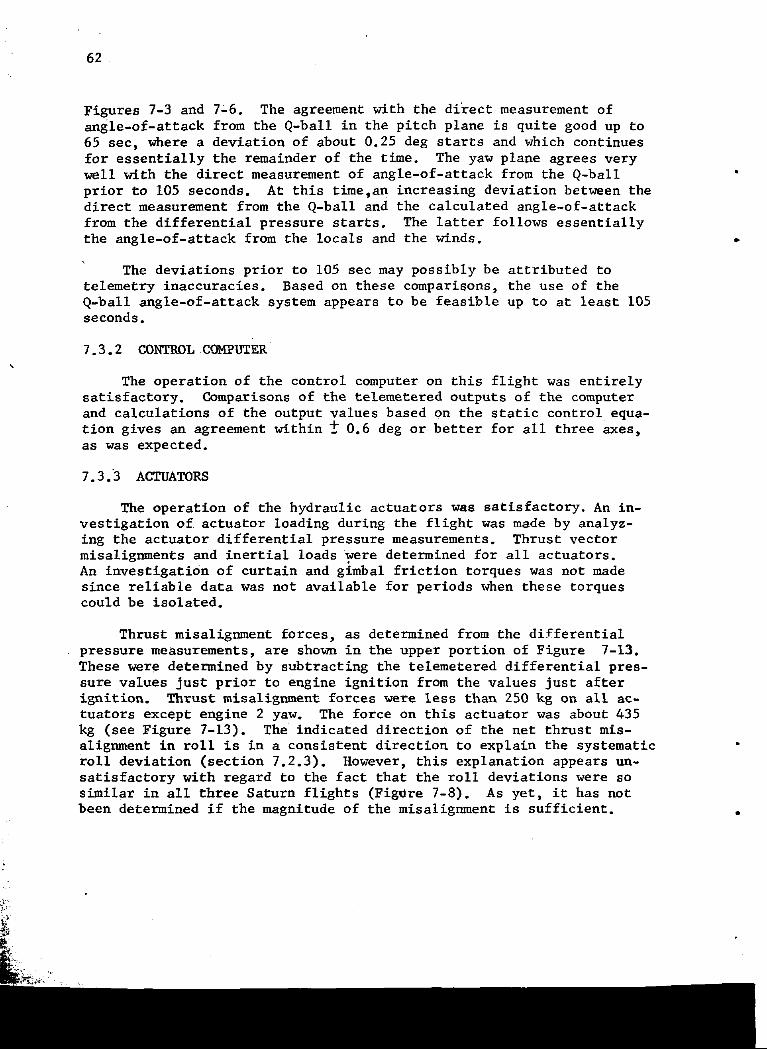
62
Figures 7-3 and 7-6. The agreement with the direct measurement of
angle-of-attack from the Q-ball in the pitch plane is quite good up to
65 sec, where a deviation of about 0.25 deg starts and which continuesfor essentially the remainder of the time. The yaw plane agrees very
well with the direct measurement of angle-of-attack from the Q-ball
prior to 105 seconds. At this time,an increasing deviation between thedirect measurement from the Q-ball and the calculated angle-of-attack
from the differential pressure starts. The latter follows essentially
the angle-of-attack from the locals and the winds.
The deviations prior to 105 sec may possibly be attributed to
telemetry inaccuracies. Based on these comparisons, the use of the
Q-ball angle-of-attack system appears to be feasible up to at least 105seconds.
7.3.2 CONTROL COMPUTER
The operation of the control computer on this flight was entirely
satisfactory. Comparisons of the telemetered outputs of the computer
and calculations of the output values based on the static control equa-
tion gives an agreement within _ 0.6 deg or better for all three axes,
as was expected.
7.3.3 ACTUATORS
The operation of the hydraulic actuators was satisfactory. An in-
vestigation of actuator loading during the flight was made by analyz-
ing the actuator differential pressure measurements. Thrust vector
misalignments and inertial loads were determined for all actuators.
An investigation of curtain and gimbal friction torques was not made
since reliable data was not available for periods when these torquescould be isolated.
Thrust misalignment forces, as determined from the differential
pressure measurements, are shown in the upper portion of Figure 7-13.
These were determined by subtracting the telemetered differential pres-
sure values just prior to engine ignition from the values just after
ignition. Thrust misalignment forces were less than 250 kg on all ac-
tuators except engine 2 yaw. The force on this actuator was about 435
kg (see Figure 7-13). The indicated direction of the net thrust mis-alignment in roll is in a consistent direction to explain the systematic
roll deviation (section 7.2.3). However, this explanation appears un-satisfactory with regard to the fact that the roll deviations were so
similar in all three Saturn flights (FigUre 7-8). As yet, it has not
been determined if the magnitude of the misalignment is sufficient.
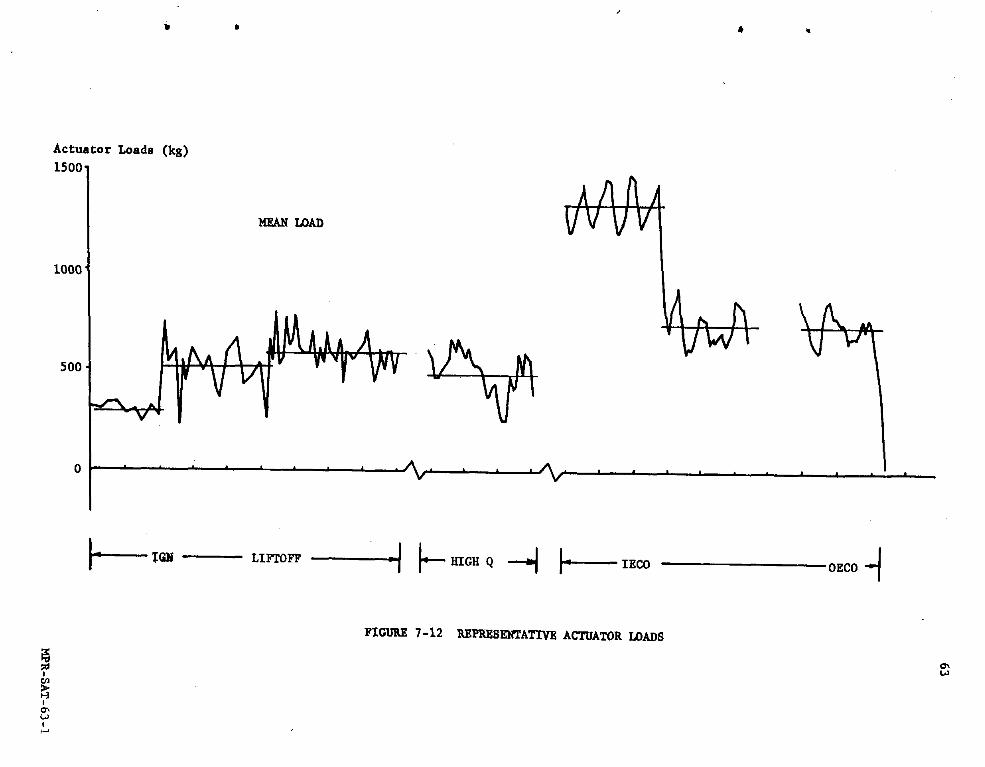
63
I
r_0
._--"m
CO
-!
C_
!
00
O0
O0
_JO
00
u_
0
MPR-SAT-63-
I
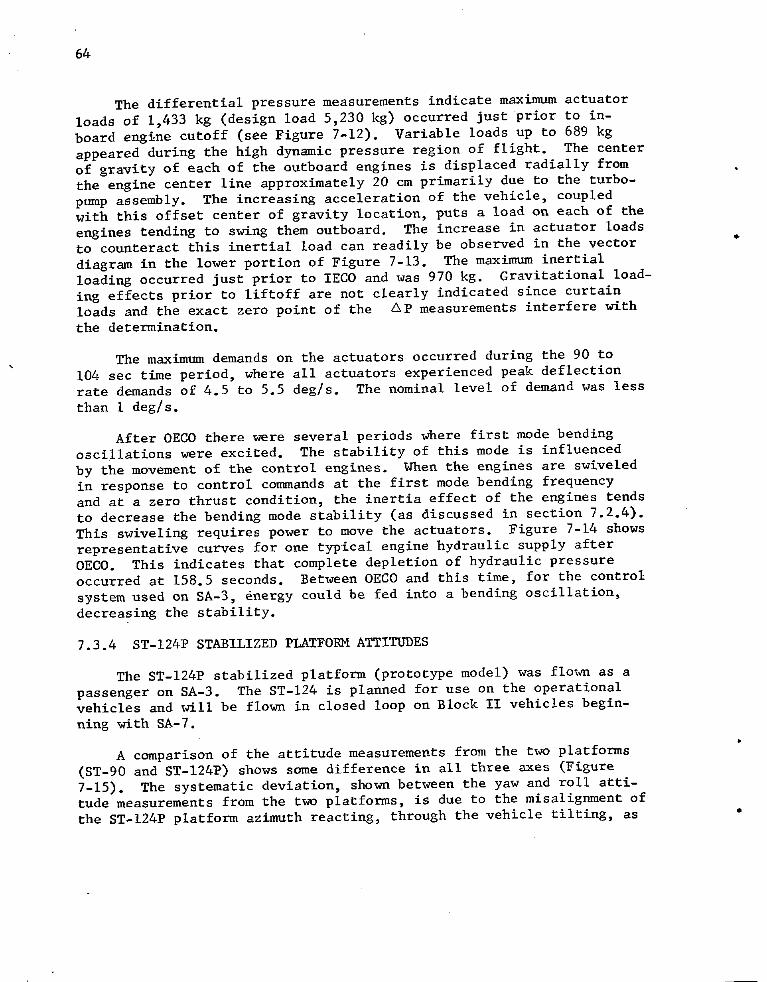
64
The differential pressure measurements indicate maximum actuator
loads of 1,433 kg (design load 5,230 kg) occurred just prior to in-
board engine cutoff (see Figure 7-12). Variable loads up to 689 kg
appeared during the high dynamic pressure region of flight. The center
of gravity of each of the outboard engines is displaced radially from
the engine center line approximately 20 cm primarily due to the turbo-
pump assembly. The increasing acceleration of the vehicle, coupled
with this offset center of gravity location, puts a load on each of the
engines tending to swing them outboard. The increase in actuator loads
to counteract this inertial load can readily be observed in the vector
diagram in the lower portion of Figure 7-13. The maximum inertial
loading occurred just prior to IECO and was 970 kg. Gravitational load-
ing effects prior to liftoff are not clearly indicated since curtain
loads and the exact zero point of the _P measurements interfere withthe determination.
The maximum demands on the actuators occurred during the 90 to
104 sec time period, where all actuators experienced peak deflection
rate demands of 4.5 to 5.5 deg/s. The nominal level of demand was less
than 1 deg/s.
After OECO there were several periods where first mode bending
oscillations were excited. The stability of this mode is influenced
by the movement of the control engines. When the engines are swiveled
in response to control commands at the first mode bending frequency
and at a zero thrust condition, the inertia effect of the engines tends
to decrease the bending mode stability (as discussed in section 7.2.4).This swiveling requires power to move the actuators. Figure 7-14 shows
representative curves for one typical engine hydraulic supply after
OECO. This indicates that complete depletion of hydraulic pressure
occurred at 158.5 seconds. Between OECO and this time, for the control
system used on SA-3, energy could be fed into a bending oscillation,
decreasing the stability.
7.3.4 ST-124P STABILIZED PLATFORM ATTITUDES
The ST-124P stabilized platform (prototype model) was flown as a
passenger on SA-3. The ST-124 is planned for use on the operational
vehicles and will be flown in closed loop on Block II vehicles begin-
ning with SA-7.
A comparison of the attitude measurements from the two platforms
(ST-90 and ST-124P) shows some difference in all three axes (Figure
7-15). The systematic deviation, shown between the yaw and roll atti-
tude measurements from the two platforms, is due to the misalignment of
the ST-124P platform azimuth reacting, through the vehicle tilting, as
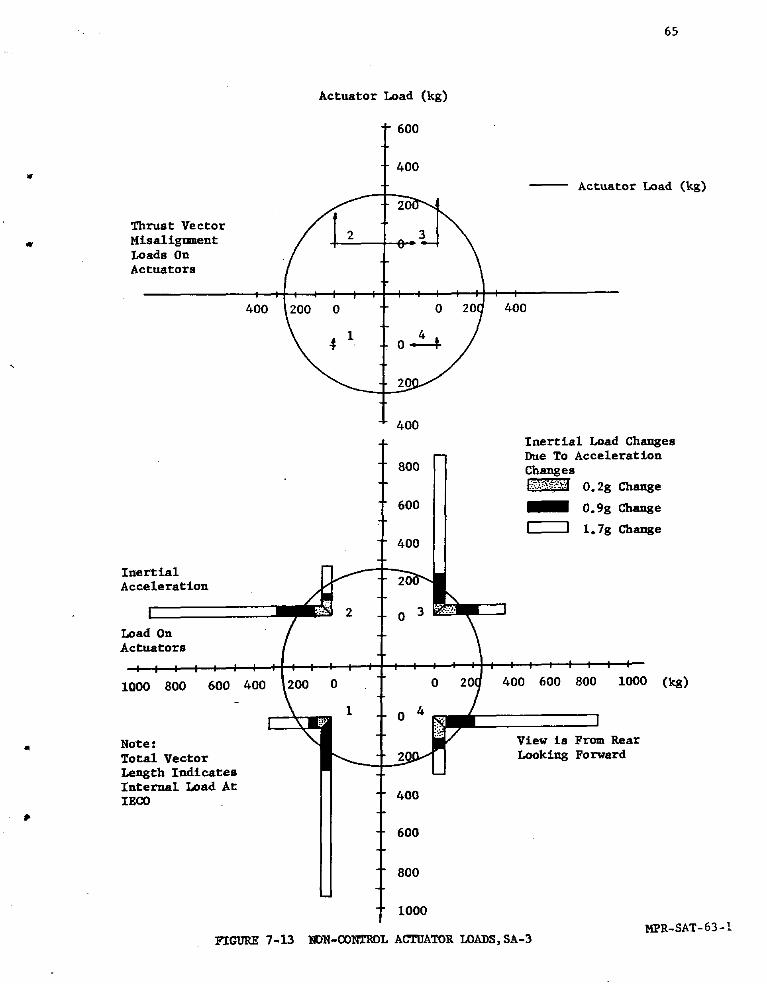
65
Actuator Ioad (kg)
600
4OO
-- Actuato_ Load (k_)
Misalignment [ 2 $ _3Loads OnActuators
400' ' _200 lo l l l, lo 1201 I 1400
400
Inertial Load ChangesDue To Acceleration
800 Changes
0.2g Change
600 _ O.9g Change
Y"----] 1.7g Change• 400
InertialAcceleration
I 2 0 3
Load OnActuators
1000 800 600 400 200 0 0 400 600 800 1000 (kg)
1 ,0 4 ]
Note: View is From RearTotal Vector 2 Looking Forward
Length IndicatesInternal Load AtIEC0 400
600
800
i000
MPR-SAT-63-IFIGURE 7-13 NDN-CONTROL ACTUATOR LOADS,SA-3
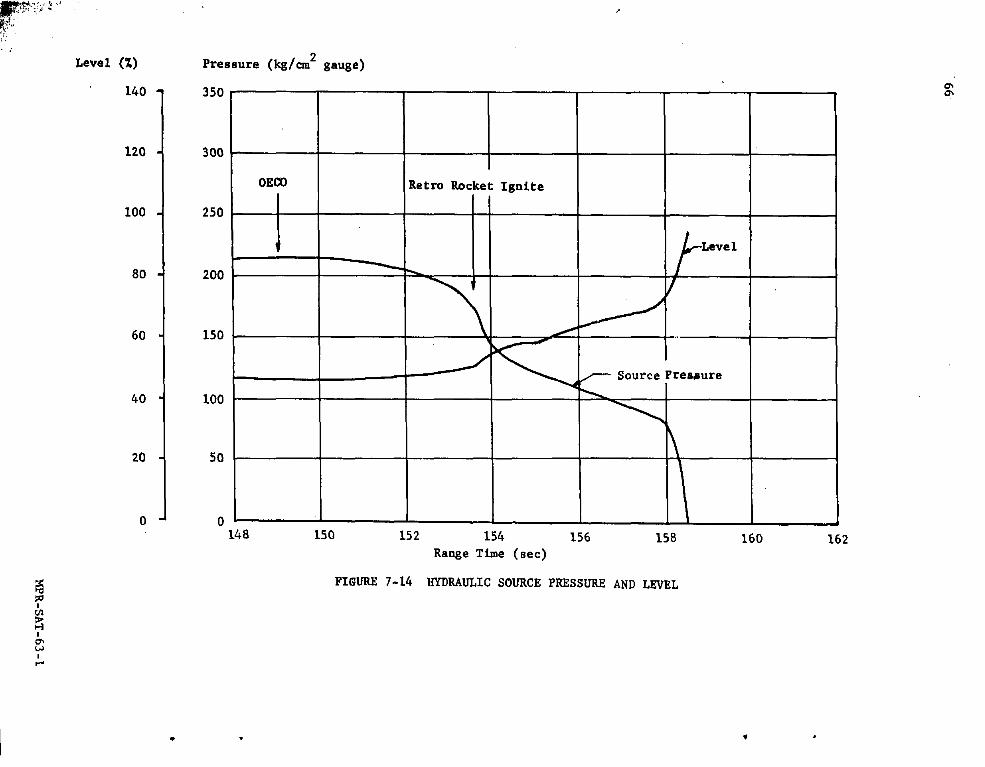
66¢
!|
||
|i
I
,,,,4@
_MPR-BAT-63-
I
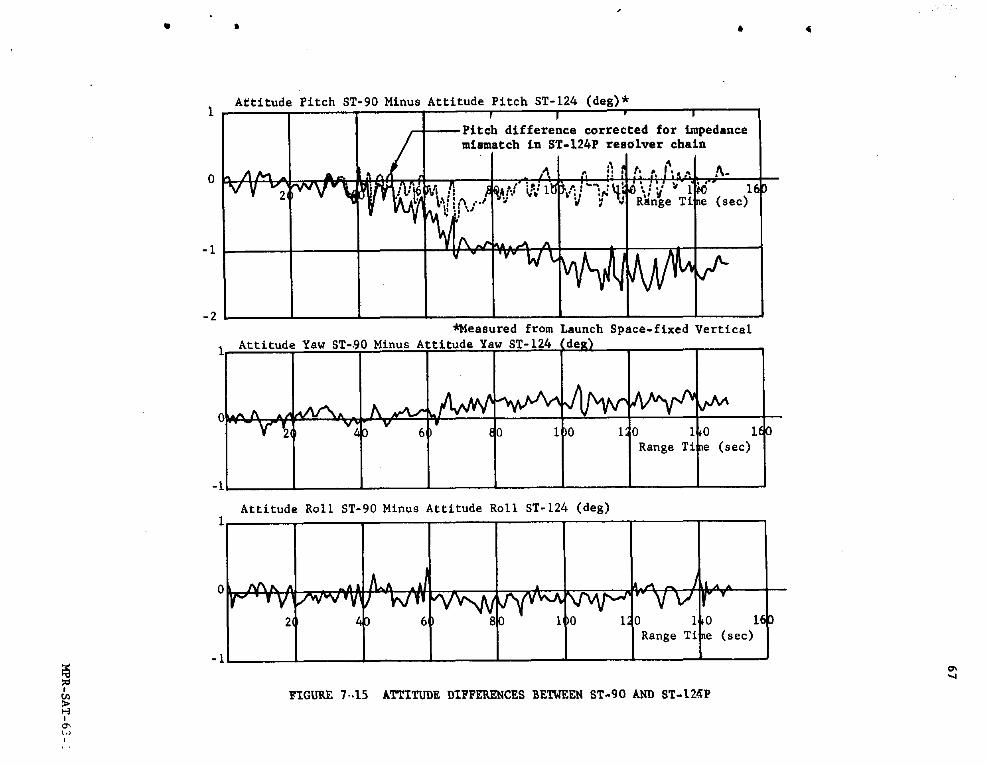
MPR-SAT-62-

68
mentioned in section 8.53° The additional small differences are felt
to be due to excess backlash in the servo system gear trains in the
ST-124P and telemetry and data reduction errors. The much larger sys-
tematic difference between the pitch attitude angles is due to an im-
pedance mismatch in the ST-124P resolver chain. This pitch angular
error (_ e) is a function of the impedance mismatch and the sine of
twice the resolved angle _i.e. _ e - M sin 2X ). X is the tilt angleof the ST-124P outer pitch resolver. The dashed line in Figure 7-15
shows the remaining difference in the pitch angles after a correction
for a 1.3 _ (approximately 0.3%) impedance mismatch error has beenmade.
To substantiate the mismatch assumption, the platform for SA-4
was tested and found to have a similar error build-up as the tilt pro-
gram was run in. The error for a tilt angle of 44 deg amounted to
1.75 degrees. This will be reduced to less than 0.25 deg by balancing
out the major portion of the mismatch before the platform is flown.
7.4 PROPELLANT SLOSHING
The same baffle configurations were used in the outer propellant
tanks as used on SA-2 (see Volume II). These baffles again proved
effective in keeping sloshing _plitudes at low levels. However, some
oscillations at the sloshing frequency were noted in the engine posi-
tions. A peak amplitude of _ 0.2 deg occurred in the pitch actuator
positions at 145 sec, being damped out by OECO.
Sloshing in three of the nine propellant tanks was measured by
means of differential pressure measurements. Slosh measurements were
made in the center LOX tank, LOX tank 04 and fuel tank F2. The loca-
tions of these probes in the tanks are shown in Volume If. Measure-ments D6-OC (in center LOX tank) and D6-04 (LOX tank 04) were tele-
metered on continuous telemetry channels.
All of the measurements apparently functioned properly during mostof the flight except during the first few seconds, which is character-
istic. The first apparently valid information was obtained at thetimes indicated in the table below. Comparable times for SA-2 are alsoshown.
Start Times of Valid Slosh Measurements
SA-3 SA-2
D4-F2 0 sec - •
DS-F2 0 3 sec
D6-04 8 20
D7-04 29 iS
D6-0C 0 15
D7-0C 18 14
L
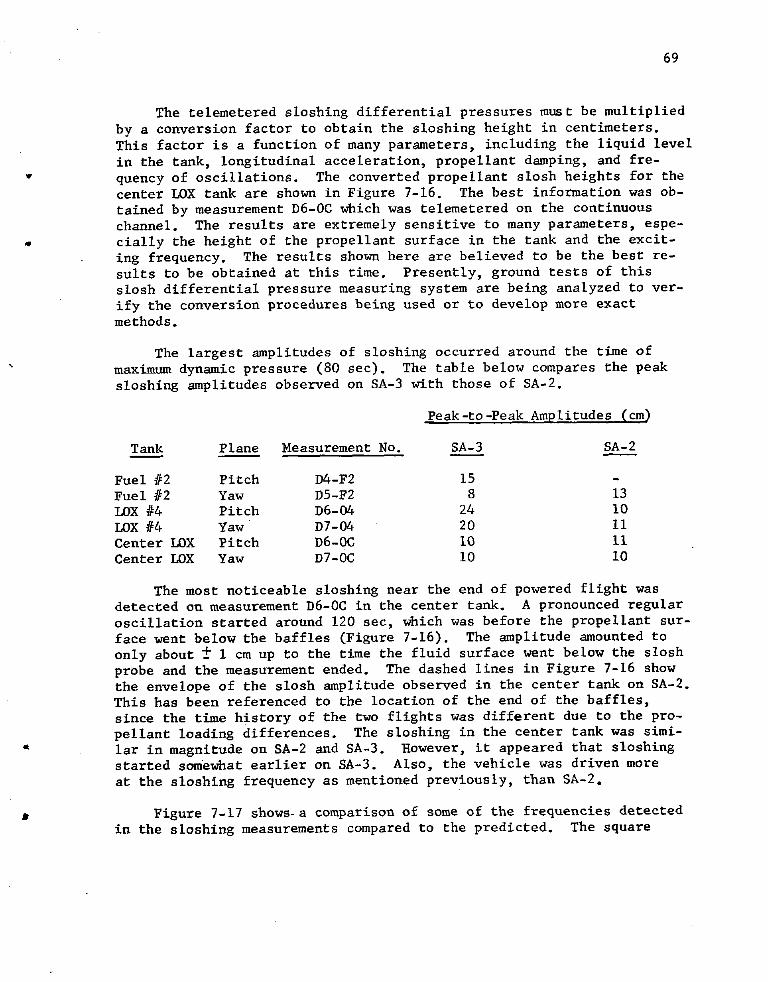
69
The telemetered sloshing differential pressures must be multiplied
by a conversion factor to obtain the sloshing height in centimeters.
This factor is a function of many parameters, including the liquid level
in the tank, longitudinal acceleration, propellant damping, and fre-
" quency of oscillations. The converted propellant slosh heights for thecenter LOX tank are shown in Figure 7-16. The best information was ob-
tained by measurement D6-0C which was telemetered on the continuouschannel. The results are extremely sensitive to many parameters, espe-
cially the height of the propellant surface in the tank and the excit-ing frequency. The results shown here are believed to be the best re-
suits to be obtained at this time. Presently, ground tests of this
slosh differential pressure measuring system are being analyzed to ver-
ify the conversion procedures being used or to develop more exactmethods.
The largest amplitudes of sloshing occurred around the time of
maximum dynamic pressure (80 see). The table below compares the peak
sloshing amplitudes observed on SA-3 with those of SA-2.
Peak-to-Peak Amplitudes (cm)
Tank Plane Measurement No. SA-3 SA-2
Fuel #2 Pitch D4-F2 15
Fuel #2 Yaw Db-F2 8 13
LOX #4 Pitch D6-04 24 I0
LOX #4 Yaw D7-04 20 IiCenter LOX Pitch D6-OC I0 Ii
Center LOX Yaw D7-0C I0 I0
The most noticeable sloshing near the end of powered flight wasdetected on measurement D6-0C in the center tank. A pronounced regular
oscillation started around 120 sec, which was before the propellant sur-
face went below the baffles (Figure 7-16). The amplitude amounted to
only about T I cm up to the time the fluid surface went below the slosh
probe and the measurement ended. The dashed lines in Figure 7-16 show
the envelope of the slosh amplitude observed in the center tank on SA-2.This has been referenced to the location of the end of the baffles,
since the time history of the two flights was different due to the pro-
pellant loading differences. The sloshing in the center tank was simi-
lar in magnitude on SA-2 and SA-3. However, it appeared that sloshingstarted somewhat earlier on SA-3. Also, the vehicle was driven more
at the sloshing frequency as mentioned previously, than SA-2.
• Figure 7-17 show_ a comparison of some of the frequencies detectedin the sloshing measurements compared to the predicted. The square
70
points shown after IECO are frequencies detected in some of the accel-
erometers, which indicate that the vehicle was being forced by the
sloshing. The pitch actuator positions also indicated this. In this
case, in contrast to SA-I_ the vehicle appears to be driven at the
natural frequency of the propellant_ rather than at some coupled fre-
quency. Whether this is consistent or not is not known at this time.

71
MPR-SAT-63-i

72
MPR-SAT-63-1

8.0 (C) GUIDANCE
8.1 SIR_IARY
* The Saturn SA-3 vehicle was flown without active path guidance or
velocity cutoff. However, passenger hardware for both ST-90 and ST-
124P (Prototype) guidance systems was onboard to establish the opera-
tional capabilities of the guidance equipment in the Saturn flight en-
- viroD_ment. The telemetered data as well as a trajectory comparison
confirm satisfactory performance of the ST-90 guidance equipment
throughout powered flight.
Erroneous outputs from the cross range accelerometer system
mounted on the ST-124P platform were noted before ignition. No correc-
tion was made and the cross range measurement contained extraneous sig-
nals throughout flight. These extraneous signals could be eliminated
from the telemetered accelerometer output and valid cross range infor-
mation was deduced from the measurement.
The output of the altitude accelerometer mounted on the ST-124P
platform was satisfactory. Comparisons with both calculated and ST-90
guidance data indicated a velocity difference of approximately 0.2 m/s
at end of thrust, after the altitude velocity was corrected for a 0.09%
scale factor error.
The Saturn SA-3 vehicle experienced a high roll rate after ignition
of the retro rockets at about 153.6 seconds. Both the ST-90 and ST-124P
platforms reached their mechanical limits at approximately 158.4 sec
and 159.2 sec respectively. Guidance data past these points were in-
valid.
8.2 DESCRIPTION OF GUIDANCE SYSTEM
8.2.1 ST-90 GUIDANCE SYSTEM
The ST-90 guidance system was similar to that flown on SA-_
(see Reference 3). Three integrating accelerometers (AMAB-3) weremounted on the stable element to measure velocities in the slant range,
slant altitude, and cross range directions. The slant range aecelerom-eter was oriented in the firing direction and 41 ° from the launch ver-
tical; the cross range measuring direction was in the launch horizontal
plane and completed a right handed coordinate system. This orientation
remained fixed during flight until the platform was forced out of itsfranc of reference in roll at 158.4 seconds. See Volume II for further
• description of the ST-90 guidance equipment.

,
74
8.2.2 ST-124P GUIDANCE SYSTEM
The ST-124P is a four gimbal system utilizing two AMAB-3 integra-
ting accelerometers mounted on the stabilized element. Platform orien-tation is maintained by three AB-5 stabilizing gyros. The accelerom-eters were oriented to measure the vehicle velocities in the vertical
and cross range directions. The altitude accelerometer was aligned
along the local vertical at launch; the cross range axis lay in the ,launch horizontal plane and normal to the firing azimuth. This orien-
6ation remained essentially fixed in space until the stable elementwas forced out of its frsme of reference. See Volume II for further
description of the ST-124P guidance equipment.
MeChanical limits and times when both platforms reached the in-
dicated stops are listed below.
Platform Mechanical Stop Limit Time (sec tComputed Record
ST-90 Roll + 15 deg 158.4 158.4
ST-124P Yaw or X-gimbal _ II deg 158.54 158.9 to159.4"
* Indication of loss of platform reference from the yaw gyro pickup
measurement (H19-12) occurred during a calibration period.
The vehicle was flying at an angle of approximately 45 deg mea-
sured from the platform X-axis. Therefore, the component of motion
about the platform X-axis due to roll about the vehicle longitudinal
axis is approximately given by:
t
ey_- - sin 45 ° _rolldt
Co
A rotation of ii deg about the 124P X-axis at 158.54 sec was com-
•pleted by inserting the telemetered values for _roll in the above
equation and performing the integration from the time of retro rocket
ignition. The yaw gyro servo signal (measurement H19-12) indicatedthat a bias shift to full scale measurement occurred during a calibra-
tion period between 158.9 and 159.4 seconds. The time at which this
measurement departs from its normal level should be the true indicationthat the platform is no longer space-fixed. The difference in the

8.0 (C) GUIDANCE
8.1 SI]_W_ARY
" The Saturn SA-3 vehicle was flown without active path guidance or
velocity cutoff. However, passenger hardware for both ST-90 and ST-
124P (Prototype) guidance systems was onboard to establish the opera-
tional capabilities of the guidance equipment in the Saturn flight en-• viror_nent. The telemetered data as well as a trajectory comparison
confirm satisfactory performance of the ST-90 guidance equipment
throughout powered flight.
Erroneous outputs from the cross range accelerometer system
mounted on the ST-124P platform were noted before ignition. No correc-
tion was made and the cross range measurement contained extraneous sig-
nals throughout flight. These extraneous signals could be eliminatedfrom the telemetered accelerometer output and valid cross range infor-mation was deduced from the measurement.
The output of the altitude accelerometer mounted on the ST-124P
platform was satisfactory. Comparisons with both calculated and ST-90
guidance data indicated a velocity difference of approximately 0.2 m/s
at end of thrust, after the altitude velocity was corrected for a 0.09_scale factor error.
The Saturn SA-3 vehicle experienced a high roll rate after ignitionof the retro rockets at about 153.6 seconds. Both the ST-90 and ST-124P
platforms reached their mechanical limits at approximately 158.4 secand 159.2 sec respectively. Guidance data past these points were in-valid.
8.2 DESCRIPTION OF GUIDANCE SYSTEM
8.2.1 ST-90 GUIDANCE SYSTEM
The ST-90 guidance system was similar to that flown on SA-_
(see Reference 3). Three integrating accelerometers (AMAB-3) weremounted on the stable element to measure velocities in the slant range,
slant altitude, and cross range directions. The slant range accelerom-eter was oriented in the firing direction and 41° from the launch ver-
a tical; the cross range measuring direction was in the launch horizontal
plane and completed a right handed coordinate system. This orientationremained fixed during flight until the platform was forced out of itsframe of reference in roll at 158.4 seconds. See Volume II for further
• description of the ST-90 guidance equipment.
computed and observed times is due to truncation of the equation for
e., errors in data used in the computations, response at the varioustelemetry channels, and prototype hardware components for the ST-124P
system.R
It should be emphasized that the ST-124P platform was only an
engineering test model and gimbal limits existing in this system will
not apply to the ST-124 equipment to be flown in the Block II vehicles.
8.3 OPERATIONAL ANALYSIS
8.3.1 GUIDANCE INTELLIGENCE ERRORS
The guidance intelligence errors are defined as deviations in the
guidance measurements resulting from platform and accelerometer errors
and may be found by comparing the guidance system measurements with
the vehicle trajectory.
The errors presented in Figures 8-1 and 8-3 include errors in
tracking and data reduction as well as guidance hardware errors. ST-90
guidance intelligence errors, shown in Figure 8-1, are within the datanoise level and one sigma hardware errors.
The errors made by the ST-124P guidance equipment in measurfng the
vertical and cross range velocities are discussed in section 8.3.3.
8.3.2 ACCELEROMETER OUTPUTS (ST-90)
The inertial velocity outputs of the integrating accelerometers
represent the vehicle motion as sensed by the guidance system. The
data from both the ST-90 and ST-124P guidance systems were reduced and
compared with corresponding velocities computed from external tracking
data. Ideal alignments of the guidance hardware were assumed for the
guidance calculations. The comparisons indicated a favorable agreement
of the data, especially for the ST-90 system. The small errors observedmay be attributed to errors in the telemetered data reduction, tracking,
and hardware errors. The accelerometer outputs were monitored prior to
ignition. The velocity errors, averaged over several time points, cor-responded to accelerometer angular misalig_ments of:
• ST-90
Slant Range +0.003 deg
Slant Altitude -0.002 deg
Cross Range -0.009 deg
DENT!AL
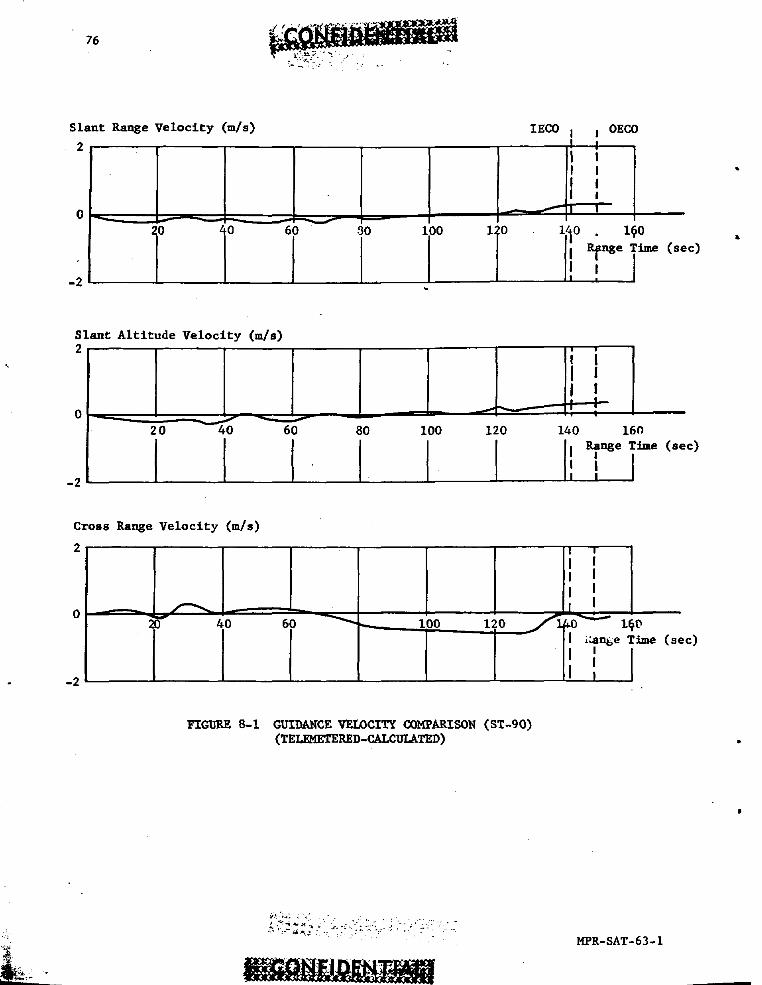
Slant Range Velocity (m/s) IECO I OECO2 I I
'I tI I
II,
20 40 60 so zoo 12o i_o I_O .l _nge Time(set)I I
-2 I ,
Slant Altitude Velocity (m/s)
0
20 40 60 80 I00 120 140 16n
Cross Range Velocity (m/s)
2
II II II I
o _" 40 60 _--__ too 12o _ _ t o[ i_n_e Time (set)
II i
-2 I
FIGURE 8-1 GUIDANCEVELOCITYCOMPARZSON(ST-S0)(TELI_ETERED-CALCULATED)
MPR-SAT-63-1

_ 77
where a positive angle represents a positive output error. The ST-90
platform remained in its reference established at liftoff with essen-tially no errors greater than established one sigma deviations, untilreference was lost in roll at about 158.4 seconds.
Slant Ranse Velocity (ST-90_
The outputs of the slant range accelerometer were compared with
• corresponding values computed from earth-fixed trajectory data assum-
ing ideal alignments of the platform and accelerometers. These differ-
ences are plotted versus time in the upper portion of Figure 8-1. Theerrors oscillate around zero for the entire powered flight. The small
errors observed are the results of errors in the data compared and
hardware errors within established one sigma values.
Cross Range Velocity (ST-90)
The cross range velocity, as measured by the ST-90 guidance system,
is plotted versus time in the upper portion of Figure 8-2. Extraneousincremental outputs were noted on the telemeter trace of the cross
range velocity from -2.82 sec to about 3.9 seconds. However, the data
were manually reduced with little difficulty. The azimuth of the ST-90
platform and the Fin I - Fin III launch position of the vehicle wereI00.011 deg and 1001381 deg E of N respectively. This alignment dif-
ference produced the cross range velocity observed by both the acceler-ometer and the external tracking. The overall velocity profile also
reflects the changes in the cross range wind velocity.
Cross range guidance velocity was about -2.2 m/s at 40 sec of
flight when bo (angle-of-attack control coefficient) entered the con-trol loop. The cross range velocity increased from -2.2 m/s at 40 secto -3.0 m/s at 50 sec and remained relatively constant to about 85
seconds. From this time the ST-90 cross range velocity increased to
-7.5 m/s at outboard engine cutoff. The term bo was taken out of the
control loop at 115 sec of flight time.
Differences between the telemetered and calculated ST-90 cross
range velocities are plotted versus time in the lower portion of Figure8-i. The differences oscillate around the zero reference until after
70 seconds. From this time the differences increase to about -0.5 m/s
at 90 see and remain practically constant to 130 seconds. The differ-
ences go to essentially zero by 140 seconds. The error profile pre-sents no definite trend and the differences are probably due to bias
shifts in tracking data rather than the ST-90 guidance equipment. How-
ever, the cross range velocity errors are within the usual noise level
of data compared and the-one sigma errors of the guidance hardware.
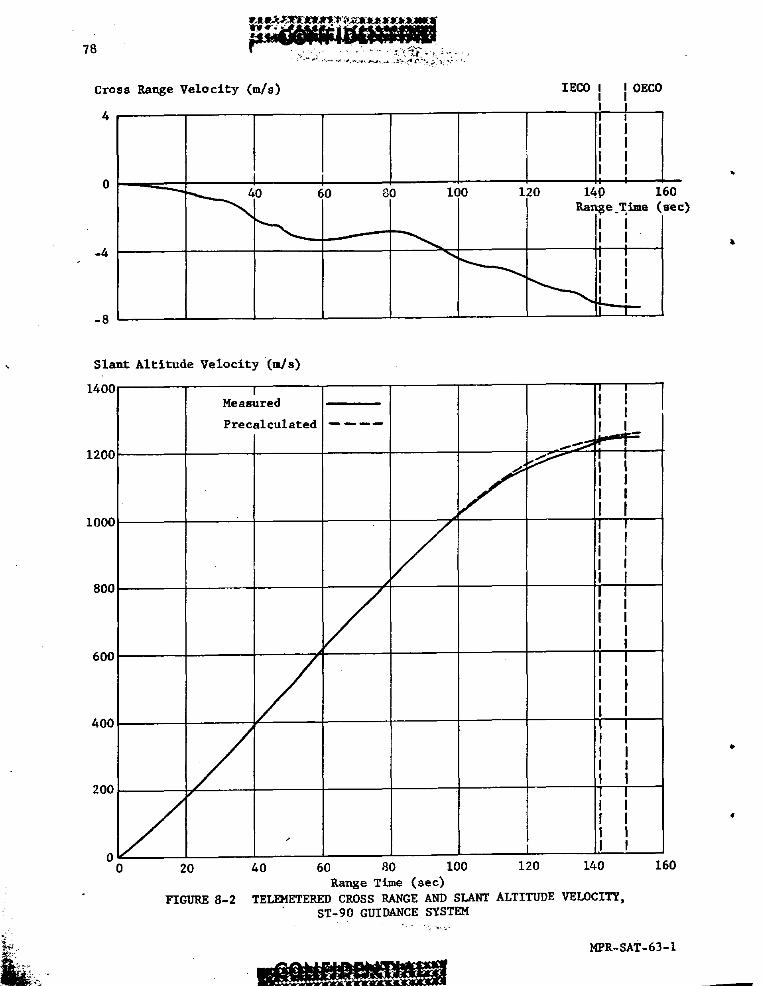
Cross Range Velocity (m/s) TECO I OECOI
4 , ,I II II I
0 t I i .' _'__ 40 60 80 I00 120 14p 160
Range _Time (se c)
-4 _ I I
-8
Slant Altitude Velocity (m/s)
1400 , 1 1MeasuredI t
Precalculated I I
, oo I I
,'I II I
I000 / I I
/ I II II II I
800 /' I I
/ I II II II I
600 / I I
/.I II II II I
400 I I
// "I I "I II I
200 I I
i I "I I
o I ,I I0 20 40 60 80 I00 120 140 160
RanEe Time (see)
FIGITRE 8-2 TELEMETERED CROSS RANGE AND SLANT ALTITUDE VELOCITY,ST-90 GUIDANCE SYSTEM
_":_ MPR- SAT- 63- i
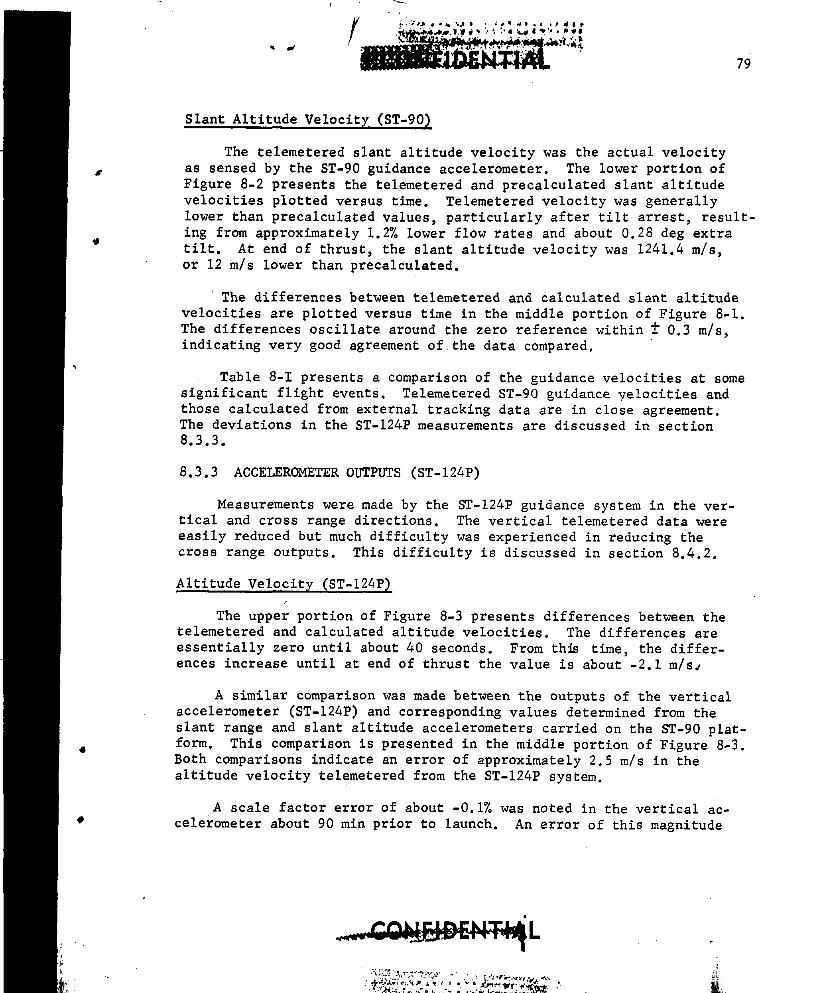
Slant Altitude Velocity (ST-90_
The telemetered slant altitude velocity was the actual velocity
• as sensed by the ST-90 guidance accelerometer. The lower portion of
Figure 8-2 presents the telemetered and precalculated slant altitude
velocities plotted versus time. Telemetered velocity was generally
lower than precalculated values, particularly after tilt arrest, result-
ing from approximately 1.2% lower flow rates and about 0.28 deg extra
e tilt. At end of thrust, the slant altitude velocity was 1241.4 m/s,
or 12 m/s lower than precalculated.
The differences between telemetered and calculated slant altitude
velocities are plotted versus time in the middle portion of Figure 8-1.
The differences oscillate around the zero reference within T 0.3 m/s,indicating very good agreement of the data compared.
Table 8-I presents a comparison of the guidance velocities at somesignificant flight events. Telemetered ST-90 guidance velocities and
those calculated from external tracking data are in close agreement.The deviations in the ST-124P measurements are discussed in section
8.3.3.
8.3.3 ACCELEROMETER OUTPUTS (ST-124P)
Measurements were made by the ST-124P guidance system in the ver-tical and cross range directions. The vertical telemetered data were
easily reduced but much difficulty was experienced in reducing thecross range outputs. This difficulty is discussed in section 8.4.2.
Altitude Velocity (ST-124P_
The upper portion of Figure 8-3 presents differences between thetelemetered and calculated altitude velocities. The differences are
essentially zero until about 40 seconds. From th_ time, the differ-ences increase until at end of thrust the value is about -2.1 m/s_
A similar comparison was made between the outputs of the vertical
accelerometer (ST-124P) and corresponding values determined from the
slant range and slant altitude accelerometers carried on the ST-90 plat-4 form. This comparison is presented in the middle portion of Figure 8-3.
Both comparisons indicate an error of approximately 2.5 m/s in the
altitude velocity telemetered from the ST-124P system.
A scale factor error of about -0.1% was noted in the vertical ac-
celerometer about 90 min prior to launch. An error of this magnitude
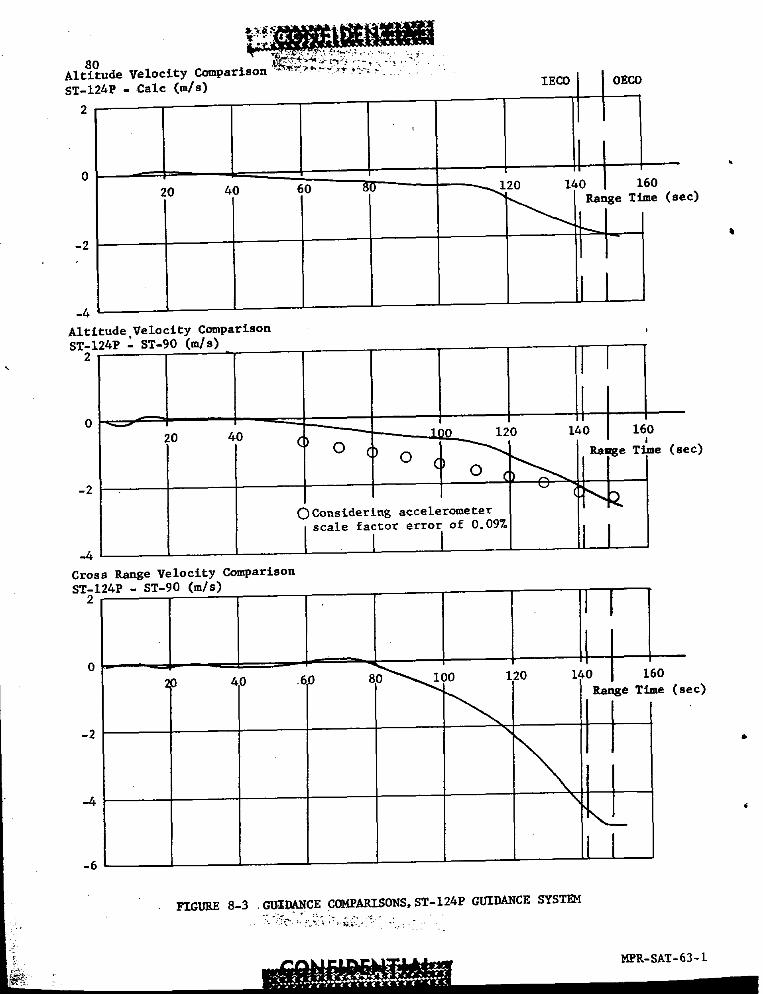
Altitude Velocity Comparison ;-_._;_i_'2_ ':___.:.__..:. .".
s_-124P-Calc<.zs) z_coI I oE_o
I
20 40 60 80 _120 140 160
Range TI (sec)
Altitude.Veloclty ComparisonST-124P - ST-90 (m/s)
, 2 t
0 v _'''-
_'-------.J_.._ 120 140 I_
20 40 d O ()O_(i _" _, Tiae (sec)oc_-2 _k
OConsidering accelerometerscale factor error of 0.09Z
., lJCross R_ge Velocity Comparison
ST-124P - ST-90 (m/s)
4 ._ _._ 100 120 i,_0 160Range Time (sec)
.• -.4
'x2_.
-6 i
FIGURE 8-3 ,GL_DANCE C(_49ARISONS, ST-124P GUIDANCE SYST_4
/<
MPR-SAT-63- l

82
would produce the observed velocity error. After correcting for the
scale factor error, the altitude velocities from the two guidance sys-
tems are in agreement, indicating maintenance of proper orientation of
the ST-124P platform about its Z-axis. •
The circled points shown in Figure 8-3 represent the velocity dif-ference for an accelerometer scale factor error of 0.09%.
Cross Range Velocity (ST-124P_
Much difficulty was experienced in reducing the cross range data.
However_ valid values were obtained. These data were compared with thesame measurement as sensed by the ST-90 guidance system. This compari-
son is presented on the lower portion of Figure 8-3. The differences
are essentially zero until about 80 seconds. From this time, the dif-ferences increase until at outboard engine cutoff the value is about
5.0 m/s. This difference may be attributed to a difference of azimuth
aligmment of the ST-124P platform and the ST-90 platform. The $T-124P
platform was not optically aligned to azimuth as was the ST-90. In-
stead, it was referenced to the vehicle Fin I - Fin III position.
The azimuth of the ST-124P is acceptable since the platform could
not be optically aligned. Precise azimuth alignment for the ST-124Pto be flown on SA-4 will not be possible since the mounting arrangement
on SA-4 will be the same as SA-3. However, this will be no problem forthe Block II vehicles.
The cross range velocity comparison shows a constant azimuth dif-
ference between the platforms. The ST-124P platform was oriented
approximately 0.27 deg South of the optically aligned ST-90. Essenti-
ally no platform rotations occurred about the X or Y axes until after
retro firings, when the platform reached its mechanical limit in roll.
8.4 FUNCTIONAL ANALYSIS
8.4.1 GUIDANCE SENSORS
The operation of the five AMAB-3 guidance acceleremeters, (three
on ST-90, two on ST-124P) flown as passenger items on SA-3, was as
expected, with the single exception of the cross range accelerometer •on the ST-124P stabilized platform. Telemetry measurements of the servo
pickup voltage for this accelerometer indicate a continuous oscillation
of the system at about 60 to 65 cps from before liftoff (approximately
T-140 sec)to the end of flight. Laboratory tests following the flight °indicate that the gain adjustment of the servo amplifier was probably
set in a critical area, where the system is stable unless subjected to
a fairly large electrical or mechanical disturhance; at a setting in
this critical area, once the required disturbance occurs, the system
goes into a self-sustained oscillation. The critical area of gain set-
• ting is just below the maximum gain capability of the servo amplifier.
The servo loop signals for the remaining accelerometers were normal.
8.4.2 VELOCITY ENCODERS AND SIGNAL PROCESSOR REPEATERS
The operation of the accelerometer velocity encoders was satisfac-
tory. Five encoders were flown, three with the ST-90 system accelerom-
eters and two with the ST-124P system accelerometers.
Two Guidance Signal Processor Repeaters were flown on SA-3, one
for each stabilized platform. The processor for the ST-90 systemoperated satisfactorily throughout the flight; the second unit, for the
ST-124P system, had a failure in a buffer amplifier stage causing lossof one of the DC logic signals used in sensing the polarity of the
cross range velocity increments. This malfunction occurred early inthe countdown. A second disturbance in this processor occurred inter-
mittently in both channels during the time period from 113 to 125 sec-onds. The disturbance is believed to be due to voltage transients on
the processor B+ line.
Ground recording and inflight telemetry records showed a disturbedcondition of the ST-124P cross range velocity system, which appeared to
indicate that the accelerometer was wandering randomly. This has been
shown to be incorrect after a detailed study of the ground and inflight
records, the logic network of the signal processor, and the 65 cpsoscillation observed in the accelerometer servo loop.
Oscillation of the accelerometer system would normally result in
both positive and negative incremental velocity pulses, which cancel
each other except for actual velocity change. However, with a loss of
one DC logic signal used in sensing the polarity of the velocity incre-
ment, the output would be a continuous pulse pattern as shown in pattern
i of Figure 8-4. As the system changes position, intermediate pulse
patterns occur as shown in the even numbered patterns of Figure 8-4.When the pulse pattern on the telemetry record changes from one pattern
to a second distinct pattern, a velocity change of 0.I m/s has occurred.
6 The pulse patterns result from a combination of three conditions:
I. A small true acceleration.
2. Accelerometer servo loop oscillation.
3. Loss of one logic signal in the signal processor.

The lower portion of Figure 8-4 shows the incremental velocity pulses
as they sho,_id occur if the system was operating properly.
It was concluded from this study that the loss of one DC logic sig-
n nal input to the rotation sensor logic circuits, combined with the 65
cps modulation of the true accelerometer output, could produce the
patterns of incremental velocity pulses observed on the telemetry and
ground recordings (see Figures 8-4 and 8-5). Laboratory tests ton-
i firmed the above conclusion. The pulse pattern sequences were used toreduce the actual telemetered cross range velocity from the ST-124P
system. The second disturbance to the signal processor occurred inter-
mittently from 113 to 125 sec range time and was characterized by im-
proper shifting of the bias voltage for the coarse velocity indicationin both cross range altitude channels. Short term voltage transients
of fairly large amplitude on the B+ line are believed to be the sourceof this extraneous switching of the bias flip-flop. The source of the
transients could not be determined, but could have originated either
on the D21 buss, in the static inverter, or in the signal processor
power supply.
The improper switching of the bias flip-flop did not cause anyerror in the incremental velocity values.
8.4.3 ST-90 STABILIZED PLATFORM
The ST-90 stabilized platform flown on SA-3 utilized similar com-
ponents and systems as the platform flown on SA-2, with the exceptionthat AMAB-3 accelerometers replaced the usual AMAB-4 units. All sys-
tems operated properl_, with the air bearing supply pressure relativelyconstant at 2.4 kg/cm L (34 psi) and the compartment pressure varying
from I.I0 to 0.98 kg/cm 2 (15.6 to 14.0 psi).
The final tilt angle of the ST-90 platform at tilt arrest was
44.28 deg as compared with the intended 44 deg (see section 7.2.1).
ST-124P
The ST-124P system (consisting of platform, resolvers, and asso-
ciated mechanical and electrical circuitry), flown on SA-3, was a pro-
totype or engineering test model. Many of the components were not
optimized for high accuracy and are not the same as those to be flownon Block II vehicles. SA-3 was the first flight test of this system
(also to be flown on SA-4). The primary test objectives of the systemwere the observation of its functional operation and familiarization
with the resolver chain and the 5 kc/s servo systems in an operational
environment. The operation of the system as an engineering test was
quite satisfactory.
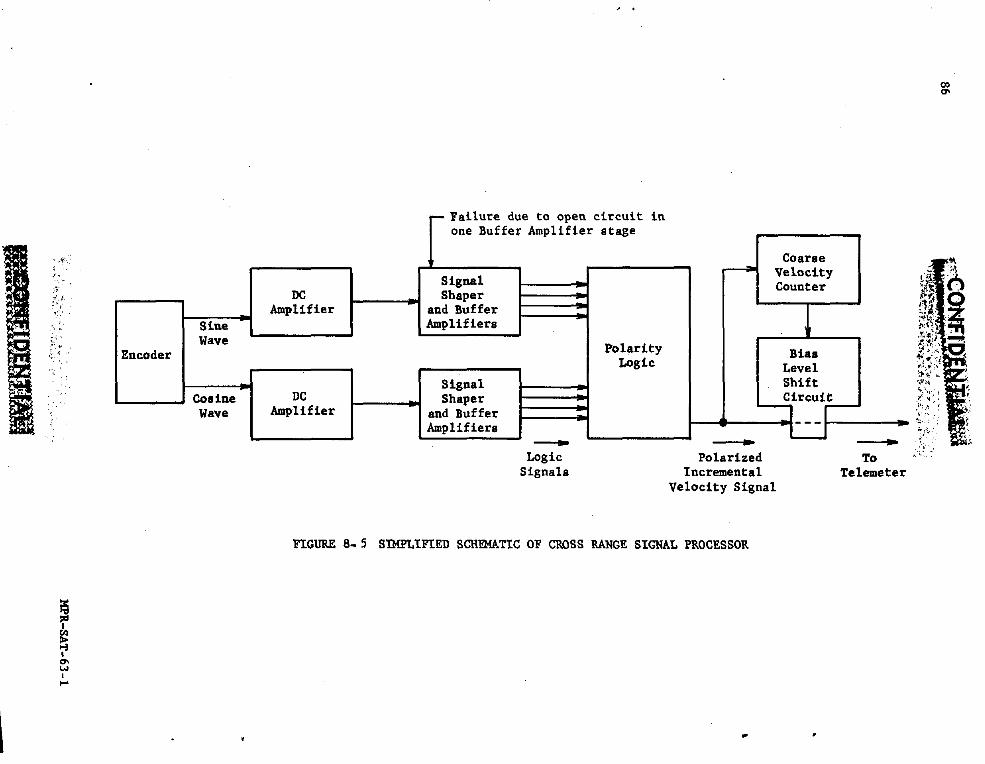
_-........
,._
.H
PR
-SAT
-63-I

87
The resolvers used with the ST-124P system were not trimmed and
therefore some error in their output must be expected. The error in
the output of the pitch resolver is a function of, and increases with,
the programmed pitch angle. The incremental difference in pitch atti-tude data obtained from the ST-124P and ST-90 systems is primarily
attributed to this effect. A laboratory test of the ST-124P system to
be used on SA-4 indicates that the error for the pitch r_solver for
this system was about the same as that experienced on SA-3 (see section
7.3.4).
During flight, the air bearing air supply pressure was a constant2.2 kg/cm 2 (32 psi) and the air temperature was 24.6°C. The compart-
ment air pressure varied from 1.03 to 0.98 kg/cm 2 (14.7 to 14.0 psi),
while the temperature was 24.7°C.
88
9.0 (U) VEHICLE ELECTRICAL SYSTEM
9.1 SUMMARY
All vehicle networks performed satisfactorily except for the fail-
ure of measuring supply number 5.
9.2 FLIGHT RESULTS
The voltage and current for battery D20 and its corresponding
buss (D21) were constant at 28.5 volts and 165 amps. A total of 898
amp-minutes was used for the flight or approximately 33.9% of batterycapacity. Figure 9-1 shows the connections for the 9 inflight distri-butors.
The variable load for battery DI0 and its corresponding buss (DII)
caused the voltage and current to vary from 27.6 volts, 165 amps at
liftoff to 28.0 volts, 95 amps at end of flight. These voltages and
currents were as expected, with 0.4 volt increases when the continuous
lights and the angle-of-attack heaters were switched off.
The frequency of the precision inverter on SA-3 was 399.788 to
400.225 cps over the flight period. The usual frequency disturbance
caused by ignition was within -0.202 cps of the inverter frequency.
All frequencies were within allowable tolerances.
Measuring voltages of the eight "slave" units off busses DSI thru
D88, located in the measuring distributors, operated within the 5 volts
5% limits, except for D85. Measuring supply number 5, which supplies
buss D85, failed before liftoff.
Measuring supply number 5 failed on SA-3 at -2.17 sec prior toliftoff. Since this time period is associated with the initial shock
due to ignition of the engines, investigations have been made to cor-relate the failure with thi_ time period. Simulated shaker tests
indicate a possibility of transistor failure during this period.
The measuring voltage supply assembly has a volume of approximately
208 cu. in., weighs 7.05 pounds, and is located in the thrust frame
area of the vehicle, above the firewall (see Figure 9-1). The assemblyconsists of eight individually isolated power supplies and one input
filter. Each power supply contains seven transistors. Five of the
seven transistors were ultra-high-reliability type transistors obtained
through EngineeringMagnetics from Pacific Semi Conductors Incorporated.
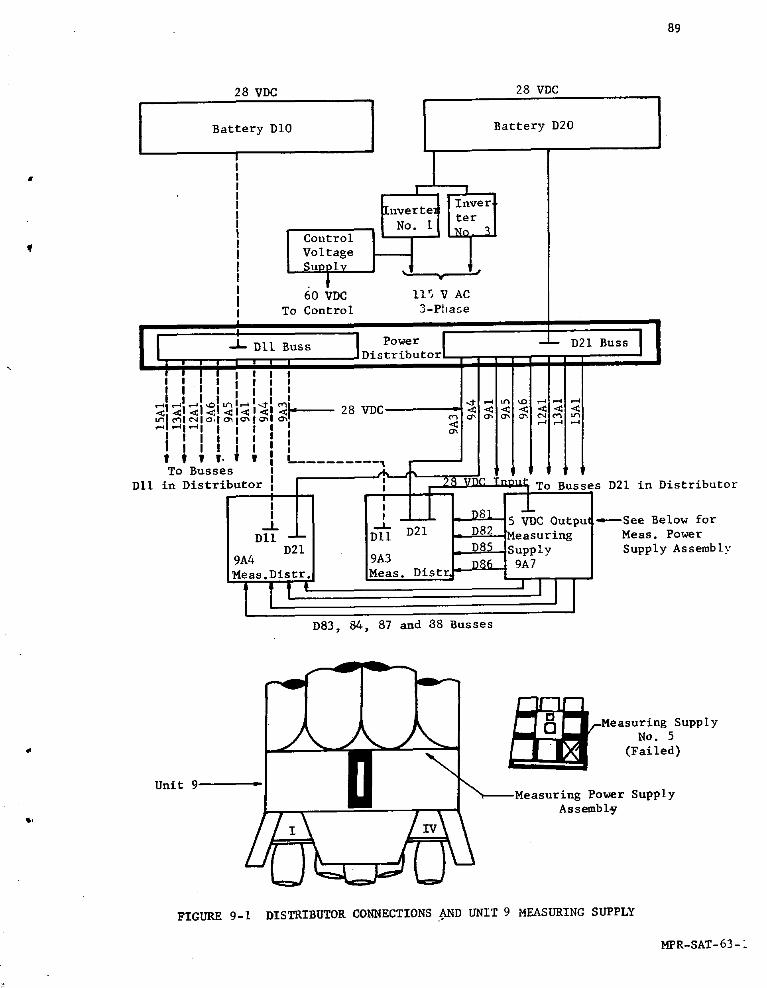
89
28 VDC 28 VDC
• !II! Inver! Inverte_
N - ; tero. [I
I Control Tl Voltage} Suuulv
t 60 VDC ll_ V ACiI To Control 3-PhageII
J- DII Buss Power -- D21 BussDistributor
i | $ I I I l I
i I I I I II I I i I I
l,!,;,,l_,<,<,<,< <I<I 28 VDC
"_I_I I I l' IIlllll ,I t I I.I W !To Busses
I
Dll in butor _ I ' I _ TO Buss( D21 i_ Distributor
I ' "J- -21VDC OutputI -,----SeeBelow for
DII DII u _easuring Meas. PowerD21 uL---q-92--_Supp Iy Supply Assembly
9A4 9A3 _ -9A7Meas.Dlstr. Meas. Dis tr4----- I
D83, 84, 87 and 88 Busses
Measuring Supply
NO. 5
" (Failed)
Unit 9
Power Supply
_i Assembl_
FIGURE 9-1 DISTRIBUTOR CONNECTIONS AND UNIT 9 MEASURING SUPPLY
MPR-SAT-63-1
90
The two remaining transistors consisted of one Fairchild type and one
Texas Instrument type. Shaker tests indicate that the Pacific Semi
Conductors type (_ 13531) transistor was the probable cause of failure
in measuring voltage supply number 5. Additional tests are being con-
ducted to determine more detailed information. However, this type of
transistor will be replaced on SA-4.
Main fuel and LOX valve position signals (start open, open, and
closed) operated satisfactorily with the exception of measurements_6-5 and AII-5. These measurements were lost because of the failure
of measuring supply number 5.
Cutoff signals (inboard) and fl_ght sequence signals were as
expected. Outboard cutoff was initiated by LOX depletion.
91
I0.0 (U) STRUCTURES AND VIBRATIONS
I0. I SUMMARY
• The instrumentation for SA-3 included strain measurements on the
truss members and on the LOX pins from which pitch and yaw moments and
longitudinal forces were computed at various significant flight times.
The results compared well with predicted values.
Instrumentation for detecting vehicle body bending consisted of
ten bending accelerometers at five vehicle stations. The accelerome-ters showed response at frequencies in the range of first and second
vehicle bending. These frequencies were present in both pitch and yaw
directions, with a maximum amplitude at liftoff on the nose cone of
0.016 g's single amplitude for first mode of 2.0 cps. At OECO, aforced response of 0.095 g's single amplitude occurred at a coupled
frequency of 2.7 cps. The response is lower than on SA-2 before OECO.
The flight data indicated that the SA-3 vibration levels were
generally similar to those recorded during the previous two Saturn
flights.
10.2 BENDING MOMENTS AND NORMAL LOAD FACTORS
10.2.1 INSTRUMENTATION
Instrumentation for determining bending moments and normal load
factors consisted of eight strain gauges on the main compression mem-
bers and sixteen strain gauges on the tension members of the interstage
truss at station 979. In addition, eight LOX tank studs at station
869 were gauged. However, five of the eight LOX tank stud gauges were
lost prior to ignition and hence offered very little information. Thetelemetered data were obtained as decon_utated oscillograph traces and
also in digitized form. Flight evaluation consisted of determining theinstantaneous load and bending moments about the pitch and yaw axes fornumerous time slices.
10.2.2 MOMENT LOADS
Maximum bending moment at station 979 occurred at 69.2 sec range
° time, approximately Mach I. At Mach I, a vehicle bending moment diagramcould not be constructed since there were no aerodynamic loads data
available. However, the highest strain gauge moments were observed atthis time. A vehicle bending moment diagram was constructed at time
_, point 81.6 sec, where another relatively hig_ moment occurred and
92
reliable aerodynamic loads were available (see Figure I0-i). In this
figure the strain gauge moment is shown by a cross at the gauge loca-
tion, station 979. Good agreement existed between this strain gaugemoment and the predicted bending moment distribution. Also shown in
Figure i0-i, is the normal load factor compared with the accelerometer
reading from flight.
Because five of the eight stud gauges of the 1.8 m (70 inch)
LOX tanks (station 869) were lost, no bending moments about the pitch
-and yaw axes could be calculated at that station. However, the three
gauges which functioned properly gave some check on the bending momentat station 979. These three gauges were found to be in agreement with
predicted values.
The vehicle bending moment about the pitch axis at station 979
is shown in the 75 to 85 sec range time interval in Figure 10-2. Also
shown on this graph are the angle-of-attack (_) and gimbal angle ( _ )
about the pitch axis. Close agreement in frequency of oscillation be-tween the three values is evident.
10.3 LONGITUDINAL LOADS
Multiplication of the actual telemetered strain by the calibra-tion factor results in the loads shown in Figure 10-3 (circled points).
The solid line in Figure 10-3 was obtained by using the differential
strains and adding the 101,290 kg (223,300 ibs) of load which was lost
when the gauges were set to zero. The calculated load was determinedfrom SA-3 thrust and acceleration data and theoretical drag data.
During firing of the engines, before launch conmland, dynamic
forces arise in the deflecting masses of the system. These forces can
be amplified and cause large vibrations of the vehicle. A staggeringtime of I00 ms between engine pairs was expected to keep the vibratory
force lower or equal to twenty percent of the maximum static thrust.
Figure 10-4 presents the results of an investigation made to see if
the actual staggering times of the engines still keep the vibratoryforce below the above value. The frequencies of the system were mea-
sured by potentiometers (YL-I, YL-2) located on the support arms.
From these frequency measurements and from single engine thrust curves,the maximum vibrating force was obtained as shown by the maximum theo-
retical response (calculated) on Figure 10-4. These results show that
the maximum response was sixteen percent of the maximum static thrust.
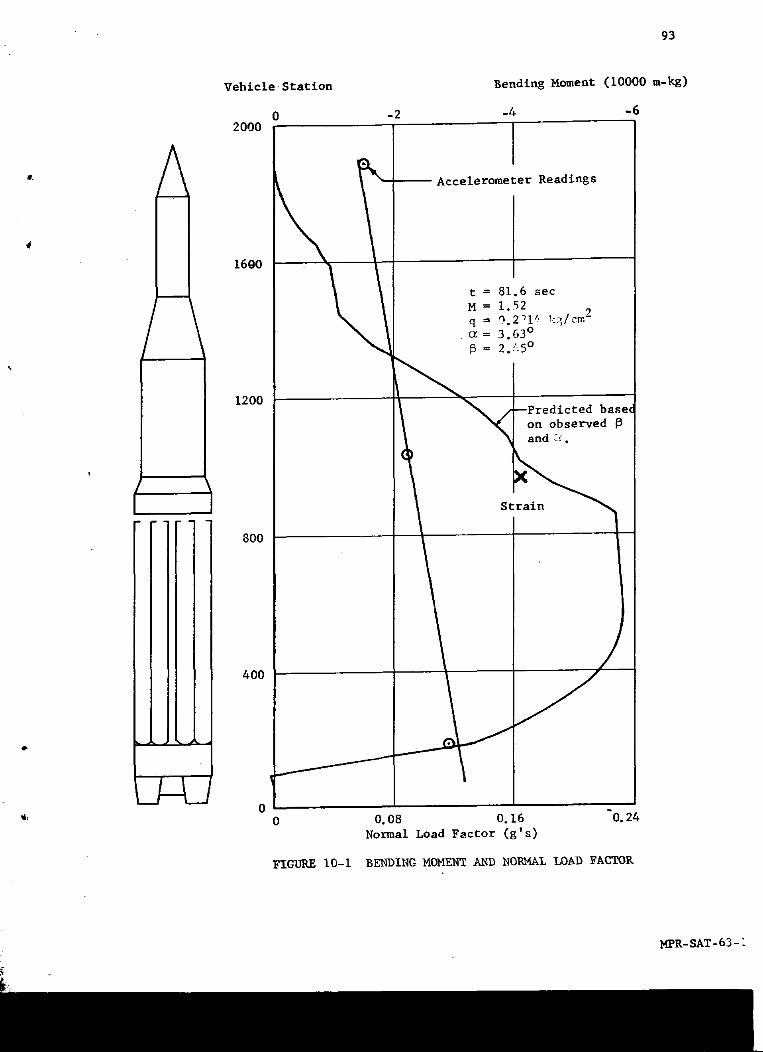
93
Vehicle. Statlon Bending Moment (i0000 m-kg)
0 -2 -4 -62000
-- -- Accelerometer Readings
11600
---- t = 81.6 sec
M = 1.52 !::g/crn 2q = 0.2_I _,C_= 3.63 °
= 2 .:';5°
1200
_ /---Predicted base(on observed
i
r- _ - •
800
i
, 400
li
_/--LJU_ 0
0 0.08 0.16 "0.24
Normal Load Factor (g's)
FIGURE !0-I BENDING MOMENT AND NOI_MAL LOAD FACTOR
MPR=SAT-63- i
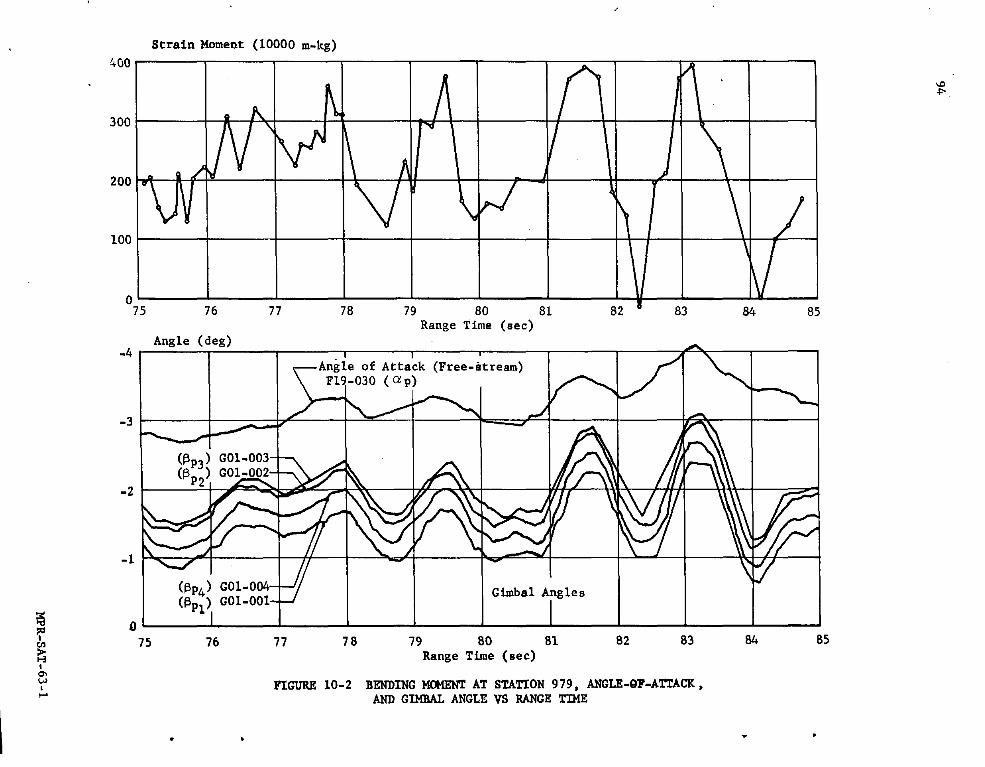
94
MPR-SAT-63-1
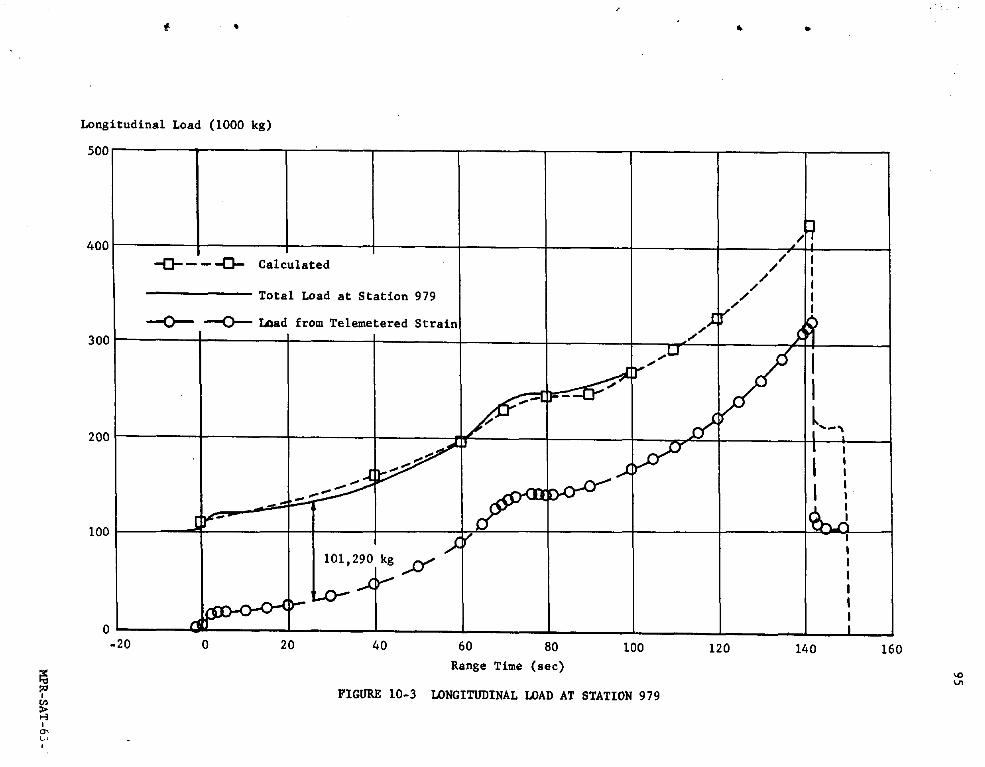
.95
O
MPR-SAT-
63-
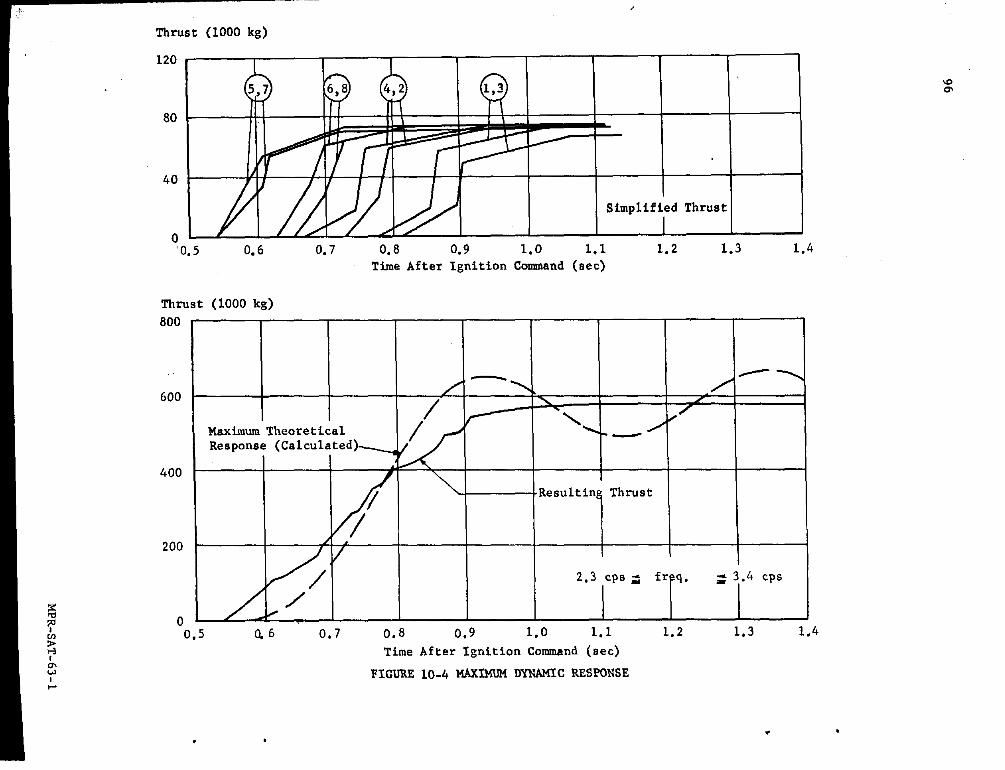
96
HP
R-SA
T-6J-1
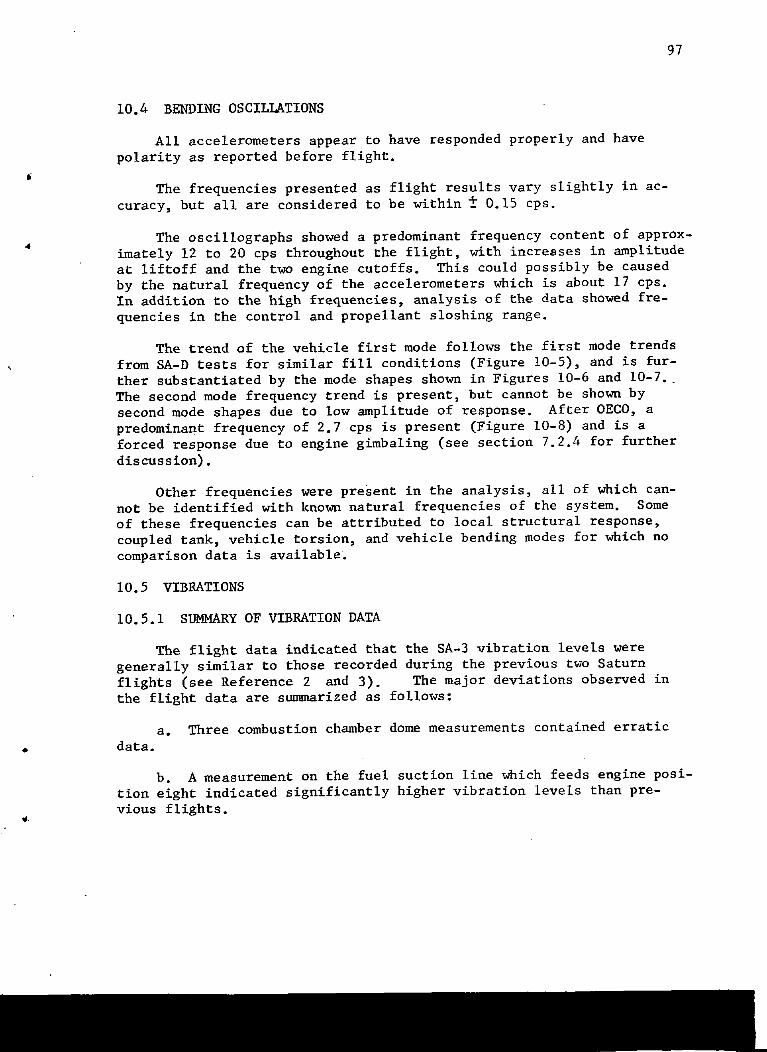
97
10.4 BENDING OSCILLATIONS
All accelerometers appear to have responded properly and have
polarity as reported before flight.
The frequencies presented as flight results vary slightly in ac-
curacy, but all are considered to be within _ 0.15 cps.
The oscillographs showed a predominant frequency content of approx-
4 imately 12 to 20 cps throughout the flight, with increases in amplitudeat liftoff and the two engine cutoffs. This could possibly be caused
by the natural frequency of the accelerometers which is about 17 cps.
In addition to the high frequencies, analysis of the data showed fre-
quencies in the control and propellant sloshing range.
The trend of the vehicle first mode follows the first mode trends
from SA-D tests for similar fill conditions (Figure 10-5), and is fur-
ther substantiated by the mode shapes shown in Figures 10-6 and 10-7.
The second mode frequency trend is present, but cannot be shown by
second mode shapes due to low amplitude of response. After OECO, a
predominant frequency of 2.7 cps is present (Figure 10-8) and is a
forced response due to engine gimbaling (see section 7.2.4 for further
discussion).
Other frequencies were present in the analysis, all of which can-not be identified with known natural frequencies of the system. Some
of these frequencies can be attributed to local structural response,
coupled tank, vehicle torsion, and vehicle bending modes for which no
comparison data is available.
10.5 VIBRATIONS
10.5.1 SUMMARY OF VIBRATION DATA
The flight data indicated that the SA-3 vibration levels were
generally similar to those recorded during the previous two Saturn
flights (see Reference 2 and 3). The major deviations observed inthe flight data are summarized as follows:
a. Three combustion chamber dome measurements contained erratic
data.
b. A measurement on the fuel suction line which feeds engine posi-
tion eight indicated significantly higher vibration levels than pre-vious flights.
4
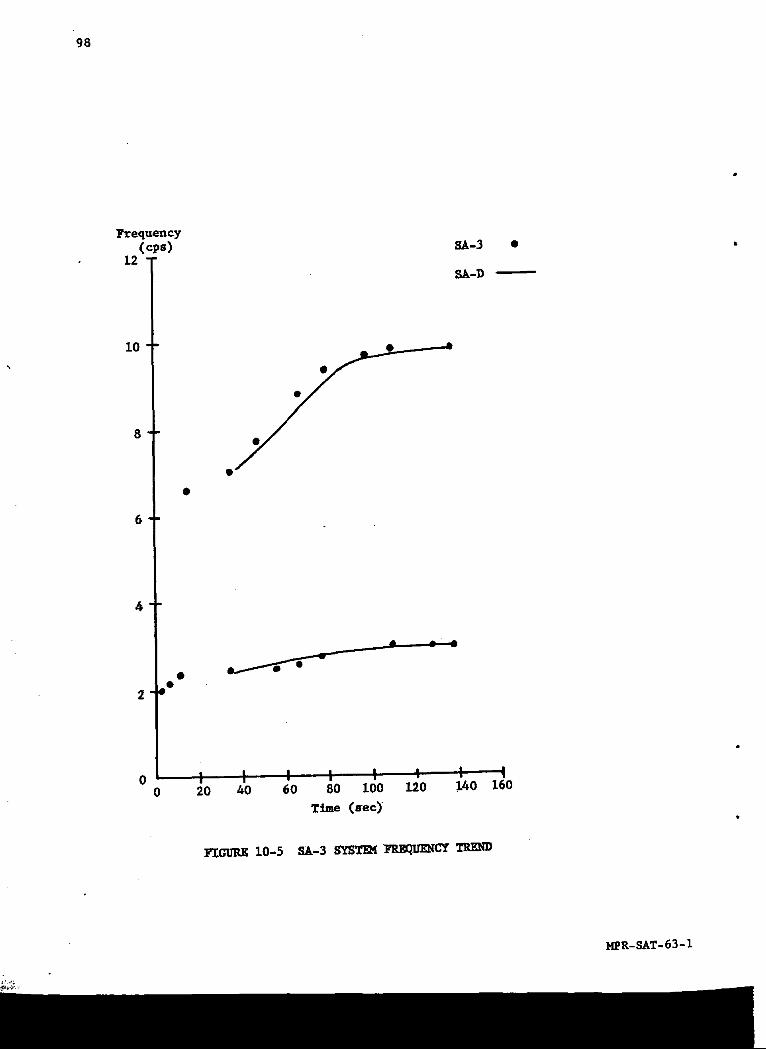
98
Frequency
(cps) SA-3 • •12
SA-D--
8
6
2
o I I I I I I I I0 20 /-tO 60 80 100 120 140 160
Time (see)"
I_ 10-5 SA-3 SYS'r_ _
NPR-SAT-63-1

99
Vehicle Station
2000 Time _sec) Freq (cps)E67-30
1800 .5 - 4.5 2.0
1600
SA-3 Single Amp
1400 G's In n_n
E65-20 E67-30 .0164 °04014 1.02
1200 E65-20 0 0 0E63-20 .007 .01713 0.44
E63-20 E61-10 .0164 .04014 1.021000 E252-9 .0074 .018114 0.46
800
600
400
200 E252-9
0: : ! : : , : : : : :
-1.0 0 1.0
Relative Amplitudef
I_GDI_ 10-6 SA-3 BENDING MODE - FIRST MODE, YAW AT LIFTOFF
MPR-SAT-63- I
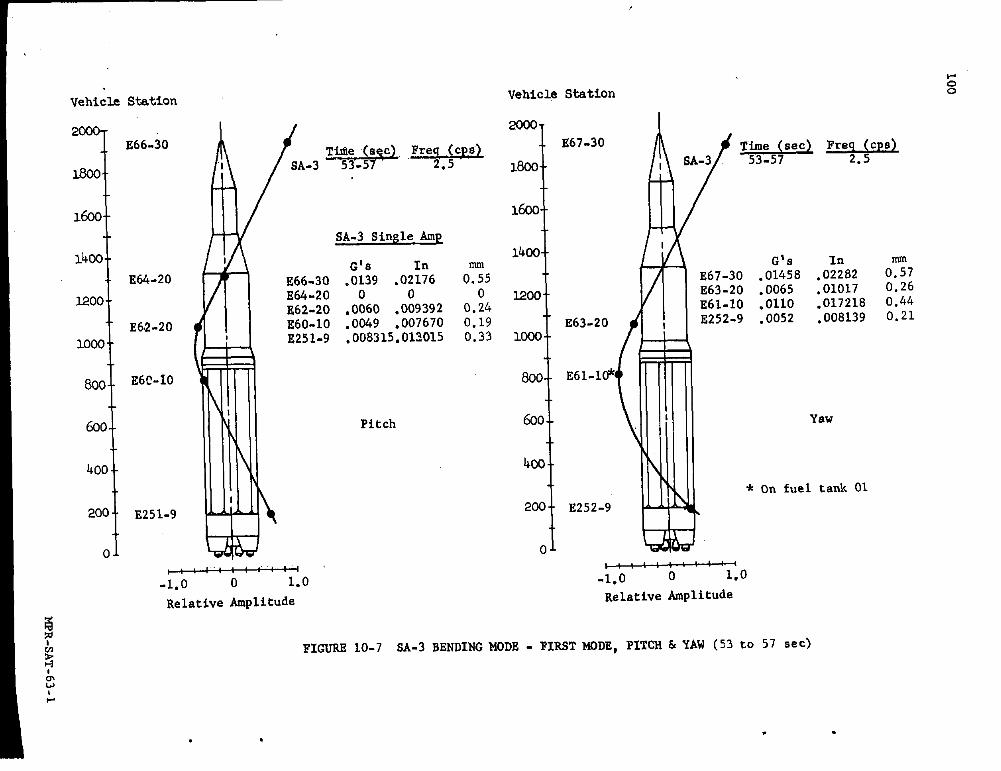
i00
_Q
OO
Q
0000
__
..ii:
88
8_
__8
8_o
NI
III1_I
.O_lllllll#1lllllll)lll
_o00_ooOO_o
_0
MPR-SAT-63-1
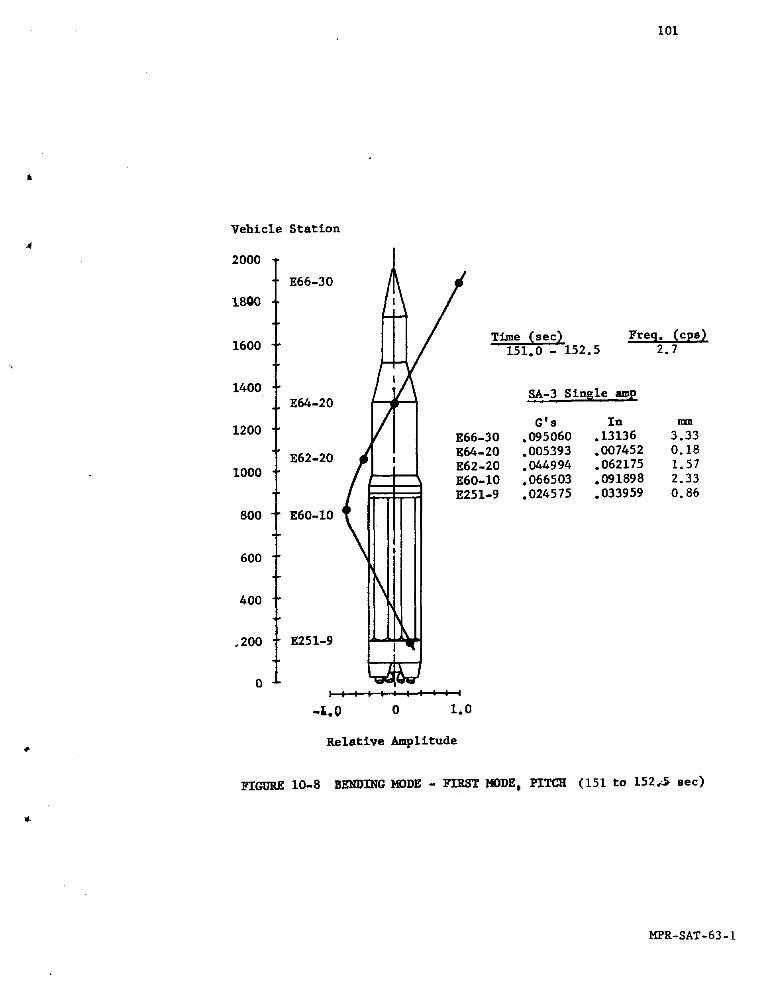
I01
Vehicle Station
2000
E66-30 fi Time (sec), Freq. (eps)
1600 151.0 - 152.5 2.7
1400 SA-3 Single ampE64-20 -- --
G's In ,_1200 E66-30 .095060 .13136 3.33
E62-20 _ E64-20 .005393 .007452 0.18
I000 _ E62-20 .044994 °062175 1.57
_ E60-10 .066503 .091898 2.33: : E251-9 .024575 .033959 0.86
800 E60-10
60O
\400
,200 E251-9 --m --
0 _
-_.0 0 l.o
Relative Amplitude
F_GERE 10-8 BENDING MODE - FERSTMODE, PITCH (151 to 152,_% sec)
MPR-SAT-63- 1
102
c. Transients were observed in several measurements, for which a
satisfactory explanation has not yet been determined. An intensive
analysis of the flight data is presently in progress in order to deter-mine the causes of these transients.
10.5.2 INSTRUMENTATION
The SA-3 space vehicle was instrumented with 40 vibration measure-
ments. The location, axis of sensitivity, and data bandwidth of each
measurement is described in Volume II. The vibration data were trans-
mitted by two telemetry systems. Five canister area measurements were
transmitted on FM/FM channels with a data frequency range varying from
0 to 330 cps or 0 to 1050 cps, depending upon the specific telemetry
channel. The remaining 35 measurements were transmitted by SS-FM with
an approximate data frequency range of 50 cps to 3 kilocycles. The
eight hydraulic actuator vibration measurements were transmitted on a
time-shared basis with four measurements on each of two telemetry
channels.
10.5.3 DISCUSSION OF VIBRATION MEASUREMENTS
Structural Vibrations
Five structural measurements were monitored during SA-3 flight.
The two measurements on the spider beam (E99-II and El00-11) varied
considerably, being much more sensitive than the engine measurements
to the events of flight (i.e., ignition, Mach I, q max, cutoffs, and
retro firing). This same characteristic was experienced during both
previous flights.
The engine gimbal point support measurements (E40-1 and E40-7)
displayed high level transients at ignition, then immediately decayed
to the mainstage level. These measurements remained relatively con-
stant throughout the remainder of flight until cutoff, responding much
like engine measurements due to their near-engine location.
The heat shield measurement (E47-I) showed a maximum build-up at
ignition, then decreased gradually to a very low level at approximately
95 sec flight time. This measurement did show a slight increase in
vibration level at Mach 1 and q max similar to SA-2 flight.
The upper part of Figure 10-9 displays maximum and minimum accel-
eration time histories of the structural measurements. The upper por-
tion of the envelope was established by the data from the gimbal

103
point support measurements and heat shield measurement, which were
previously noted to have remained constant throughout flight. The
lower portion of the envelope, characterized by the spider beam meas-urements, shows an increase in vibration level in the region of Mach I
A and q max.
Propulsion System Vibrations
Twelve engine vibration measurements were monitored during the
SA-3 flight. These measurements showed considerable build-up at or
immediately after ignition, followed by a decay to a steady state level.
There was no significant change in the engine vibration levels during
the mainstage portion of powered flight. Increased vibration levels
were noted at cutoff, followed immediately by a decay to zero. Data
were available only intermittently on the thrust chamber dome longitu-
dinal measurements, therefore they were considered to be only partiallysuccessful.
All engine vibration data from SA-3 flight compared very well to
SA-I and SA-2 data except measurement E45-8 (fuel suction line long't),
which was about twice as high on SA-3 flight as compared to SA-2 flight.
However, no evidence of structural failure was indicated in this area.
An investigation is being made to determine the cause of these high
levels. Because of the high levels indicated, measurement E45-8 wasnot included in the maximum and minimum acceleration time histories as
shown in the lower part of Figure 10-9. However, it is felt that themeasurement is valid.
Component Vibrations
The hydraulic actuators, ST-90, ST-124, retro rocket number I,canister 14 lower support, instrument panel in canister 14, and pro-
pulsion unit distributor were monitored by a total of 22 vibrationmeasurements.
The hydraulic actuators were instrumented with eight vibration
measurements. The only erratic data were recorded from the yaw actua-
tor measurement on engine four. Vibration amplitudes appeared to be
very similar to the data recorded during previous flights.
The center part of Figure 10-9 presents an envelope of the RMSacceleration time histories obtained from the canister area. This
envelope does not reflect erratic transients which occurred on some of
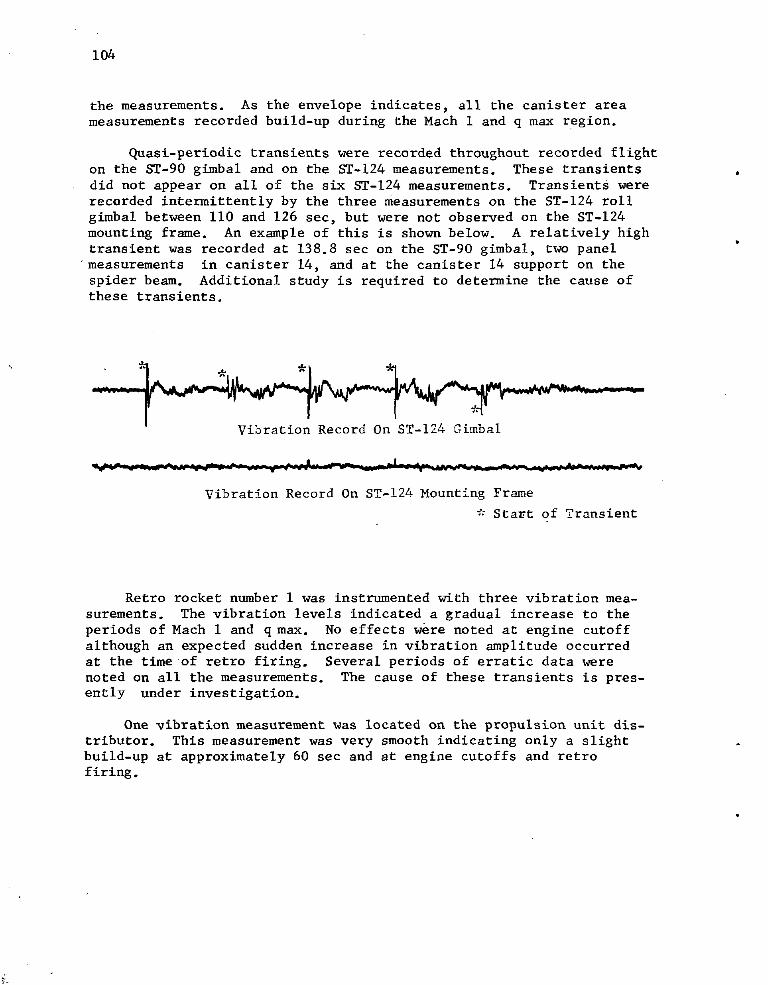
104
the measurements. As the envelope indicates, all the canister area
measurements recorded build-up during the Mach I and q max region.
Quasi-periodic transients were recorded throughout recorded flighton the ST-90 gimbal and on the ST-124 measurements. These transients
did not appear on all of the six ST-124 measurements. Transients were
recorded intermittently by the three measurements on the ST-124 roll
gimbal between II0 and 126 sec, but were not observed on the ST-124mounting frame. An example of this is shown below. A relatively high
transient was recorded at 138.8 sec on the ST-90 gimbal, two panel
"measurements in canister 14, and at the canister 14 support on the
spider beam. Additional study is required to determine the cause ofthese transients,
Vibration Record On ST-124 Gimbal
Vibration Record On ST-124 Mounting Frame
* Start of Transient
Retro rocket number I was instrumented with three vibration mea-
surements. The vibration levels indicated a gradual increase to the
periods of Mach I and q max. No effects were noted at engine cutoffalthough an expected sudden increase in vibration amplitude occurred
at the time of retro firing. Several periods of erratic data were
noted on all the measurements. The cause of these transients is pres-
ently under investigation.
One vibration measurement was located on the propulsion unit dis-
tributor. This measurement was very smooth indicating only a slight
build-up at approximately 60 sec and at engine cutoffs and retrofiring.
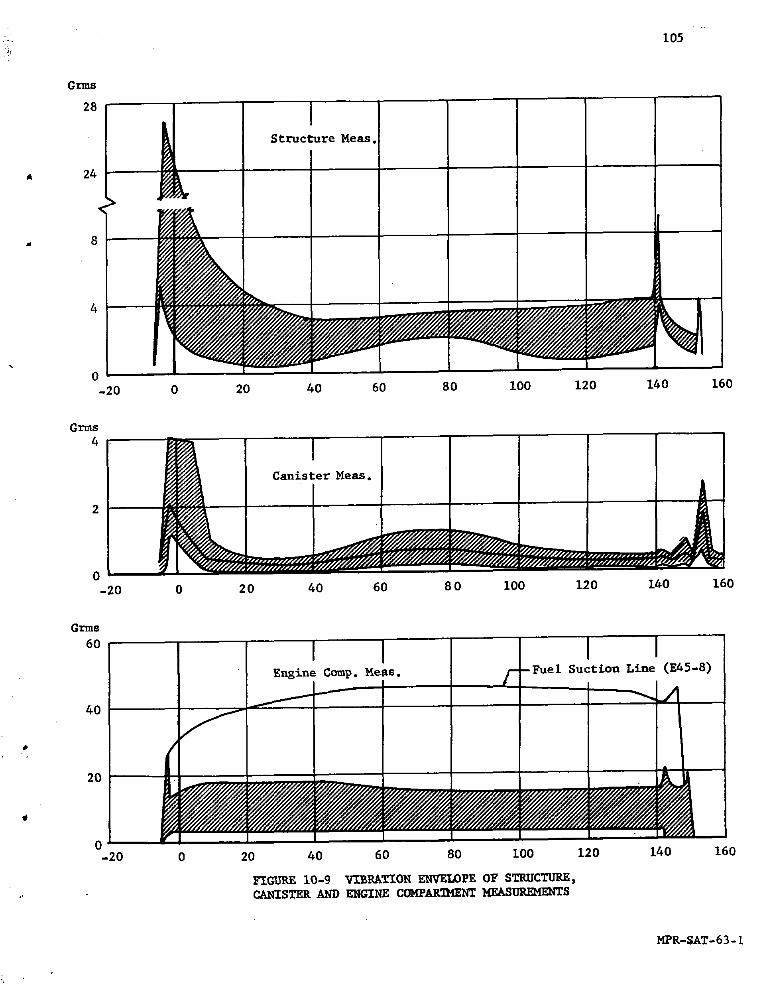
!_ 105
GTms
28
Structure Meas o,
• 24 >
, o tr-20 0 20 40 60 80 I00 120 140 160
-20 0 20 40 60 80 100 120 140 160
Grins
oo I I I IEngine Comp° Me_s. /----Fuel 8uctlon Line (E45-8)
" _o [ ; ,, -
11
0 I I I I I t . ,-20 0 20 40 60 80 I00 120 140 160
FIGLRRE10-9 V-IBRATIONENVELOPE OF 8TRUCTI;RE,CANISTER AND ENGINE COMP_ MEAS_S
MPR-SAT-63 - 1
106
10.6 VEHICLE ACOUSTIC MEASUREMENTS
The SA-3 vehicle had one inflight acoustic measurement (LI0-11)
and four trailing wire measurements (XL24-9, XL25-9, XL26-11, XL27.13).
The inflight measurement was located at station 889 on fin line IV and
followed the general expected trend (see Figure I0-I0). The primary
purpose of this measurement was to obtain "inflight" acoustic data.
To obtain this type of data, the calibration range of the recording
system was 120 to 140 db; consequently, the higher level "on-pad"acoustic data were sacrificed for the inflight data.
The inflight measurement recorded a disturbance at 138.8 sec range
time (see component vibrations section 10.5.3) and caused the measure-
ment to appear unusual throughout the rest of the flight. The source
of this disturbance is unexplained at this time.
The trailing wire acoustic measurements on SA-3 recorded data be-
tween -3 and +6 sec range time. This period was sufficient to obtain
useful "on-pad" acoustic data. The maximum levels recorded on these
measurements were as follows:
Meas. No. Location Max OA-SPL (db)
XL 24-9 Inside Shroud i}
Sta. 167 off Fin II toward Fin I 149.Liftoff
XL 25-9 Outside Shroud
Sta. 167 off Fin II toward Fin I 157
XL 26-11 Sta. 889 on Fin IV i I_
Adjacent to Canister 13 149. Liftoff&
XL 27-13 Sta. 889 Inside Canister 13 132 6 sec
The time histories of these measurements are shown in the lower part
of Figure I0-I0. The maximum overall sound pressure levels (OA SPL),
recorded on measurements EL 24-9 and XL 25-9, indicated that the shroud
provided a noise reduction of about 8.5 db at liftoff. Measurement
XL 25-9 then remained fairly constant during the remaining time dura-
tion of data acquisition, while XL 24-9 decreased somewhat during the
last 3 sec of data due to a change in the spectral characteristics of
the external sound field.
The difference in the maximum overall sound pressure levels of
measurements XL 26-11 and XL 27-13 indicated a noise reduction across
the wall of canister 13 of 17.5 db. This noise reduction existed
throughout the period during which data were obtained.

107
Over-all Sound Pressure Level (db) RE: 0.0002 Dynes/cm 2
160 [ l
Telemetered
(Sta. _$9 on Fin IV)
• 150 r------- _----_---_ Ia= _ ooi
•"4 0 "_ 0 I_ m_ OI
Clipped Data _ _ = _ _1
. S ,,,, -120 _|
_--- Trans ient
ii0 i0 20 40 60 8 0 I00 120 140 160
Range Time (see)
Over-all Sound Pressure Level (db) RE: 0.0002 Dynes/era2
160Outside Shroud
[ III r- Outside Canistez
150 / [ _ _b_'_ __ ---- _Inside Shroud//I I
;l/If /-Inside Canister
140
Y130 S -- Sta. 889 on Fin IV
• / .... Sta. 167 off Fin II--_Fin I
/120 I
I
, Trailing Wires
I110
- 6 -4 -2 0 2 4 6 8 i0
Range Time (see)
FIGURE i0-I0 SA-3 7EHICLE ACOUSTICS
MPR-SAT- 63-i
108
ii.0 (U) ENVIRONMENTAL TEMPERATURES AND PRESSURES
ii.I SUMMARY
The base region environment during the SA-3 flight was similar to
that encountered on the two previous flights. Radiative heating rates
on SA-3 are considered representative for the Saturn C-l, Block I
vehicle. Absolute values of the total heating environment after 90 sec
of flight are considered questionable at this time. The heat shieldand flame shield thermal insulation scheme was the same for SA-I, SA-2,
and SA-3, except for one panel on the heat shield which was insulatedwith the Block II insulation material (M-31). Measurements made forward
of the heat shield (except the temperature measurement on the M-31
insulated panel which failed prior to liftoff) indicated the insulation
to be entirely adequate.
The base pressure measurements on SA-3 indicated a slightly higher
pressure gradient across the heat shield than indicated on previous
flights. However, results from all three flights are within the
telemetry error band.
Skin temperatures on the propellant tanks were generally lower on
SA-3 than on previous flights due to the higher propellant level in the
tanks. Skin temperatyres on the dun_ny S-IV stage and interstage fairing
indicated no significant temperature rises except on the conical portion
of the interstage fairing where maximum skin temperatures of 71°C to159°C were indicated. Skin temperatures in the vicinity of the S-IV
stage protuberance were within expected levels.
Instrument canister pressure was maintained within the required
level (0.7 to 1.2 kg/cm2) throughout flight. The canister temperatures
were maintained within an acceptable range (I0 to 40°C) during both
prelaunch and during flight. Both the ST-90 and the ST-124P guidance
platform compartment temperatures were in an acceptable temperature
range (25 ± 2°C) at liftoff.
11.2 TAIL SECTION
11.2.1 BASE ENVIRONMENT
11.2.1.1 BASE PRESSURE
Absolute base pressure instrumentation on SA-3 was identical tothat on SA-I and SA-2. In addition, one instrument was installed on
the SA-3 vehicle to measure the pressure difference between the lower

109
Base Minus Ambient Pressure (kg/cm 2)0.4
_SA-2 FlameShield
0.2 .,__/_
S J
0 ___.>.._z"................¢,t,,///IC/,,11......._
. / k---Heat Shield
(8A- I,SAi2, SA-3)i t ,-0.2 ) %1 I0 20 30 40 50 60 70 80
Altitude (km)FIGURE ll-1 BAS_ PRESSURE MINUS _LMBIENT PRESSURE VERSUS ALTITUDE
Flame Shield Pressure (kg/cm 2)1.2
0.8
/-SA-3
0.4 %
SA- 2_ ' ,
0 i0 20 30 40 50 60 70 80
Altitude (kin)FIGURE 11-2 FLAME SHIELD PRESSURE COMPARISON VERSUS ALTITUDE
Ratio of Base to Ambient Pressure /
12 / 7t
l/ P
/ I/ I
8 / II
/
_s's'----_k_--SA-] Flame Shield
• 4 s _'S
_"_""" --_--SA-3 Heat Shield• 0
0 0.4 0.8 1.2 1.6 2.0 2.4 2.8 3.2Math Number
FIGURE 11-3 RATIOS OF BASE PRESSURE TO AMBIENT PRESSURE VERSUS MAc}{ _ER
MPR-SAT-63-1
ii0
compartment (forward ef heat shield) and the region aft of the heatshield. This pressure differential measurement failed just after
ignition and prior to liftoff, due to a malfunction of a power unitsupply (see Chapter 9.0).
The difference between base pressure and ambient pressure for both
the heat shield and the flame shield is presented in F%gure ii-I. All
measurements on the heat shield were generally consistent with each
other throughout the powered phase of flight. A minimum pressure dif-ferential of -0.03 kg/cm z was observed at an altitude of 6 km (60 sec
of flight) in the area between the outboard engines. A maximum value
of 0.03 kg/cm 2 was observed at an altitude of 17 km (90 sec of flight)between the outboard engine and the engine shroud. There appears to
be an indication of a higher pressure gradient across the heat shield=ban indicated on previous flights. Although this occurrence may be a
direct consequence of the different trajectory followed by SA-3, results
, from all three flights are within the error margin which can be attrib-
uted to telemetry error.
The largest magnitude of base pressure minus ambient pressure
occurred in the flame shield region _@nere extreme values ranged from-0.15 kg/cm 2 at an altitude ef 2.5 km to 0.37 kg/cm 2 at 17.2 km (Figure
ii-i). The telemetered data indicate a different behawior in the flame
shield region than was observed on the first two Saturn flights (Figure
11-2). At an altitude of approximately 3 km, the pressure in the flame
shield area stabilized with only a slight decrease between 3 and 17
kilometers. Then it rapidly decreased to the expected level. A sharpdecrease in the center star base pressure occurred at IECO (61.5 km)
as expected. At this time, no definite conclusions have been drawn in
regard to this unusual phenomenon in the flame shield pressure. Close
investigation of the pressure data in the center star region has not
revealed any reason to suspect the telemetry er measurement.
Average values ef the ratio of base to ambient pressure, pb/Pa ,for both the heat shield and flame shield (center star) are plotted
versus Mach number in Figure 11-3. Wind tunnel test data from the
Rocket Test Facility, AEDC, are also shown for comparison.
The absolute pressure measurement in the lower compartment, D27-5,
and four differential pressure measurements, D143-2, D143-4, D144-9,and D145-9, for measuring the difference between lower and upper cum-
partment pressures, failed prier to liftoff. All ef these failures are
attributed to loss of the inboard power supply.
The forward compartment pressure lagged the embie_t pressure except
at altitudes below 2 km, as expected. The maximum difference between
the forward compartment and ambient pressure was approximately -0.023kg/cm 2 at an altitude of 21 kilometers.
Iii
11.2.1.2 BASE TEMPERATURES
Gas temperature in the SA-3 base region was measured with a seriesof unshielded thermocouples. The locations of the thermocouples are
A shown in Volume II of this report.
The bands of gas temperature and associated areas of the base
region for SA-2 and SA-3 flights are shown in Figure 11-4. Gas temper-atures measured during the SA-3 flight compare favorably with those
measured during the SA-2 flight at the same altitude. Measured gas
temperatures from the SA-I flight are not included in these bandsbecause of the necessary correction factor required to compensate for
the shielding of the gauges; however, the corrected SA-I gas temper-
atures also compare well with the SA-3 measurements.
The maximum gas temperature measured on the heat shield, I150°C,
occurred at approximately 25 km (or 103 sec range time for SA-3); thiswas the same as the maximum measured on SA-2. The gas temperature
measured between the inboard engines, near the heat shield, and betweenthe shroud and the outboard engines reache_ a maximum of 700°C on SA-3,
approximately 50°C below that of SA-2. High temperatures measuredbetween the outboard engine and the shroud, labeled SA-2 in the figure,
did not appear during the SA-3 flight.
The gas temperature in the heat shield region appears to be theresult of reversed gases leaving the flame shield and circulating in
the base region. The latter would indicate that the scoops tend to
lose their ability to flush the base region above 15 or 20 kilometers.
The slight decrease in the gas temperatures above 25 km can possiblybe attributed to the inability of the thermocouple to measure the true
gas temperature at these high altitudes and low densities, rather thana real trend.
Surface temperatures of the outboard engine shroud's stringer and
skin respectively, are shown as the lowest band in Figure 11-4. Althoughthe shroud stringer temperature is a structural measurement, the tem-
perature-time history of the two measurements sho_ssimilar trends sinceboth are subjected to the same base heating. On the SA-3 vehicle, these
instruments were covered by reflective aluminum tape. Both measurements
" however, show a trend similar to that measured on SA-2, with the stringer
measurement reaching a maximum which was approximately 100°C lower thanthe SA-2 maximum.
• Shown also in Figure 11-4 is the gas temperature measurement,
C67-7, which was located on the flame shield. This gas temperature
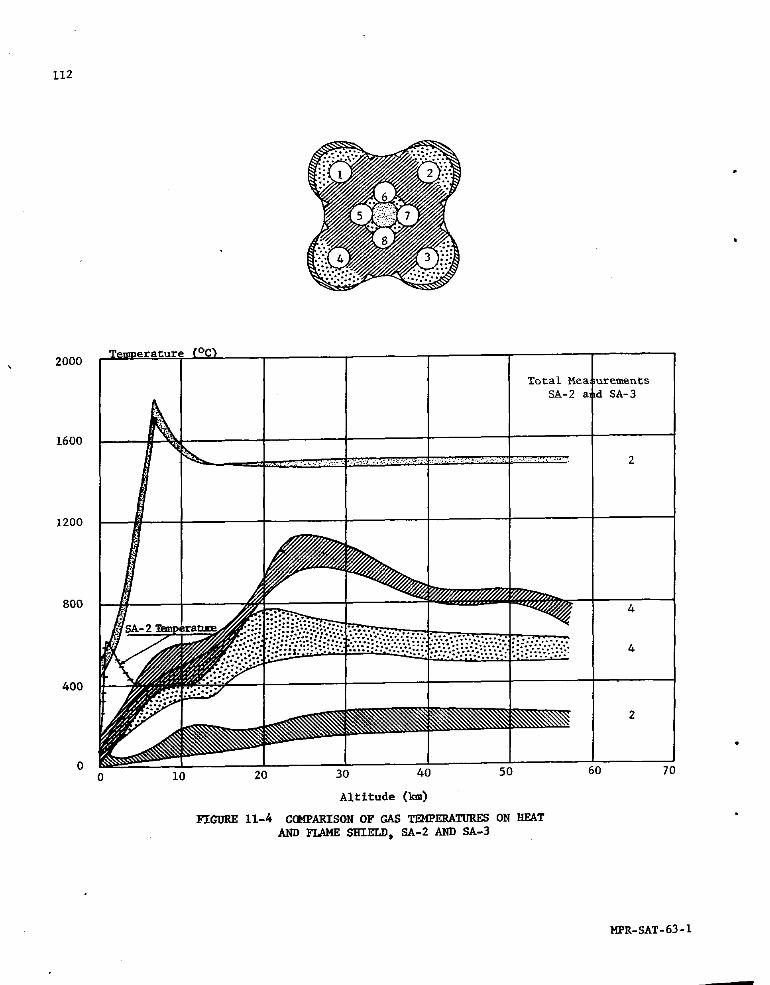
112
2000 • '
Total Mea urementsSA-2 a d SA-3
1600
1200
_oo _ _ __,_
400
o •0 i0 20 30 40 50 60 70
Altitude ('ma)
FIGURE 11-4 COMPARISON OF GAS TI_4PERATURES ON HEAT
AND FLAME SHIELD_ SA-2 AND SA-3
MPR- SAT- 63-I
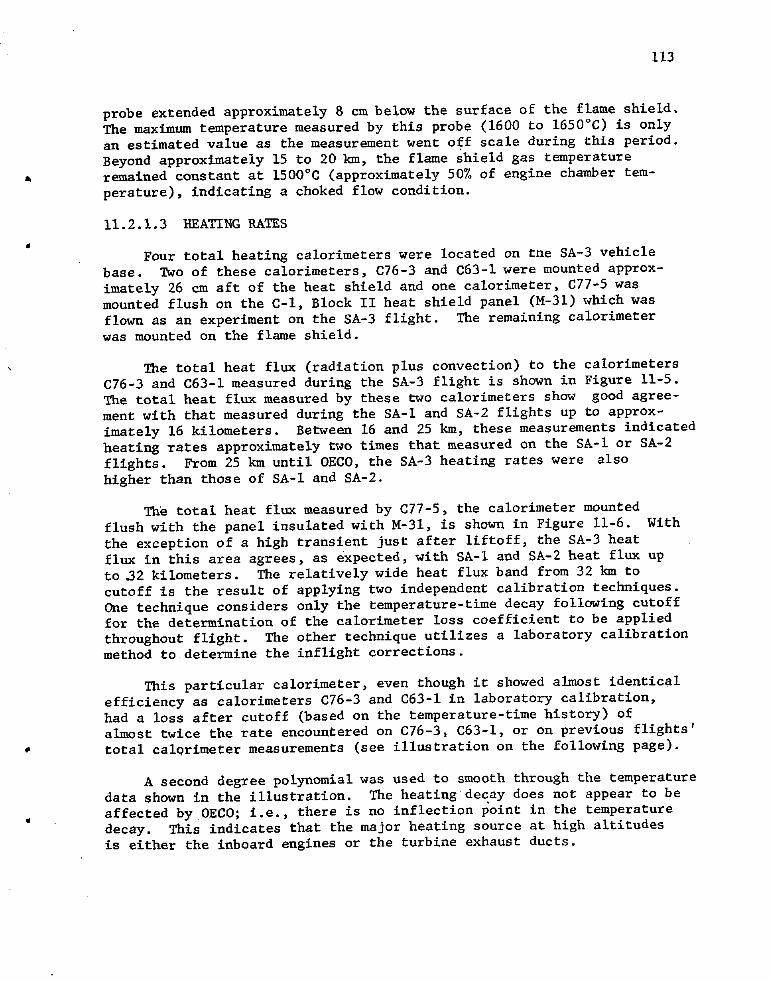
113
probe extended approximately 8 cm below the surface of the flame shield.The maximum temperature measured by this probe (1600 to 1650°C) is only
an estimated value as the measurement went off scale during this period.
Beyond approximately 15 to 20k m, the flame shield gas temperatureremained constant at 1500°C (approximately 50% of engine chamber tem-
perature), indicating a choked flow condition.
11.2.1.3 HEATING RATES
Four total heating calorimeters were located on the SA-3 vehiclebase. Two of these calorimeters, C76-3 and C63-I were mounted approx-
imately 26 cm aft of the heat shield and one calorimeter, C77-5 wasmounted flush on the C-I, Block II heat shield panel (M-31) which was
flown as an experiment on the SA-3 flight. The remaining calorimeterwas mounted on the flame shield.
The total heat flux (radiation plus convection) to the calorimeters
C76-3 and C63-I measured during the SA-3 flight is shown in Figure 11-5.
The total heat flux measured by these two calorimeters show good agree-
ment with that measured during the SA-I and SA-2 flights up to approx-
imately 16 kilometers. Between 16 and 25 km, these measurements indicated
heating rates approximately two times that measured on the SA-I or SA-2
flights. From 25 km until OECO, the SA-3 heating rates were also
higher than those of SA-I and SA-2.
The total heat flux measured by C77-5, the calorimeter mounted
flush with the panel insulated with M-31, is shown in Figure 11-6. With
the exception of a high transient just after liftoff, the SA-3 heat
flux in this area agrees, as expected, with SA-I and SA-2 heat flux upto _2 kilometers. The relatively wide heat flux band from 32 km to
cutoff is the result of applying two independent calibration techniques.
One technique considers only the temperature-time decay following cutofffor the determination of the calorimeter loss coefficient to be applied
throughout flight. The other technique utilizes a laboratory calibrationmethod to determine the inflight corrections.
This particular calorimeter, even though it showed almost identical
efficiency as calorimeters C76-3 and C63-I in laboratory calibration,had a loss after cutoff (based on the temperature-time history) ofalmost twice the rate encountered on C76-3, C63-I, or on previous flights'
total calQrimeter measurements (see illustration on the following page).
A second degree polynomial was used to smooth through the temperaturedata shown in the illustration. The heating decay does not appear to be
affected by OECO; i.e., there is no inflection point in the temperature
• decay. This indicates that the major heating source at high altitudesis either the inboard engines or the turbine exhaust ducts.
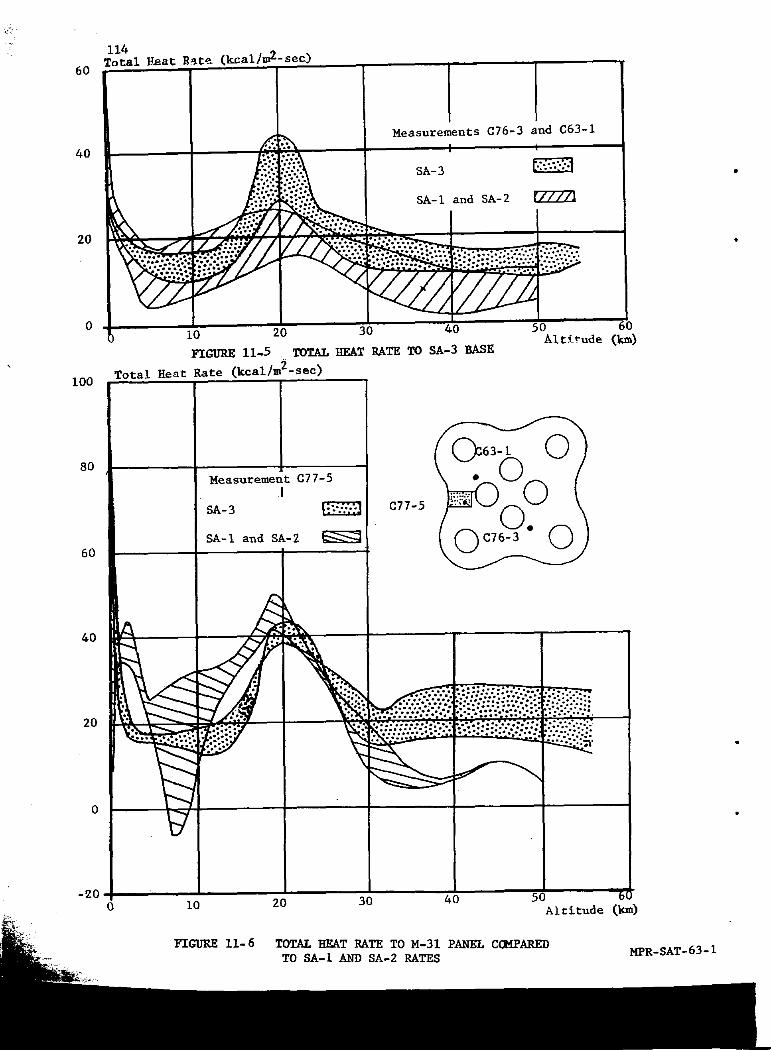
114Total _a_ _te (kcal/m2-sec)
60
40 Mea'ure' 'nt'c'6-3"ndc63-1 .::._o::%
SA-I and SA-2 [7777]20
.;::.:..•...:.::.%__ . ...
0 ,, i. J
i0 20 30 40 50
Altitude (km)FIGURE 11-5 . TOTAL HEAT RATE TO SA-3 BASE
i00 Total Heat Rate (keal/m2-sec)
80 ,,
Measurement C77-5
!
SA-3 _, C77-5
SA-I and SA-2 _I6O
-20- ,.0 I0 20 30 40 50
_: Altitude (km)
FIGURE 11-6 TO 31 PANELTO SA-I SA-2 '-63-1

115
• .J
"[. Typical Decay
Time
COMPARISON OF CUTOFF DECAY FOR C77-5 WITH A TYPICAL DECAY
At this time no explanation as to the cause of this rapid temper-
ature decay is available_ but preliminary evaluation indicates the
following possibilities: I) a difference in the heating and cooling
cycles possibly exists, whereby the correction factor obtained after
cutoff is possibly not valid for the entire flight, 2) possible conduc-
tion losses during flight higher than indicated by the laboratory cal-
ibration method, and 3) a possibility of a convective cooling source
" hitting the calorimeter surface at cutoff could exist.
Differences existed between the height, mounting, and insulation
in the immediate vicinity of the SA-I, SA-2, and SA-3 calorimeters.
These differences should be considered before firm conclusions are
reached as to the relative comparison of heating rates. Even though

116the total heating rates appeared to be higher on SA-3, this did not
influence the heat shield forward side temperature which was approxi-mately the same as $A-I and $A-2. Further evaluation of these measure-ments will be performed in an effort to obtain a truer loss coefficient.
In general, the total calorimeter heating values on the heat shieldshould only be used as relative values since preliminary evaluation has
indicated the possible error sources stated above. As these error
sources could conceivably become significant near the end of flight,
one should not attempt a conclusion as to _ether convective heating or
cooling was dominant to the calorimeter surfaces.
The total heat flux measured by the flame shield calorimeter C78-8is shown in Figure 11-7. The SA-3 inflight heat flux to the flame
shield is in good agreement with that measured during the SA-I and SA-2
flights and absolute values are considered valid. The maximum heat
flux measured near liftoff on SA-3 was slightly higher than that of
SA-I or SA-2. The heat flux measured at approximately 8 km (the alti-tude where the heat flux appears to be most strongly influenced by ex-
haust jet flow reversal) was slightly lower on SA-3 than on SA-I or
SA-2. Beyond approximately 25 km until IECO, the heat flux remainedrelatively constant.
Two thermal radiation calorimeters were located 26 cm aft of the
heat shield on the SA-3 vehicle. Both calorimeters were located between
an outboard and two inboard engines in approximately symmetrical posi-
tions. These calorimetems differed considerably in design however, and
the details can be found in Volume II of this report.
Thermal radiation levels which were measured on the SA-3 flightare shown in Figure 11-8. Corrections were made to the telemetered
data by two different techniques, both of which consider the calorimeter
slug temperature history. The data in the upper band was obtained by
varying the calorimeter slug heat input and measuring the temperature-
time history of the slug to obtain the proper correction. The lower
band of data was corrected by evaluating the losses after engine cutoff
using the temperature-time slope and defining a heat balance assumingno heat input. This second method assumes that the correction factor
is constant throughout flight; i.e., the loss coefficient will be the
same for both the heating and the cooling cycles. This point has not
been proven at this time however, and based on the laboratory calibra-tion technique, this loss coefficient varies throughout flight.
A point of interest concerning the two methods is that values
obtained at both liftoff and cutoff agree within the accuracy of the
data. At liftoff this would be expected since the calorimeter losses
should be negligible compared to the sensible heat input. At cutoff

117
Total Heat Flux (kcal/m2-sec)
" 300
250 [
200
100 _ .......
:_,_ SA-1, SA-21, ,,c SA-3
50 _;_
0
0 10 20 30 40 50 60
Ale£cude (km)
F'LG'URE 11-7 ID_ALHEATZNCRATEONFLAHESgTE'LD_ SA-1, SA-2 & SA-3
MPR-SAT-63-i
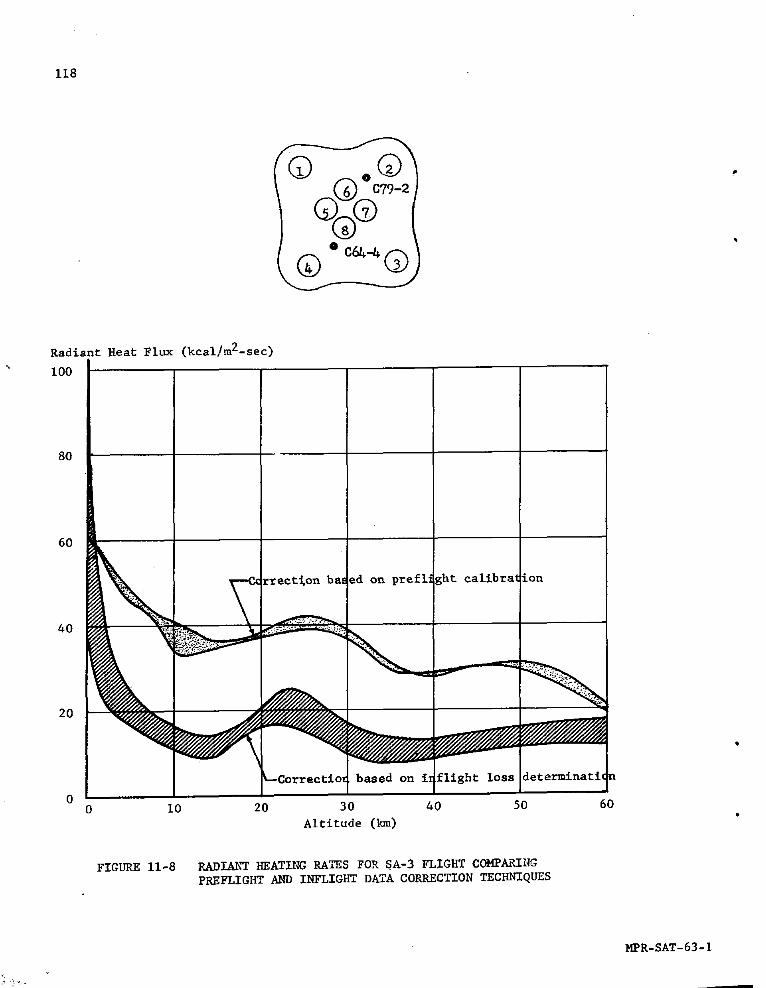
118
Radiant Heat Flux {kcal/m2-see)
I00 ,
_--Correctioz based on £,!fllght loss 'determinatl
00 i0 20 30 40 50 60
Altitude (km)
FIGURE 11-8 RADIANT BEATING RATES FOR $A-3 FLIGHT COMPARING
PREFLIGHT AND INFLIGHT DATA CORRECTION TECHNIQUES
MPR-SAT-63- I
119
it appears that the two techniques also yield approximately the sameresults. Intermediate values between liftoff and cutoff differ due to
the methods utilized. A more detailed presentation of the two techniques
utilized in evaluating the loss coefficients will be presented in4
Volume II of this report.
11.2.2 ENGINE COMPARTMENT
J The engine compartment experienced no extreme temperature environ-
ment during the flight. Ambient air temperature within each engine
area was measured and no temperature above 0°C or below -50°C was
indicated. The upper limit of the engine compartment gas temperature
of SA-3 was slightly below that of SA-2 flight (see Figure 11-9).
11.2.3 FORWARD NEAT AND FLAME SHIELD
Two other temperatures are also shown in Figure Ii-i0; measurement
C20-5, attached to the flame support strut, and C21-5, attached to the
flame shield seal support. The temperature level in this area is as
expected.
Temperatures recorded on the forward side of the heat shield are
presented as a band in Figure ll-ll. The heat shield measurements on
SA-3 agree well with those of SA-I and SA-2, ranging from -25 to +25°C.
The high temperature measured by C70-7 during the SA-2 flight (described
in the SA-2 report) cannot be explained; however, based upon the SA-I
and SA-3 results, it follows that it is not characteristic of the heat
shield temperature. The maximum temperature of 25°C, measured during
the SA-3 flight, indicates that the heat shield insulation was more
than adequate. Due to the failure of the measurement in back of theM-31 insulated panel, the relative adequacy of the two insulationmaterials cannot be assessed.
11.3 SKIN
The skin temperatures at various positions on the propellant tanks
for the SA-3 vehicle were measured by ten thermocouples located as
shown in Volume II of this report. Generally, the skin temperatures
measured during the SA-3 flight wer_ lower than those indicated during
, the SA-I and SA-2 flights (see Figure II-12)_ due to the higher propel-lant level in the tanks; however, the measured temperatures were within
the anticipated range of skin temperatures. Also shown (Figure 11-13)
are the skin temperature measurements of the fuel tank, C50-F3, and theLOX shroud at station 835. The latter measurements were in good agree-
" merit with those of the SA-I and SA-2 flights.
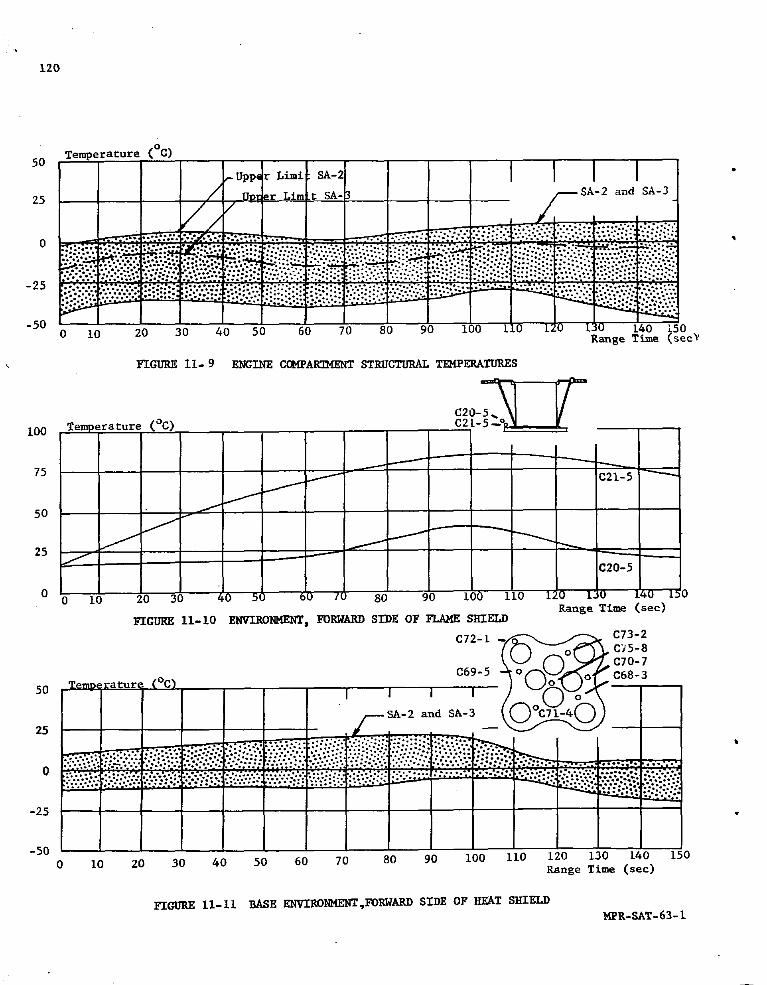
120
50 Temperature (°C)
_ Uppe c Limi SA-_
25 / Uou=_r Lira_ SA- /----SA-2 and SA-3_
t_'-*o°=?" . t-- _. _ * ".: = * •- •
::""=_; '.'.'.'.•.'i
-500 I0 20 30 40 50 60 70 80 90 i00 ii0 i; 140 150
Range Time (sec_'
I_GURE ii- 9 ENGLNE CCHP_ STRUCTLrRAL T]_dPERATURES
I00 _erature
75 _ G21-5
25 / __ _C20-5
0 0 10 20 31 80 90 i00 ii0 -Range Time (sec)
FIGURE II-I0 ENV_RONMENT= FORWARD SIDE OF FLAME SHIELD
C72-I--_ _ _ C73-2
( )_oC_-_\ / ( _ __C70-7
c6_-5- '-'_'_o_"c6_-_
_o , , , , -_ _½_• o__,___o.s_-_ © _.-_©
_-'_.:.-:.; ......
-25
-5O0 I0 20 30 40 50 60 70 80 90 i00 ii0 120 130 140 150
Range Time (sec)
FIGURE II-ii BASE ENV_ROI_EENT,FORWARD SIDE OF HEAT SHIELDMPR-SAT-63-1
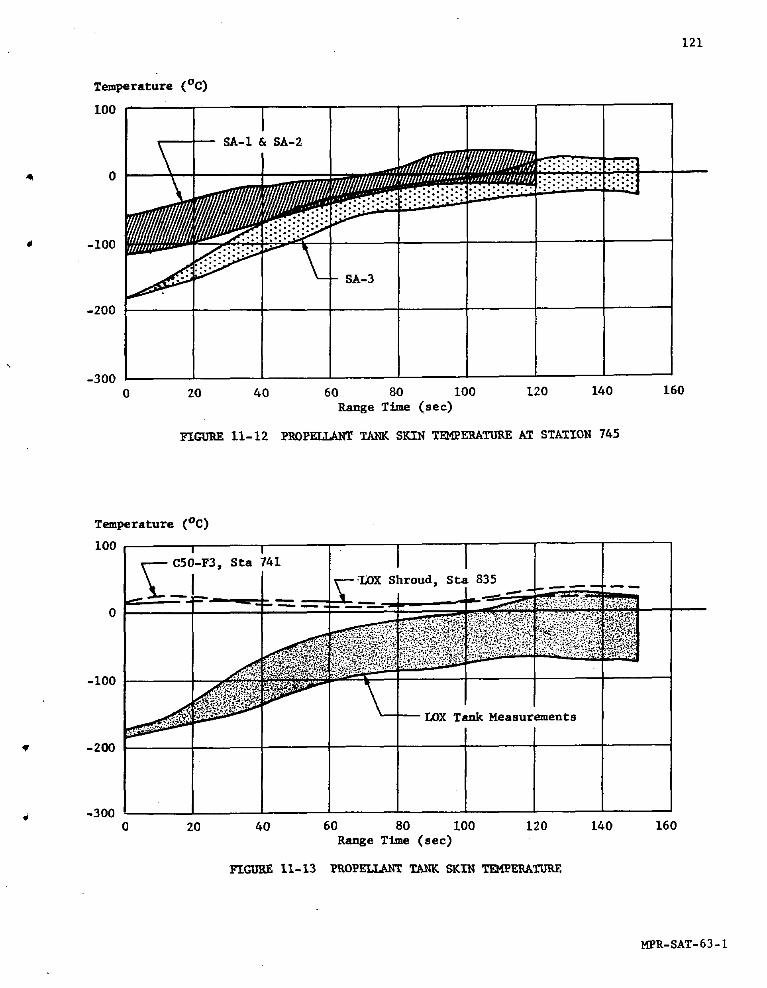
121
Temperature (°C)
i00 -- ! II-- SA-I & SA-2
::':.'-'-"":.'.:."
i -I00
-200
J
-3000 20 40 60 80 I00 120 140 160
Range Time (see)
FIGURE 11-12 PROPELLANT _ SKIN TEMPERATIPREAT STATION 745
Temperature (°C)
i00 _ I I
_ C5_-F3, Sta 741
I
_i _=-==+I.X)XShroud, Sta 835_,_'.::_:_:_ :.;/-:_.:_,_ _ _,_'_:_'_:_._._.'. --:+:_T,+.•................... _,_ _:..: : ._: !_!_$
...._ _ -- I_X Tank Measurements
-3000 20 40 60 80 i00 120 140 160
Range Time (sec)
FIGURE 11-13 PROPELLAN_ TANK SKIN _PERA_XrRE
MPR-SAT-63-1
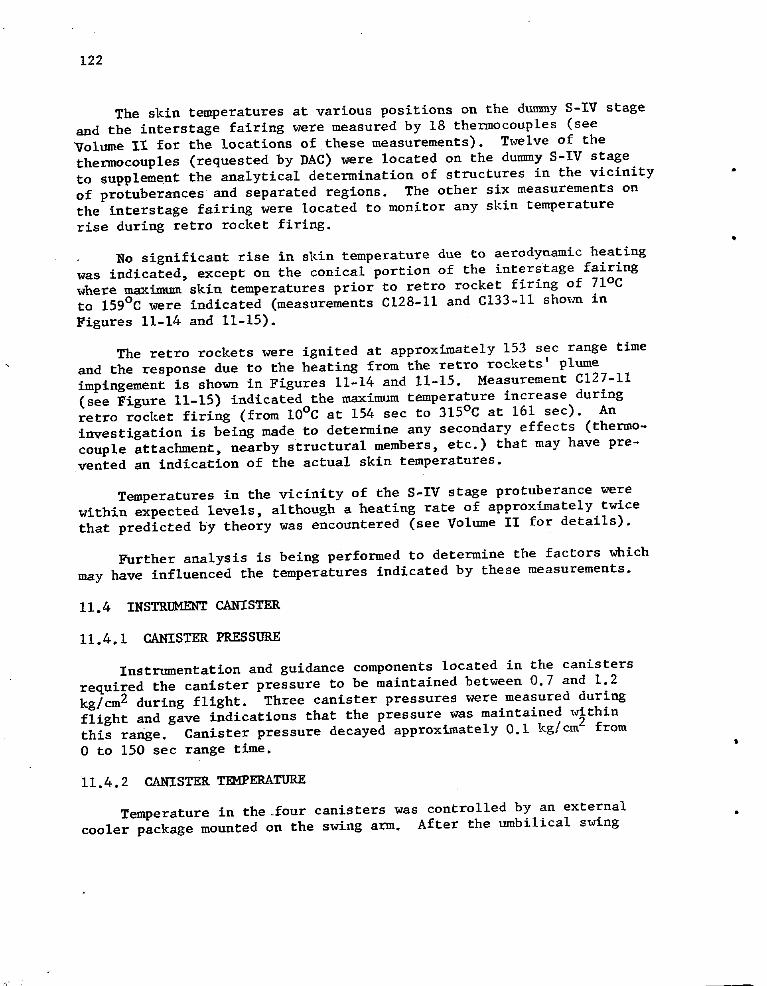
122
The skin temperatures at various positions on the du_ny S-IV stage
and the interstage fairing were measured by 18 thermocouples (see
_olume II for the locations of these measurements). Twelve of the
thermocouples (requested by DAC) were located on the dum_ny S-IV stage
to supplement the analytical determination of structures in the vicinity -
of protuberances and separated regions. The other six measurements on
the interstage fairing were located to monitor any skin temperature
rise during retro rocket firing.
No significant rise in skin temperature due to aerodynamic heating
was indicated, except on the conical portion of the interstage fairing
where maximum skin temperatures prior to retro rocket firing of 71oC
to 159°C were indicated (measurements C128-II and C133-II sho_m in
Figures 11-14 and 11-15).
The retro rockets were ignited at approximately 153 sec range time
and the response due to the heating from the retro rockets' plume
impingement is shown in Figures 11-14 and 11-15. Measurement C127-II
(see Figure 11-15) indicated the maximum temperature increase during
retro rocket firing (from 10°C at 154 sec to 315°C at 161 sec). An
investigation is being made to determine any secondary effects (thermo-
couple attachment, nearby structural members, etc.) that may have pre-
vented an indication of the actual skin temperatures.
Temperatures in the vicinity of the S-IV stage protuberance were
within expected levels, although a heating rate of approximately twice
that predicted hy theory was encountered (see Volume II for details).
Further analysis is being performed to determine the factors which
may have influenced the temperatures indicated by these measurements.
ii.4 INSTRUMENT CANISTER
11.4,1 CANISTER PRESSURE
Instrumentation and guidance components located in the canisters
required the canister pressure to be maintained between 0.7 and 1.2
kg/cm 2 during flight. Three canister pressures were measured during
flight and gave indications that the pressure was maintained _thin
this range. Canister pressure decayed approximately 0. i kg/cm 2 from
0 to 150 sec range time.
11.4.2 CANISTER T_4PERATURE
Temperature in the _four canisters was controlled by an external w
cooler package mounted on the swing arm. After the umbilical swing
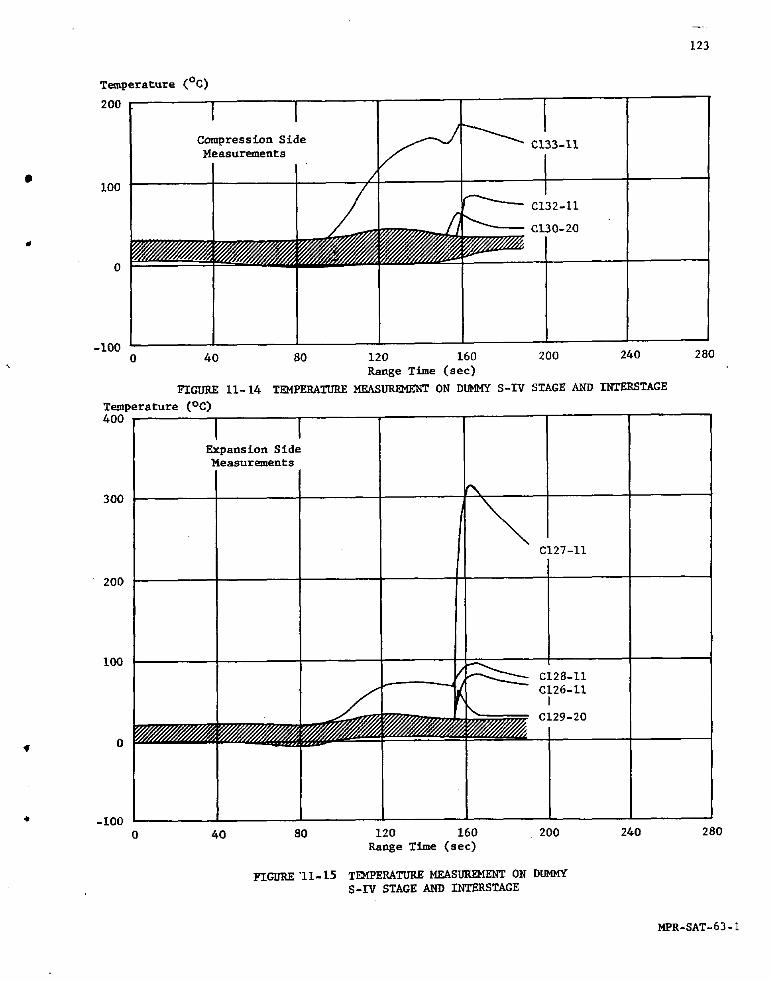
123
Temperature (°C)
200
Compression Side __ C133-iiMeasurements
.C132-II
C130-20
• _ __0
-I000 40 80 120 160 200 240 280
Range Time (sec)
FIGURE i1-14 T_PERATUREMEAS_ ON DUP_4Y S-IV STAGE AND INTERSTAGE
Temperature (°C)40O
Expansion SideMeasurements
300C127-II
2OO
_-- C129-20
-I000 40 80 120 160 200 240 280
Range Time (sec)
HOjRI'II-15 TEMYERATUREMEAS_ ON DLR_[YS-IV STAGE AND INTERSTAGE
MPR-SAT-63-1
124
arm was retracted there was no additional canister cooling. The accept-
able range of canister temperature was i0 to 40°C. .All canisters werewithin the acceptable range at liftoff.
Q
Specifications call for ambient air temperature in the ST-90 and
ST-124P guidance platform compartments to be controlled at 25 ± 2°C
(see Volume II for a schematic of the cooling system). Both ST-90 and
ST-124P guidance platform compartment temperatures were in the acceptable
range at liftoff. The ST-124P compartment temperature measurementindicated that the temperature stayed within the acceptable range
throughout flight. ST-90 ambient temperature was not monitored during
flight.
125
12.0 (U) AERODYNAMICS
12.1 SU_R_RY
• Aerodynamic static stability ratio, gradient of normal force coef-
ficient, and the center of pressure location were determined from the
SA-3 telemetered data. The flight results were in agreement with pre-
dicted values. However, the gradient of normal force coefficient and
• the center of pressure location for the SA-3 flight had larger error
margins than did results from previous flights, as expected, due to
lower values of angle-of-attack and dynamic pressure.
Surface pressure data for the SA-3 flight are presented as a ratio
of surface pressure to ambient pressure. SA-3 pressure data agreedwell with data from wind tunnel tests.
Pressure data on the simulated Centaur weather shield are in excel-
lent agreement with wind tunnel results. The flight results indicate
a maximum low pressure region (Cp= -1.74 at Mach 0.7) right behind the
shoulder in the subsonic region.
Sketches showing the detailed locations of the surface pressures
are included in Volume II of this report, Chapter 12.0.
12.2 RATIO OF GRADIENTS OF ANGULARACCELERATION (STABILITY RATIO)
The ratio of the gradients of angular aceeleratinn (stability
ratio CI/B O) was determined from the average telemetered pitch plane
engine deflection (_ p) and the free-stream angle-of-attack (_p).
The values of CI/B° obtained for the SA-3 vehicle and predictedvalues agreed well w_en plotted versus time (Figure 12-1). A minimum
value of -0.58 was obtained at the time of maximum dynamic pressure
(79.6 sec) compared to a predicted value of -0.55. An estimate of
the possihle error margin in the flight-determined stability ratio is
also shown in Figure 12-1.
12.3 GRADIENT OF NORMAL FORCE COEFFICIENT AND CENTER OF PRESSURE
LOCATION
• The gradient of the normal force coefficient (Cz') and the center
of pressure location (CP/D) were obtained using telemetered values of
angle-of-attack, normal acceleration, and engine deflection.
. Calculated values of Cz' and CP/D are in fair agreement with pre-dicted values and previous flights' results when plotted versus Mach
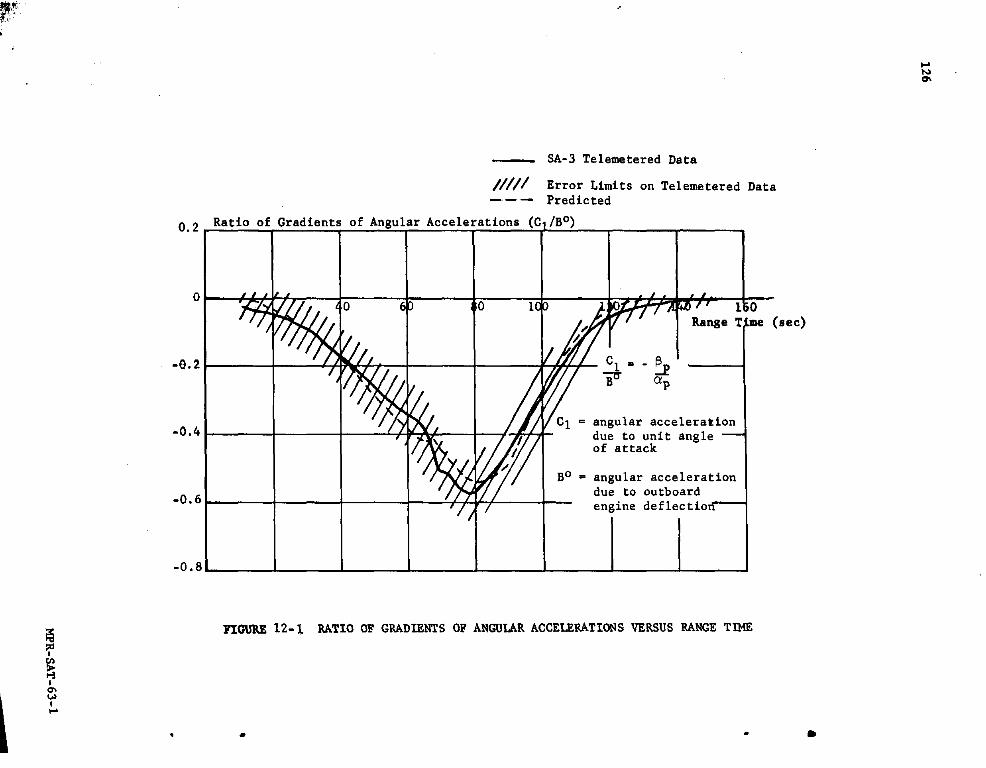
126
MPR-SAT-63-1
127
number (Figure 12-2). SA-3 data has a broader error margin than SA-I
or SA-2 which is attributed to the generally lower values of angle-of-
attack and dynamic pressure experienced on the SA-3 trajectory. The
unreliability and wide scatter of data at higher Mach numbers limited
Q the SA-3 analysis to the transonic and low supersonic region. In this
region, predicted values as well as SA-I and SA-2 flight results were
within the error margin of the SA-3 results.
• 12.4 SURFACE PRESSURE
12.4.1 STATION 205MEASUREMENTS
All four surface pressure pick-ups at Station 205 on SA-3 werelocated on the fillets of the flared-out region adjacent to the extreme
lower portion of the fuel and LOX tanks, similar to SA-2. Figure 12-3is a plot of surfaee-to-_mbient-pressure ratio versus Maeh number forall four individual measurements. Also shown are their approximate
radial locations at this station.
Except for measurement D78-I0, the pressures rose steadily aboveambient at this station after a Mach number of approximately 0.4,
reaching a maximum pressure ratio of 1.5 at Mach 2. Excellent agree-ment is also shown wit_ SA-2 values and wind tunnel test data.
The validity of the data from measurement D78-I0 had been pre-
viously questioned after the SA-2 flight on the grounds that it differ-
ed widely from wind tunnel results and from the consistent trend exhi-bited by the other three measurements. As shown in Figure 12-3, SA-3data for measurement D78-I0 was very similar to SA-2, thereby adding
some validity to the results from SA-2.
i_._2 STATION 860AND 863 MEASUREMENTS
Pressure ratios (surface to ambient) obtained from the four mea-
surements (same as on SA-2), located at Stations 860 and 863, are
plotted versus Mach number in Figure 12-4 with a sketch indicating theradial location of each individual measurement. Surface pressure
measurements D80-FI and D82-F3, situated at station 863, were located
on the extreme upper portion of the fuel tanks facing the flight direc-
tion. Measurements DSI-FI and D83-F3 were located facing the centerof the cluster at Station 860, slightly above the fuel tanks. Observed
flight readings indicate that the pressure dropped to a minimum of 80percent of ambient at Mach 1.2 and gradually increased to ambientaround Mach 2. SA-3 data is in good agreement with results from wind
• tunnel tests conducted in the Langley 8-foot TPT and 4-foot UPWT.
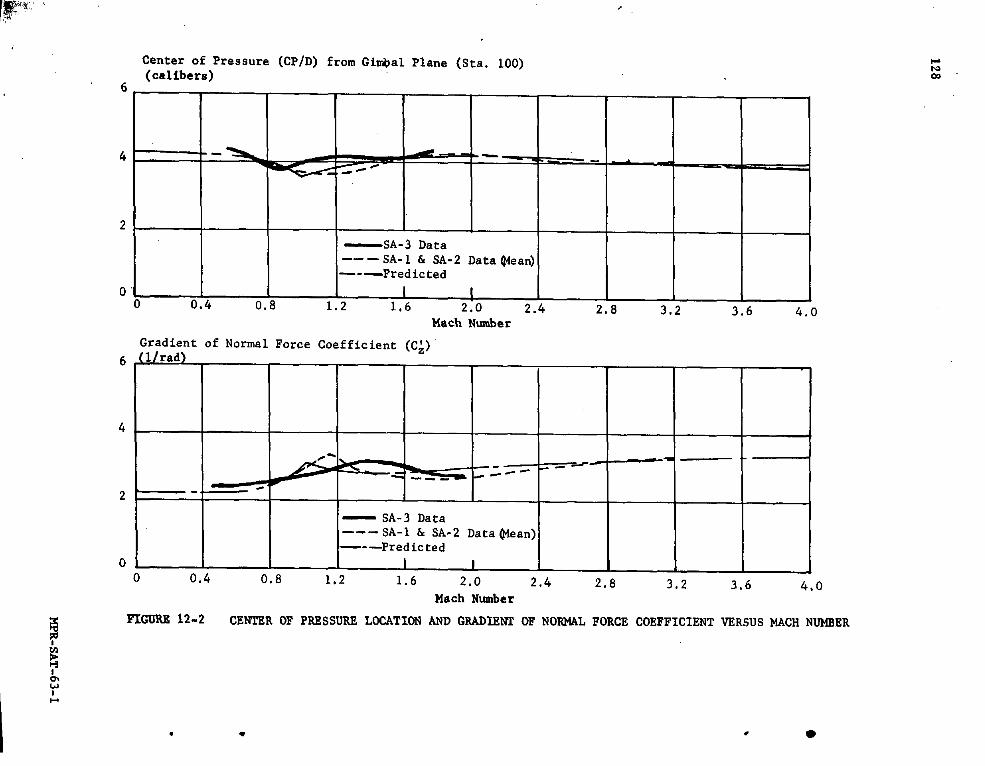
128
MPR
-SAT
-63-1
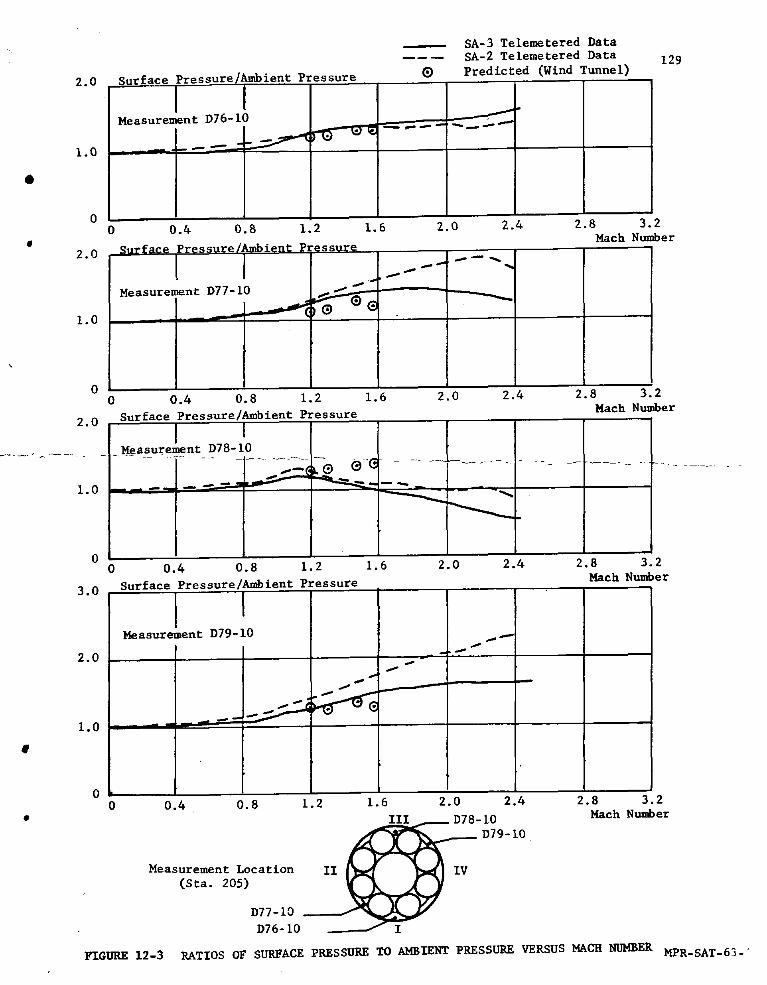
SA-3 Telemetered Data
SA-2 Telemetered Data 129
2.0 Surface Pressure/Ambient Pressure _ Predicted (Wind Tunnel)
Measurement D76-I0
$.0 ....
0 '"
0 0.4- 0.8 1.2 1.6 2.0 2.4 2.8 3.2• Mach Number
2.0 Surface Pressure/_mbient P1'essu_@
Measurement D77- I01.0
00 0.4 0.8 1.2 1.6 2.0 2.4 2.8 3.2
2.0 Surface Pressure/Ambient Pressure Mach NumberI
_M_asurement D78-I0
1.0 ---- -- "
00 0.4 0.8 i. 1.6 2.0 2.4 2.8 3.2
3.0 Surface Pressure/Ambient Pressure Mach Number
Measurement D79- i0
2.0 _.- "
1.0
Q
00 0.4 0.8 1.2 1.6 2.0 2.4 2.8 3.2
llI D78-I0 Mech Number
D79-10
Measurement Location II IV(Sta. 205)
D77-I0
D76-I0 I
FIGURE 12-3 RATIOS OF SURFACE PRESSURE TOAMBIENTPRESSUREVERSUSMACHNUMBER MPR-SAT-63-+
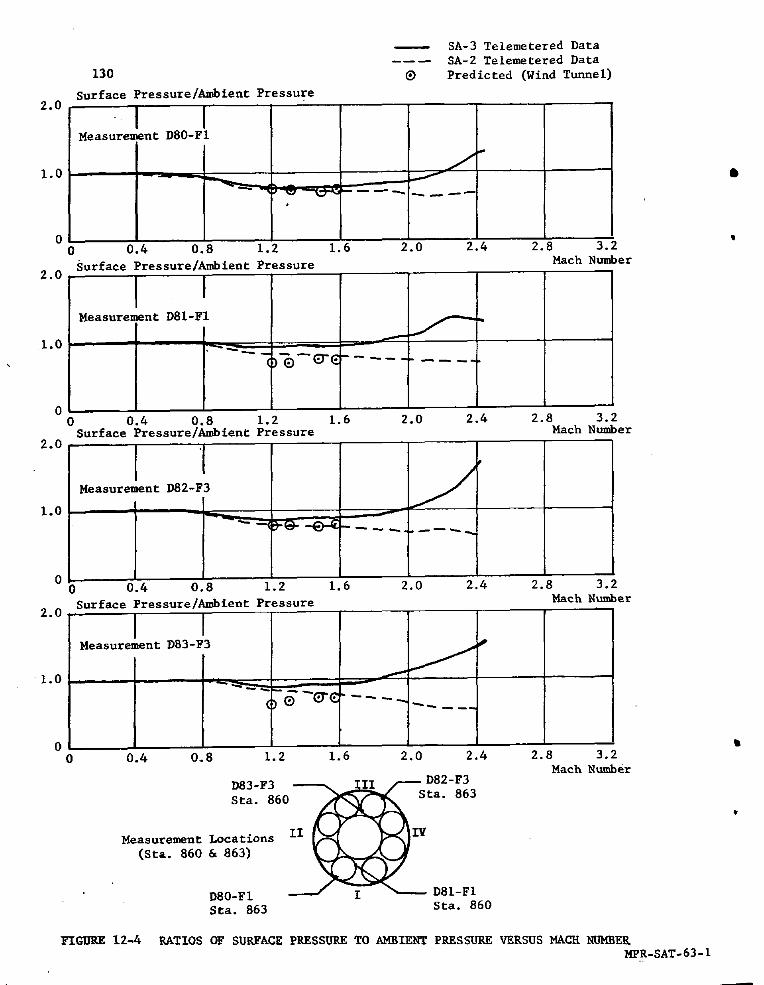
--- SA-3 Telemetered Data
SA-2 Telemetered Data
130 O Predicted (Wind Tunnel)lurface Pressure�Ambient Pressure
2.0 .
iMeasurement DSO-FI
0 Q0 0.4 0.8 i. 1.6 2.0 2.4 2.8 3.2
Surface Pressure/Ambient Pressure Mach Number2.0
Measurement D81-FI /.._.1,0 , -_
-
00 0.4 0.8 1.2 1. 2.0 2.4 2.8 3.2Surface Pressure/Ambient Pressure _ch Number
2.0
Measurement D82-F3 j1.0
00 0.4 0.I 1.2 1.6 2. 2.4 2. 3.2
Surface Pressure/A_ient Pressure Maeh Number2.0
Measurement DS3-F3 •
1.0 ..... _=_
0 •0 0.4 0.8 1.2 1.6 2.0 2.4 2.8 3.2
Math NumberD83-F3 _ _/IIl D82-F3
Sta. 860/__ Sta. 863%
Measurement Locations _
(Sta. 860 & 863)
DSO-FI I DSI-FISta. 863 Sta. 860
I_IGBEE12-4 RATIOS OF SURFACE PRESSURE TOAMBIENTPRESSUREVERSUSHACHNUM_EEMPR-SAT-63-1
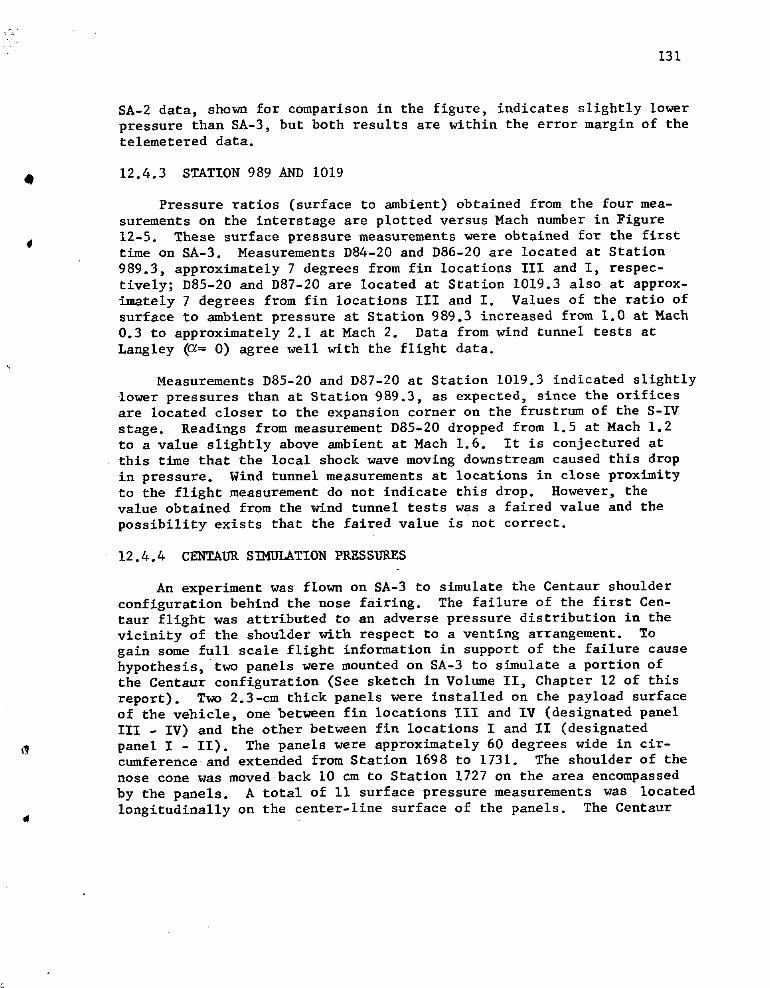
131
SA-2 data, shown for comparison in the figure, indicates slightly lower
pressure than SA-3, but both results are within the error margin of thetelemetered data.
Q 12.4.3 STATION 989 AND 1019
Pressure ratios (surface to ambient) obtained from the four mea-
surements on the interstage are plotted versus Mach number in Figure
12-5. These surface pressure measurements were obtained for the firsttime on SA-3. Measurements D84-20 and D86-20 are located at Station
989.3, approximately 7 degrees from fin locations Ill and I, respec-
tively; D85-20 and D87-20 are located at Station 1019.3 also at approx-
imately 7 degrees from fin locations III and I. Values of the ratio of
surface to ambient pressure at Station 989.3 increased from 1.0 at Mach
0.3 to approximately 2.1 at Mach 2. Data from wind tunnel tests at
Langley (6= 0) agree well with the flight data.
Measurements D85-20 and D87-20 at Station 1019.3 indicated slightly
lower pressures than at Station 989.3, as expected, since the orifices
are located closer to the expansion corner on the frustrum of the S-IV
stage. Readings from measurement D85-20 dropped from 1.5 at Mach 1.2to a value slightly above ambient at Mach 1.6. It is conjectured at
this time that the local shock wave moving downstream caused this drop
in pressure. Wind tunnel measurements at locations in close proximityto the flight measurement do not indicate this drop. However, thevalue obtained from the wind tunnel tests was a faired value and the
possibility exists that the faired value is not correct.
12.4.4 CENTAUR SIMULATION PRESSIrRES
An experiment was flown on SA-3 to simulate the Centaur shoulder
configuration behind the nose fairing. The failure of the first Cen-
taur flight was attributed to an adverse pressure distribution in the
vicinity of the shoulder with respect to a venting arrangement. To
gain some full scale flight information in support of the failure cause
hypothesis, two panels were mounted on SA-3 to simulate a portion ofthe Centaur configuration (See sketch in Volume II, Chapter 12 of this
report). Two 2.3-cm thick panels were installed on the payload surfaceof the vehicle, one between fin locations III and IV (designated panel
III - IV) and the other between fin locations I and II (designated
panel I - II). The panels were approximately 60 degrees wide in cir-cumference and extended from Station 1698 to 1731. The shoulder of the
nose cone was moved back I0 cm to Station 1727 on the area encompassed
by the panels. A total of ii surface pressure measurements was located
longitudinally on the center-line surface of the panels. The Centaur
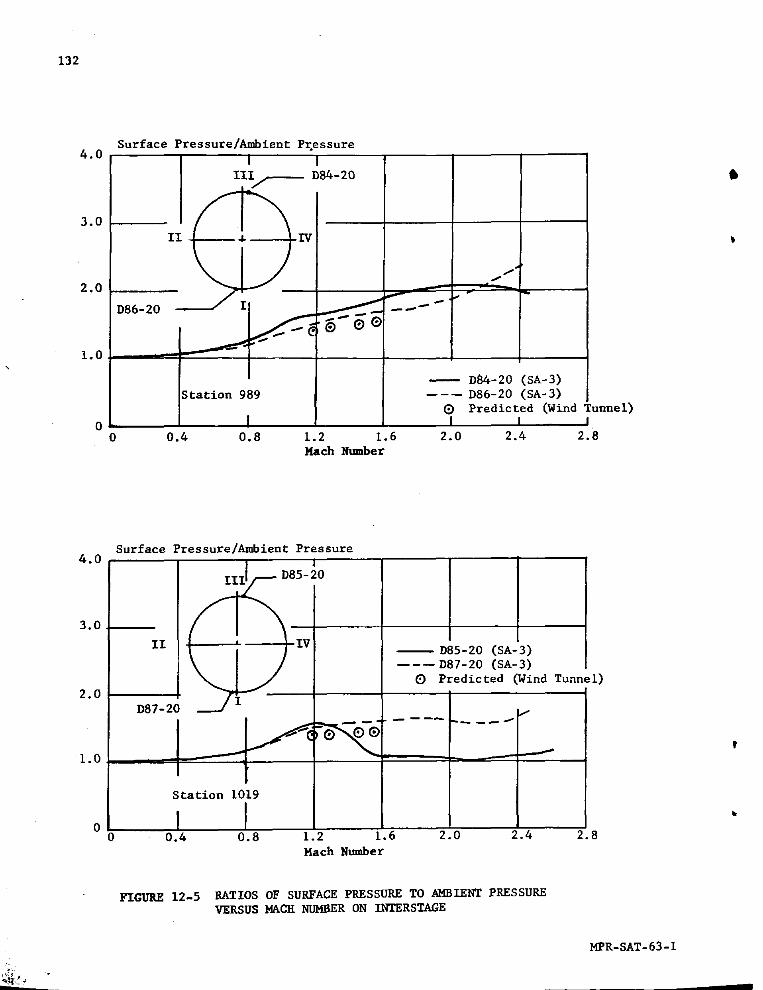
132
Surface Pressure/Ambient PKessure
4.O I i I
l III/ D_-20
3.0 ! __ --
I
1.0 1iI -- D84-20 (SA-3)
Station 989 ------ D86-20 (SA-3)
Predicted _ind Tunnel)
o I I J0 0.4 0.8 i. 1.6 2.0 2.4 2.8
_N_mber
Surface Pressure/Ambient Pressure4.0
II 5-20
3.0 __V
II -- D85-20 (SA-3)
m----D87_20 (SA-3)
O Predicted (Wind Tunn )2.0
D87-20 I
1.0
Station 1019
00 0.4 0.8 1.2 I. 2.0 2.4 2.8
Mach Number
FIGURE 12-5 RATIOS OF SURFACE PRESSURE TO AMBIENT PRESSUREVERSUS MACH NUMBER ON INTERSTAGE
MPR-SAT- 63- i

133
vented in an area similar to the base of the simulation panels installed
on SA-3. Base pressures were measured on each one of the panels during
the SA-3 flight.
4 Figure 12-6 is a representative plot of surface pressure coeffi-cients versus Mach number which were obtained from the six measurements
on panel Ill-IV. A configuration sketch and the location of each
measurement is also shown in the figure. The largest pressure coeffi-
cient occurred at Station 1726, 2.5 cm from the shoulder, where avalue of -1.74 was obtained at Mach 0.7.
Values of pressure coefficients at various Mach numbers are plot-
ted versus vehicle station in Figure 12-7. Results show excellent
agreement with wind tunnel results (Reference 4 ) on the Centaur shoul-
der configuration tests at Ames Research Center for the Mach numbers
available. The flight results indicate a very low pressure region
right behind the shoulder in the subsonic region.
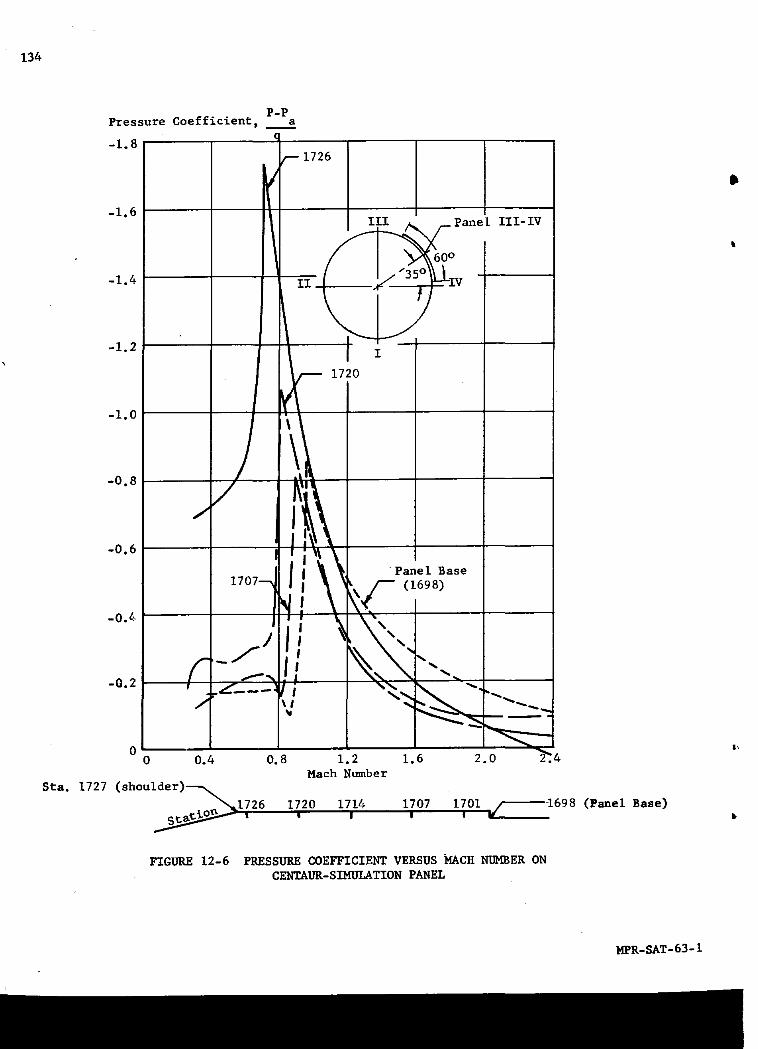
1..34
P-PPressure Coefficient _ a
-1.8
/---1726
1 '
.1._ t I i_ 1720
-1.0
/;!,I
o8 / /17o,_jl__
-0.6 I
I Panel Base
_! _C_*°_-0°4
r -/ _.'_'"-..2 , ._______.I, i .k. _ ..._ "
0 I,0 0.4 0.8 1.2 1.6 2.0
Mach Number
Sta. 1727 (shoulder)-__1726 1720 1714 1707 1701 /-----'--1698 (Panel Base)
1 i I I I •
9
FIGURE 12-6 PRESSURE COEFFICIENT VERSUS MACH NUMBER ONCENTAUR-SIMULATION PANEL
MPR-SAT-63-1
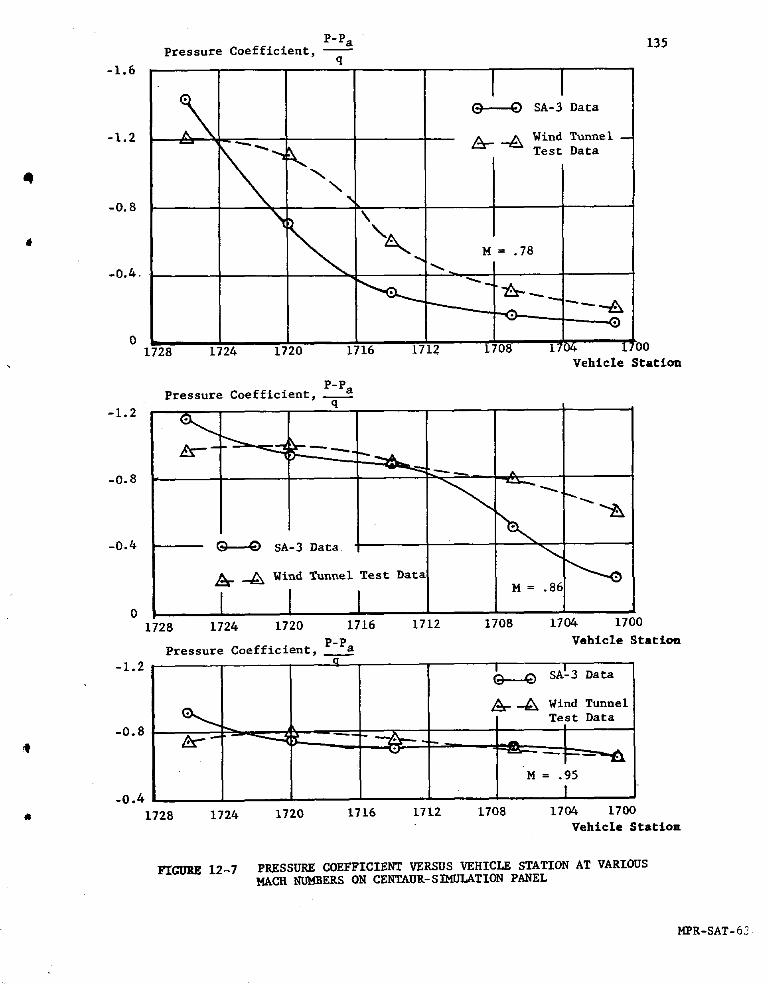
P'Pa 135Pressure Coefficient, --
q-1.6
k _ SA-3Data-1.2 _ Wind Tunnel --
_ TestData-0.8 _\
M = .78
-0.4. _
_ --_---__ .______0 ,
1728 1724 720 1716 1712 1708 17D4 i 00Vehicle Stati_
Pressure Coefficient, P-Paq
-1.2 _
-0.8 C" _ ^
-0.4 _ SA-3 Data•
___ Wind Tunnel Test Data M = .86
01728 1724 1720 1716 1712 1708 17_ 1700
Vehicle Stati_Pressure Coefficient, P-Pa
-1.2 q ISAL3 Data
___ Wind Tunnel
Test Data-0.8 _ I
M = .95
-0.4 I1728 1724 1720 1716 1712 1708 17_ 17_
Vehicle Station
FIGURE 12-7 PRESSURE COEFFICIENT VERSUS VEHICLE STATION AT VARIOUSMACH NUMBERS ON CENTAUR-SIMULATION PANEL
MPR-SAT- 62
136
13.0 (U) INSTRUMENTATION
13.1 SLU_dARY
Overall reliability of the SA-3 measuring system was 97.0 percent.
All commutators performed satisfactorily with no deviation from normal
operation. All preflight and inflight calibrations were normal.i
Transmitted RF power from all telemetry links was sufficient to
produce good data during the flight time of approximately 292 seconds.Indications are that the entire system performed _¢ithout significantfailure.
The signal strength of all RF systems, except C-Band Radar, was
very close to the expected values. Even though the C-Band Radar re-ceived a lower-than-normal signal, tracking information from this sys-
tem, the UDOP system, and the Azusa system was sufficient for good
trajectory information.
This flight has again proven the usefulness of redundant tracking
systems. As pointed out in section 13.4, some periods of flight exist
when data from one system may be insufficient to provide good tracking
information, but these periods may be filled using data from redundant
systems.
The engineering sequential camera coverage for the SA-3 flight
was comparable to that of SA-2.
13.2 MEASURING ANALYSIS
Measurement Malfunctions
There were 607 flight measurements made on the SA-3 vehicle. Of
these measurements, fourteen were found to be completely unusable, six
were partially usable, and one was questionable.
Two types of malfunctions occurred on the flight. First," there
were seven pressure transducers and one temperature measurement lostbecause of a malfunction in the power supply serving the direct measure-
ments in area five. Second, there were six other measurements in which
the measuring components had apparent failures.
The eight measurements that were lost because of measuring voltage
failure were: C69-5, Temperature Radiation Shield; D12-5, Pressure •Fuel Pump Inlet; D13-5, Pressure LOX Pump Inlet; D14-5, Pressure
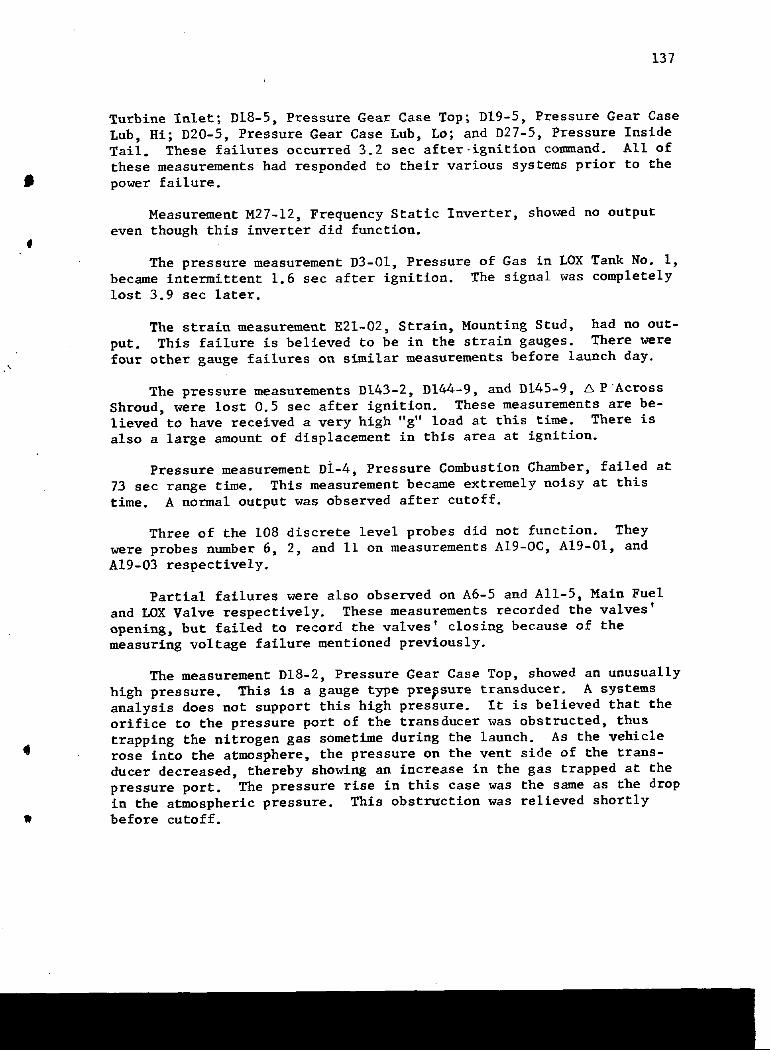
137
i
Turbine Inlet; D18-5, Pressure Gear Case Top; D19-5, Pressure Gear Case
Lub, Hi; D20-5, Pressure Gear Case Lub, Lo; and D27-5, Pressure InsideTail. These failures occurred 3.2 sec after-ignition command. All of
these measurements had responded to their various systems prior to the
power failure.
Measurement M27-12, Frequency Static Inverter, showed no output
even though this inverter did function.4
The pressure measurement D3-01, Pressure of Gas in LOX Tank No. i,became intermittent 1.6 sec after ignition. The signal was completely
lost 3.9 sec later.
The strain measurement E21-02, Strain, Mounting Stud, had no out-
put. This failure is believed to be in the strain gauges. There were
four other gauge failures on similar measurements before launch day.
The pressure measurements D143-2, D144-9, and D145-9, A P Across
Shroud, were lost 0.5 sec after ignition. These measurements are be-lieved to have received a very high "g" load at this time. There is
also a large amount of displacement in this area at ignition.
Pressure measurement DI-4, Pressure Combustion Chamber, failed at
73 sec range time. This measurement became extremely noisy at this
time. A normal output was observed after cutoff.
Three of the 108 discrete level probes did not function. They
were probes number 6, 2, and Ii on measurements AI9-OC, AI9-01, and
A19-03 respectively.
Partial failures were also observed on A6-5 and AII-5, Main Fuel
and LOX Valve respectively. These measurements recorded the valves'
opening, but failed to record the valves' closing because of themeasuring voltage failure mentioned previously.
The measurement D18-2, Pressure Gear Case Top, showed an unusually
high pressure. This is a gauge type pressure transducer. A systems
analysis does not support this high pressure. It is believed that theorifice to the pressure port of the transducer was obstructed, thus
trapping the nitrogen gas sometime during the launch. As the vehiclerose into the atmosphere, the pressure on the vent side of the trans-
ducer decreased, thereby showing an increase in the gas trapped at the
pressure port. The pressure rise in this case was the same as the drop
in the atmospheric pressure. This obstruction was relieved shortlyw before cutoff.
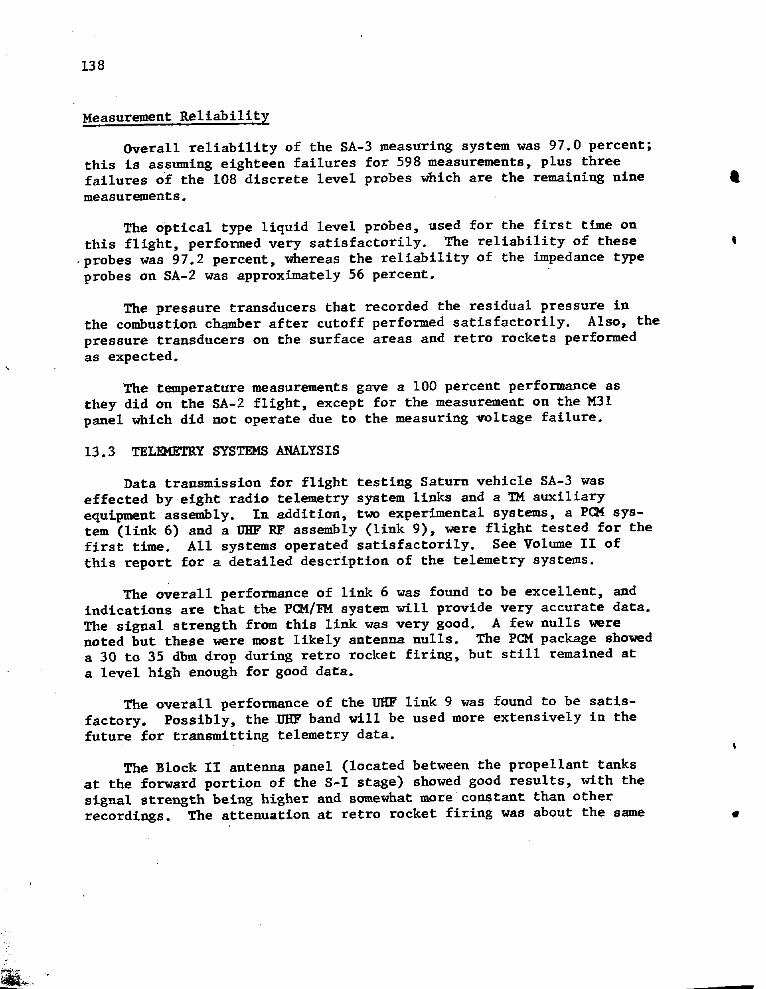
138
Measurement Reliability
Overall reliability of the SA-3 measuring system was 97.0 percent;
this is assuming eighteen failures for 598 measurements, plus threefailures of the 108 discrete level probes which are the remaining ninemeasurements.
The optical type liquid level probes, used for the first time on
this flight, performed very satisfactorily. The reliability of these
probes was 97.2 percent, whereas the reliability of the impedance type
probes on SA-2 was approximately 56 percent.
The pressure transducers that recorded the residual pressure inthe combustion chamber after cutoff performed satisfactorily. Also, the
pressure transducers on the surface areas and retro rockets performedas expected.
The temperature measurements gave a i00 percent performance as
they did on the SA-2 flight, except for the measurement on the M31
panel which did not operate due to the measuring voltage failure.
13.3 TELD_TRY SYSTEMS ANALYSIS
Data transmission for flight testing Saturn vehicle SA-3 was
effected by eight radio telemetry system links and a TM auxiliary
equipment assembly. In addition, t_o experimental systems, a PCM sys-tem (link 6) and a LrHF RF assembly (link 9), were flight tested for the
first time. All systems operate d satisfactorily. See Volume II of
this re?ort for a detailed description of the telemetry systems.
The overall performance of link 6 was found to be excellent, andindications are that the PCM/FM system will provide very accurate data.
The slgnal strength from this llnk was very good. A few nulls werenoted but these were most likely antenna nulls. The PCM package showed
a 30 to 35 dbm drop during retro rocket firing, but still remained at
a level high enough for good data.
The overall performance of the _ link 9 was found to be satis-
factory. Possibly, the l_IFband will be used more extensively in thefuture for transmitting telemetry data.
The Block II antenna panel (located between the propellant tanks
at the forward portion of the S-I stage) showed good results, with the
signal strength being higher and somewhat more constant than other
recordings. The attenuation at retro rocket firing was about the same •
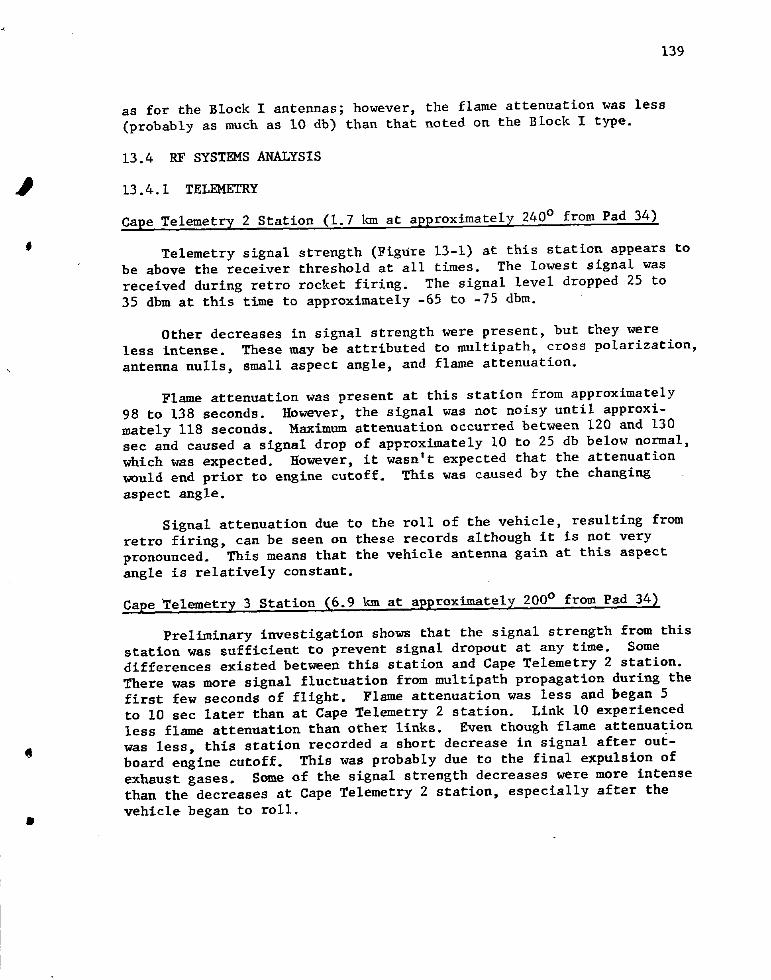
139
as for the Block I antennas; however, the flame attenuation was less
(probably as much as i0 db) than that noted on the Block I type.
13.4 RF SYSTEMS ANALYSIS
13.4.1 TELEMETRY
Cape Telemetr Z 2 Station (i. 7 km at approximatel Z 240 ° from Pad 34)
JTelemetry signal strength (Figure 13-i) at this station appears to
be above the receiver threshold at all times. The lowest signal was
received during retro rocket firing. The signal level dropped 25 to
35 dhm at this time to approximately -65 to -75 dbm.
Other decreases in signal strength were present, but they were
less intense. These may be attributed to multipath, cross polarization,
antenna nulls, small aspect angle, and flame attenuation.
Flame attenuation was present at this station from approximately
98 to 138 seconds. However, the signal was not noisy until approxi-
mately 118 seconds. Maximum attenuation occurred between 120 and 130
sec and caused a signal drop of approximately I0 to 25 db below normal,
which was expected. However, it wasn't expected that the attenuation
would end prior to engine cutoff. This was caused by the changing
aspect angle.
Signal attenuation due to the roll of the vehicle, resulting from
retro firing, can be seen on these records although it is not very
pronounced. This means that the vehicle antenna gain at this aspect
angle is relatively constant.
Cape Te_emetr_ 3 Station (6.9 km at 9pproximately 200 ° from Pad 34)
Preliminary investigation shows that the signal strength from this
station was sufficient to prevent signal dropout at any time. Some
differences existed between this station and Cape Telemetry 2 station.
There was more signal fluctuation from multipath propagation during the
first few seconds of flight. Flame attenuation was less and began 5
to I0 sec later than at Cape Telemetry 2 station. Link i0 experienced
less flame attenuation than other links. Even though flame attenuation
was less, this station recorded a short decrease in signal after out-board engine cutoff. This was probably due to the final expulsion of
exhaust gases. Some of the signal strength decreases were more intense
than the decreases at Cape Telemetry 2 station, especially after the
vehicle began to roll.
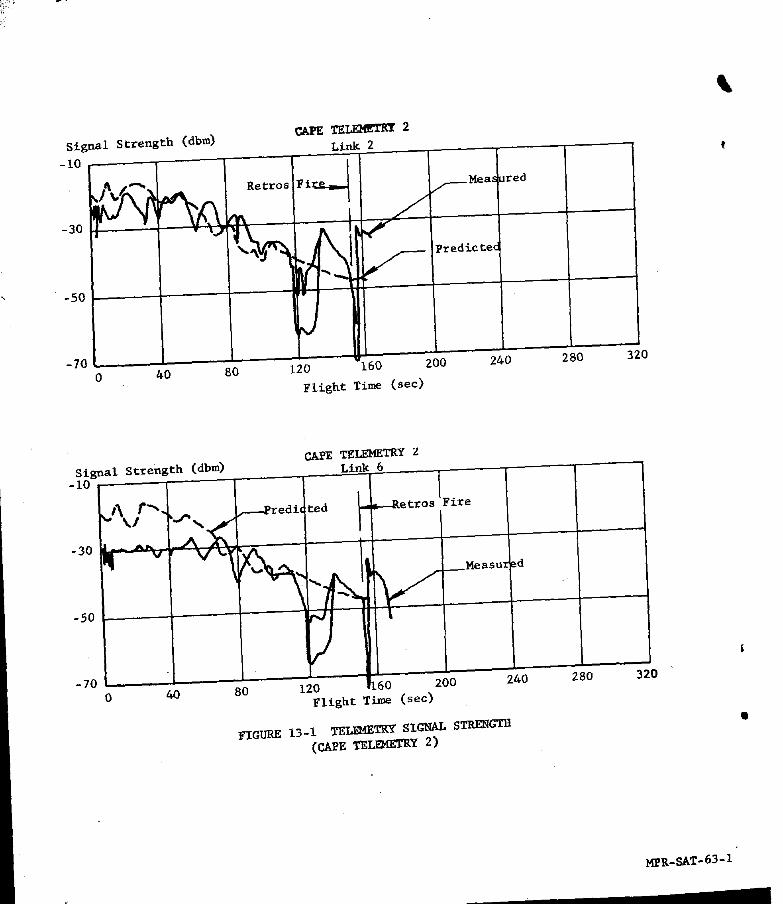
Signal Strength (dbm) CAPE TE_ 2
-10 Link 2!
_ Retros Fir..p=___ /----Mead_red
" -50 ,,
?-70 .,.
0 40 80 120 160 200 240 280 320
Flight Time (sec)
Signal Strength (dbm) CAPE TELEMETRY 2-i0 Link 6
........
_l_kf'_" _---Predi,lied - a---Retros Fire
.30 a__ _ _ _''_
V V _ _ " .... ,Measur .d I l I I
r,/ i
/-70
0 40 80 120 L60 200 26.0 280 320
Flight Time (see)
Ir_&_I_ 13-1 _TRY SI&_L STI_N_ra •
(CAPE _ 2)
MPR-SAT- 63 -i
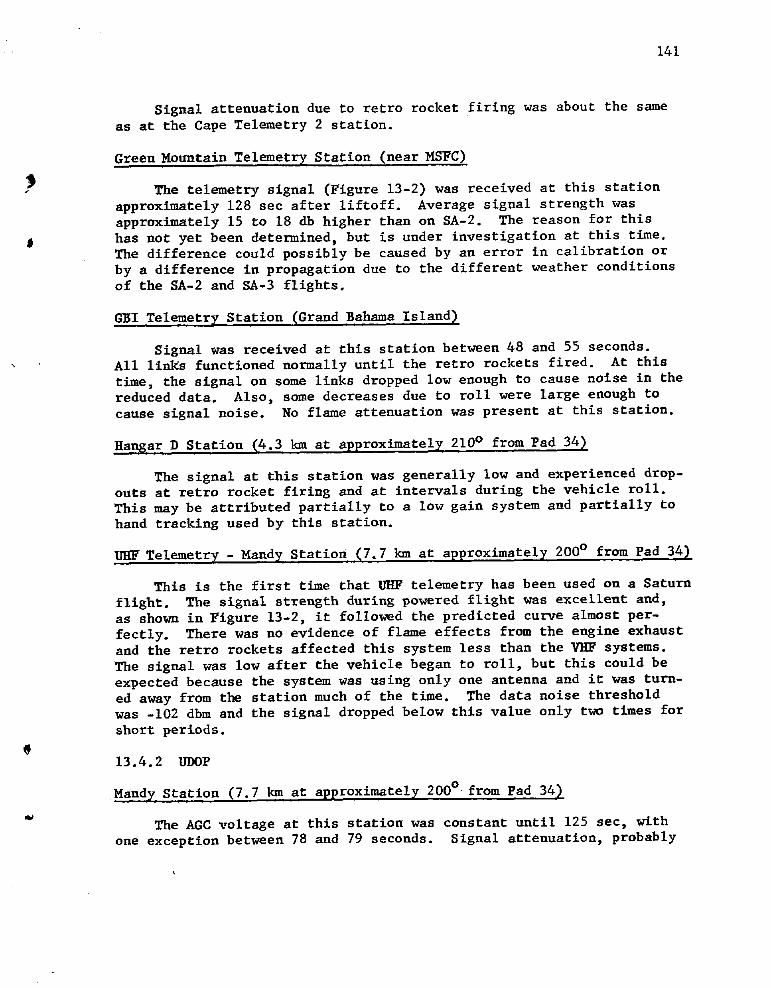
141
Signal attenuation due to retro rocket firing was about the same
as at the Cape Telemetry 2 station.
Green Mountain Telemetry Station (near MSFC)
The telemetry signal (Figure 13-2) was received at this station
approximately 128 sec after liftoff. Average signal strength was
approximately 15 to 18 db higher than on SA-2. The reason for this
0 has not yet been determined, but is under investigation at this time.The difference could possibly be caused by an error in calibration or
by a difference in propagation due to the different weather conditions
of the SA-2 and SA-3 flights.
G_I Telemetry Station (Grand Bahama Island)
Signal was received at this station between 48 and 55 seconds.
All links functioned normally until the retro rockets fired. At this
time, the signal on some links dropped low enough to cause noise in the
reduced data. Also, some decreases due to roll were large enough to
cause signal noise. No flame attenuation was present at this station.
w--gar D Station (4.3 km at approximately 210 ° from Pad 34_
The signal at this station was generally low and experienced drop-
outs at retro rocket firing and at intervals during the vehicle roll.
This may be attributed partially to a low gain system and partially to
hand tracking used by this station.
UHFTel_m_tr 7 - Mandy Station (7.7 km at approximately 200 ° from Pad 34_
This is the first time that t_qF telemetry has been used on a Saturn
flight. The signal strength during powered flight was excellent and,
as shown in Figure 13-2, it followed the predicted curve almost per-
fectly. There was no evidence of flame effects from the engine exhaustand the retro rockets affected this system less than the V_IF systems.
The signal was low after the vehicle began to roll, but this could be
expected because the system was using only one antenna and it was turn-
ed away from the station much of the time. The data noise thresholdwas -102 dbm and the signal dropped below this value only t_a_ times for
short periods.
13.4.2 UDOP
Mandy Station (7.7 km at approximately 200 ° from Pad 34)
The AGC voltage at this station was constant until 125 sec, with
one exception between 78 and 79 seconds. Signal attenuation, probably
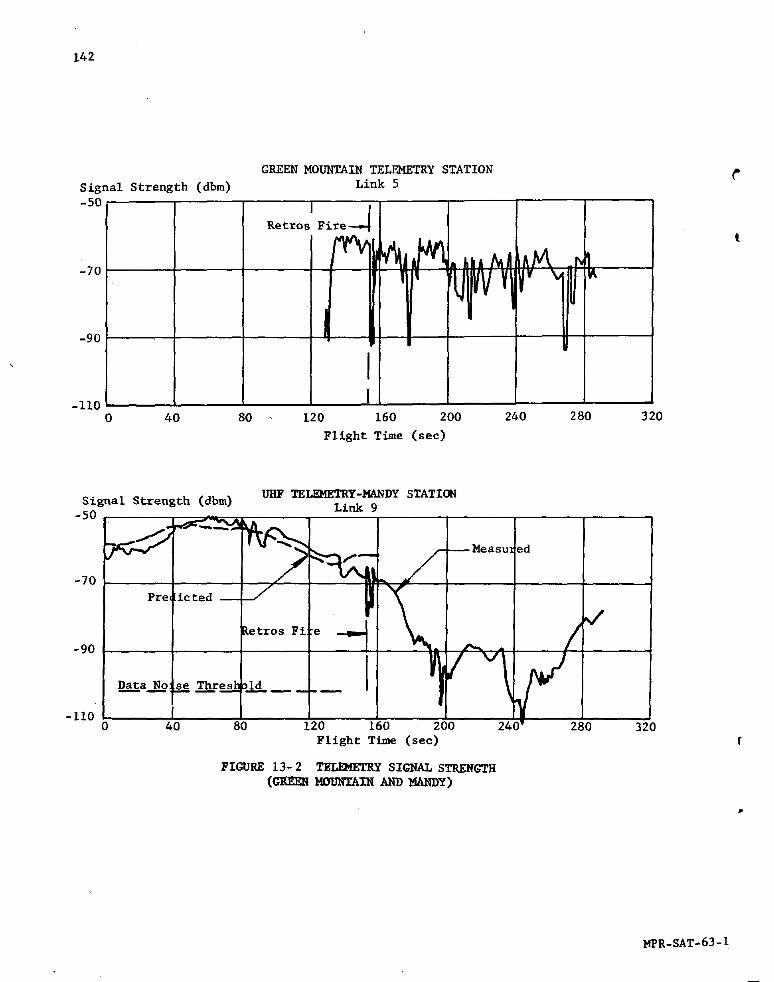
142
GREEN MOUNTAIN TELEMETRY STATION
Signal Strength (dbm) Link 5-50
RetroslFire_!
-9o i i U
I-Ii0
40 80 120 160 200 240 280 320
Flight Time (sec)
UHF TELEMETRY-NANDY STATIONSignal Strength (dbm) Link
-50
-70 _ /--Measuzed
Pre icted --_/
JRetros Fie _ /
-90 - FV- 1
-no i0 40 80 120 160 200 240 280 320
Flight Time (sec) [
FIGURE 13- 2 TELEMETRY SIGNAL STRENGTH
(_mm _mm_ ANDm_mY)
MPR-SAT- 63-1

143
caused by flame, began at approximately 125 sec and continued untilinboard engine cutoff. Maximum attenuation (12 to 15 dbm below normal)
occurred between 125 and 133 seconds. Retro rocket firing produced a
signal attenuation of approximately 25 dbm for their duration.
Signal variation occurred between retro rocket firing and destruct,
caused by nulls in the antenna pattern as the vehicle rolled.
0 Signal was received until 465 sec after liftoff, but it was noisyand attenuated after destruct.
Tango Station (Titusville - Cocoa Airport_ 22.9 km at 270 ° from Pad 34)
Average s_gnal strength was higher than preliminary predictions
(see Figure 13a3). Some signal attenuation was experienced due to
antenna nulls, especially after the vehicle began to roll.
Retro rocket firing produced an attenuation of i0 to 15 db below
the average signal. No flame attenuation was experienced at this
station. Signal was received until approximately 464 sec after lift-
off, but it was very noisy and attenuated after destructf
Other Stations
AGC records were received from several other stations, including
the Green Mountain Station. They all compared favorably with Tango
and Mandy records. The signal strength from Metro Station (Merritt
Island Airport, 23.4 km at approximately 214 ° from Pad 34) is presented
in Figure 13-3.
13.4.3 AZUSA
Records from the MK II station (12.4 km at approximately 194° from
Pad 34) indicate that the system operated as expected for the first160 to 170 seconds. The signal (see Figure 13-4_ was fluctuating be-tween 5 and 12 db for the first 80 seconds. The Azusa signal normally
fluctuates due to multipath propagation and antenna lobing for the
first part of the flight. These effects lasted longer than on previousflights because of the slower liftoff velocity of the vehicle. How-
ever, the signal remained above -95 dbm, which meets the range datacommitments. From l60 sec to destruct_ the signal was attenuated as much
as 35 to 40 dbm at times. This is probably due to the roll of the
vehicle, since the system has only one antenna. However, records in-dicate that the MK II system was passive from 160 until 220 sec, and
from 225 until 270 sec, while the MK I station was tracking. The
signal was attenuated most during these periods.

144
Signal Strength (dbm) TANGO STATION
, i ,-- Predic£ed - _- Retros Fire
-ii00 40 80 120 160 200 240 280 320
Flight Time (see)
Signal Strength (dbm) METRO STATION
-50 i
Predicted I
/'/_j_ ,_"-J_ #"_-_ -_ !_ _" Retros IFire
-'° xl _gr_e_ed _'V 7-90
-ii040 80 120 160 200 240 280 320 L
Flight Time (see)
FIGURE 13-3 UDOP SIGNAL STRENGTHJ
MPR-SAT- 63-1
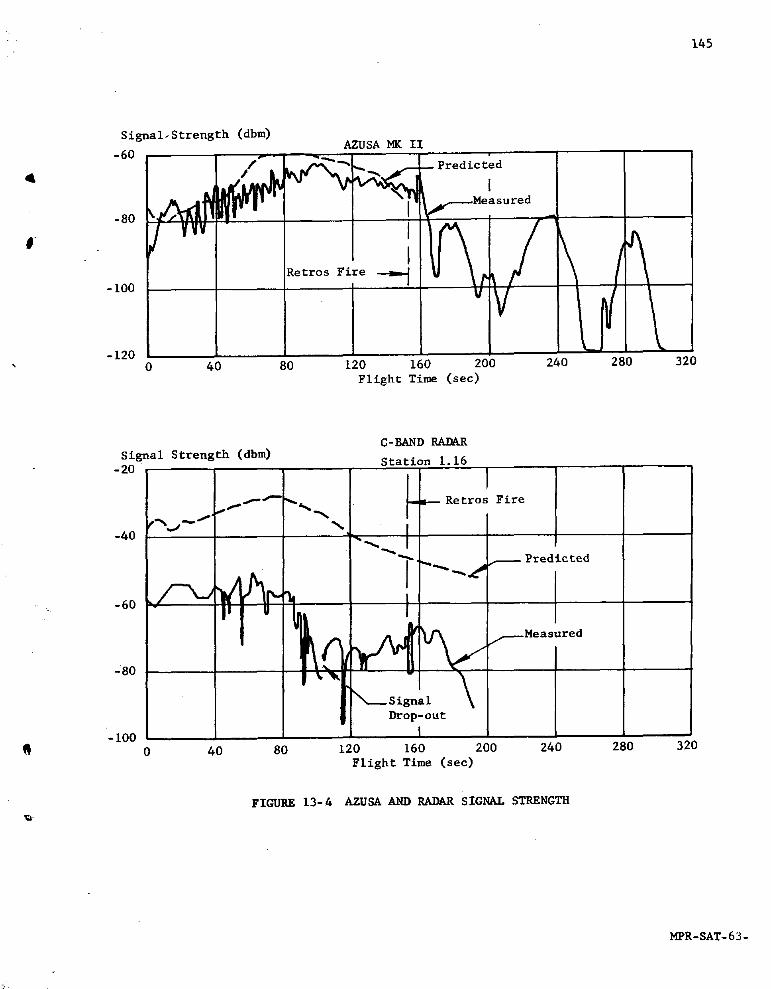
145
Signal- Strength (dbm)AZUSA MK II
-60 ----7"-- ,--_---_ _. j__ Predicted
-80 _ sured0
-I00 Retros Fi_-1200 40 80 120 160 200 240 280 320
Flight Time (sec)
C-BAND RADAR
Signal Strength (dbm) Station 1.16-20
.._'- "_ --m---Retros Fire
[_40
.--- Predicted
00
_- Signa 1Drop-out
- 1oo I0 40 80 120 160 200 240 280 320
Flight Time (see)
FIGURE 13-4 AZUSA AND RADAR SIGNAL STRENGTH
MPR-SAT- 63-
146
13.4.4 C-BAND RADAR
Station 1.16 (4.7 km at approximately 199° from P_d 34)
Prior to liftoff, it was noticed that the C-Band Beacon was fre- •
quency moding and giving a double pulse output. This was causingerratic range lock-on, so the receiver was detuned to get a single
narrow pulse. This detuning caused a lower signal level than would
normally be received at this station, but it was felt that it was ade-
quate because skin tracking could be used if the beacon proved to be
inadequate. The signal strength from this station is shown in Figure13-4.
Automatic beacon tracking was acquired at liftoff and used for 92
seconds. The signal followed a smooth pattern during this time, but
, was 20 to 30 dbm lower than predictions. Records show that the signal
began decreasing at about 85 see; then, the system began hunting atabout 91 sec and was switched to automatic skin tracking from 92 to 103
seconds. Beacon tracking was used from 103 until 196.5 seconds. Dur-
ing this time, the signal-to-noise ratio was 20 to 30 db which is suf-
ficient for high accuracy tracking. Some noise was present between 115
and 132 sec which may be caused by flame, but it wasn't enough to cause
concern. However, retro rocket firing caused disturbances of I0 to 15 dbwhich drove the signal-to-noise ratio down to 12 to 15 db. This dis-
turbance probably would have been insignificant if the signal level hadbeen normal.
After retro rocket firing, the signal dropped below the noise levelat about 194 sec and the system was switched to skin tracking from 197
to 202 seconds. This happened again around 235 sec and the system was
switched to automatic skin tracking from 241 sec until destruct. After
destruct, this station tracked pieces of the Vehicle and the cloud
formed by Project Highwater.
Station 0.16 (Patrick AFB_ 32.9 l_m south of Pad 34)
This station used the MK 51 optical tracking system until T+22 sec,at which time it switched to automatic beacon tracking. AGC at the
ground station appears normal for the first 53 seconds. After this, it
has a 2 to 3 dh jitter for the remainder of the flight. Records show
that this station also had trouble with narrow pulse width, double lpulsing, and countdown from the beacon. It apparently hadn't prepared
for this by detuning its beacon as station 1.16 had done and therefore
experienced more difficulty.

147
This station lost track three times during the flight. The first
time was at 140 sec and may have been a combination of poor beacon
response and flame attenuation. The other two times were after theretro rockets had fired and may have been caused by roll. The system
4 switched back and forth between automatic beacon tracking and automatic
skin tracking from 140 to 187 sec and ended up using automatic skin
tracking from 187 sec until destruct. It tracked the water cloud afterdestruct.
l
GBI Station (Grand Bahama Island)
The signal was received at GBI 65 sec after liftoff. It experi-enced the same trouble as the other stations. No flame attenuation
was present at this station, but retro rocket firing caused a signal
attenuation of approximately 5 db.
Even though response was below normal, this station was able to
track the beacon all the way, except for one period between 192 and228 seconds.
14814.0 (C) SUMMARY OF MALFUNCTIONS AND DEVIATIONS
The flight test of Saturn SA-3 did not reveal any malfunctions'or
deviations which could be considered a serious system failure or design b
deficiency. However, a number of minor deviations did occur and are
summarized here for documentary purposes.
_orrective measures were recommended by the divisions for some of lthe items listed. These are marked with an asterisk. Each item islisted in the area where the malfunction occurred.
Launch Operations:
i. A ground generator power failure caused a 45-minute hold at
T-75 minutes (Section 3.4).
2. The digital output computer for the sequence records malfunc-
tioned (Section 3.4).
3. The "Support Retract Pressure OK" switches cycled several times
about 500 ms after all engines were running (Section 3.5).
4. A measuring error indicated that the LOX bubbling valve stayed
open for 137 sec instead of the expected 60 seconds (Section3.5).
5. The I_X fill mast failed to retract on command (Section 3.6).*
Trajectory:
6. The burning time for SA-3 was 1.3 sec longer than expected
(Section 4.3.1).
7. Cross range displacement was to the left of nominal due to a
difference in alignment between the platform and vehicle, and
also due to winds (Section 4.3.1).
Propulsion:
8. The vehicle specific impulse was i.i_ higher than predicted
(Section 5.3).
9. The gear case pressure measurement on engine position 2 ex-
ceeded its limits (Section 5.2). .
__ 149
I0. The retro rockets were misaligned,causing a vehicle roll mo-
tion (Section 5.7).*
• Ii. The pressure drop across the orifices between the center and
outboard LOX tanks was 0.09 kg/cm 2 (1.3 psi) lower than pre-
dicted at IECO (Section 5.4.2).
# Control:
12. An error in the tilt cam resulted in a maximum tilt angle of
44.28 deg at tilt arrest as compared to the desired angle of
44 degrees (Section 7.2.1).*
13. A clockwise roll moment of 1553 kg-m was observed at IECO
(Section 7.2.3).%
14. Increased sloshing was observed in LOX tank 04 comnared to
that on the SA-2 flight. A maximum sloshing amplitude of
24-cm was observed in pitch on SA-3, as compared to I0 cm on
SA-2 (Section 7.4).
Guidance:
15. Erroneous outputs from the cross range accelerometer system
on the ST-124P platform were observed (Section 8.3.3).
16. The ST-124P platform was not aligned in azimuth and the re-
solver chain was not trimmed (Sections 8.3.3 and 8.4.3).*
17. A failure due to an open circuit in one buffer amplifier stage
of the ST-124P guidance signal processor repeater was encoun-
tered (Section 8.4.2).
18. A disturbance was observed in the signal processor between
113 and 125 seconds (Section 8.4.2).
Electrical System:
19. Number 5 measuring supply voltage failed prior to liftoff
0 (Section 9.2).*
Structures:
20. A high vibration level was observed on the fuel suction line,
longitudinal; measurement E45-8 (Section 10.5.3).
.... _rC-. .
150
21. Systematic transients were observed in eight measurements
(Sections 10.5.3 and 10.6).
Environmental Temperatures and Pressures: •
22. Total calorimeter measurement (C77-5)indicated losses twice
as great as previously noted (Section 11.2.1.3).
23. _eating rate on the S-IV skin was twice as much as would bepredicted by theory (Section 11.3).
24. Flame shield pressure was unusual (Section 11.2.1.1).
25. Base pressure on the heat shield had a higher gradient than
previous flights (Section 11.2.1.1).
Instrumentation:
26. Fourteen measurements were unusable, six were partially usable,and one was questionable (Section 13.2).
27. The C-Band Radar signal strength was lower than predicted
(Section 13.4.4).

151
15.0 (U) SPECIAL MISSIONS
15.1 PROJECT HIG}IWATER
• A water cloud experiment (similar to the experiment conducted on
SA-2) was accomplished successfully on SA-3. At 292 sec range time
the upper stages' water ballasts were ruptured with primacord, injec-
ting 86.7 m3 (22,900 gal) of water into the upper atmosphere. At the
# time of Project Highwater, the vehicle was at an altitude of 167.22 km
(0.45 km higher than predicted) and at a range of 211.41 km (B.76 km
above predicted),
The Saturn water release experiment was conducted on the SA-3
flight in order to compare the cloud formation with that observed on
the SA-2 experiment, to investigate the effects of perturbing the
ionosphere by the release of 86.7 m3 (22,900 gal) of water and to moni-
tor the ionosphere's return to an equilibri_n state, and to passively
monitor radio noise through a frequency range from 300 cps to 400 mega-
cycles.
Film from the long range camera at Vero Beach showed that the S-Ibooster remained intact after destruct of the upper dummy stages. The
tumbling motion of the booster was observed for an extended time. Afew booster measurements continued to be transmitted on telemetry.
Telemetry signals on links 3, 4, and 8 were temporarily lost after
Highwater, but were regained between 335 and 360 sec and continued un-til after 400 seconds. Link 7 telemetry signals were not lost until
420 see; whereas, link 6 (PCM) continued to transmit until approximate-
• ly 600 seconds. It is questionable however, if any of the data would
represent reliable measurements. The booster was out of camera range
when breakup occurred. Figure 15-1 presents camera coverage during
various periods of Project Highwater.
15.2 HORIZON SCANNER
Useable data from the horizon scanner were obtained between i00
and 130 sec range time. The data during this period were within T 5
deg of expected values. Data in other portions of the flight wereerratic and unusable. No data was expected until i00 sec; however, the
data should have continued to be useable until retro fire at 153.6
seconds.
15.3 OTHER SPEClAL MISSIONS
In addition to Project Highwater and the horizon scanner output,
a number of special missions were flown as tests on SA-3. The results
152
of these tests have been discussed in detail in the preceding chapters
of this report. The following table lists the section in which special
mission results are discussed:
Reference Section •
a. M-31 Heat Shield Panel (Block IT Type) 11.2.1.3
b. LOX Depletion 5.2
c. Full Propellant. Loading 5.4d. Block II Antenna Panel 13.3
e. Passenger ST-124P 8.2.2
f. PC_Telemetry 13.3
g. Centaur Pressure Study 12.4.4
h. S-IV Stage Temperature & Pressure Meas. 11.3i. Block II Swing Arm 3.6
j. Retro Rockets 5.7
J

153
4
Burst +0.02 Seconds Burst +0.06 Seconds
Burst +0.13 Seconds Burst +0.19 Seconds
FIGURE 15-1 PICTURE SEQUENCE OF PROJECT HIGHWATER EXPERIMENT
MPR-SAT- 63-I
154
(u) ' m CES
I. M-AER0-PO-3-62; "Saturn C-I Vehicle SA-3 Test Flight: TrajectoryCorridor To Be Flown By SA-3" (U); by Hardage, O. M.; dated
November 2, 1962.
2. MPR-SAT-WF-61-8; "Saturn SA-I Flight Evaluation" (C); by Saturn
Flight Evaluation Working Group; dated December 14, 1961.
3. MPR-SAT-WF-62-5; "Saturn SA-2 Flight Evaluation" (C); by Saturn
Flight Evaluation Working Group; dated June 5, 1962.
4. NASA TM X-503; "Steady and Fluctuating Pressures At Transonic
Speeds On Two Space Vehicle Payload Sha_es" (C); by Coe, C. F.;dated March 1961.
J

155
(U) APPROVAL
4 SATURN SA-3 FLIGHT EVALUATION
Fridtjof A. Speer
Chairman, Saturn Flight Evaluation Working Group
H. Lange
Director, Saturn Systems Office
156
SA-3 FLIGHT EVALUATION REPORT
(U) DISTRIBUTION
Dr. yon Braun, M-DIE Mr Boehm, M-ASTR-M
Dr. Rees, M-DEP-R&D Mr Hosenthien, M-ASTR-F
Mr. Gorman, M-DEP-AEM Mr Blaekstone, M-ASTR-FF
Mr Mandel, M-ASTR-G (M-AERO Mr Hoberg, M-ASTR-I
Dr. Geissler, M-AERO-DIR Mr Bell, M-ASTR-IM
Mr. Jean, M-AER0-PS (4) Mr Moore, M-ASTR-N
Mr. Dahm, M-AERO-A (2) Mr McMahen, M-ASTR-NT (5)Mr. Vaughan, M-AERO-G (3)
Mr. Ryan, M-AERO-D M-LVOD
Mr. Holderer, M-AERO-E Dr. Gruene, M-LVO-DIR
Dr. Speer, M-AERO-F (25) Mr. Zeiler, M-LVO-M (3)Dr. }loelker, M-AERO-P Mr. Sendler, M-LVO-E (4)
Mr. R. Cummings, M-AERO-TS Mr. Collins, M-LVO-EP
Mr. D. Douglas, M-AERO-TSM-REL
Mr.-----_chulze,M-REL (3)M-L&M
Mr. Hueter, M-L&M-DIR (2) M-___40A___LMr Grau, M-QUAL-DIR
M-COMP Mr Klauss, M-QUAL-TS
Dr. Hoelzer, M-COMP-DIR Mr Wittmann, M-QUAL-EMr. Fortenberry, M-C(_fP-A Mr Urbanski, M-QUAL-M
Mr. Moore, M-COMP-R Mr Brooks, M-QUAL-P
Mr. Shaver, M-COMP-S Mr Peck, M-QUAL-PSMr Smith, M-QUAL-Q
M-ME
Mr. Kuers, M-ME-DIE M-lIP
Mr, Groth, M-ME-TS (4) Dr. Stuhlinger, M-Rl_-DIRMr. Miles, Jr., M-RP-R
M-FP0 Dr. Shelton, M-RP-N
Mr.----_oelle,M-FPO-DIR (2) Dr. Lundquist, M-RP-P
Mr. Weaver, M-FPO Dr. Heller, M-RP-TMr. Thompson, M-RP-I
M-ASTR
Dr. Haeussermann, M-ASTR-DIR M-SAT !
Mr. Noel, M-ASTR-TSJ Dr. Lange, M-SAT-DIR
Mr. Wagnon, M-ASTR-TSR Dr. Kuettner, M-SAT-AP
Mr. Digesu, M-ASTR-A Mr. Vreuls, M-SAT (5)
Mr. Taylor, M-ASTR-R Mr. D. R. Bowden, M-SAT-SII (Downey) 4PMr. Fiehtner, M-ASTR-E
Mr. Baggs -Mr. Stroud, M-ASTR-E M-HDr. Rudolf, M-HME-DIR
157
M-P&VE
Mr. Mrazek, M-P&FE-DIR M-PAT
Mr. Wiedner, M-P&VE-DIR Mr. Warden, M-PAT
Mr. Burrows, M-P&VE-REL4Mr. Palaora, M-P&VE-V M-MICH
Mr. Glover, M-P&VE-VA (2) Mr. Robert L. Riemer, M-MICH-OA
Mr. Stein, M-P&VE-VE Dr. Constan, M-MICH
# Mr. Rothe, M-P&VE-VGMr. Barraza, M-P&VE-VK LO
Mr. Seymour, M-P&VE-OH (2) Dr. Debus, LO-DIRMr. Schulze, M-P&VE-E (2) Dr. Knothe, LO-TS
Mr. Hurber, M-P&VE-EA Col. Bidgood, LO-F
Mr. Kistler, M-P&VE-EF Major Petrone, LO-H (3)
Mr. Hoffman, M-P&VE-ES Mr. Poppel, LO-D
Mr. Shramm, M-P&VE-F Mr. Darby, LO-DHE
, Mr. Lucas, M-P&VE-M Mr. Body, LO-DSMr. Fellows, M-P&VE-NP (4)
Mr. Paul, M-P&VE-P (2)
Mr. Thompson, M-P&VE-PA
Mr. Reed, M-P&VE-PL
Mr. Furman, M-P&VE-PM
Mr. Wood, M-P&VE-PT
Mr. Connell, M-P&VE-PH
Mr. Heusinger, M-P&VE-PP (3)
Mr. Kroll, M-P&VE-S
Mr. Hunt, M-P&VE-SMr. Verble, M-P&VE-SB
Mr. Farrow, M-P&VE-ST (4)
Mr. Sterett, M-P&VE-SS
Mr. Showers, M-P&VE-SL
M-TPC
Mr. Smith, M-TPC
M-TEST
Mr. Heimburg, M-TEST-DIR
Mr. Auter, M-TEST-EMr. Sieber, M-TEST-M
Mr. Thornton, M-TEST-MC
I_ Mr. Driscoll, M-TEST-TMr. Tessmann, M-TEST-C
M-MS
M-MS-IPL (8)
M-MS-IP(4)

158
DISTRIBUTION (CONT ')
EXTERNAL
Headquarters, National Aeronautics & Space Adminstration
Washington 25, D. C.
Offices of Space SciencesDirector: Mr. H. E. Newell
Office of Manned Space FlightDirector of Launch Vehicles and Propulsion
Mr. Milton W. Rosen (4)
Douglas Aircraft Company, Inc.
Missile and Space Systems Engineering
Santa Monica, CaliforniaAttn: H.M. Thomas
A. J. German (5)
The Boeing CompanyHIC Bldg.
Attn: A. H. Phillips
North American Aviation
Space & Information Division Systems12214 Lakewood Boulevard
Downey, CaliforniaAttn: A. Shimizu
Rocketdyne
6633 Canogo Avenue
Canogo Park, CaliforniaAttn: O. I. Thorsen
Chrysler Space Division
Michoud OperationsAttn: B. Heinrich