saudi arabia investigation report - usgs · relation between pj3 and acid-insoluble contents of...
TRANSCRIPT

~ , * >-^ w '
UNITED STATESDEPARTMENT OF THE INTERIOR
U.S. GEOLOGICAL SURVEY
Saudi Arabia Investigation Report (IR) SA-112
GEOLOGY OF PHOSPHATE DEPOSITS IN THE . SIRHAN-TURAYF BASIN, KINGDOM OF SAUDI ARABIA
by
Charles R. Meissner, Jr. U.S. Geological Survey
and
Abdullah Ankary Directorale General of Mineral Resources
to-1 TVDRY BENEFiqATION OF PHOSPHATE ORE FROM WEST THANIYAT. SAUDI ARABIA
by
Tennessee Valley Authority
U.S. Geological SurveyOPEN FILE REPORT
This report is preliminary and has not been edited or reviewed "for conformity with Geological Survey standards or nomenclature*
1970
JUL301970DENVER

PREFACE
In 1963, in response to a request from the Ministry of Petroleum
and Mineral Reaourcaa, the Saudi Arabian Government and the U. S.
Geological Survey, U. S. Department of the Interior, with the approval
of the U. S. Department of State, undertook a joint and cooperative
effort to map and evaluate the mineral potential of central and western
Saudi Arabia. The reaulta of this program are being released in USGS
open files in the United States and are also available in the Library
of the Ministry of Petroleum and Mineral Resources. Also on open file
in that office is a large amount of material, in the form of unpublished
manuscripts, maps, field notes, drill logs, annotated aerial photo
graphs, etc., that has resulted from other previous geologic work by
Saudi Arabian government agencies. The Government of Saudi Arabia
makes thit information available to interested persons, and has set
up a liberal mining code which is included in "Mineral Resources of
Saudi Arabia, a Guide for Investment and Development," published in
1965 as Bulletin 1 of the Ministry of Petroleum and Mineral Resources,
Directorate General of Mineral Resources, Jiddah, Saudi Arabia.
GEOLOGY OF PHOSPHATE DEPOSITS IN THESIRHAN-TURAYF BASIN,
KINGDOM OF SAUDI ARABIA
by
Charles R. Meissner, Jr.
and
Abdullah Ankary
DRY BENEFICIATION OF PHOSPHATE ORE FROM WEST THANIYAT, SAUDI ARABIA
by
Tennessee Valley Authority

CONTENTS
ABSTRACT.................................*................. 1
INTRODUCTION. .............................................. 3
Purpose and scope of the report... .................... 3
Location and extent of the area. ...................... 3
History of discovery. ................................. &
Acknowledgements. ..................................... ?
GEOLOGIC SETTING. .......................................... 8
STRATIGRAPHY. .............................................. 11
Aruma Formation. ...................................... 12
Hibr Formation. ....................................... 16
Lower member. .................................... 17
Phosphate mamber. ................................ 22
Upper member. .................................... 24
STRUCTURE. ................................................. 25
PHOSPHATE DEPOSITS. . ....................................... 28
Thaniyat phosphate deposits (West Thaniyat) ........... 28
Turayf phosphate deposits ............................. 36
COMPOSITION AND MINERALOGY OF THE PHOSPHATE. ............... 50
West Thaniyat area. ................................... 50
Turayf area. .......................................... 57

CONTENTS (Cont'd).
Page
DRY BENEFICIATION OF PHOSPHATE ORE FROM WEST THANIYAT by
Tennessee Valley Authority.............................. 64
Summary............................................... 75
Appendix.............................................. 76
ILLUSTRATIONS
Plate 1. Generalized geologic map of the Sirhan-Turayf basin showing the location . of the Turayf and Thaniyat phosphate areas.................................Back pocket
2. Geologic map of part of the Thaniyat phosphate area. 11 "
3. Geologic map of the Turayf phosphate area......... .^*' "
Figure 1. Index map of western Saudi Arabia showing thelocation of the Turayf and Thaniyat phosphate areas.......................................... 4
2. Cross sections of the Sirhan-Turayf basin..........13
3. Generalized section of strata in the Turayfphosphate area..................................18
4. Stratigraphic correlation of phosphate beds in zone 5 in the Thaniyat phosphate area; includes comparison between core log and gamma*ray log of zone 5 in core hole WT-5.....................30
5. Isopach maps of phosphate zone 5, West Thaniyat,with percent P^O. and waste to ore ratios...... 34A
6. Stratigraphic correlation and structural crosssections of phosphate zone 1 along TA- line-of core holes..................................... 38
ii

ILLUSTRATIONS (Cont'd).
Page
Figure 7. Stratigraphic correlation and structural cross sections of phosphate zone 1 along TB line of core holes........^*........................ 40
8 Stratigraphic correlation of phosphate zones inthe Turayf phosphate area...................... 44
9. Fence diagram showing the correlation of phosphate zone 1 in offset core holes of TB line of core holes..................................... 49
10. Relation between PJ3 and acid-insoluble contents of size fractions of dry-ground Saudi Arabian, phosphate ore........................... 74
TABLES
Table 1. West Thaniyat phosphate core holes*................ 34
2. Turayf widely spaced (Wildcat) phosphate core holes.42
3. Turayf highest grade area zone 1 phosphate coreholes......................................... ...43
4. Chemical composition of West Thaniyat phosphateores.............................................50
5. Screen analyses of samples from bed 1...............52
6. Analyses of bed 2 phosphate ore.................... »53 . ~
7* Effect of dry grinding on size distribution of phosphate and quartz in bed 2 Phosphate Adit sample...........................................55
8. Chemical composition of selected phosphate samples,Turayf area......................................57 .
9. Densimetric analyses of calcareous phosphate, Turayf area............................................ ,60
iii

TABLES (Cont'd).
Table 10. Results of benefi elation tests by calcinationTurayf phosphate.............................. 61
11. Analysis of selected core samples of Saudi Arabianphosphate ore................................. 66
12. Examination of individual core samples to determine susceptibility to beneficiation by grinding and sizing......«......**.* i....................70
13. Beneficiation of composited core samples of Saudi Arabian phosphate by dry grinding and wet screening.......................................73
iv
ABSTRACT
The Sirhan-Turayf sedimentary basin in northern Saudi Arabia
contains two widely separated phosphate bearing areas: the Thaniyat
area along the southwestern rim of the basin and the Turayf area in
the northeastern desert plains. Phosphate in the Thaniyat area is
in two zones, one in the lower part of the Hibr Formation and another
at the top of the Upper Cretaceous Aruma Formation. The Turayf phos
phate is in three numbered zones, all of which are in the Eocene
phosphate member of the Paleocene and Eocene Hibr Formation. The
zone in the Aruma Formation at Thaniyat contains the most potentially
economic phosphate if an efficient technique can be developed to up
grade the ore. The best phosphate-bear ing beds in the zone is in
the area referred to as "West Thaniyat. 11
At West Thaniyat the zone contains two beds of phosphate. The
upper bed of the zone is too thin to mine (underground) alone, but
is valuable if the whole zone is mined. However, the lower bed at
the bottom of the zone, is thick enough to mine alone by underground
methods (overburden ranges from 20 to 100 meters).
The lower bed of West Thaniyat crops out along an irregular,
fcast-west trending cliff for a distance of about 10 kilometers and,
as learned from core drilling, it is nearly flat-lying and extends in
subsurface northward from the outcrop for about 10 kilometers,
bed ranges in thickness from 1 to 2.50 meters, averaging 1.65 meters,
1
and in grade from 20 to 26 percent P^Oct averaging 23 percent P?°e*
The phosphate is soft and friable consisting of apatite pellets,
quartz sand, and clay. Reserves are approximately 200,000,000 metric
tons of ore (30,000,000 metric tons of P?0*)* A preliminary mining-
milling, transportation-marketing feasibility survey by phosphate
experts with the U.S. Tennessee Valley Authority had suggested on the
basis of adit samples that the lower bed at West Thaniyat possibly
could be economically mined and benef iciated to produce a marketable
rock suitable for use in phosphate fertilizer processes. However, upon
examination of core samples resulting from a subsequent drilling
program it was found that the ore is more argillaceous than expected
and that the large amounts of clay interferes with the beneficiation
processes.
Mapping and core drilling in the Turayf area have shown that the
three phosphate zones are in an area of about 2000 square kilometers.
The upper zone is the most important because it contains the most
phosphate, 3 to 5 or more beds, and is at the shallowest depth, averaging
about 12 meters. The average aggregate thickness and PO^C content of
beds with at least 10 percent ?20 is 2.5 meters and 16 percent. The
tonnage of P 0 concentrate in upper zone is about 1 billion metric
tons. The best phosphate found in the zone is along the western end
°f the "TB11 line of core holes between TB-1 and TB-11 where tha average
aSgregate thickness is 3.9 meters, and ?2®ci content is 18 percent.

Here the phosphate beds are estimated to contain about 80,000,000
metric tons of P2°5'
Host phosphate rock in the Turayf area is hard and solid consisting
of apatite pellets firmly bound and cemented by calcite or silica,
although soft, friable, calcareous phosphate has been found locally.
CERPHOS, a French phosphate research company, has shown that the hard,
calcareous, phosphate rock can be upgraded to 37 percent Po°5 by
calcining, screening, and washing out the lime.
INTRODUCTION
Purpose and scope of the report
This report summarizes activities since phosphate rock float
originally was discovered in the desert plains of the northeastern
part of the Sirhan-Turayf sedimentary basin in northern Saudi Arabia,
to the completion of core drilling of potentially economic phosphate
deposits discovered later along the southwestern rim of the basin. A
brief description of the geology of the basin is given to illustrate
its relationship to the phosphate-bear ing formations. Current inform
ation has been obtained through field and laboratory studies during
the period April 1966 to May 1969.
Location and extent of the area
The Sirhan-Turayf basin is in the northernmost part of Saudi
Arabia between lat 29°15' and 32°00'tT., and long 37°00 f and 40°00'S.
(pl.l and fig. 1). The name Sirhan-Turayf is from Powers and others

SAOR)-11248'
32'
28'
24*
TUKAYF I-20l| 1-202 PHOSPHATE
THANIYAT PHOSPHATE
AREA
20'
!;F" I.- [ndcx map of wont.-rn Saudi Arabia Hhowtntf thi> location «.f the Turayf and Thaniyat phosphaf- af»-

(1966); it has been less correctly called Jauf-Sakaka in reports by
Cathcart ^1970) t Mytton (1966*1967>, and Sheldon (1967). The basin
is bordered on the north by Iraq and Jordan and mostly on the west by
Jordan. The Trans-Arabian oil pipeline and highway extend across
the northeastern part of the basin and the Turayf pump station is
located about 42 kilometers east of the Jordan border. Wadi Sirhan
extends diagonally across the western side of the basin area.
The basin has two widely spaced phosphate-bearing areas. The
Thaniyat area lies along the southwestern rim of the basin and the
Turayf area lies in the northeastern desert plains about 250 kilometers
north-northeast of Thaniyat.
The Topographic Division of the U.S. Geological Survey has
prepared sixteen 7%' -quadrangle maps of the Thaniyat area and is now
preparing twenty 7%'-quadrangle maps of the Turayf area, all to a
scale of 1:25,000 and a contour interval of 5 meters. Orthophoto-
mosaics also have been prepared of six selected quadrangles (1:25,000)
in the Thaniyat area which include West Thaniyat. These orthophoto-
mosaics are the base maps upon which we plotted geologic contacts
directly from field photo prints (1:30,000). Controlled photomosaics
of all Turayf quadrangles have been prepared and geologic contacts are
plotted on the mosaics in the process of preparing geologic maps of
the selected area of Turayf. These maps will be subsequently printed
separately from this report.
5

History of discovery
Potentially commercial phosphate rock was first discovered in
the Turayf area in northern Saudi Arabia during a reconnaissance of
the region by R.P. Sheldon C1967}* between August 12 and September 3,
1965. James W. Mytton ,<^66ii9jsp^did the original follow-up field
reconnaissance during the period October 19 to December 11, 1965, at
which time he traced out the surface extent of the Turayf phosphate
and in a general reconnaissance of the Sirhan-Turayf basin discovered
phosphate in the Thaniyat area. Phosphate surface samples collected
by him were shipped to Denver and analyzed by James B. Cathcart C'^O).
About 90 percent of the samples consist of hard, calcareous or siliceous
phosphate from the Turayf area, whereas all but a few of the remaining
samples were of the unconsolidated phosphate from a small limited part
of the Thaniyat area. Cathcart (ia/0* concluded that it would be
possible to produce superphosphate or triple superphosphate from the
calcareous and siliceous phosphate rock (surface float samples), but
that the cost probably would be excessive to compete in the world
market. He (1970) believed that the unconsolidated phosphate was the
most promising because it was easily upgraded and might be economic
provided the tonnages were large enough and the beds were accessible.
The possibility of finding pods or lentils of friable phosphate in
the subsurface at Turayf was disclosed upon the detection of loose
phosphate pellets by Sheldon (1967) and Mytton (1966,1967)' in sample

cuttings from structure test holes drilled in the area years ago by
the Arabian American Oil Company.
In April 1966, I vas assigned, and joined later by Abdullah Ankary,
to work out in detail the geology of phosphate in the Sirhan-Turayf
basin in order to explore for a phosphate ore body, and to determine
the thickness, grade, and tonnage of the phosphate deposits.
Acknowledgement s
Ahmed Zaki Yamani, Minister, Fadil Kabbani, Deputy Minister,
Ghazi Sultan, Director General for Mineral Resources, and others of
the Ministry of Petroleum and Mineral Resources, Kingdom of Saudi
Arabia, were constant benefactors of the U.S. Geological Survey
exploration program.
Glen F. Brown, Chief of the U.S. Geological Survey Saudi Arabian
Project, enthusiastically supported the phosphate exploration effort
and helped guide and support day-to-day work. Conrad Martin assisted
in ore beneficiation studies and development considerations. V. 2.
McKiflvey, U.S. Geological Survey Staff Geologist, Washington, D.C.,
visited the project twice and offered valuable and timely advice.
Jean Sbrard, mining engineer, advisor to the Ministry of Petroleum and
Mineral Resources, advised on sampling and ore-dressing procedures.
The Arabian-American Oil Company (Aramco) provided a set of
samples from structure and stratigraphic test wells they drilled in
the basin years ago. These gave the first subsurface information.

R.B. Burt and S. Ingle of the Tennessee Valley Authority, Muscle
Shoals, Alabama, visited the project, evaluated the data, and completed
a preliminary feasibility report on the economic aspects of the West
Thaniyat phosphate.
The Parsons and Basil Company provided well logs of water well
tests drilled in Wadi Sirban.
GEOLOGIC SETTING
The Sirhan-Turayf sedimentary basin consists of rocks ranging
in age from Ordovician to Quaternary (Bramkamp and others, 1963).
The older rocks are along the southern rim, whereas most of the surface
elsewhere is composed of Tertiary or Quaternary rocks. The phosphate
rock deposits exist as thin beds in the Upper Cretaceous Aruma Formation
and the Paleocene and Eocene Hibr Formation.
The Tabuk Formation, given an Early Ordovician to Early Devonian
age range by Powers and others(1966), is at least 1000 meters thick
and crops out in tha southwestern corner of the basin. It lies discon-
formably beneath bluff and cliff-forming Cretaceous (Aruma) and Tertiary
(Hibr) formations. The Tabuk Formation consists of sandstone that has
been weathered black or dark brown by "desert varnish, 11 and forms
bare, low, rounded hills. Eastward along the southern rim of the
basin, the Lower Devonian Tawil Sandstone Member (upper member of the
Tabuk Formation) and younger Devonian Jauf Formation disconformably
underlie the Cretaceous (Aruma) and Tertiary (Hibr) rocks. The Tawil
8

Sandstone Member forms very dark-colored hills similar to middle and
lower parts of the Tabuk Formation; the softer less resistant Jauf
Formation, about 300 meters thick, forms valleys and low sandy areas.
In the southeastern corner of the basin the Sakaka Sandstone
of possible Middle Cretaceous age lies above the Jauf Formation and
beneath the Upper Cretaceous Aruma Formation. The Sakaka Sandstone,
which is about 285 meters thick, weathers into dark-colored bare,
rough, irregular terrain with numerous wad is.
Rocks of the Aruma Formation form the eastern limit of the basin
and are in bluffs along the southern rim underlying rocks of the Hibr
Formation. The Aruma Formation consists of light-colored limestone,
marl, sandstone, and shale. The sandstone in places is very friable
and along parts of the southern rim forms a steep slope of loose sand.
The Aruma Formation along the southern rim ranges in thickness from
about 8 to 67 meters; it thins at the southern tip of the basin and
thickens to the east and west. Aramco structure test S-459 drilled
in the northeastern desert plains penetrated at least 170 meters of
Aruma. Aruma phosphate rock was detected by the senior author in
drill cuttings from this structure test in a 6-meter zone at a depth
of about 100 meters. Thin beds of phosphate and phosphatic rock are
in the bluffs northwest of Al Jauf in the southeastern part of the
basin. They are traceable intermittently along the southern rim to
southwestern part of the basin. At Thaniyat the phosphate is in a zone

(zone 5) at the top of the Aruma, in contact with the overlying Hibr
Formation.
The Hibr Formation ranges in thickness from a meter or so in
outcrop at the southern tip of the basin to over 600 meters in the
subsurface at the northern end of the structural axis of the basin
which apparently coincides with Wadi Sirhan. The formation is composed
mostly of alternating limestone, marl, clay, and chert with phosphate
units containing beds of phosphate rock. Where phosphate is present
in the northern part of the basin, the formation is divided into the
upper, phosphate, and lower members. The maximum known thickness of
the phosphate member is about 120 meters, deep in the subsurface in
Aramco structure test S-451 in the Khawr-umm-Wual graben. However,
in the Turayf phosphate area the phosphate member ranges in thickness
from a featheredge to 71 meters. Commonly near the top of the member,
are several beds of hard, calcareous or siliceous, phosphate rock with
individual beds that rarely exceed 2 meters thick*
Unnamed Miocene and Pliocene sandstone, marl, and limestone overlie
the Hibr Formation along Wadi Sirhan and in the Khawr-umm-Wual graben
below the surficial sediments. The unnamed rocks are 143 meters
thick in a well in the graben. The sandstone is red, brown, and gray,
marly to calcareous, with conglomerate lenses. The marl is sandy
with minor amounts of red, sandy shale. The limestone is white, gray,
and brown, and also sandy. The nearly flat-lying beds are eroded and
10

weathered into very light-colored, low, rounded hills. Near the
village of Kaf, at the north end of Wadi Sirhan, the Miocene and
Pliocene rocks are interbedded with Tertiary and Quaternary basalt
sills and flows*
Deposits of Tertiary and Quaternary basalt cover much of the
central part of the basin. Basalt flows, sills, dikes, and plugs
form the highest hills in the basin, anrf cones form peaks up to 1125
meters above sea level* A complete section of the basalt sequence
is not exposed, but the estimated thickness is about 150 meters.
Quaternary silt and gravel is locally in undrained depressions.
Quaternary gravel covers a very large area along the southwestern
flank of the basin. Small patches of windblown sand are common every
where in the basin, and large amounts of dune sand are in the southern
part. The Great Nefud, the second largest dune sand area in Saudi
Arabia, lies just to the south-southeast of the Sirhan-Turayf basin.
STRATIGRAPHY
The stratigraphy described herein is largely that of the phos
phate-bearing Upper Cretaceous Aruma and Paleocene and Eocene Hibr
Formations. For the stratigraphy of* other formations in the basin
and additional information on the Aruma and Hibr Formations, tha
reader is referred to a study by Powers and others (1966).
11

Aruma Formation
The Aruma Formation was named for its exposure on the Al Aramah
plateau, a broad upland surface related to the easternmost of the Najd
escarpments. Limits of the formation are essentially as they were
originally described by Burchf iel and Hoover (Powers and others 1966,
p. D79). First formal reference to the Aruma appears in Steineke
and Bramkamp (1952). The composite type section is from several
sections measured along a traverse from Khashm Khanasir (lat 25°38'
12"N., long 46022 f 39flE.) northeast to a point on the back slope of
the Al Aramah escarpment (lat 25°39 l 18"Kt long 46O23'30"E.), thence
northeast to a promontory (lat 25°44 I 35IIN., long 46°30 I 41"E.) where
the top of the formation is exposed.
The Aruma Formation in the subsurface of the northern part of
the Sirhan-Turayf basin appears to rest upon the Sakaka Sandstone
which in turn overlies the ^auf Formation (fig. 2, A-A ). At Al
Jalamid, east of tha basin, the Aruma is 213 meters thick in the Trans-
Arabian Pipeline Company's (Tapline) water well 5-A-2. The upper two-
thirds of the formation is composed of light-colored limestone with
a sandstone bed near the center of the unit and sandy limestone near
the bottom. The lower one-third of the formation is mostly white
sandstone with interbeds of sandy limestone. The Aruma thins slightly
westward over a distance of about 40 kilometers to the crest of the
Hail Arch. The Aramco structure test well, S-459, on the crost of
12

TURAYT AREAHAIL ARCH
CROSS SECTION OF THE NORTHERN PART OF THE SIRHAN-TURAYF BASIN
WATH AS SIHHAN
SOUTHERN TIP OF BASIN
20 kilometer*
NORTH-SOUTH CROSS SECTION OF THE SIRHAN-TURAYF BASIN
Tawil Sandstone
THANIYAT AREA
sw.SOUTHERN TIP
OF BASIN
Aruma Formation
NE -
CROSS SECTIONS OF THE SOUTHERN RIM OF THE SIRHAN-TURAYF BASIN
FIGURE 2 . - Cross sections of the Sirhan-Turayf basin.
13

the Arch, contained a bed of phosphate identified from sample cuttings
between 98 and 104 meters deep. The zone was not found in other wells
in the northern area, but it may be equivalent to zone 5 phosphate at
Thaniyat farther to the south.
The Sirhan-Turayf basin begins west of the crest of the Hail Arch
where the Aruma Formation dips very gently to the west into the sub
surface beneath the Hibr Formation. The top of the Aruma Formation
is cherty in places on the flank of the basin, and the basal sandy
unit changes basinward into limestone, marl, and shale. In the An
Nabk water well test located in Wadi Sirhan, in the axial region of
the basin, the formation (over 180 meters thick) is composed of chert,
marl, and argillaceous limestone.
Southward, the Aruma gradually thins to several meters at the
southern tip of the basin (fig.2, B-B ) and the basal beds again become
sandy. The Aruma lies d is conformably on the Sokaka and Jauf Formations
and at the southern rim it rests upon the Tawil Sandstone Member of
the Tabuk Formation.
Complete exposures of what remains of the Aruma Formation are
along much of the southeastern rim. At Shuwayhitiyah, slightly east
of the rim, the Aruma consists of about 23 meters of light-colored
partly sandy limestone and marl. (fig.2, C-C*). It thins southwestward
for about 40 kilometers to Ruwala where it is only 6 meters thick.
The thinning of the unit may be due to erosion. Southwestward from
14

Ruwala along the southeastern part of tha basin rim the formation
overlies the Tavil Sandstone* Also along the rim tha Aruma is overlain
by the Hibr Formation. Thickness of the Aruma along the southeastern
rim ranges from 18 to 30 meters and decreases to only a few meters
at the southern tip. In the upper part it is mostly sandy or argil
laceous limestone, in places phosphatic. In the lower part it contains
interbeds of sandstone and shale that are partly phosphatic and cherty.
At Quarymiz there are several thin, 30 to 60 centimeter, beds of very
shaly phosphate near the base of the formation that contain 14 to 18
percent PO^S* ^G sanc* content increases near the southern tip of tha
basin where the Aruma consists of light yellowish-brown, marly or
sandy limestone and light yellow sandstone. Near Uqab a 5.5 meter
bed of sandy limestone, near the top of tha formation, has many pele-
cypod shells. The shells were examined by Erie Kauffman (written common.,
1967) of the U.S. National Museum, Washington, D.C., who identified in
one specimen the probable hinge line and partial external mold of an
Inoceramus. The range of Inoceramus is from Jurassic through Cretaceous,
especially Kiddie and Upper Cretaceous. According to Kauffman (written
commun. 1967), this is the "first Near-Eastern Inoceramus ever found. 1 '
The Aruma is poorly exposed for 90 kilometers westward from the
southern tip of the basin but again is readily traceable in the
Thaniyat area along the southwestern rim of the basin (fig.2, D-D1 ).
15

At Thaniyat the formation is mostly a very loose, friable, soft,
yellow sandstone, which in places near its base is mottled brownish-
red and lavendar. It ranges in thickness from about 9 meters on the
east side of Thaniyat f thickening westward to over 60 meters on the
west side. At the top of the Aruma, in transitional contact with the
overlying Hibr Formation, is a zone of sandy phosphate with intsrbeds
of limestone, chert, and shale. This phosphate zone has been designated
zone 5 and at West Thaniyat the potentially valuable bed 2 phosphate
is at the base of the zone.
The Aruma Formation, northwestward from Thaniyat to the Jordan
border, grades from loose sand to limestone, marl, and shale with
interbeds of sandstone. The formation is partly phosphatic but does
not contain the zone 5 phosphate beds found at Thaniyat nor any other
beds of phosphate thick or rich enough to be valuable.
Hibr Formation
The nama Hibr Formation has been defined as an informal term for
undivided Paleocene and Eocene rocks in an area of northern Saudi
Arabia which includes the Sirhan-Turayf basin (Powers and others, 1966,
p. D85). The name is established in the literature and should be
regarded as a formal name. Berg and Owens (Powers and others, 1946,
p. D85) measured 150 meters of beds from near Al Jalamid (lat 31°18'N.;
long 39°54'E.) to Tall al Hibr (lat 31°51 f n.; long 38°08'E.). Tall
al Hibr is just across the border along the Tapline.in Jordan. About
16

450 meters of the Hibr was penetrated in the Turayf Tap line pump
station water well (6-2) east of Tall al Hibr.
The Hibr Formation was divided into three members originally by
Mytton (1966-,) in the Turayf phosphate area, which are the lower
phosphate, and upper members. Detailed lithologic description of the
members is given in figure 3.
Lower member. -- In the northern part of the Sirhan-Turayf basin the
eastern edge of the lower member (and base of the Hibr Formation) is
Just west of Aramco structure test well S-459 (fig.2, A-A ). From
this point the member dips very gently westward toward the basin axis
along Wadi Sirhan, even though it is down-faulted in the Khawr-umm-Wual
graben. Only the lower member remains along the eastern border of the
basin, probably because the upper members have been eroded. It ranges
in thickness from 120 meters at the surface to over 300 meters in the
Turayf water well nearly 80 kilometers west. It is not recognized in
the An Nabk water well test in Wadi Sirhan because of the absence of
phosphate. The member on the east is composed of white, pink to
brownish-red, or yellowish-brown to brown limestone, which is dense to
coarsely crystalline, in part sandy and argillaceous, porous and vuggy,
and contains chert nodules. There are thin beds of white and yellow-
layered, or grayish-brown or black chert. A few beds of calcareous,
argillaceous, siltstone, and sandstone are also present. To the west
in Aramco structure test well, S-457, there is one bed of friable,
17

3-CHARACTER
SUBSURFACELimestone, white, buff, tan, light-brown, light-^ ay, pale-yellow, or pink, dense to fine
crystalline, 'rarely coarse crystalline. thin-tedded to massive, partly argillaceous and chalky, in places porous and vugniar; in places slightly phosphatic. Hun inter beds of chert, dark-brownish-grsy. in places contain* fln»«;fttcoarse -gained ligbt-colored phosphate grains. Foraminiferal in part, .,. %; ? v
SURFACESmall blocks of light-colored limestone scattered with numerous pieces of dark-weathered
tabular chert which breaks into very sharp edges, partly phosphatic.In southern part of area member contains white and light-brown marl and calcareous
claystone.
SUBSURFACELimestone, white, pale.white, buff. tan. light-brown, yellowish-brown, light-yellow,
yellow, pink, mottled white and pink, pale-pink, red, brownish-red. pale-gray, and gray, dense to coarse crystalline to conglomeratic, in places sucrosic: detrital, porous, vuguiar; to part argillaceous, phosphatic, chalky, fo*siUferou* (casts and molds), also a few siliceous beds; becomes sandy to the east and south;; calcite crystals in vugs; contains thin layers of chert, chert nodules, and chert chips.
Marl, clay, claystone, shale, ami rarely argillaceous sandstone are found mostly in the lower part of the member, especially in the southern half of the area. ^ "
Marl, white, cream, pink, mottled-white and yellowish-brown, gray; dense with chert nodules; in places sandy
Clay, claystone, and shale, white, buff, yellowish-brown, pink, red, brick-red, reddish- brown; in most places sandy, chalky, calcareous, in a few places shale contains calcite crystals.
Chert, white, layered pale-pink and pale-gray, light-gray, gray, grayish-brown, lavendar, pale-frray, gray-banded, dark-brown, phosphatic.
Phosphate rock, white, buff, cream, tan, pale- to light-brown to brown, pink, light-gray to grav, fine-trained to conglomeratic or pebbly; calcareous, hard, locally soft and friable, minor amounts of calcareous phosphate with chert nodules or chips and cherty (siliceous) phosphate rock.
The number of phosphate beds in the member ranges from 1 to 15, although 3 to 5 beds are most common and most beds are concentrated in zone 1 in the upper part of the member. The thickness of beds ranges from .O'.t to 1.65 m. but thicknesses of 2 m or more are uncommon and the maximum thickness of :i. 65 m was noted in only one core hole.
SURFACECoquinal (pelecypod) chert, weathered dark, rounded stones up to 3t)cm in diameter
-scattered in belts and patches on the surface mark the top of the member.Chert, gray, black, black with white coating; small rounded pieces.Phosphatic chert, dark-gray or brown with light-colored grains of phosphate,
irregular shaped slabs, chips, and pieces.Cherty phosphate rock, dark-gray, grayish-brown; irregular small slabs.Limestone, white, light-brown, light-gray, reddish-brown, purple; dense to
crystalline, in part sandy, argillaceous, phosphatic, chalky; small blocky pieces.Phosphate rock, white, light-brown, calcareous, hard, with close packed oolites and
pellets of phosphate; small rounded pieces.The resistant cherty material abundant on the surface is a minor part of the member.
SURSURFACELimestone, white, pink, red, brownish-red, light- to yellowish-brown, brown; dense to
coarse crystalline, silty, sandy, argillaceous, in part porous and vuguiar; containschert nodules; detntal and friable in part, rarely slightly phosphatic. veins and crystalsof clear calcite in upper part of member.
Chert, white and yellow to grayish-brown or black Foranuniferal in places. K«*w mterb*>ds of white siltstone and a bed of gray sandstone, fine-grained, calcareous,
argillaceous, containing black chert.Onv friable, calcareous phosphorite bed approximately 1.5m thick near top of Paleocene(?) SURFACEChert, yellow, laminated, tabular. Limestone, purple, lavendar. yellow, mottled white, redui.sh-brown, and light-green;
laminated, pock-marked, argillaceous and sandy, chunks and pieces.
Top of formation is limestone, white to light-brown, dense to fine-crystalline.
FIGURE 3.- Generalized section of strata in the Turayf phosphate area.

calcareous phosphate, about 1% meters thiick. It is at a depth of 175
meters and near the top of the lover one-third of the member. This
bed may be near the top of the Paleocene according to J. F« Mello
(written common* * 1967) who identified two Paleocene Eponides from
the phosphatic interval. The phosphate was not found elsewhere in the
northern area. It lies far below the base of the phosphate member
and may be related to phosphatic beds in the lower member along the
southern rim of the basin. The lower member grades laterally in the
subsurface into mostly dolomite and chert in the Turayf water well,
and into the lower part of the Hibr Formation in Wadi Sirhan which is
mostly marl with some chert. Southward from the northern area the
member is identified in Aramco structure test S-460, which is near the
southern end of Wadi Sirhan (fig.2, B-B*). In this well it consists
of limestone and chert with interbedded marl, about 260 meters thick.
The lower part of the member contains beds of dolomite and chert
which are underlain by fossiliferous limestone and shale. The basal
shale contains Globigerina triloculinodes and Globorotalia, that
are believed to be of Paleocene age by Mello (written commun., 1967).
The member apparently continues southward in the subsurface for some
distance until it outcrops and forms the surface along the southern
part of the basin. Here it is the only part of the Hibr Formation
that remains, which is only a few meters thick at the southern tip
of the basin.
19

Complete exposures of the remaining part of the member are found
along the southern rim of the basin (fig.2, C-C1). The eroded edge
of the lover member is between Ruvala and Er Rummanni on the south
eastern rim, and at Er Rummanni it is about 23 meters thick* The
member is composed of light-gray and light-brown limestone with gray
chert. There is one 30-centimeter thick bed of cherty, calcareous
phosphate rock near its base that contains about 14 percent P^^ ^ne
member thins southeastward along the rim to 6 meters or less at the
southern tip of the basin. The low grade, cherty, calcareous phosphate
rock apparently is continuous in this area with thicknesses up to 90
centimeters and ore grades ranging from less than 10 to 21 percent
^2^5* Th*s layer of phosphate rock may be related to the bed of Palco-
cene phosphate previously discussed that is in the lower member deep
in the subsurface (Aramco S-457) in the northern area of the basin.
The lower member is difficult to trace around the southern tip
of the basin because it is covered by sand and gravel in many places.
However, it is well exposed on the southwestern rim in the Thaniyat
area and forms most of the surface of that area (fig.2, D-D ). At
Thaniyat it rests in transitional contact on top of the Aruma Formation,
just above the zone 5 phosphate. The maximum continuously exposed
vertical thickness of the member in the Thaniyat area is at Thaniyat
Turayf where about 100 meters were measured. The lower part of the
section consists of limestone that is white, earthy, massive to thick-
20
or medium-bedded, porous, with some slightly sandy layers. The rest
of the section is white to very pale yellow, marl and limestone with
large chert nodule layers and geodal lenses.
A zone of noteworthy phosphate (zone 4) is from 45 to 65 meters
above the base of the member (base of the Hibr Formation) and the top
of zone 5 in the Thaniyat area. It is associated with a black chert
bed near the middle of the zone that can be easily traced on tha surface
or on aarial photographs as it forms a noticeable bench mantled with
fragments of dark chert. Zone 4 consists of one to three beds above the
chert bed and one or two beds below it. Tha zone is about 5 meters
thick and the phosphate beds range in thickness from a few centimeters
to 60 centimeters. The thin phosphate beds range in grade from about
21 to 30 percent ?o^s' *** many places the upper bed of zone 4 phosphate
is very soft and friable, whitish-gray in color, and contains small
fish teeth. The lower bads of phosphate are mostly hard, light-colored,
and composed of a calcareous or siliceous matrix. This zone of phos
phate may be related to the phosphate bed previously described in the
lower member along the southern rim of the basin and in the subsurface
in the northern area. Zone 4 is an important stratigraphic marker,
especially at West Thaniyat where it is widely exposed and serves as
a reference plane to estimate drilling depths to the top of zone 5
phosphate.
21

In Wadi umm-Urta, in the northern part of the Thaniyat area, an
outcrop section was measured and sampled which includes most of the
upper part of the lower member. Two samples from this section contained
Globigerina, and Globorotalia, which, according to Mello (written
commun., 1967), may be late Paleocene in age. Thus all of the lower
member, i.e., all of the Hibr Formation in the Thaniyat area, is
probably Paleocene in age.
Phosphate member.-- The phosphate member of the Hibr Formation overlies
the lower member in much of the northern area of the Sirhan-Turayf
basin (fig.2, A-A ). It includes the major beds of phosphate rock
located in the Turayf area.
The base of the member crops out about 8 kilometers east of
Aramco well S-454 and marks the eastern edge of the Turayf phosphate
area. The member has a very gentle westerly regional dip. It is
down-faulted in the Khawr-umm-Uual grab en, and warped along the aast
side of the graben where there are some local easterly dips. The
member forms most of the surface along the eastern side of the Turayf
phosphate area and in other parts of the phosphate area wherG the upper
member is absent. Maximum thickness of the phosphato member in the
Turayf phosphate area to the east of the Khawr-umm-Wual graben is 71
meters as obtained from core drilling data. The member is composed of
limestone that is white to yellow to brown, and pink to brownish-red
or gray, dense to conglomeratic, porous and vuggy, in part argillaceous,
22

chalky, and phosphatic. The limestone also has thin layers of chert,
chert nodules, and chert chips. Marl and clay are in the lower pert
of the member. The marl ranges in color from white to pink to
yellowish-brown and gray. It is sandy in places. The chert is vari
colored, including white, pink, lavendar, gray, and dark brown. It
is locally phosphatic. The number of phosphate beds varies from 1 to
15, but 3 to 5 beds are most common; most of them are concentrated
near the top of the member (zone D. In addition, phosphate zones 2
and 3 are in the area. The phosphate beds are described in detail in
the chapter on phosphate deposits.
The phosphate member is probably Eocene in age inasmuch as J.F.
Mello (written common., 1967) described the phosphate bed in the lower
member of Aramco S-457 well as probably uppermost Paleocene in age.
The base of the phosphate member is 150 meters above this bed. The
member is abnormally thick (over 120 meteis) in the Khawr-umm-Wual
graben where deposition may have been contemporaneous with down-fault ing.
In Turayf pump station water well (6-2) it is about 107 meters thick.
The phosphate member is almost entirely overlain by the upper
member west of the Khawr-umm-Wual graben, west of the Turayf phosphate
area. The member changes facies in the subsurface west of the Turayf
pump station. Phosphate of zone 1 is absent (although zone 2 and
zone 3 are present) in the Turayf well where the zone is mostly
phosphatic limestone and chert. All phosphate material is absent in
23

the An Nabk veil located in the axial region of the Sirhan-Turayf
basin* The equivalent interval at An Nabk is marl, chart, and some
dolomite.
The member apparently is continuous in the subsurface southward
from the northern area of the basin as it is present in Aramco well
S-460 (fig.2, B-B ). Here it is 76 meters thick and consists of phos-
phatic and dolomitic limestone, dolomite, cherty limestone, and marl.
Some phosphatic layers, with possibly a thin low grade zone 1 phosphate
bed, are at a depth of 210 meters. The member pinches out south of
well S-460 in the area north of the southern rim of the basin.
The phosphate member is not recorded in water well tests drilled
in Wadi Sirhan. Its lithologies are unknown on the west flank of the
basin in Saudi Arabia as it is covered by Quaternary deposits. Most
of the member on the west flank of the basin is in Jordan.
Upper member."- The upper member of the Hibr Formation in the northern
area of the basin overlies the phosphate member in part of the Turayf
phosphate area. The upper member forms the surface from the top of
the west bank of the Khawr-umm-Wual grab en, westward past the Turayf
pump station, up to the basalt fields about 30 kilometers west of the
station (fig.2, A-A ). The basalt fields cover the area up to Wadi
Sirhan near where the top of the undifferentiated Hibr Formation is
exposed along the part of the west flank of the basin that is not in
Jordan. The member ranges in thickness from a few meters, where
24

heavily eroded, to possibly 100 meters or more basinward. The surface
of the member forms a broad, flat, monotonous, gravel-strewn desert
plain. The upper member is buried in the Khawr-umra-Wual graben by as
much as 150 meters of the Miocene and Pliocene sediments.
The member consists of limestone, chert, and in places, marl and
calcareous clay stone. The limestone is white to light brown or light
gray, pale yellow, or pink. It is dense to finely crystalline, (rarely
coarsely crystalline), thin bedded to massive, and partly argillaceous
and chalky. The limestone is slightly phosphatic in places. The
chert is in the form of thin interbeds, nodular lenses and geodal
lenses. It is dark brownish-gray, and in part contains fine-to coarse
grained, light-colored phosphate grains and foraminfera tests. Locally
there arc beds of white to light-brown marl and claystone.
The upper member forms the surface southward from the Turayf
pump station to where it is buried by basalt flows, or covered by
large thicknesses of Miocene and Pliocene sediments in Wadi Sirhan as
revealed in Aramco S-460 well (fig.2, B-B ). In this well the member
is 60 meters thick and it is mostly limestone, chert, and marl, with
a 6-meter thick gypsum bed at the top. The member pinches out north
of the southern rim area of the basin.
STRUCTURE
The Sirhan-Turayf sedimentary basin is bounded on the east by
the Hail Arch, on the south by Paleozoic rocks associated with the
25

Arabian Shield uplift, and on the west by the Dead Sc-a rift area.
To the north it apparently opens into the Mediterranean basin of Jordan,
The axis of the basin trends northwest along Wadi Sirhan, which has
the lowest slsvation and in general the thickest sedimentary section.
In mast places the dip of the beds is very low, ranging from % to 3°.
At a few places, adjacent to faults, the dip is as much as 29°. The
strike differs around the basin. It trends north on the east flank,
but deviates around the southern area to & northwesterly strike on the
wast flank where tha b^ds form a long gentle dip-slope. Most of the
west flank is in Jordan.
The basin is criss-crossed with faults or fractures and grabens
which are probably related to the Dead Sea rift belt of Jordan. Most
faults strike due north to 30°W. or N.70° to 90°W. In places there
are three sets of faults oriented north-south, northwest-southeast,
and east-west. These faults intersect each other and are readily
visible on aerial photographs but very difficult to distinguish on
the ground. Displacement of most of them cannot be measured because
of the lack of exposure, but it is probably slight. Small grabens are
inferred on the surface by long narrow slightly depressed areas. The
Khawr-umm-Wual graben in the northeastern part of the basin is formed
by a complex of faults oriented about N.30°W,, which has resulted ini
a displacement of more than 200 meters in the subsurface (fig.2, A-A ),
Surface relief, however, is as much as 60 meters between the floor of
26

Khawr-umm-Wual and the top of the flanking hills; it is a result of
sedimentary fill. Subsurface evidence has revealed thickening of the
Hibr Formation in the graben, which suggests that deposition was
contemporaneous with down-faulting during Paleocene-Eocene time.
About 150 meters of Miocene and Pliocene rocks are also in the graben.
Khawr-umm-Wual is from 5 to 7 kilometers wide and about 100 kilometers
long; the displacement on the faults decreases markedly to the north
and presumably to the south according to subsurface data. This long,
broad depression is the approximate western boundary of the Turayf
phosphate area. A major fault with a displacement of about 150
meters is along the southeastern end of Wadi Sirhan and it bisects
the southeastern flank of the basin (fig.2, C-C ). Jabal Quarymiz,
which contains some phosphate, is in the up thrown block north of the
fault, and the Hibr Formation is in the downthrown block on the south
side of the fault, A small northwesterly trending fault is south of
Al Jayb, and it is downthrown to the north with an estimated vertical
displacement of 75 meters. The displacement at the rim of the basin
may be coupled with horizontal movement, resulting in a 5-kilometer
lateral offset in the exposed rocks. In the northern part of the
Thaniyat area, near the southwestern rim of the basin, several parallel
grabens have been identified from their surface expression in the Hibr
Formation. The grabens are oriented N.22°W., up to 1 kilometer wide,
several kilometers long, and have a maximum vertical displacement of
50 meters from the graben floor to flanking hill tops.
27

The Hail Arch, which originates south of the Great Hefud, probably
extends in the subsurface along the eastern side of the Sirhan-Turayf
basin. The crest of the Arch may extend in the vicinity of Aramco
well S-459 (fig.2, A-A1). The Sakaka Sandstone and Jauf Formation
are truncated in the structurally high area of Ruwala, but to the
north they dip both east and vest from veil S-459. The westerly dip
persists into the Sirhan-Turayf basin except for local reversals noted
in the Turayf phosphate area due to folding along the east flank of
the IQiawr-umm-Wual graben. Tha cross-section along the southern rim
of the basin is complicated by faulting and tilting in the lower part
of the basin (fig.2, C-C ). On the southwestern rim, in the Thaniyat
area, the beds have a very gentle northeasterly dip of about one-half
degree. The north-south cross-section, which trends diagonally across
the basin axis (fig.2, B-B ), shows opposing dips toward tha axis.
PHOSPHATE DEPOSITS
Thaniyat phosphate deposits (West Thaniyat)
The Thaniyat phosphate area includes the southwestern rim of the
Sirhan-Turayf sedimentary basin between 29°22%'N.- 30°07%'N., and
long 37°43'E.- 38°22%'E. The part of the Thaniyat area described
herein includes th,2 phosphate outcrops and the area of core drilling
at West Thaniyat, and lies between lat 29°35'n. and 29°50 I N., and
long 37°43'E.- 38°17 f S. (pi.2). The rim of the basin of the
Thaniyat area forms an easterly trending bluff or cliff that contains
28

the Aruma and Hibr Formations. At the top of the Aruma, in transitional
contact vith the overlying Hibr, is a zone of phosphatic material that
is designated zone 5. The zone has been traced, sampled, and measured
for more than 60 kilometers to where it apparently pinches out east
of tha Thaniyat area, about 15 kilometers southeast of Thaniyat ililan,
to where it changes laterally into limestone, marl, and chert west of
the area near outcrop locality 17.
Much of the zone is partly covered with talus from cliff -forming
limestone of the Hibr Formation. However, exposures of zone 5 ara
adequate to define the thickness and grade of the phosphate beds. A
correlation section of zone 5 (f ig.AA) extends from locality 17 to
locality 35 near Thaniyat Rilan and illustrates the thickness and
lateral variation of the zone from west to east across the Thaniyat
area. Other sections were sampled but are not included on figure 4,
At locality 17 the zone, 1.15 meters thick, has a thin bed of phosphate
at the top and bottom separated by limestone and chert. The top bed
of phosphate is traceable across the area to locality 35 to the east,
a strike distance of about 50 kilometers. It is designated bed 1 and
ranges in thickness from 10 to 90 centimeters and in grade from 10
to 32 percent P2°«;" The ^^ generally thickens eastward where it
contains a lower grade phosphate. The thin bed of phosphate at the
bottom of zone 5 at locality 17 is also traceable across the area to
locality 35. It thickens and is richer in phosphate in .tb.o West Tboniyat
29

1.-1
7 S
-13
L-1
6 L
-15
I.-1
2 L
-10
1-7
L
-18
L-.
!8
met
ers
2r
EX
PL
AN
AT
ION
22
Ave
rage
p«
rc»
nt
in c
or*
r )
Unn
umbe
red
bed
IH3
B
«d2
L O
utcr
op l
ocat
ion
10 k
ilo
met
er B
A
- ST
RA
T1G
RA
PH1C
CO
RR
EL
AT
ION
OF
PH
OS
PH
AT
E B
ED
S IN
ZO
NE
5.
TH
AN
IYA
T.
WIT
H 1
0% O
R M
OU
E P
2O5
L-1
4 1
-15
L
-108
(A
dit)
L
-105
L
-104
L
-12
L-1
03L
-ll
L-1
02
L-1
01
L-1
0D
AJU
M.
T O
P Z
ON
E 5
B
- S
TR
AT
IGR
AP
WC
CO
RR
EL
AT
ION
OF
PH
OS
PH
AT
E B
ED
S IN
ZO
NE
5,
WE
ST T
HA
NIY
AT
. W
ITH
10%
OH
MO
RE
P2O
5
L-1
5 W
T-5
DA
TU
M.
TO
P Z
ON
E 5
WT
-2
C
- 5T
RA
T1G
HA
PH
IC C
OR
RE
LA
TIO
N O
F P
HO
SP
HA
TE
BE
DS
IN Z
ON
E 5
, W
EST
TH
AN
IYA
T D
RIL
L H
OL
ES
. W
ITH
10%
OR
MO
RE
P2O
5.
WT
-4A
W
T-1
CO
RE
LO
GG
AM
MA
-RA
Y L
OG
(.
00
25
Mr/
H)
E.-
CO
RE
LO
G A
ND
GA
MM
A-R
AY
LO
G O
N Z
ON
E S
IN
CO
RE
HO
LE
WT
-5.
D.-
ST
RA
TI G
RA
PH
IC C
OR
RE
LA
TIO
N O
F P
HO
SP
HA
TE
BE
DS
IN Z
ON
E 5
. W
ES
T T
HA
NIY
AT
DR
ILL
HO
LE
S,
WIT
H 1
0% O
R M
OR
E P
2O5
L 4
- S
trat
igru
phic
corr
elat
ion o
i' p
ho
sph
ate
bed
s ia
/o
ne
5 in
the
Than
iyat
phosp
hat
e ar
ea,
incl
udes
co
mp
aris
on
bet
wee
n c
ore
log
and
gau
un
a-i'u
y l
og o
n zo
ne 5
in
core
hol
e W
T-5

area. This bed, designated bed 2, ranges in thickness from about 30
centimeters to 3.65 meters and in grade from 11 to 25 percent ?90c*
The average grad^ of bed 2 from locality 17 to locality 35 is about
18 percent Po^5» an<^ t*le average thickness (excluding barren beds
between the phosphate layers) is about 1.80 meters. Both bed 1 and
bed 2 are very soft, friable phosphate with quartz sand and clay
impurities. Between bed 1 and bed 2 of zone 5 there are from .30 to
1.65 meters of limestone, shale, and chert which in places are inter-
bedded with thin beds of phosphate containing as much as 37 percent
P2^5* ^e average thickness of the zone 5 outcrop in the Thaniyat
area is about 3.20 meters. The zone dips only about one-half degree
northeast from the cliff face under 20 to 100 meters or more of Hibr
limestone and chert.
West Thaniyat, which contains the thickest and richest phosphate
beds of zone 5, is between 29°40«- 29°50 f ll. and long 37°52«- 37°59»E.
in the west-central part of the area. Hare zone 5 is exposed along
a 50 to 90-meter or more high, south-facing, steep bluff or cliff
with an undulated surface along the east-west strike. The zone is
about 30 meters abova the base of the bluff, and the higher grade
phosphate extends for a distance of about 10 kilometers.
The top of zone 5 at West Thaniyat is at the base of a thin-beddad
chert unit 1 to 3 meters thick. This chert is at the base of the
Hibr Formation. The zone in the cliff face is not offset by faults;
31

however, there is some slumping in the zone. The base of the zone is
near the top of non-phosphatic, loose, white or yellowish-vhits, quartz
sand that in most places has a yellowish-brown ferruginous layer about
30 centimeters thick at its top.
Bed 1 underlies the basal chert of the Hibr and ranges in thickness
from 10 to 80 centimeters, averaging 35 centimeters. Its grade ranges
from 11 to 32 percent Po0^* avera8in8 28 percent P-0- (fig.4). Bed 1
is very soft and friable, contains marl and, in places, quartz sand
impurities.
As previously mentioned, betveen bed 1 and bod 2 there is an
interval of limestone shale, siltstone, and chert that in most places
at West Thaniyat has one or two thin beds of phosphate. The interval
ranges in thickness from about .35 to 1.65 meters; its upper part
consists of shale, siltstone or limestone, and phosphate. Between
localities 14 and 12, a strike distance of about 3 kilometers, there
are two beds of phosphate in the interval. The upper bed ranges in
thickness from about 5 to 15 centimeters and contains about 32 percent
PO^S* The lower bed ranges in thickness from 8 to 15 centimeters and
in grade from 28 to 37 percent ?2°5' It: is a^most continuous between
locality 15 and 10 across Wast Thaniyat (fig.4B). Below this thin
phosphate there is a persistent chert bed that forms a capping layer
of bed 2. The chert bed ranges in thickness from 25 to 75 centimeters.
32

Phosphate bed 2 comprises the lower one half to two thirds or
more of zone 5 at West Thaniyat and in outcrop ranges from 1 to 2.60
meters, averaging 2.00 meters thick; it contains 14 to 25 percent
P2^5* averaS*n& 21 percent Po^5» including local non-phosphatic partings.
A somewhat higher average grade of PoO and lower average thickness
was obtained in a core.
Six core holes were drilled north of the bluff to determine the
extent of zone 5 in the subsurface at West Thaniyat. The holes ranged
in depth from 30 meters to 103 meters due mostly to variations in
terrain (table 1).
Zone 5 trends north-northwestward from the outcrop, thickening
in that direction and thinning both east and west (fig.SA). Thickness
of the zone, according to surface and subsurface information, ranges
from 1*80 meters in outcrop at locality 10 to 4.90 meters in core hole
WT-4a (fig.4C). Waste-rock to ore ratios range from .24:1 on the east
side of the area, to 1.6:1 on the west side. Ore thickness includes
only bed 1 and bed 2, whereas the thin phosphate beds interbedded in
tha intervening waste-rock are included with the waste.
The aggregate thickness of phosphate bed 1 plus bed 2 in zone 5
ranges from about 1.23 to 3.05 meters and grade from about 16 to 28.5
percent P20. (fig*5B). About 50 square kilometers of West Thaniyat
is underlain by aggregate zone 5 ore which is 1.50 meters or more thick,
and has a grade of 20 percent PO^S or morG (fig«5B). Here the ore has
33

W_est__Thaniyat phosphate core holes.
i Elev.Same i Coordinates above sea
(meters)
WT-1 ' lat 29°44'39"N.! 945long 37°54'49"E.
Zone 51
Bed 1 ! - i»
Bed 2
WT-2 ! lat 29°44'40"N.; 841long 37°57'52"E.<
Zone 5i
Bed 1 .
«ed 2
WT-3a
Zone 5
Bed I
lat 29°<*4'44"N.long 37 51'4b"E.
-
Bed 2
WT-4a
Zone 5
Bed 1
Bed 2
j WT-5
-
lat 29°-.o'56"N.long 37°53' l4"E.
-
-
-
lat 29°43' 13"N.long 37°53' 18"E.
Zone 5( -i
Bed I
Bed 2 ;
wr-b ' lat 29°43' L3"N. lung 37°56'25"E.
Zone 51
Bed 1
bed 2
-
947
Total ' Depth Zone 5 T Aggreg. Av.depth
v. meters;
103.3C
-
-
-
46 . 3u
-
-
-
73.60
-
892 o8.50
i-
-
927
-
-
45 70!
-
!
Commenced Completed HmetersJJ Thick- .Thickness! ?2 |; 5ness Phos. \ grade
.( netersjl teds
v'ov. -* t ' Dec. 11, , - - - ; -I9o8 I9b8
97.90i 3.30 2.10 2i::, <101.20, »97. 90-< l.'t'j .85 2n\ *^8.9599.80-! i.4u 1. 25 ' 22"~ *
Dec.l5,1 968
-
-
Apr. 17,1969
-
-
Apr. o^1969
-
-
-
H»v 3,19b9
-
Jan. 16,1969
-
-
-
Apr. 30,1969
-
-
Apr. 15,1969
-
-
-
Mav 12,1969
-
- - i
1369 1 30. «M'
|
| Mav U. 1969
* ; Mav 19, 1969
t
.
101.20 ,
.
41.40-43.5041.40-42.2042.40-43.50
fciQ.i^-72.3569. ('5-
- 70.7570.50-72.35
-
60.20-65. lubO.20-61.1562.21?*65.10
_
38.55-42.1538.55-39.10
26.25-2 ri. 5 ;26.^5-
27.95-
.
2.10
.80
1. K'
1.30
1 .2'!
1.85
4.90
.95
2.90
.
3.60
.55
1.55
1.30
.8i)
l.f-.O
_
1.40(1) ' 16'4
.bO(?) 207, i
.80;, 121
-
2 . 20 19'',,
,55 2o:.
i.65 i an
-
3.U5
.95
2.10
,
1.98
.55
1.43
2.40
.8"
l.r,n
-
18 'i i
21Z 4
15'.;
251
241
26"
2.*+ ,*
-b
21
i
1Remarks
^ore artel stuck -»t to''. 50-. -novei-1 l~. and redrilled.a.i\e location
Mostlv cuert from surfaceto Zone 3.Estiiraied average P2 'J sgrade.
WT-3 core recovery unsatis-tactorv .Moved lew outers anaredrille' 1 -ame location.
WT-4 core barrel stuck at77.20 n. shifted 3/4 Km.S^W and redrilled.
Estimated average P-,0grade
34
34

SA(IR)-112
Area with more than 20% ?2O5 in thicknesses of bed 1 + bed 2 exceeding 1. 5m. Area of approx 50 sq km contains 242 million metric tons ore with 36 million metric tons
WT-2l/40?(16%est)
A. ZONE 5 (total interval including gangue)
2.70(26.5%),
B. ZONE 5 (bed 1 + bed 2; total interval including gangue)
o Core hole ____ Thickness, dashed o Core holex Outcrop location where approximate x Outcrop location
3.0 Thickness in meters ____ Waste to ore ratio 3.0 Thickness in meters(.60:1) Waste to ore ratio 24% Average percent P2O5
._____ Thickness, dashedwhere approximate
.__ Percent
.90C40:!)/
WT-1 WT-2 .12:1)1-10(.37:1)
1.5-
WT-5 ^-2.0 1\55(.08:1
Area with more than 20% ?2Os in thickness of bed 2 exceeding 1m. Area of approx 50 sq km .contains 190 million metric tons ore with 27 million, metric tons
1.00+(25%
C. ZONE 5 (bed 2; total interval including gangue) D. ZONE 5 (bed 2; phosphate rock)
o Core holex Outcrop location
3.0 Thickness in meters(.40:1) Waste to ore ratio
Thickness, dashed where approximate
o Core holex Outcrop location
2.0 Thickness in meters24% Average percent
__ Thickness, dashedwhere approximate
__ Percent P2Os
FIGURE 5.- Isopach maps of phosphate zone 5, West Thaniyat, with percent P2O5 and waste to ore ratios
34A

an average thickness of 2.10 meters, and average grade of 24 percent
P^O . Calculated tonnage of P 0 concentrate in the 50 square kilo
meter area is about 36,000,000 metric tons, or roughly 242,000,000
metric tons of ore (specific gravity 2.3).
Bed 1 alone is too thin to mine in most places as it ranges in
thickness from 20 to 95 centimeters, but it would be possible to
mine bed 2 alone. In fact the original preliminary economic fea
sibility report by Burt and Ingle (1968) was for bed 2 at West Thaniyat,
Bed 2 trends north-northwestward from the outcrop and thins to
the east and west (fig.5C). The bed, according to surface and sub
surface data, ranges in thickness from 1 to 2.90 meters. The waste-
rock to ore ratio is very low, ranging from no waste rock in the bed,
to a maximum of .45:1 (fig.SC). The total thickness of bed 2 increases
northwestward but the grade decreases to less than 20 percent P 0 .
Aggregate thickness of phosphate bed 2 ranges from .80 to 2.50
meters, and grade from 12 to 26 percent P20 (fig.SD). About 50
square kilometers of West Thaniyat is underlain by aggregate bed 2
ore, which is 1 meter or more thick and has a grade of 20 percent
^2^5 or more * *n this area the ore has an average thickness of 1.65
meters and average grade of 23 percent PoOc. Calculated tonnage of
P2°5 concentrate in the 50 square kilometer area is 27,000,000 metric
tons, or about 190,000,000 metric tons of ore (specific gravity - 2.3).
35

Faults were not detected by core drilling at West Thaniyat
where, in fact, structure contours drawn on top of zone 5 show a
uniform regional dip of 37 V NE. North of the bluff, however, thare
is a normal fault in the western part of the area, to the southeast
of core hole WT-3a. It strikes about H.17°W. and is downthrown on
the west with a displacement of about 20 meters. A graben is in the
central part of the area west of core hole WT-1. It also strikes
about H.17 W., is about 3 kilometers long, one-half kilometer wide,
and the downthrown block has a maximum displacement of 25 meters.
Turayf phosphate deposits
The Turayf phosphate area is in the northeastern part of the
Sirhan-Turayf basin between 31°10'N.- 32°00'N., and long 38°56'E.-
39°30 fE. (pi.3). In this area the Hibr Formation forms a flat, mono
tonous, desert plain except for gentle hills along the west side
adjacent to the Khawr-umm-Wual graben. Volcanic basalt rock form
low peaks at several places on the west side of the graben. Most
phosphate beds are in a triangular-shaped area about 2,000 square
kilometers in size east of the Khawr-uram-Wual graben.
Fifty-two core holes were drilled to evaluate the phosphate
rock in the Turayf area where in most places the rock is found only
as float in the desert residium. Forty holes are along two lines.
The first line of eleven core holes, designated TA, was drilled 500
meters north and parallel to the Trans-Arabian pipeline beginning
36

north of Trans-Arabian pipeline kilometer marker 752 on the vest,
and ending north of pipeline kilometer marker 742 on the east (lat
31°31 f 06"N.; long 39O18'11"E. to lat 31°28 f 54lf ; long 39°24 I 19"E.).
The holes, spaced at 1 kilometer intervals, are alined across the
Turayf phosphate discovery area. The holes range in depth from about
15 meters to 90 meters; the deep holes are at the west end of the
line, near where the top of the phosphate member is in contect with
the upper member of the Hibr Formation. The phosphate member thins
eastward, mostly by erosion, to where its base is in contact with the
top of the lower member.
Along line TA there are several thin layers of low grade phosphate
rock between core holes TA-1 and TA-6 (fig.6). The maximum thickness
of any one layer of phosphate was 97 centimeters penetrated at depths
between 3.87 and 4.84 meters in hole TA-5. This bed is a hard, cal
careous, partly cherty phosphate with an average content of 16 percent
P 0 . It thins to one-half meter or less about 1 kilometer east anddte ^F
west of the hole.
The phosphate beds along line TA are in a flat-lying zone desig
nated zone 1 near the top of the phosphate member at depths ranging
from 1% to 12 meters; Zone 1 ranges in thickness from less than 1
meter to 11 meters; it pinches out between core holes TA-6 and TA-7.
Aggregate thickness of phosphate rock in the zone ranges from .25
to 1.12 meters, excluding limestone and chert interbeds and any rock
37

meter*i
4
3
2
1
O
-
-
-
-
1 2 IdlomeUi i i i i i
DATUM: KEY CHERT BED
STRATIGRAPHIC CORRELATION OF PHOSPHATE BEDS IN ZONE 1 WITH 10% OR MORE PjOg
KEY CHERT BED EAST
A-. 34mB-U* 2 kilometers
STRUCTURAL CROSS SECTION OF PHOSPHATE ZONE I
FIGURE 6.- Stratigraphic correlation and structural cross sections of phosphate zone 1 alongTA line of core holes.
38

with less than 10 percent PO^S* Average grade of the phosphate rock
ranges from 10 to 21 percent P?OV Several faults intersect this
line which offset zone 1 as much as 7 meters.
The second line of core holes, designated TB, is about 17 kilo
meters north of the TA line* The line begins near the Khawr-umm-Wual
graben on the west and extends eastward for about 28 kilometers
(lat 31039 f 17"N.; long 39°06 I 31HE. to lat 31039'24"N.; long 39°23 I 59 IIE.).
This line of 29 holes, spaced at about 1 kilometer intervals, extends
across the widest exposure of the phosphate member in the Turayf area.
The holes range in depth from 10 meters to 30 meters; the deep holesj.
are at the west end of the line where the top of the phosphate member
is in contact with, or overlain by, the upper member of the Hibr
Formation. From 1 to 6 layers of phosphate are between core holes- ?:ti-1 and TB-23 (fig.7). All phosphate is in zone 1, ranging in depth
from the surface on the east to 30 meters or more on the west where
the top of the holes are in the upper member of the Hibr Formation.
Hie nearly flat-lying zone ranges in thickness from 1 to 10 meters,
and pinches out east of core hole TB-23. Aggregate thickness of
phosphate rock ranges from .38 to 7.75 meters, and the average grade
ranges from 11 to 23 percent ?2®5* These data do not include lime
stone and chert inter beds and any rock with less thnn 10 percent
P^O^. Most phosphate beds are calcareous, firmly cemented, hard, and
39

locally with cherty and siliceous material. However, soft, friable,
niarly phosphate was encountered at the base of zone 1, first in TB-2,
within what subsequently was found to be the highest grade phosphate
of th^ Turayf phosphate area. Five block faults intersect the TB
line and they displace zone I phosphate as much as 15 meters.
Drilling of the TA and TB lines of core holes showed the conti
nuity of the phosphate zone so that core drilling exploration in the
Turayf area was adequately completed with six widaly spaced wildcat
holes (table 2). These holes verified that zone 1 phosphate is con
tinuous from north to south along the Turayf area, and that there
are two other discontinuous phosphate zones below zone 1 (fig.8).
Zone 1 extends over a distance of about 90 kilometers from the north
ernmost core hole TD-2 to the southernmost core hole TE-1, and
farther south to the south end of the Turayf area where it was exposed
by trenching at locality 86. Along this line zone 1 ranges in thick
ness from 1.95 meters to 8.30 meters and contains 3 to 6 beds of
phosphate with aggregate thicknesses (excluding rock with less than
10 percent P20 ) ranging from 40 centimeters to 3.87 meters. Average
grade of phosphate ranges from 13 to 20 percent P^. Most of the
phosphate is hard, calcareous, and in places cherty.
Core hole TB-1W was drilled to the west of the Khawr-umm-Wual
graben, in line with the TB lino of core holes, to test the western
extent of the phosphate beds. Zone 1 in this hole is at a depth of
41

Table
2.
Turayf w
idely
spaced (Wildcat)
Phos
phat
e Co
re H
oles
.
Name
TB-1W
Zone
1
Zone
2
Zone
3
TC-1
Zone
1
Zone
2
Zone
3
TC-7
Zone
1
Zone
2
Zone
3
Coor
dina
tes
lat
31°39'16"N.
long
38°
58'5
3HE
. -
lat
3104
8'03"N.
long
39°04
I49"E.
- - -
lat
31°47'35"N.
long
39°09'53"E.
- - -
Total
dapth
(meters)
79.8
0
- - -
80.0
0
- .
65.00
- - -
Comp
lete
d
Oct. 2,
1967
- -
Nov. 9,
1967
- - .
Dec. 2,
1967
- - -
Depth
Zone
Thic
k-(meters),
ness
(met
ers]
47.45-
66.85
106
118 _ 12.10-
17.6
0-
50.80-
52.55
20.40-
25.8
0-
1 -
19.4
0
l.O/
l.O/
5.50 - 1.75 m 5.45 -
Aggr
egat
eth
ickn
ess
phosphate
bads
(m«)
3.37
1.0
/
1.0
/
1.75 -
JU75 2.85 - -
Av. I
P2°5
20% - - .
13% - 16% 14%
Rema
rks
Dete
cted
in
Ara
mco
S-450 dr
ill
cutt
ings
dril
led
to 2
74 met
er*
at s
ame
location
Zone 2
absent? p
oor
core r
ecovery*
i
TC-2
thr
u TC
-6 not
dril
led.

Table
2.
Tura
yf widely spac
ed (Wil
dcat
) Ph
osph
ate
Core H
oles
,
Nama
TD-1
Zone
1
Zone 2
Zone
3
TD-2
Zone
1
Zone 2
Zone
3
TE-1
Zone
1
Zone
2
Zone
3
Coor
dina
tes
lat
31°5
6'03
"N.
long 3
9009
'43ME
.
-
lat
3105
6'44
MH.
long
39
°02'
15"E
.
-
lat
31°2
2I44
IIN.
long 3
9°18'19"E.
-
Tota
l de
pth
(met
ers)
65.0
0
-
65.00
-
56.0
0
Completed
Dec. 2
9 1967
-
Jan.
6,
1968
-
Jan. 24
, 1968
-
Depth
(meters]
12. GO
-15
. 25
34.75-
37.85
16.50-
24.80
40.95-
42.7
353.73-
55.2
5
5.90-
7.85 -
Zone
Th
ick
ness
(met
ers!
3.25
3.10
8.30
1.78
1,52
1.95 - ^
Aggr
egat
e th
ickn
ess
phos
phat
e be
dsCm
J
2.48 .35
2.65
C?)
1.40 .52
.40
- *
As-P2
o5 16%
24%
15%
21%
17%
14% -
Remarks
Equi
vale
nt in
terv
al
is p
hosphatic,
cherty li
mest
one
Core
rec
over
y po
or
Zone
2 a
nd Z
one
3absent
? core
reco
very
poo
r

[""""] ZONE I
{ | ZONE 2
[ 1 ZONE 3
20 kUamater*
NORTH_
STRATIGRAPHIC CORRELATION OF PHOSPHATE BEDS IN ZONE 1 WITH 10% OR MORE PjOa
{
A-2.65tnB-15%
NORTH
A- 1.40m B-21%
A- . 52mB-17%
< -^\
CD
J
A-l.Om B-21%
===
O "4 t^ rfj
A- 2 75m A-3.87m A-1.22m B-13% B-20* B-17%
DATUM: ti KEY CHERT BED
A-1.75m B-16%
A - Aggregate thickneaa of phoapti with 10% or more P2&S
B - Average percent P2&5 of phoa with 10% or more P2O5
1 i_^.
^^
ate beds
phate bed*
;_^,. . _. A-3.0mA-.4m b-i*%
B- 14* SOUTH
meter* 20
10 -
10 TO kttw
STRAnCRAPHIC CORRELATION OF PHOSPHATE BEDS IN ZONES 1.2. AND 3 WITH 10% OR MORE P2Oj
FIGURE 8.- Stratigraphic correlation of phosphate zones in the Turayf phosphate area.
44

about 47 meters, and it is 19.40 meters thick which is much thicker
than it is east of the graben. It contains seven beds of phosphate,
but aggregate thickness of the well-spaced beds is only 3.37 meters f
averaging 20 percent P2°5' The thickest bed of about 1% meters is at
the base of the zone.
Zone 2 phosphate is from 9 to 16 meters below the base of zone V,
east of the Khawr-umm-Wual graben, and possibly as much as 39 meters
below the zone west of the graben as interpreted from drill cuttings
of Aramco S-450 structure test* The zone was penetrated in the TD-1
and TD-2 core holes. It may be present in TC-1, but the core recovery
was too poor through the equivalent depths to confirm this. Zone 2
forms a small outcrop at locality 63, and was exposed by trenching
at locality 86. The zone ranges in thickness from about 2 to 3.10
meters; it has an aggregate thickness of phosphate rock that ranges
from .35 to possibly 2.40 meters. The grade of the phosphate ranges
from 20 to 24 percent.
Tte small outcrop of zone 2 phosphate at locality 63 is the best
and practically only complete exposure of this rock in the Turayf area.
It is at the base of the bank of a large wadi, and consists of a hard,
calcareous bed of phosphate about 1 meter thick. It is fine-to very
coarse-grained with rounded to angular phosphate pellets and a few
chips of chert. About 60 kilograms of this zone 2 phosphate bed
were shipped for analyses to CERPHOS. They upgraded the raw phosphate
45

rock from 20 to 21 percent P-0 to 37 percent ?20- with a recovery* 5 3of 88 percent by calcination followed by washing and .screening to
eliminate the lime (Pouther and Grassart, written commun., 1966).
Zone 3 phosphate is about 10 to 12 mvters below zone 2 and in
the TC-1 and TD-2 core holes, and interpreted from drill cuttings in
Aramco S-450. It ranges in thickness from about 1 to 1.75 meters in
the holes, with an aggregate thickness of phosphate ranging from .52
to 1.75 meters. The grade is 16 or 17 percent po^s*
To summarize, according to surface and subsurface data, zone 1
phosphate underlies an area of roughly 2000 square kilometers east
of the Khawr-unan-Wual graben. The eastern limit of this area is an
imaginary line drawn from locality 86 in the south, northward through
the TA line core holes, between TA-6 and TA-7, then through the TB
line, between TB-23 and TB-24, and north to lat 32°00 I N. near tha Jordan
and Iraq borders. The northern limit is along this line to the Khawr-
umm-TJual graben. The western limit is very roughly along the graben
south to locality 86. The western limit is well defined southward from
about the TB line of core holes, but northward from this line zone 1
crops out along wadi banks in most places befora reaching the edge
of the graben. In the area the zone averages 3 phosphate beds and
has an average thickness of 5.0 meters. Average aggregate thick
ness of the phosphate beds is 2.5 meters, with an average grade of 16
percent P2^5* Average depth to the top of zone 1 in the core holes
46

is 12 meters. Estimated tonnage of P20. in zone 1 in the Turayf area
is about I billion metric tons. Tonnage estimates have not been
computed for zone 2 and zone 3.
The highest grade zone I phosphate in the Turayf area is along
the western end of the TB line of core holes between TB-1 and TB-11
(table 3). Six core holes were drilled offsetting TB-2, TB-3, and TB-4
to partly define the lateral extent of the best area (fig, 9). The
average thickness of zone 1 in this area from core hole data is 6.3
meters, and it contains 4 or 5 beds of phosphate in most places. The
average aggregate thickness of the beds is 3*9 meters, averaging 18
percent P2^5* Assuming a circular lens with a diameter of 10 kilometers
(distance from TB-1 to TB-11) the phosphate beds contain 80,000,000
metric tons of P?^5* Limestone and chert overlie zone 1 in this
circular area with an average thickness of 15 meters*
The friable phosphate in TB-2 is also in TB-2 (third) 0.7 kilo
meter to the southeast, but it is absent in the other TB, or offset
holes« A pit was dug adjacent to TB-2 to examine zone 1, from which
large samples of phosphate were obtained for beneficiation tests.
Although the P20_ tonnage is very high in the Turayf area the
ore is low grade. In most places the ore is hard and firmly cemented
with calclte or silica. Beneficiation tests showed that the hard,
calcareous phosphate rock (zone 2) could be upgraded to a marketable
product by calcination, but costs of such an operation, coupled with
47

Tabl
e 3,
Turayf hi
ghes
t gr
ade
Zone-1 Phosphate
Core
Ho
les
Name
TB-1
'
TB-2
TB-2
bls
TB-2
ter
TB-2
N2
TB-3
TB-3
bis
TB-3
N2
TB-4
TB-4
N1
TB-4N2
TB-7
TB-1
1
Coordinates
-*:
. ;-??
Si"'
f'r-
lat il^'U"!;,
long 39°06'31
ME.
1.00
km.
ea
st of
TB-1
.7 km SE
of TB-2
2 km
N.
of
TB-2
1 km
E.
of TB-2
.6 km
NE
of TB
-3
2 km N
. of
TB-3
1 km E
. of TB-3
1 km
N.
of TB-
4
2 km N
. of T
B-4
1,1 km E
. of
TB-(
lat
31°39'20"N.
long
39°12'56"E.
Tota
l de
pth
[meters)
30,0
0
30f20
34,1
0
45.00
28.0
0
25,0
0
45^00
30,4
0
50.0
5
40.20
30,0
0
35.05
Comp
lete
d
June 2
5,
1967
July
5,
1967
,
Sept
, 24,
1967
Nov. 21
, 19
67
July
15,
1967
Oct.
10,
1967
Nov, 8.
1967
July
23,
19
67
Oct
f 18,
196?
Oct.
19,
1967
Aug. 18,
1967
Sept,
10,
1967
Dept
h (Thick*-
Zone
-1 1
nes
s CmetersXmeters)
3.53-
6.73
3,65
r 10
.70
12.7
1-
20.1
9
20.60-
24.10
17,36-
23.43
7.08-
13.30
13.7
2-
18.0
5
11. SO
- lS, 36
30.73-
37.80
17,7
4-
23.1
0
17.1
5-
26.6
1
32.7
5-41
.25
3.2
7,05
7.48
3,50
6.07
6.22
4.33
7.06
7,07
5f3
6
M*
8.50
No. of
Phos,
Beds 4 5 3 4-4. s|; 4 4;A:
5 ,.;\,
4 4',;
* 6
thic
k
ness
l<8,, i7- 3.
65
l;65
3,87
3.35
' if |f
1,.
?6*
3.80
3,88(7
7,75
(T
5.10
Aver
age
% P2
0§
: i$I ,
^
23%
14%
;
19% 4
:!
20%
18%
16%
- 19%
17%
17%
17%
18%
' . D Am A v* \
f o
,-; ';'
£ mr
Tylf
llmi
t mtt
-"-A
-''.
^
t^prpYf
core
recovery,
5i|ieCl
*Of
f set f
colie »
' '¥
iiw-
* ,
-; %/
';>:*r "
'HOffset h
ole.
Offs
et h
ole.
_
Offs
et h
ole,
?
Poor
cor
e re
cove
ry.
Offs
et h
ole.
TB-5 6
. TB-6 n
ot d
eep
;enough
$
'v?_'
TB-8
incomplete TB-
9 &
TB»10
not
deep enough.

TB
-2N
2T
B-3
N2
TB
-4N
2
N
NO
TE
: T
B-2
ter
and
TB
-3 f
ault
ed
dow
n w
ith
resp
ect
to
TB
-1 a
nd T
B-S
bis
met
ers
3
.5 ki
lom
eter
FIG
UR
E 9
.- F
ence
dia
gram
sho
win
g th
e co
rrel
atio
n o
f ph
osph
ate
zone
1 i
n of
fset
co
re h
oles
of
TB
lin
e of
cor
e ho
les.

the difficulty of supplying the necessarily large quantity of water,
have thus far discouraged any consideration of development in the
area.
COMPOSITION AND MINERALOGY OF THE PHOSPHATE
West Thaniyat area
Prior to the core drilling program at West Thaniyat, a 25-meter
adit was driven in zone 5 at locality 14 to determine if fresh phos
phate was as soft and friable as the weathered material at the outcrop,
The phosphate at the face of the adit is like that at the outcrop.
Two samples of bed 1 and two samples of bed 2, one sample from eachv
bed at the weathered outcrop, and one sample from each bed at the face
of the adit, were analyzed in laboratories of the Tennessee Valley
Authority (Lehr and McClellan, written commun., 1968). Chemical compo
sition of the samples, ground to -80 mesh (U.S. Standard sieve opening
of 0.177 mm) on an as-received basis is shown in table 4.
Table 4. - Chemical composition of West Thaniyat phosphate ores.
.
P2°5
Fe2°3
A1203
Acid insol.
Chemical composition (percent)
Bed 1Outcrop
30.2
0.9
0.7
2.4
Adit
29.2
0.7
1.0
6.6
Bed'2Outcrop
25.2
1.1
1.0
25.9
Adit
23.5
1.2
1.3
28.4
50

The mineral suite in the samples (raw ore) of the two beds are
very similar and include quartz, clay and apatite* The quartz is
detrital sand with particle sizes generally in the range 20 (0.841mm)
to 100 (0.149mm) mesh. Bed 2 contains much quartz, whereas bed 1
contains very little quartz. Two types of clay are in each bed. A
tan*colored clay that is stained by hydrous iron oxide is mainly in
the weathered samples, whereas a pale*green (ferrous iron) clay is
mainly in the adit samples. The phosphate mineral in both beds is
carbonate apatite. It is mainly in oval pellets and as replacement
of fossil fragments which include forms of shell, invertebrate cavity
fillings, bone fragments, and teeth. The composition of the anathite
(in percent) is 55.4 CaO, 0.6 Na90, 0.2 MgOf 38.2 P 0 , 3.1 CO , and25*
4.4 F.
Physical characteristics of bed 1 samples (raw ore) as determined
by dry-screen analysis are shown in table 5.
Dry screen analysis of the bed 1 outcrop sample showod that
about one half of the sample was coarser than 10 mesh (2.00mm); blung
ing and wet screening did not disaggregate most of these coarse agglo
merates. The soft agglomerates of oval apatite lightly cemented by
clay disaggregate readily, but agglomerates with a much higher clay
content and some secondary apatite comont did not. The screen
fractions representing the -10 /80 mesh (-2.00mm /0.177mm) material
is about 40 percent of the total sample and constitute a high grade
51

Table 5» Screen analyses of samples fromjbed JL
Particle size mesh
(U.So Standard)
/10 (/2.00 mm)
-10 /20 '-2.00 mm /0.841 mm)
- -20/40 (-0,841 mm /0.420mm)
-40 /60 (-0.420 mm /0.250mm)
-60 /80 (-0.250 mm /0.177mm)
-80 /I 20 (-0.177 mm /O.I25mm)
-120 (-0.125 mm)
DryAdit
15.7
7.2
13.4
27.6
13.5
8.9
13.7
screened, wt XOutcrop
50.2
11.2
10.3
12.2
4.9
3.6
7.6
Blunged coarse fraction of outcrop sample ,wt«Z
32.0
3.2
2.5
2.5
1.2
0.9
7.7
apatite concentrate with very little clay, traces of dolomite, and
vertually no quartz. Analysis of the bed 1 adit sample showed the
coarse agglomerate to be softer so that a much larger fraction of the
apatite existed in a liberated state (-10 /80) than in the outcrop
sample. The -10 /120 mesh (-2.00 mm /0.125 mm) fractions make up 70
percent by weight of the adit sample constituting a high grade apatite
concentrate with only minor quartz and clay impurities.
52

Bed 2 adit sample had a very weak aggregate structure due In
part to the abundance of the pale green clay, which appears to shrink
on drying and lose its bonding ability* When the agglomerates disag
gregate, the clay readily separates from the phosphate pellets. Quartz,
the principal impurity, shows a normal distribution curve in the -20
/120 mesh (-0.841mm /0.125mm) fractions, as does the green clay aggre-i
gates* Bed 2 outcrop sample is very similar in texture and minerali
composition to the adit material.
Exploratory benef iciation tests were made on a bed 2 adit sample
by J. 6. Get singer and others, of the Tennessee Valley Author tiy
(written commun., 1968). The ore consists of two distinct phases.
One is light-brown sandy phosphate; the other is large lumps of a
reddish-brown clay with little phosphate. Therefore, the weak lumps
of sandy phosphate were crushed, the ore was screened on a 4-mesh
(4.76 mm) screen, and the two phases were analyzed separately (table 6).
Table 6. Analyses of bed 2 phosphate ore, in percent
Fraction
Phosphate (-4 mesh) (-4.76mm)
Clay (M mesh) (M.76mm)
Solids wt.1
87.5
12.5
P2o5
27.3
10.3
CaO
39.9
16.1
M203
1.0
6.8
Fe 0 23
0.9
13.3
Acid insol .
21.3
35.8
F
3.0
-
Ignition loss
4.9
-
SiO -free phos.P20.
34.7
19.5
53

The analysis indicate that the phosphatic fraction (-4 mesh)
might be used to make vet-process phosphoric acid. The combined
percentage of Al 0 and Fe 0 is 1.9 and CaO:P 0- ratio (1.46) ars
about the same as those of Florida pebble phosphate.
Since the phosphate in the ore is very soft, the feasibility of
preferentially grinding the phosphate fine enough to separate it from
the quartz by sizing was investigated. In practice, the ore would be
ground dry and sized with an air classifier, but to save time the size
separation was made in the laboratory by wet screening. The results
are shown in table 7*
The screen analysis (test 1) of the minus one-fourth inch (
sandy phosphate showed that a concentrate of 27.9 percent phosphate
at a grade of 32.3 percent P 0 could be separated by sizing the
unground ore at 100 mesh (0.149 mm). In test 2, part of the ore was
ground in a jar mill for 90 minutes with three-fourth inch (19.05mm)
pebbles. About 81 percent of the phosphate was minuo 100 mesh, and
the grade 31.4 percent P 0 . Some of the plus 100-mesh phosphate was
as coarse as 10 mesh; therefore, another split of the ore was ground
for 60 minutes with one-half inch (12.7 mm) steel balls (test 3).
Nearly all of the phosphate was ground finer than 35 mesh (0.500 ircn).
but this had no effect on the minus 100 mesh solids. The grade and
recovery of phosphate was nearly identical with those of test 2.
54

Table 7. Effect of dry grinding on size distribution of phosphate and quartz in bed 2 phosphate adit sample.
Size action, mesh *
Solid distri bution Wt. 1
P2<3 5 1
Content DistributionAcid insoluble 7-
Content Distribution
e;a L; Crushed to minus ^ inch (6.35mm)
/28(.t .595mm Tyler)
-28 /48Omm /.297mm Tyler)
-48 /65.'^mm /. 2 10mm Tyler)
-65 /100Ldmm /O. I 49mm Tyler)
-100 /200.^9mm /0.074mm Tyler)
-200(- 0.074mm)
Cummulative head
/100
10.1
19.5
24.5
22.0
13.0
10.9
100
76.1
-100 (cone) j 23.9
27.8
25.0
26.0
26.5
32.3
32.3
27.6
26.1
32.3
10.2
17.6
23.1
21.1
15.2
12.7
100
72.1
27.9
-
-
-
-
-
-
-
-
-
-
-
-
-
-
-
-
-
-
iest 2; 400 grams ore ground with 1200 grams 3/4 inch (19.05mm) pebbles for 90 mins
/65 ! 10.5
-65 /100 i 17.2
-100 /325 1 29.5 (/ ,044mm)
-325 ' 42.8 (-. 044mm)
ilummulatlve head j 100
-100 (cone) !; 72.3
14.0
21.4
30.5
32.1
27.9
31.4
5.3
13.2
32.3
49.2
100
81.5
60.7
42.9
14.9
6.0
20.7
9.6
30.8
35.6
21.3
12.4
100
33.7
Test 3; 200 grams ore ground with 600 grams \ inch (12.7mm) steel balls for 60 mins
/65 j 10.9
-65 /100 18.8
-100 (cone) ' 70.3
Cummulative head 100
15.1
19.6
31.4
27.4
6.0
13.4
80.6
100
57.5
45.0
10.7
22.2-
28.2
38.1
33.7
100
55
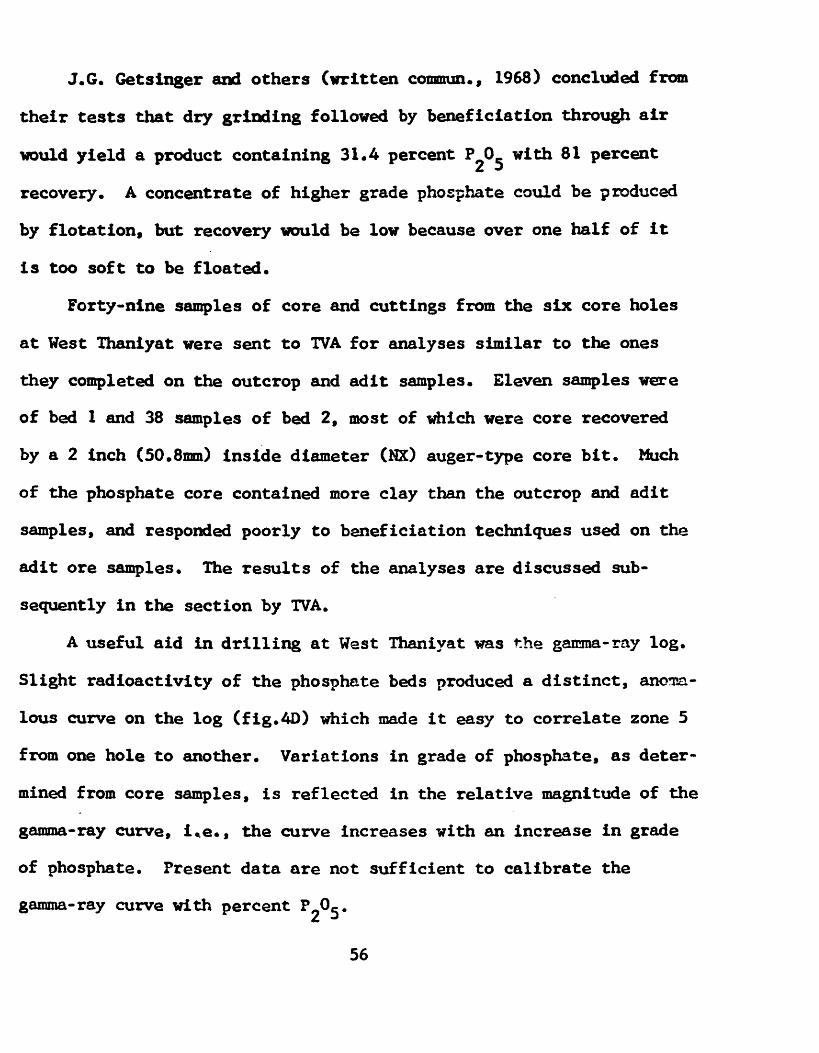
J.G. Getsinger and others (written commun., 1968) concluded from
their tests that dry grinding followed by beneficiation through air
would yield a product containing 31*4 percent P 0 with 81 percent
recovery. A concentrate of higher grade phosphate could be produced
by flotation, but recovery would be low because over one half of it
is too soft to be floated.
Forty-nine samples of core and cuttings from the six core holes
at West Thaniyat were sent to TVA for analyses similar to the ones
they completed on the outcrop and adit samples. Eleven samples were
of bed 1 and 38 samples of bed 2, most of which were core recovered
by a 2 inch (50.8mm) inside diameter (NX) auger-type core bit. Much
of the phosphate core contained more clay than the outcrop and adit
samples, and responded poorly to baneficiation techniques used on the
adit ore samples. The results of the analyses are discussed sub
sequently in the section by TVA.
A useful aid in drilling at West Thaniyat was the gamma-ray log.
Slight radioactivity of the phosphate beds produced a distinct, anonsa-
lous curve on the log (fig.4D) which made it easy to correlate zone 5
from one hole to another. Variations in grade of phosphate, as deter
mined from core samples, is reflected in the relative magnitude of the
gamma-ray curve, i*e., the curve increases with an increase in grade
of phosphate* Present data are not sufficient to calibrate the
gamma-ray curve with percent ^^5.
56
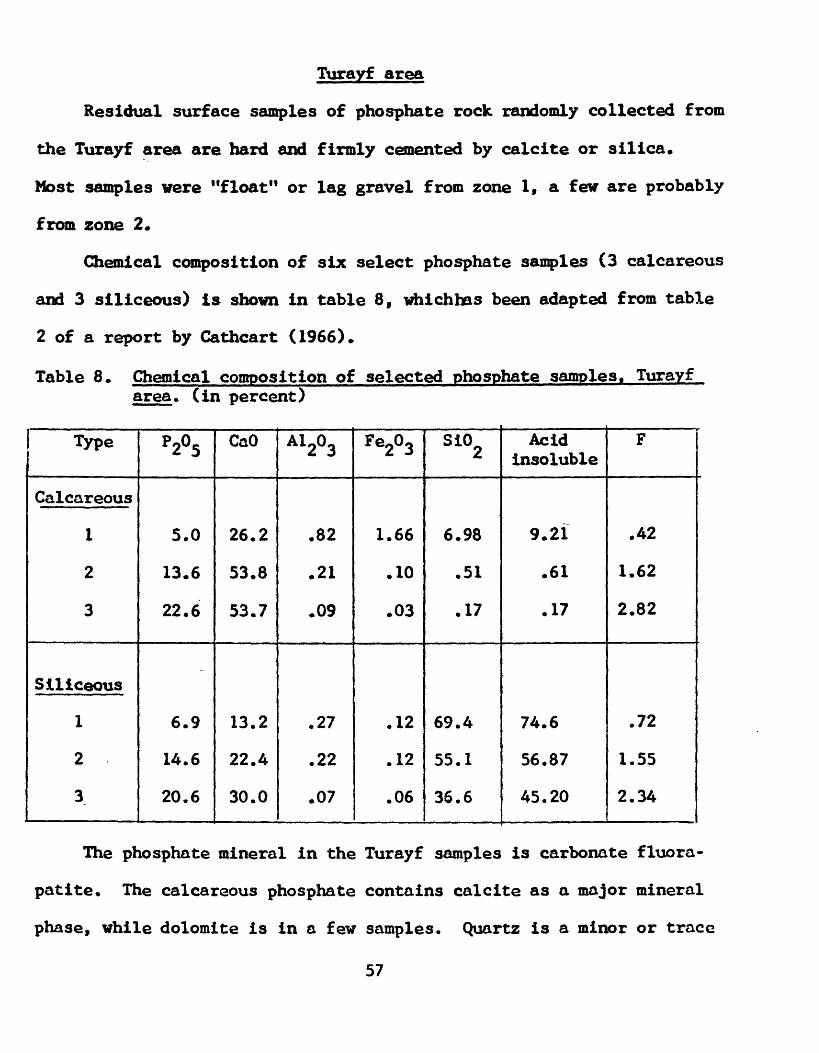
Turayf area
Residual surface samples of phosphate rock randomly collected from
the Turayf area are hard and firmly cemented by calcite or silica.
Most samples were "float11 or lag gravel from zone 1, a few are probably
from zone 2*
Chemical composition of six select phosphate samples (3 calcareous
and 3 siliceous) is shown in table 8, whichhas been adapted from table
2 of a report by Cathcart (1966)*
Table 8. Chemical composition of selected phosphate samples. Turayf area, (in percent)
Type
Calcareous
1
2
3
Siliceous
1
2
3
P2°5
5.0
13.6
22.6
6.9
14.6
20.6
CaO
26.2
53.8
53.7
13.2
22.4
30.0
A1203
.82
.21
.09
.27
.22
.07
Fe203
1.66
.10
.03
.12
.12
.06
Si02
6.98
.51
.17
69.4
55.1
36.6
Acid insoluble
9.21
.61
.17
74.6
56.87
45.20
F
.42
1.62
2.82
.72
1.55
2.34
The phosphate mineral in the Turayf samples is carbonate fluora-
patite. The calcareous phosphate contains calcite as a major mineral
phase, while dolomite is in a few samples. Quartz is a minor or trace
57

constituent in most calcareous samples. The siliceous phosphate always
contains chert-like quartz (cement and groundmass) as a major mineral
phase, and calcite is a minor constituent. Apatite is in all samples,
ranging from small to large amounts. It is mainly oval pellets, and
replacement foraminifera and fragments of pelecypods and gastropods.
The phosphate particles in the calcareous and siliceous phosphate
beds range in size from about 0.1 to 10 millimeters across (from very-
fine sand to fine pebble size); the finer size pellets are more abun
dant.
Exploratory benef iciation tests were made on .the samples. An
attempt was made to crumble the calcareous phosphate by gently grinding
it in a mortar and pestle, but this procedure was unsuccessful. Grind
ing to a size necessary to free the phosphate particles from the cal
careous matrix_caused the phosphate pellets and matrix to disintegrate
into a more or less uniformly size material of about 200 mesh. The
material is too fine for successful commercial separation of phosphate
and calcite by flotation. Calcining at elevated temperatures may cause
the CaCO to break down into CaO and C02 and free the phosphate parti
cles. Screening and flotation after calcining might produce phosphate
of a commercial grade. The phosphate particles in the siliceous phos
phate samples cannot be easily separated from the siliceous matrix.
Although the phosphate particles are softer than the cement, they are so
friable that grinding pulverizes both minerals. The phosphate particles
58

are surrounded by silceous cement, and acidulation was unsuccessful.
One sample, broken into coarse-sand size, was treated with hydrochloric"
acid, and only a small percentage of the phosphate dissolved* The
silica cement surrounding the particles of phosphate effectively
armored the particles against acidulation. Fine grinding of this
material is necessary prior to acidulation, but the final product is
too costly.
To pursue the promising possibility of up-grading calcareous
phosphate rock by calcination, about 110 kilograms of the zone 2
calcareous phosphate at locality 63 were collected for analysis. Here
the zone 2 outcrop is about the only natural exposure of bed rock
phosphate in the Turayf area, and it is fairly representative of the
better grade phosphate of zone 1. About 55 kilograms of sample were
sent to CERPHOS, and about 55 kilograms were sent for comparison to
the U.S. Bureau of Mines metallurgy research center in Albany, Oregon.
The CERPHOS report on the results of their laboratory tests are
encouraging (Pouthier and Grassart, written commun., 1968). They
stated that they were able to obtain a titrate concentrate of more than
37 percent P2^«; ^^ excellent recovery of P20 , and a very good Ca:
?20 ratio. They concluded that the phosphate yields a commercial
concentrate of high quality, following a relatively simple test.
A partial chemical analysis of the sample (on an as- received basis)
gave the following results (in percent): P Oc - 20.5; C00- 19; CaO«54.5;25 *
59

MgO « 0,25; Al 0 » .11; Fe 0 » .24; and SiO~ « 2 or less. 23. 2 3 *
Densimetric analyses were run on grounded and washed samples of
the phosphate by CERPHOS (written commun., 1968) and the results which
are modified and averaged are shown in table 9.
Table 9. Densimetric analyses of calcareous phosphate, Turayf area*
Density
d <2.81
2.81<d<2.95
d>2.95
Cummulative head
Weight %
33
22
14
69
* P2°5
9.6
28.6
34.2
20.8
T. Si<) 2
2.60
.38
.42
1.40
%co2
32
12
7
20.6
Indications from previous tests were that physical methods of
beneficiation such as gravimetric, flotation, or electrostatic would
not produce a product with more than 32 percent P 0 , and that the2 5
phosphate would react best to calcination followed by careful elimin
ation of the lime by washing and screening. The company stressed that
they have a special (step-like) process of post-treating calcinated
phosphate, but they did not disclose the exact procedure. The results
of their tests are shown in table 10:
To summarize, according to Pouthier and Grassart (written commun.,
1968), laboratory calcination tests on the calcareous phosphate rock
showed a recovery by weight of 49 percent, with post-calcination
treatment resulting in a 37 percent P 0 concentrate with 88 percent
60
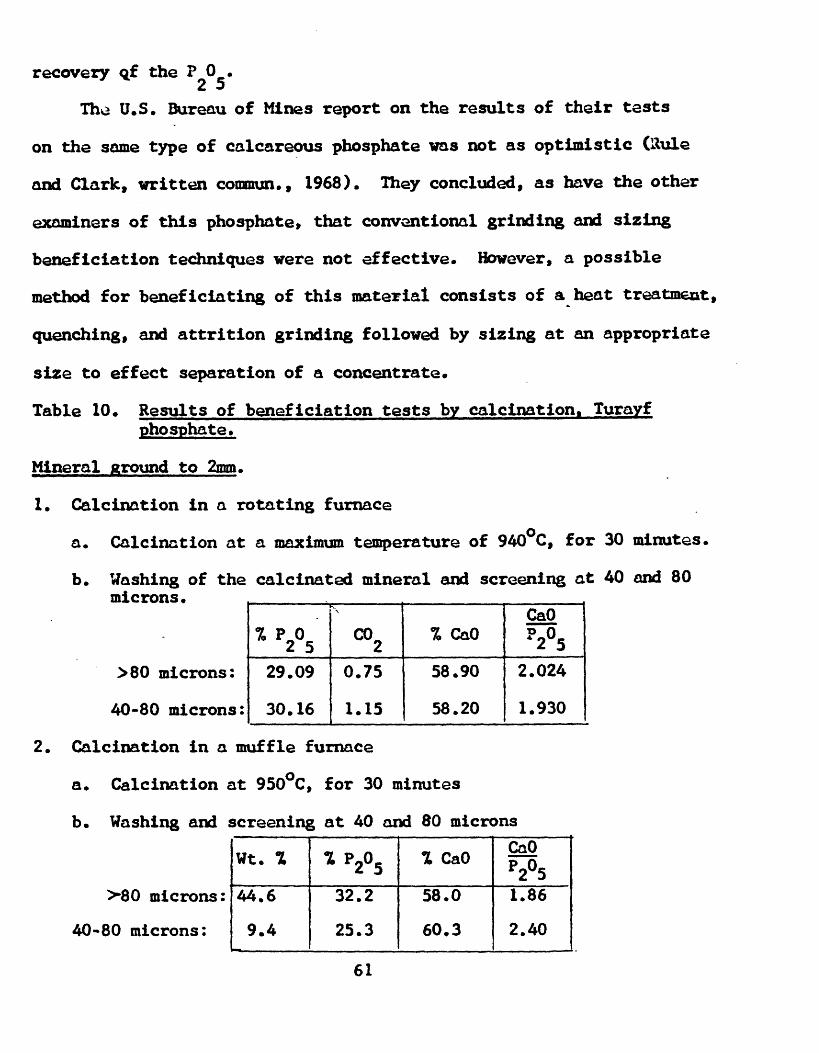
recovery qf the P 0 .
The U.S. Bureau of Mines report on the results of their tests
on the same type of calcareous phosphate was not as optimistic (Rule
and Clark, written commun., 1968). They concluded, as have the other
examiners of this phosphate, that conventional grinding and sizing
beneficiation techniques were not effective. However, a possible
method for benefictating of this material consists of a heat treatment,
quenching, and attrition grinding followed by sizing at an appropriate
size to effect separation of a concentrate.
Table 10. Results of benef iciation tests by calcination. Turayf phosphate.
Mineral ground to 2mm.
1. Calcination in a rotating furnace
a. Calcination at a maximum temperature of 940 C, for 30 minutes.
b. Washing of the calcinated mineral and screening at 40 and 80 microns.
>80 microns:
40-80 microns:
* P2°5
29.09
30.16
*v
0.75
1.15
% CaO
58.90
58.20
CaO P2°5
2.024
1.930
2. Calcination in a muffle furnace
a. Calcination at 950°C, for 30 minutes
b. Washing and screening at 40 and 80 microns
>80 microns:
40-80 microns:
Wt. %
44.6
9.4
* P2°5
32.2
25.3
% CaO
58.0
60.3
CaO P2°5
1.86
2.40
61

Table 10* Results of beneficiation tests by calcination. Turayf phosphate (cont'd).
3. Calcination in a stationary furnace
a. Calcination at 950°C for 30 minutes
b. "Treatment" after calcination followed by screening
>80 microns:
40*80 microns:
>40 microns:
wt. %
33.70
6.45
40.15
%P2o5
36.42
35.00
36.19
% CaO
54.83
56.52
55.10
CaOp^° 2 51.504
1.614
1.522
Recovery P2°5
59.9
11.0
70.9
4. Calcination in a muffle furnace
a. Calcination at 950 C. for 30 minutes
b. Washing and screening.
>80 microns:
>40 microns:
Combined Wt. %
44.24
48.99
% P J> 2 5
37.2
37.1
% CaO
56.02
55.7
CaO P2°5
1.506
i.510
62

Best results were obtained when the phosphate rock was heated to
calcining temperature (1000 C») which produced a concentrate analyzing
29 percent P 0 at a 78 percent recovery. The concentrate can be
considerably improved (up to 351 PJ) ) by selective flotation to
remove calcite gongue, but phosphate recovery is reduced.
Because test results differ between CERPHOS and the U.S. Bureau
of Mines it seems advisable that further analyses of the Turayf phos
phate be made prior to future development considerations.
The gamma-ray logger was not available while core drilling at
Turayf. However, three holes that remained open were logged later
for test purposes. These holes were TB-1, TB-4, and TB-11 and the
phosphate beds in each produced gamma ray "kicks11 on the log. To test
for the percentage of radioactivity in the phosphate a set of eleven
phosphate core samples were sent to the U.S. Geological Survey
Laboratory, Washington, D.C. Four samples were in the 10 to 15 percent
P-0 range; three in the 15 to 20 percent P 0 range and four in the
20 to 25 percent P 0 range. The average percentage equivalent uranium
for the samples in the 10 to 15 percent range was ,0023 percent, for
those in the 15 to 20 percent percent range .0027 percent; anf for
those in the 20 to 25 percent range .0030 percent. Therefore, at
least in this one small collection of samples, there was a slight
increase (.007%) of percentage equivalent uranium from the lower to ths
higher grade phosphate samples. Average percent uranium for all the
samples was .0023 percent.
63

DRY BENEFICIATION OF PHOSPHATE ORE FROM WEST THANIYAT, SAUDI ARABIA
by
Tennessee Valley Authority*
Benef iciation studies were made in 1968 on a sample phosphate
ore taken from an adit driven into an outcrop in a desert region of
West Thaniyat, Saudi Arabia (June 1968 report). The 25% PJ>5 ore was
a mixture of weakly consolidated, light brown, sandy phosphate and
massive lumps of reddish brown clay* The tests of this single sample
indicated that (Da large proportion of the clay could be separated
from the phosphate as an oversize fraction by sizing the dry ore with
a 10-mesh trommel, (2) most of the quartz associated with the phosphate
was coarser than 100 mesh, (3) most of the phosphate was soft enough
to be ground preferentially finer than the quartz, and (4) air classi
fication of the ground material should recover about 80% of the phos
phate as minus 100-mesh concentrate which would contain about 31%
P2°5» Susceptibility of the ore to benef iciation of this dry method
was particularly encouraging because of lack of water in the area of
the deposit.
Subsequent to the test described above, a field survey was made
of the West Thaniyat deposit by representatives of TVA to evaluate
other factors that would affect the practicability of development of
the deposit. This study indicated that if a sufficiently large deposit
* Division of chemical operations, Muscle Shoals, Alabama, Nov. 1969
64 ''

of phosphate comparable in quality to that found at the outcrop could
be proved9 commercial development of the deposit might be warranted,
A drilling program to determine the size and characteristics of the
deposit and further study of other factors that would affect the
development were recommended. Such a drilling program then was con
ducted by the U.S. Geological Survey in 1968 and early 1969. Six
holes were drilled in a pattern behind the face of the outcrop and
a total of 49 core samples resulting from this drilling were submitted
to TVA for further study and evaluation* The present report covers
evaluation of these samples*
Host of the core samples differed in appearance from the adit
sample taken previously from the outcrop. The color was a darker
brown and the lumps were less friable* both of which suggested a higher
clay content* Also, the clay appeared to be intimately associated
with the phosphate -- there was little difference in the color of
size fractions of a given sample* For preliminary analysis, seven
samples, representing a variety in appearance, were selected; results
of the analyses are given in table 11. Six of the samples (Nos. 1,
2, 4, 5, 6, and 7) were screened on 10 mesh to determine whether clay
might be rejected by discarding the coarser lumps before grinding the
ore, as had been successful with the adit sample. The remaining
sample (No.3) was a single coherent core with the appearance of reddish
brown clay, and there were no granular solids that could be separated
65

i ab
le
11.
- \n
al\
sis
of
sele
cte
d c
ore
.sa
mp
les
of S
audi
\rabia
n p
ho
sph
ate
ore
.
Appr
oxim
ate
mine
ral
cont
ent,%
Samp
leNo
. Ho
le
1 WT-2
2 WT
-3a
3 WT-l
*a
1* WT-5
5 WT-5
6 WT-6
7 WT-6
Bed 2 2 2 1 2 2 2
a 2.
76 =
100/
36
Dept
h, m.
1*2.
50-1
*2.8
5
71.2
5-71
-80
61* .0
0-61*
.1*5
38.5
5-38
.85
1*1.
1*2-
1*1.
60
27.9
5-28
.15
28.6
0-28
.85
.2 (intercept
1 r\
riS
T\
f\
i
Size
fr
action,
mesh
Appearance
+10
-10
+10
-10
Redd
ish
sandstone
Lump
s br
ownof clay,
fines
Reddish
clay core,
few
fines
+10
-10
+10
-10
+10
-10
+10
-10
on P205
- ~ .
t J
4 _ .,
Chip
s rock,
Brow
n
Brow
n
Brow
n
axis
).
"] *i
..i»i
~ \
4
of dark g
ray
tan
gran
ules
gran
ular
gran
ular
gran
ular
Anal
ysis
, %
16.1
15-3
16.2
15-5
11.5 1.0
9.8
27.7
27
-3
29.1
30
.7
21* .2
25.2
^Q ~
Acid
insoluble
1*6^5
32.1*
27.3
36.2
91.3
58.7
15 A
16.3
13.6
11.7
25O
25-1
Phos
phat
e,
Clay
,,
2.76
PsOg
8 1.
78x
c
1*1* .
1* 1*
2.2
1*1*. 7
1*2.8
31-7 2.8
27-0
76.5
75-5
80.3
81*. 7
66.8
69.6
..4-
25-5
20
.1
1*0.8
53-2
57-1
10.5
25-5
11* '.
6
10.9
6
.1*
i** i Q
1*
Ctuartz,
0 by
iiff
eren
ce
30.1
37
-7 u'.o
11.2
86.7
47-5 9-1
9-9
8.8
8.9
19*1
21.0
*?
cont
ent
of
quar
tz-f
ret
ore, ^
23.0
21* .6
18.9
16.1
13-0 7-5
18.7
30.5
30.3
31-9
33-7
30.0
31-9
c 1.78 =
100/100
- 1*1
* (i
nter
cept on
ac
id-i
nsol
uble
axis.
Incl
udes
all
forms
of si
lica
(c
hert an
d fl
int)
other
than si
lica
te sili
ca.
by screening. Both the plus 10-mesh and minus 10-mesh fractions of
the samples were analyzed for ?205 and ac id-insoluble content and
the approximate mineral contents were calculated using the factors
derived in the earlier study of the adit sample* The results of these
calculations are included in table 11. The last column in table 11
shows the Po®5 content °f t*le samples calculated on a quartz-free
basis. This value represents the upper limit of P2°5 content that
might be attained by grinding the ore and classifying it at 100 mesh;
the values shown could not be fully achieved in a practical operation
because some of the phosphate cannot be ground preferentially to minus
100 mesh and some of the quartz is originally finer than this size.
The samples of highest P205 content, 24 to 30% ?2°s' were those
(Hos.5, 6, and 7) with a brown granular appearance. Screening these
materials at 10 mesh was ineffective in increasing ?2®5 content > tne
t>lus 10-mesh fractions had about the same PO^C contents as t*le fine
material. The potential maximum PO^S contents °f these samples,
assuming removal of quartz, were calculated to be 30 to 32%. The
samples of next highest P20- content (15-16% P^) were No.l, which
had a reddish sandstone appearance, and No.2, which consisted of
brown fines and large lumps of clay-appearing material. Screening
at 10 mesh likewise was of no benefit with these samples; the P2^5
content of tha plus 10-mesh fractions was even higher (16 vs. 15%) than
that of the minus 10-mesh fractions. By elimination of quartz, the P2
content of sample No.l would be increased to about 23%, but that
67

of sample Ho*2 would increase only to about 16 to 18%. Sample lTo.3,
the one that consisted of a single coherent core with the appearance
of reddish brown clay, contained only 11% Po^5* ^ a <Iuart2~free
basis, the P^O. content would be 13%. The final sample (No.4) con
sisted of chips of dark gray rock (chert) and tan granules. The P^5
content of the plus 10-mesh fraction was only 1% as compared with
about 10% for the minus 10-mesh fraction. On a quartz-free basis,
?2®5 content of the latter fraction would be about 18%.
The results of these preliminary tests indicated that the deposit
contains some seams or lenses of clay and chert that probably could
be separated from the phosphatic material by selective mining. However,
other clay is too intimately associated with the phosphate to be
separated from it by sizing of the ore. Although some of the samples
may have contained finely divided clay that was originally present
as massive clay but was reduced to fines by the coring process, it
is not likely that the airount of such action was sufficient to negate
the results of the tests.
Since the preliminary tests indicated that a separation could
not be made of a significant portion of the clay fraction of the ore
by coarse screening as was done on the adit sample, more extensive
tests were conducted to determine response of the ore to benef iciation
by grinding and screening. Each of the 49 samples was analyzed for. ..
P00c and acid insolublo contv»nts and calculations *rcre nad^ of the «i *
^2^5 content on a quartz-free (acid insoluble) basis. The results
68

of these analyses are given in table 12. The samples are listed in
the order indicated by the drilling log, so that zones of maximum
?2^5 concentration can be identified by the analyses of sonsecutive
samples* The last column of table 12 indicates the groupings of
samples, based on analyses and the drilling log, that were used for
preparation of composite samples for actual beneficiation tests.
Most of the ore from hole WT-1 was low in ?2®5 on^7 one sample
contained as much as 20%* However, two samples (Nos.6 and 7), which
represented a 0.75-meter depth of ore, offered some promise of yield-
lug a useful concentrate (silica-free fraction, so they were composited
for grinding and sizing tests (composite Cl). The compositing weights
were proportional to the thickness of ore represented.
None of the samples from hole WT-2 merited further testing.
In hole WT-3A, sample No. 12, which came from the top of bed 1,
contained little ?205 (2.5%) or acid insoluble (16.5%). Additional
analyses showed it to contain 27% CaO and 36% C02 . Since the excess
CaO (over that needed to combine with the P?0(S^ was ecluivalent to
only about half of the CC^t it was concluded that the sample consisted
principally of dolomitic limestone. Samples Hos.13 and 14 from a
lower depth in this bed effsrvesced vigorously when tested with acH;
these samples were composited (composite C2) for testing in order to
learn how the limestone would behave in the dry baneficiation process.
Four samples representing the lower half of bed 2 of hole WT-3A (samples
69
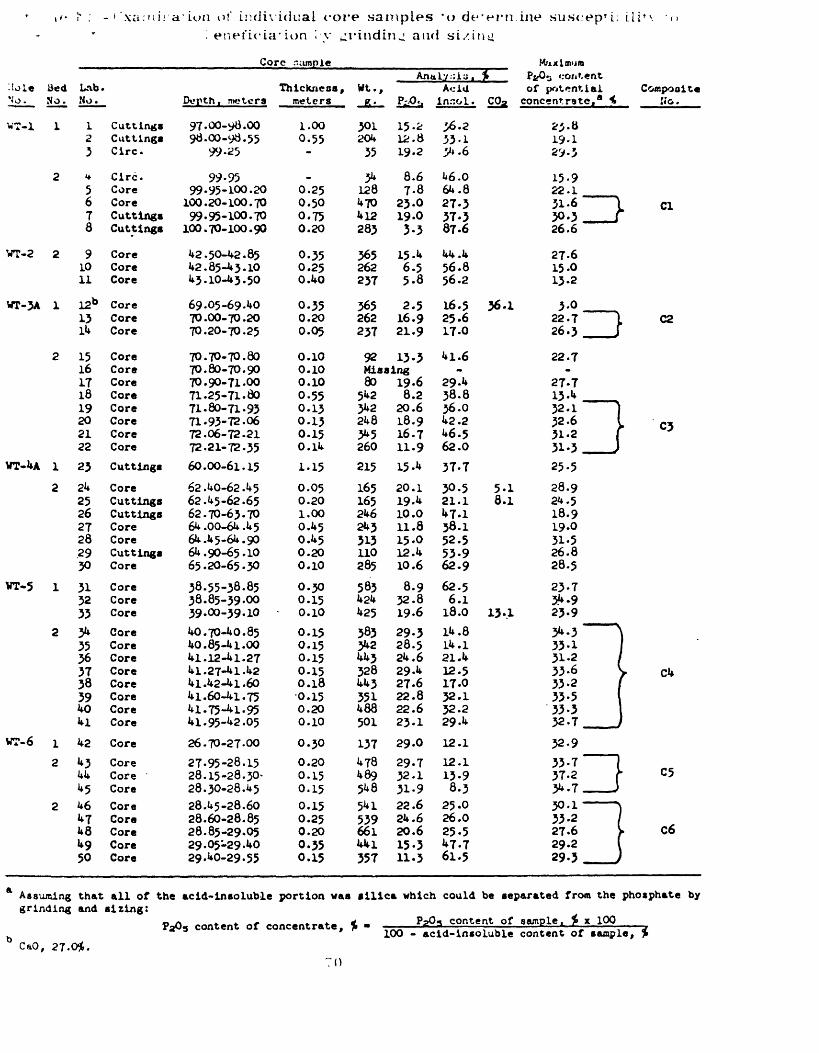
- > "xa:nira'ion of individual rore samples *o dfern.ine suseepT i. . enet'u'ia'ion '. y ^rindin^ and
Core sample
-!ole BedNo. No.
W7-1 1
2
WT-2 2
WT-3A 1
2
VT-UA i2
WT-5 1
2
wr-6 i2
2
Assuminggrinding
Lab.No.
123
«5678
9101112b
1314
1516171819 20 21 22
232425262728.2930
3132333U35363738394041
42
4344454647484950
thatand
CuttingsCuttingsCirc.
Circ.CoreCore CuttingsCuttings
CoreCoreCore
CoreCoreCore
CoreCoreCoreCoreCore Core Core Core
Cuttings
CoreCuttingsCuttingsCoreCoreCuttingsCore
CoreCoreCore
CoreCoreCoreCoreCoreCoreCoreCore
Core
CoreCoreCoreCoreCoreCoreCoreCore
all of thesizing:
Depth, meters
97.00-98.0098.00-98.55
99.25
99-9599.95-10O.20
100.20-10O.70 99.95-100.70
100.70-100.90
42-50-42.8542.85-43.1043.10-43.50
69.05-69.4070.00-70.2070.20-70.25
70.70-70.8070.80-70.9070.90-71.0071.25-71.8071.80-71-93 71- 93-72. 06 72.06-72.21 72.21-72.35
60 .00-61. 15
62.40-62.4562.45-62.6562.70-63.7064.00-64.4564.45-64.9064.90-65.1065.20-65.30
38.55-38.8538.85-39.0039.00-39.10
40.70-40.8540. 85 -4 1.0041. 12-41. 2741.27-41. 424l.42-4l.604l.60-4l. 7541.75 -41.9541.95-42.05
26.70-27.00
27.95-28.1528.15-28.30-28.30-28.4528.45-28.6028.60-28.8528.85-29.0529.05-29.4029.40-29.55
acid- in soluble
Thickness,meters
1.000.55-
_0.250.50 0.750.20
0.350.250.40
0.350.200.05
0.100.100.100-550.13 0.13 0.15 0.14
1.15
0.050.20l.OO0.450.450.2O0.10
0.300.150.10
0.150.150.150.150.18 0.150.2O0.10
0.300.200.150.150.150.250.2O0.350.15
portion was
AnaWt.,
L:/;;iu. %Acid
g-._ Pi£'-> Insol. C02
301204
35
34128470412283
365262237
365262237
92
15.*1^819.2
8.67.8
23.0 19.03-3
15.46.55.8
2.516.921.9
13-3
36.233-1p.6
46.064.827-3 37-387.6
44.456.856.2
16.5 36.125.617-0
41.6
MaximumP^OU contentof potential CoiRpooitc
concentrate,* It KG.
2J.819-129.3
15.922.131.6 > d 300 ___ I26.6
27.615.013.2
3.022.7 . C226.3
22-7Missing80
542342 248
260
215
165165246243313110285
583424425
3833421*43328443351488501
13747848954854153966144i357
19.68.2
20.618.9 16.7 11.915-4
20.119.410.011.815.012.410.6
8.932.819.629.328.524.629-427-622.822.623-1
29-0
29-732.131.922.624.620.615-311.3
silica which
* y*3 ww** wen w w* wv
29-438.836.0 42.2 46.5 62.0
37-7
30.5 5-121.1 8.147.138.152.553-962.9
62.56.1
18.0 13.114.814.121.412.517.032.132.229.412.1
12.113-98.3
25-026.025.547.761.5
27-713- 1*32.1 }?2 '6 V CJ 31.2 f *31-3 ___ }25-5
28.924.518.919-031.526.828.5
23.73^.923.93*0 N33-131.2 /33-6 V ck33-2 f33-5 I33032.7 ___ /32.933.737.2 ta C5'M* .730.1 \33-227-6 V C629-2 I29-3 ___ )
could be separated from the phosphate by
5 content of100 - acid-insoluble
sample i % x 100content of sample, %
b CaO, 27-0%.

Nos. 19-22) were composited (composite C3) because they showed some
promise of response to benef iciation although they contained only 12
to 21% ?20. before benef iciation.
From hole WT-4A, only one sample (Ho.28) shoved promise of sig
nificant response to benef iciation, and it contained only 15% P2°5*
The ore from holes WT-5 and WT-6 was of higher grade than that
from the other four holes. The high-grade ore in bed 1, however, was
considered too thin (0.15-0*30 meter) to be of commercial significance.
All of the samples from bed 2 of hole WT-5 were suitable for testing,
so they all were included in a single composite (composite C4). The
ore from the upper part of bed 2 of hole WT-6 was composited separately
(composite C5) from that in the lower part (composite C6) because there
were significant differences in quality.
Preliminary grinding and sizing tests indicated that the benefi-
ciation conditions used in treating the adit sample in 1968 were suitable
for the drill core composite samples. Pebbles were slightly more
effective than steel balls in preferentially grinding the phosphate,
and sizing at 100 mesh afforded the best compromise between recovery
of phosphate and rejection of quartz. For the beneficiation tests,
a 300-gram portion of each composite was ground for 90 minutes with
900 grams of 3/4-inch pebbles, and the ground solids were screened
wet on 65- and 100-mesh screens. Wet screening was used only for
convenience. In actual practice, a dry air classification would be used.
71

The resulting size fractions were dried , weighed, and analyzed. The
results are given in table 13. A plot of the P^O. contents versus
the acid -insoluble contents of the fractions (fig, 10) gave a relation
similar to that obtained for the outcrop ore. and factors derived
from this plot were used to estimate the approximate mineral contents
of the fractions, which are included in table 13 The degrees of
benef iciation achieved by the treatment are evident from table 13
by comparing the P20_ concentrations in the head samples with the
corresponding P-0. concentrations in the minus 100-mesh concentrates.iL *i
Percent recoveries of the head P^O as minus 100-mesh concentrates
are given under the heading "P^O distribution, ^,"
Results of the benef iciation tests show that the core samples
resembled the outcrop ore in two respects: (1) most of the silica was
plus 100 mesh and (2) most of the phosphate could be ground preferen
tially to minus 100 mesh. However, the core samples contained con
siderably more clay than the outcrop ore, and as has been discussed,
this clay was not removable by initial sizing such as had been effec
tive with the outcrop sample. The clay content of the six core
composites was about as great as the silica content. Since the clay
was ground along with the phosphate, enrichment was impaired and the
iron and aluminum contents of the concentrates (-100 mesh fractions;
table 13) were relatively high. The lime content of the core compo
sites also was greater than that of the outcrop ore. The
72

Table 13.> aeneficiation of composited core aaaples of Saudi Arabia Phosphate
Core samples SizeComposite fraction,
No. Lab. No. nesh
Cl 6 and 7 /65 -65-100
Cua.
C2 13. 14 ^65 -65 -100
CUB.
C3 19-22 f65 -65 -100
CUB.
C4 34-41 /65 -65 -100
Cum.
C5 43-45 /65 -65-100
Cum.
C6 46-50 /65 -65 -100
Cua.
Q6a 46-48 /65 -65 -100
CUB.
a 2.63 x P203 . 2.63 -
b 1.82 X. 1.82 -
110O
head
,
head
tm
head
AOO
head
/100
head
noo
head
SlOO
head
by dry grinding and wet screening
Solids Analysis. 1distribu tion. 1
16.8 11.3 71.9
100
14.2 7.8
78.0
100
33.4 9.4 57.2
100
8.7 8.7 82.6
100
17.7 17.4 64.9
100
13.0 15.0 72.0
100
4.0 15. 0 81.0
100
10038 (intercept on P
100
10.1 18.324.0
21.0
26.7 31.5 17.1
19.6
4.3 10.3. 24.9
16.7
7.9 18.9 28.0
25.5
27.5 31.3 31.8
31.0
8.1 12.9 21.9
18.8
17.6 16.7 24.9
23.4
C»0 A1203
14.6 26. S 35.5 3.0
31.0
40.5 46.3 27.5 7.7
30.9
S.O 18.0 39.5 1.6
26.9
12.0 28.7 42.7 1.6
38.8
40.3 45.9 47.1 1.3
45.7
14.4 20.7 39.9X 1.9,
37.3
24.7 23.1 39.1 2.5
36.1
Acid
69.8 49.6
3.3 22.5
33.5
13.3 7.0
4.3 28.3
24.5
87.0 69.8
l.l 23.7
49.2
76.4 49.3
2.1 15.7
23.9
25.6 16.7
2.9 7.8
12.5
77.4 63.4
3.6 24.6
37.7
51.6 56.5
4.4 18.7
25.7
C02 (1.4 1.5 3.0
2.6
5.53.4 3.7
3.9
0.8 l.L 3.2
2.2
I.I 2.0 2.7
2.5
1.8 2.0 3.0
2:6
0.8 1.1
3.9
1.1 1.0 4.4
3.7
Ratio,
1.45 1.45 1.48
1.47
1.52 1.47 1.61
1.59
1.86 1.75 1.59
1.69
1.52 1.52 1.53
1.53
1.47 1.47 1.48
1.48
1.78 1.60 1.82
1.78
1.40 1.38 1.57
1.54
^*2^c distribu tion. 1
8.1 9.8
82.1 ,
100
19.3 12.5 68.0
100
8.7 5.8
85.5
100
2.7 6.5
90.8
100
15.7 17.6 66.7
100
5.6 10.3 84.1
100
3.0 10.7 86.3
100
Approximate aineral content, "L
Phosphate* Clay0 SUicac
27 48 63
55
70 9345
52
11 27 65
44
21 50 74
67
72 8283
81
21 34 58
49
46 44 65
62
6 4
26
21
30 0
49
42
3 6
20
13
52
19
16
4 2
16
11
3 5
32
24
4 0 29
23
67 48 11
24
07 6
6
86 67 15
43
74 48 7
17
24 16 I
8
76 61 10
27
50 56 6
IS
205 axis)
130 - 45 (Intercept on acid-insoluble axis)
X - 100 - (2.63 P20 5 / acid insoluble)
c By difference.
73

40
30 -
20 -
10 -
20 40 60
Ac id-insoluble matter,
100
Figure 10.- Relation between P205 and acid-insoluble contents of size
fractions of dry-ground Saudi Arabian phosphate ore
74

ratio in the composites ranged from 1.47 to 1.78 as compared with 1.46
in the outcrop sample. The beneficiation treatment afforded no signi
ficant separation of limestone from phosphate - the average ratio of
CaO:P20- in the concentrates (1.58) was about the same as that in the
head composites (1.59).
Only composite C5 yielded a concentrate that contained more than
28% P 0. The relatively high P (L content (31.8%) of this concentrate 25 25
was due to the high initial P 0 content (31.0%) of the ore composite,
rather than to the beneficiation treatment. Enrichment due to the
treatment was negligible. The concentrate of next highest P 0- content
(28.0% P 0 ) was from composite C4. The beneficiation treatment of this
composite raised the grade from an initial 25.5% P 0 content, and recovery25
as concentrate was 90.8%. The concentrates from composites Cl, C3, and
C6 contained 21.9 to 24.9% ?20 as compared with initial P^O concen
trations of 16.7 to 21.0% in the ore (head sample). Recoveries of P 0
were 82 to 85%. The remaining concentrate, from composite C2, contained
only 17.1% P 0 . This composite did. not contain as much limestone as
expected, but contained a large amount of clay instead. Because of its
high clay and low quartz content, the plus 100-mesh fraction of this
sample was of higher grade (19.6%) than the minus 100-mesh fraction,
although most of the phosphate was in the fines.
The results of these dry-beneficiation tests are unpromising.
Also, because of the softness of the phosphate, wet methods of benefi
ciation such as flotation or washing probably would result in low
75

recovery of phosphate* Ho further work with the ore is planned.
Summary
Previously (June 1968 report) study of the beneficiation of a
sample of phosphate ore from a deposit located in West Thaniyat,
Saudi Arabia* had indicated promise for a benef iciation method that
involved (1) screening at 10 mesh to remove clay lumps, (2) dry grind
ing of the minus 10-mesh material to preferentially pulverize the
phosphate in the presence of quartz impurity, and (3) air classifi
cation at 100 mesh to separate the pulverized phosphate from the quart;
In an extension of this study, 49 core samples from the same deposit
now have been evaluated, with the conclusion that this type of benefi-
ciation would not be applicable to the bulk of the ore in the deposit.
Most of the core samples were much higher in clay content than the
sample tested previously, and this clay was not in a lump form that
could be separated by coarse screening. Tha clay was so soft that it
remained with the phosphate throughout the later grind ing-sizing
procedure. Of concentrates prepared by beneficiation of six composite
samples that represented the more promising areas of tha deposit, only
one contained more than 28% Po^5» anc^ tne P2^5 concentration (31.8%)
in this concentrate was not significantly greater than that (31.07«)
of the sample before beneficiation. Concentrates from the other
composites ranges in P?^s content from 17 to 28% as compared with
PpO contents of 17 to 25% in the unbeneficiated samples. Because
of the softness of the phosphate, wet methods of benef iciation such
76

as flotation or washing probably would result in low recovery of phos
phate* No further work with the ore is planned.*
Appendix
The data for the composite sample C-6 representing the lower
portion of bed 2, hole WT-6 (Lab. Samples 46-50, table 12) indicated
significant differences from sample C-5, representing the upper part
of bed 2, hole WT-6. A major factor contributing to this difference
was the inclusion of fractions in the composite C-6, which were not
representative of the best ore in the bed* The inclusion of the lower
two fractions, Lab. Samples 49 and 50 (table 12) in composite C-6,
had a distorting effect on the composition of the sample and its
response to beneficiation. A new composite, C-6a, was prepared from
weighted portions of samples, Lab. Nos. 46, 47, and 48 (table 12) and
this composite sample was treated by the benef iciation procedure used
on the other drilling sample composites. The results of the tests
on sample C-6a are shown in table 13.
The data in table 13 show that exclusion of the low-grade fractions
from the composite representing the lower portion of bed 2, hole WT-6,
resulted in significant upgrading of the head sample. The sample C-6a
contained much less silica, slightly less CaO, but significantly more
?20 . The CaO/P^O ratio was about normal. However, sample C-6a
showed less response to benef iciation than sample C-6 because most of
the clay fraction appears to have remained with the partials in the
77

new composite and reported with the minus 100-mesh portion as might
have been expected. Evaluation of hole WT-6 on the basis of composite
C-6a, rather than composite C-6, raises the overall quality of the
ore represented by hole WT-6. However* the ore at WT-6, already
considered to contain the highest quality ore found at West Thaniyat,
continued its poor response to beneficiation by the technique tested.
REFERENCES
Bramkamp, R.A., Brown* G.F., Holm, D.A., and Layne, N.M. Jr., 1963,
Geology of the Wadi as Sirhan quadrangle, Kingdom of Saudi Arabia:
U.S. Geol. Survey Misc. Geol. Inv. Map I200A.
Bramkamp, R.A., Ramirez, L.F., Steineke, Max, and Reiss, W.H., 1963,
Geology of the Jawfi-^akakah quadrangle, Kingdom of Saudi Arabia:
U.S. Geol. Survey Misc. Geol. Inv. Map I-Z01A.
Cathcart, J.B., 1970, Phosphate deposits in the Jawf-Sakakah basin,
Kingdom of Saudi Arabia, Part III: Preliminary observations on
texture and composition: U.S. Geol. Survey open file report.
(IR) SA-83, 23p.
Meissner, C.R., Jr., 1970, Phosphate rock of West Thaniyat, Sirhan-
Turaif (Jawf-Sakakah) basin, Kingdom of Saudi Arabia: U.S. Geol.
Survey open file report. (IR) SA-94, 8 p.
Mytton, J.W., 1966, Geologic map of the Turaif phosphate area, Kingdom
of Saudi Arabia: Saudi Arabia Ministry Petroleum and Mineral Inv.,
Map MI-3, 1:100?000.
Mytton, J.W., 1967, Phospahte deposits in the Jawf-Sakakah basin:
Kingdom of Saudi Arabia, Part II, Thaniyat Turaif and Quraymiz:
U.S. Geol. Survey open file report (IR) SA-74, 20p.

Powers, R.W., Ramirez, L.F., Redmond, C.D., and Elberg, E.L., Jr., 1966,
Geology of the Arabian Peninsula, Sedimentary Geology of Saudi
Arabia: U.S. Geol. Survey Prof. Paper 560-D p. D1-D147.
Sheldon, R.P., 1967, Discovery of phosphate rock in Saudi Arabia and
recommended program ̂ o^ further study: U.S. Geol. Survey open
file report (IR) SA-22, 9 p.
Steineke, Max, and Bramkamp, R.A., 1952, Stratigraphical introduction
in Antsell, W.S., Jurassic ammonities from JObel Tuwai^, Central
Arabia: Royal Soc. (London) Philas., Trans., ser. B., v.236,
p. 241-313.
79