saudi economic chartbook - riyad capital economic chartbook - august... · emirates nbd pmi new...
TRANSCRIPT

Hans-Peter Huber, PhD Chief Investment Officer Riyad Capital P.O. Box 124232 Riyad 12345 www.riyadcapital.com
Saudi Economic Chartbook
August 2016

Saudi Economic Chartbook August 2016
Page 1
Table of Contents:
GDP Data ………………….…………. 2
Monetary and Financial
Indicators ………………………….… 3
Private Spending and
Foreign Trade …............................ 6
Non-Oil Business Climate
Indicators …………………...……….. 7
Inflation Indicators ……………... 8
Real Estate Market …………….... 9
Oil Market …….………………….... 11
Foreign Exchange and
Interest Rates …….………...…..... 12
Saudi Balance of Payments…. 14
Equity Market …..……………...... 15
Facts and Figures
at a Glance …….……………......... 16
Saudi Business Climate Indicators
The Purchasing Manager
indices are based on a
survey of about 400 Saudi
companies in the Non-oil
sector. Values above 50
indicate an expansionary
trend.
source: Markit, Emirates NBD
Most recent GDP data show that the overall economy grew by 1.5% in the
first quarter 2016 year-over-year. While the oil sector expanded by a solid
5.1%, real growth of the non-oil private sector declined to 0.2% over the
same period.
Monetary and financial indicators point towards a continued slowdown of
the non-oil economy into the second quarter. At the same time, private
spending indicators suggest a stabilization towards mid-year.
Business climate indicators, in particular, have started to pick-up in June and
July providing first tentative signs of an economic rebound for the non-oil
economy (see figure below).
CPI inflation has gradually retreated in the last months after its pick-up due
to energy price hikes at the beginning of this year, thereby providing evi-
dence for the absence of any broad based inflationary pressure.
Saudi and overall OPEC crude oil production have picked up towards record
levels by mid-year. Meanwhile, Saudi crude exports have declined from their
peak level at the beginning of the year.
Balance of payments figures for the first quarter 2016 show a gradual im-
provement in the current account as well as in the financial account balance.
The Saudi equity market has been range-bound with low transaction vol-
umes in the recent months. Remarkably, foreign investors have been net
buyers over the last 4 months in a row.
The Saudi Economy in Transition to Recovery
Saudi Purchasing Manager Index Composite
Saudi Purchasing Manager Index New Orders

Saudi Economic Chartbook August 2016
Page 2
Figure 3: GDP Overall Economy and Non-Oil Private Sector
source: GASTAT
Figure 1: Real GDP Overall Economy and Oil Sector
source: GASTAT
Figure 2: Nominal and Real GDP Non-Oil Private Sector
Real GDP growth Overall economy, quarterly % yoy Real GDP growth Non-oil private sector, quarterly % yoy
Gross Domestic Product (GDP) Overall Economy and Institutional Sectors
In the first quarter 2016 the overall economy grew by 1.5% year-over-year. The Oil sector grew by a robust 5.1%. Meanwhile, real and nominal growth rates of the Non-oil private sector declined to 0.2%
resp. 0.5%. This also implies a drop of the Non-oil private sector GDP deflator to 0.3% which clearly diverges from the spike of CPI inflation caused by energy price increases in the first quarter.
Real yearly GDP growth Overall economy
Figure 4: GDP Deflator and CPI Inflation
source: GASTAT, RC source: GASTAT
Real yearly GDP growth Non-oil private sector
Real GDP growth Oil-sector, quarterly % yoy Nominal GDP growth Non-oil private sector, quarterly % yoy
GDP deflator Non-oil private sector % yoy
CPI inflation % yoy
Saudi Economic Chartbook August 2016
Page 3
Figure 3: Growth of Credit to the Private Sector
source: SAMA
Figure 1: Growth Rate Monetary Base and Aggregate M1
source: SAMA
Figure 2: Growth Rate Monetary Aggregates M2 and M3
Monetary base, % yoy
Aggregate M1, % yoy
Aggregate M2, % yoy
Figure 4: Growth of Commercial Banks’ Deposits
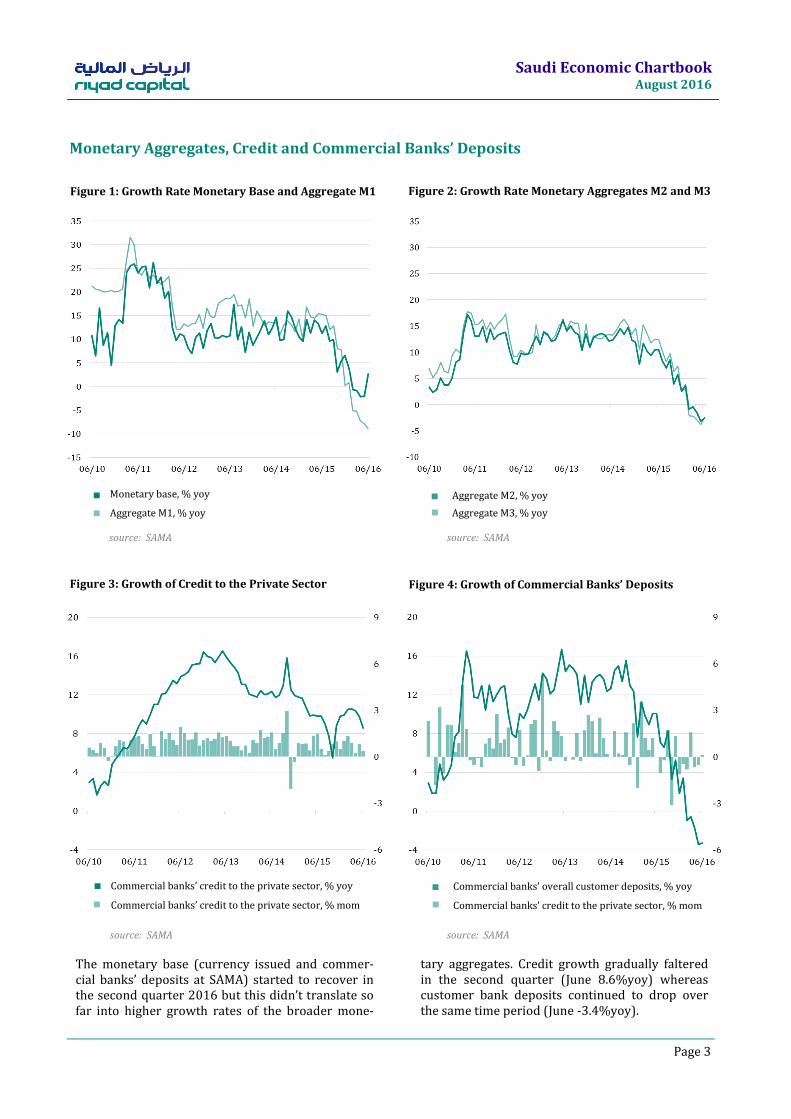
The monetary base (currency issued and commer-cial banks’ deposits at SAMA) started to recover in the second quarter 2016 but this didn’t translate so far into higher growth rates of the broader mone-
tary aggregates. Credit growth gradually faltered in the second quarter (June 8.6%yoy) whereas customer bank deposits continued to drop over the same time period (June -3.4%yoy).
source: SAMA source: SAMA
Commercial banks’ credit to the private sector, % yoy Commercial banks’ overall customer deposits, % yoy
Aggregate M3, % yoy
Monetary Aggregates, Credit and Commercial Banks’ Deposits
Commercial banks’ credit to the private sector, % mom Commercial banks’ credit to the private sector, % mom

Saudi Economic Chartbook August 2016
Page 4
source: SAMA
Figure 3: Loan-Deposit-Ratios in the Long Term
source: SAMA
Figure 1: Private Sector Loan-Deposit-Ratio
source: SAMA
Figure 2: Government Sector Loan-Deposit-Ratio
Credit to the private sector as % of total bank deposits Credit to the government as % of total bank deposits
Figure 4: Overall Loan-Deposit-Ratio in the Long Term
The private loan-deposit-ratio of commercial banks has reached 90% in June 2016, a level last seen in 2008. The government’s loan deposit ratio also con-tinued to rise from 10.0 in March to 12.7 in June
which, however, is still a low level compared to beginning of last decade when government debt was significantly higher than today.
Credit to the private sector as % of total bank deposits Credit to private sector and government as % of total
bank deposits
source: SAMA
Commercial Banks’ Loan-Deposit-Ratios
Credit to the government as % of total bank deposits

Saudi Economic Chartbook August 2016
Page 5
source: SAMA
Figure 1: Foreign Currency Reserves at SAMA
source: SAMA
Figure 2: Government SAR Deposits at SAMA
Total foreign currency reserves at SAMA, in bln SAR, l.h.sc.
Monthly change in foreign currency reserves at SAMA, in
bln SAR, r.h.sc.
Total government deposits at SAMA, in bln SAR, l.h.sc
After a diminishing depletion of foreign currency re-serves in the first months of this year, culminating in a small net inflow in May, the month of June showed again an outflow of about 40bln SAR. Meanwhile, gov-
ernment deposits at SAMA stabilized in the second quarter of 2016 also as a result of the govern-ment’s funding on local and international capital markets.
source: SAMA source: SAMA
Total foreign currency reserves at SAMA, in bln SAR Total government deposits at SAMA, in bln SAR
Monthly change in total government deposits at SAMA,
in bln SAR, r.h.sc.
SAMA Balance Sheet: Key Elements of Assets and Liabilities
Figure 3: Foreign Currency Reserves at SAMA in the
Long Term
Figure 4: Government SAR Deposits at SAMA in the
Long Term
Saudi Economic Chartbook August 2016
Page 6
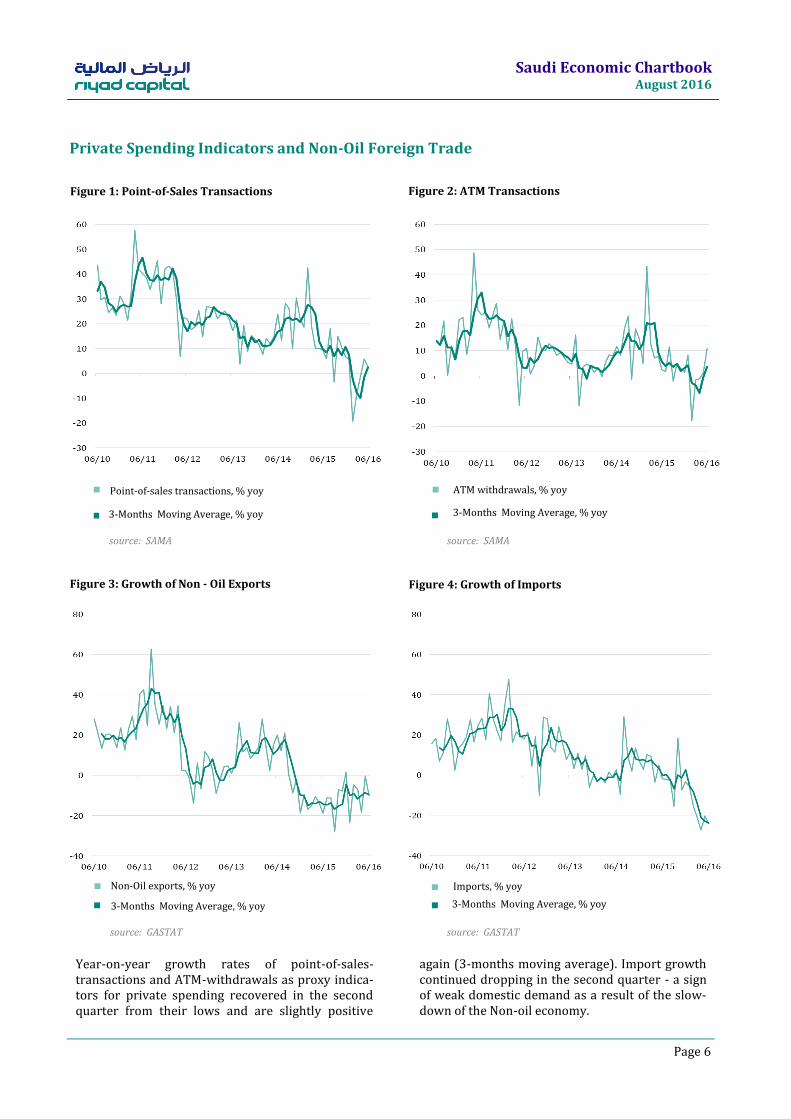
Figure 3: Growth of Non - Oil Exports
Figure 1: Point-of-Sales Transactions Figure 2: ATM Transactions
Figure 4: Growth of Imports
Year-on-year growth rates of point-of-sales-transactions and ATM-withdrawals as proxy indica-tors for private spending recovered in the second quarter from their lows and are slightly positive
again (3-months moving average). Import growth continued dropping in the second quarter - a sign of weak domestic demand as a result of the slow-down of the Non-oil economy.
source: GASTAT source: GASTAT
Non-Oil exports, % yoy Imports, % yoy
3-Months Moving Average, % yoy 3-Months Moving Average, % yoy
Private Spending Indicators and Non-Oil Foreign Trade
source: SAMA source: SAMA
Point-of-sales transactions, % yoy
3-Months Moving Average, % yoy
ATM withdrawals, % yoy
3-Months Moving Average, % yoy

Saudi Economic Chartbook August 2016
Page 7
Figure 3: Purchasing Manager Index New Orders
source: Markit
Figure 1: Purchasing Manager Index Composite
source: Markit
Figure 2: Purchasing Manager Index Output
Emirates NBD PMI Composite
Emirates NBD PMI Output
Figure 4: Purchasing Manager Index Output Prices
After a protracted period of declining business cli-
mate indicators we witness signs of a recovery in
June and July. The PMI composite index climbed in
July to 56.0 , the PMI output index to 63.6 (from 58.6
in June) and also the New orders index showed
signs of improvement. The Output price index in-
dicates stabilized prices in June and July pointing
towards no broad based inflationary pressure.
source: Markit source: Markit
Emirates NBD PMI New Orders
Non-Oil Private Sector Business Climate Indicators
Emirates NBD PMI Output Prices

Saudi Economic Chartbook August 2016
Page 8
Figure 3: CPI Inflation Food & Housing
source: GASTAT
Figure 1: Consumer Price Inflation All Items
source: GASTAT
Figure 2: Consumer Price and Wholesale Price Inflation
CPI inflation, % yoy CPI inflation, % yoy
Figure 4: CPI Inflation Furnishings & Transportation
There is no widespread inflationary pressure to be
observed outside the energy, water and transporta-
tion area. Hence, the overall CPI index has recently
started to decline again after its initial surge at the
beginning of the year due to energy and water
price increases. In June, CPI overall inflation
stands at 4.1% and WPI inflation at 3.5%.
source: GASTAT
CPI inflation, sub-index Food and non alcoholic
beverages,%yoy
CPI inflation, sub-index Furnishings, household equipment
& maintenance, % yoy
CPI inflation, sub-index Housing, water, electricity, gas
and other fuels, % yoy
source: GASTAT
CPI inflation, sub-index Transport, % yoy
WPI inflation, % yoy
Consumer and Wholesale Price Inflation

Saudi Economic Chartbook August 2016
Page 9
source: MOJ, RC source: MOJ, RC
Figure 2: Monthly Real Estate Transactions Riyadh Region
Total value of transactions, in mln SAR, 12M MA , l.h.sc. Total value of transactions, in mln SAR, 12M MA , l.h.sc.
In the second quarter real estate activity in the overall country, as well as in the three major re-gions continued to decline. The total monthly transaction value of residential and commercial
real estate dropped by 23% in June (on a 12-months moving average basis) from a year ago. The number of monthly transactions correspond-ingly declined by 19%.
source: MOJ, RC source: MOJ, RC
Total value of transactions, in mln SAR, 12M MA , l.h.sc. Total value of transactions, in mln SAR, 12M MA , l.h.sc.
Number of transactions, in tsd, 12M MA, r.h.sc. Number of transactions, in tsd, 12M MA, r.h.sc.
Number of transactions, in tsd, 12M MA, r.h.sc. Number of transactions, in tsd, 12M MA, r.h.sc.
Real Estate Market Transaction Activities (1/2)
Figure 1: Monthly Real Estate Transactions Overall
Country
Figure 4: Monthly Real Estate Transactions Eastern
Region
Figure 3: Monthly Real Estate Transactions Makkah
Region

Saudi Economic Chartbook August 2016
Page 10
source: MOJ, RC
Figure 5: Monthly Commercial Real Estate Transactions
source: MOJ, RC
Figure 6: Monthly Residential Real Estate Transactions
The pick-up in transaction value for commercial
real estate in the first quarter of this year turned
out to be temporary and the trend reversed in the
second quarter. Meanwhile, residential real estate
transaction value continued to decline into the
second quarter. The three major regions covered
81.2% of all Kingdom wide real estate transac-
tions (in terms of value) in Q2 2016.
source: MOJ, RC source: MOJ, RC
Residential, in mln SAR
Total value of transactions, in mln SAR, 12M MA , l.h.sc. Total value of transactions, in mln SAR, 12M MA , l.h.sc.
Number of transactions, in tsd, 12M MA, r.h.sc. Number of transactions, in tsd, 12M MA, r.h.sc.
Real Estate Market Transaction Activities (2/2)
Commercial, in mln SAR
Riyadh Region
Makkah Region
Figure 7: Quarterly Residential and Commercial
Transactions
Figure 8: Breakdown of Transaction Value by Regions
(Q2 2016)
Eastern Region
All Other Regions

Saudi Economic Chartbook August 2016
Page 11
Figure 3: OPEC Crude Oil Production
source: JODI, Bloomberg
Figure 1: Saudi Crude Oil Production and Exports
source: JODI
Figure 2: Saudi Crude Refinery Output and Exports
Saudi Arabian crude oil production, in tsd bd
Saudi Arabian total oil refinery output in tsd bd
Figure 4: Oil Prices
Saudi Arabian as well as overall OPEC crude produc-
tion increased towards record levels by mid-2016.
Meanwhile, Saudi crude exports moderately picked
up in June after having dropped before since the
beginning of this year. Saudi refinery output as
well as refinery exports consolidated during the
second quarter after strong growth before.
source: Bloomberg source: Bloomberg
Brent oil price
OPEC crude oil production incl. Indonesia, in tsd bd
(Indonesia is OPEC member since Dec 2015)
OPEC crude oil production, in tsd bd
WTI oil price
Oil Market Statistics: Production, Exports, Refinery and Prices
Saudi Arabian crude oil export, in tsd bd Saudi Arabian total oil refinery export, in tsd bd

Saudi Economic Chartbook August 2016
Page 12
source: Bloomberg source: Bloomberg, JP Morgan
12-months forward exchange rate USD/SAR
The 12-months forward premium in USD/SAR-exchange rate gradually climbed from its temporary low at the beginning of May (320bp) but is still clear-ly below the level of January 2016 (975bp). The
(nominal and real) SAR exchange rate index con-solidated following some weakness in the first quarter after having reached a multi-year peak in December of last year.
source: Bloomberg, JPMorgan source: Bloomberg, JPMorgan
SAR Real (CPI-adjusted) trade-weighted exchange rate index
SAR Nominal trade-weighted exchange rate index
Foreign Exchange: Forward Rates and Effective Exchange Rate Index
Figure 1: 12-Months Forward Exchange Rate USD/SAR Figure 2: SAR Nominal and Real Effective Exchange Rate
12-months forward exchange rate USD/SAR
SAR Nominal trade-weighted exchange rate index
Figure 3: 12-Months Forward Exchange Rate USD/SAR in
the Long Term
Figure 4: SAR Nominal and Real Effective Exchange Rate
in the Long Term
SAR Real (CPI-adjusted) trade-weighted exchange rate index

Saudi Economic Chartbook August 2016
Page 13
Figure 3: SIBOR Yield Curve
source: Bloomberg
Figure 1: 3-Months SIBOR vs. USD LIBOR
source: Bloomberg
Figure 2: 5-Year Swap Interest Rate
3-months SIBOR (Saudi Interbank Offered Rate)
5-year Swap rate SAR
Figure 4: Central Bank Rate and 3-Months SIBOR
The 3-months SAR interbank offered rate (SIBOR) stabilized at 2.25% by mid-year after having risen from 1.55% a year ago. However, as USD interest rates continued to climb the USD-SAR 3-months
rate differential gradually diminished in July. On the other side, 5-year interest rates (Swap rates) in SAR and USD continued to diverge in the second quarter of this year.
source: Bloomberg source: Bloomberg
as of 31 July 2016 Reverse repo rate SAMA
as of 31 December 2015 3-months SIBOR (Saudi Interbank Offered Rate)
5-year Swap rate USD 3-months US LIBOR (London Interbank Offered Rate)
Interest Rates: Money Market, Capital Market and Central Bank Rates
Saudi Economic Chartbook August 2016
Page 14
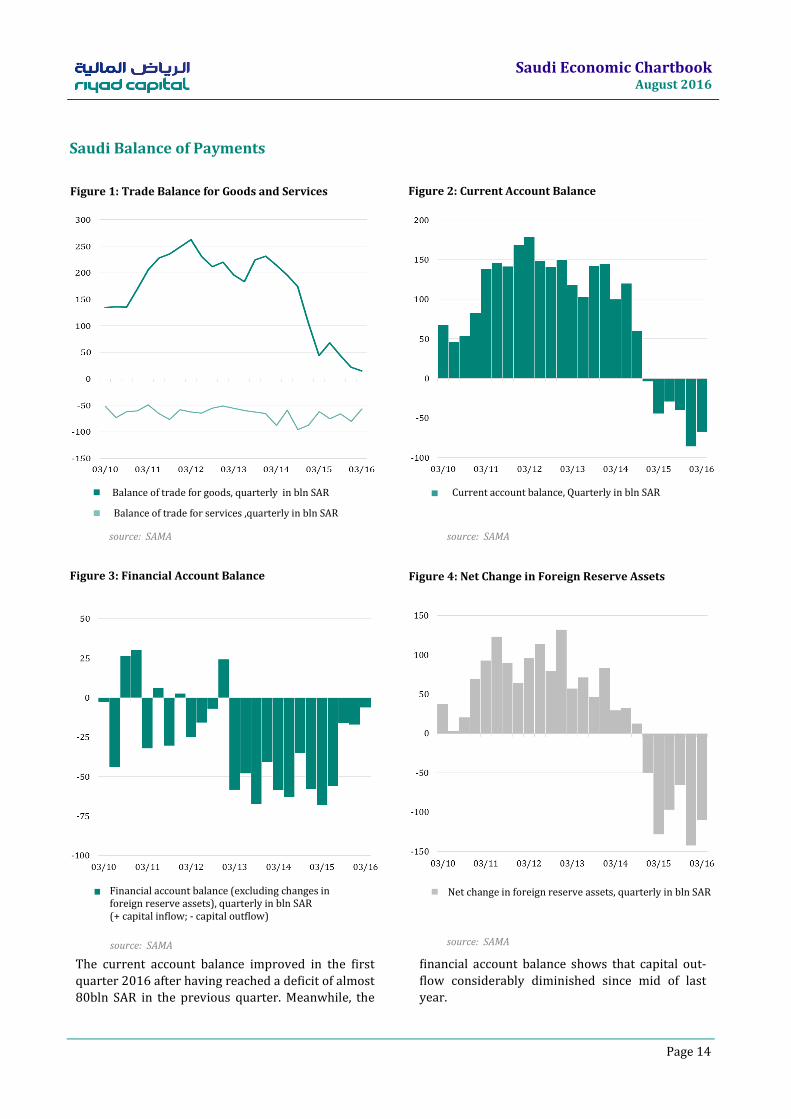
Figure 3: Financial Account Balance
source: SAMA
Figure 1: Trade Balance for Goods and Services
source: SAMA
Figure 2: Current Account Balance
Balance of trade for goods, quarterly in bln SAR Current account balance, Quarterly in bln SAR
Figure 4: Net Change in Foreign Reserve Assets
The current account balance improved in the first
quarter 2016 after having reached a deficit of almost
80bln SAR in the previous quarter. Meanwhile, the
financial account balance shows that capital out-
flow considerably diminished since mid of last
year.
source: SAMA source: SAMA
Saudi Balance of Payments
Balance of trade for services ,quarterly in bln SAR
Financial account balance (excluding changes in foreign reserve assets), quarterly in bln SAR (+ capital inflow; - capital outflow)
Net change in foreign reserve assets, quarterly in bln SAR

Saudi Economic Chartbook August 2016
Page 15
Figure 3: Tadawul Swap and QFI Net Purchases
source: Bloomberg
Figure 1: Tadawul All-Share Index
source: Tadawul
Figure 2: Tadawul Total Trading Value
Tadawul All-share index
Monthly Total trading value for Tadawul, in bln SAR
Figure 4: Performance TASI Sectors July 2016 YTD
Tadawul remained broadly range-bound during the
summer months after its recovery from the lows in
January of this year. At the same time, the overall
trading value dropped seasonally related to histori-
cally low levels. Foreign investors were net buyers
of Saudi equities over the last four consecutive
months after having been predominantly net
sellers since beginning of 2014.
source: Tadawul source: Bloomberg
Monthly net Swap purchases , in mln SAR
Monthly net QFI purchases, in mln SAR
Tadawul: Saudi Equity Market Statistics
Tadawul All-share index, 10 weeks MA

Saudi Economic Chartbook August 2016
Page 16
Economic Facts and Figures at a Glance
We expect Saudi economic growth to slow down in
2016 to 1.3% from 3.4% in 2015. For the year
2017 we expect a recovery to 1.6% on the back of
gradually rising oil prices. Inflation will pick up to
3.9% in 2016 and 4.5% in 2017.
Based on the mid-year 2016 outlook of the IMF the global economy is forecasted to grow by 3.1% in 2016 and 3.4% in 2017. This recovery is expected to be primarily driven by emerging market econo-mies as conditions in some of the stressed econo-mies start gradually to normalize. Emerging econo-mies are supposed to grow by 4.1 in 2016 and 4.6 in 2017.
Oil, Inflation and Interest Rates GDP and Fiscal Indicators
Tadawul Equity Market External Balance
Global Economy GDP Growth Rates
source: GASTAT, MOF, RC source: Bloomberg, SAMA, RC
source: SAMA, RC
source: Bloomberg
source: IMF
P/E-ratio = Price/ Earnings-ratio , P/B-ratio = Price / Book-ratio
all ratios on trailing basis except 2017 forecast (consensus forward-ratios)
2012 2013 2014 2015 2016f 2017f
Real GDP Growth
Overall economy 5.4 2.7 3.6 3.4 1.3 1.6
Non-oil Private sector 5.5 7.0 5.4 3.7 1.5 2.0
Government sector 5.3 5.1 3.7 3.3 1.6 2.1
Oil sector 5.1 -1.6 2.1 3.1 1.0 1.0
Fiscal Balance and Government Debt
Fiscal Balance in bln SAR 374 180 -71 -367 -329 -205
Fiscal Balance in % GDP 13.6 6.5 -2.5 -15.0 -13.9 -7.8
Government debt in bln SAR 99 60 44 142 322 477
Government debt as % GDP 3.6 2.2 1.6 5.8 13.6 18.2
2012 2013 2014 2015 2016f 2017f
Oil Prices and Production (yearlly average)
Brent price (USD pb) 111.7 108.7 99.5 53.7 45.0 53.0
WTI price (USD pb) 94.1 98.0 92.9 48.8 43.0 51.0
OPEC Basket price (USD pb) 109.5 105.9 96.2 49.5 43.0 52.0
KSA oil production (mln bd) 9.8 9.6 9.7 10.2 10.3 10.4
Inflation and Interest Rates (year end)
CPI Inflation (yearly average) 2.87 3.52 2.68 2.18 3.90 4.50
3M SIBOR SAR 0.99 0.96 0.86 1.55 2.50 3.00
Reverse Repo Rate 0.25 0.25 0.25 0.50 0.75 1.25
Official Repo Rate 2.00 2.00 2.00 2.00 2.25 3.00
2012 2013 2014 2015 2016f 2017f
Trade and Current Account
Trade Balance in bln SAR 925 835 690 177 105 240
Trade Balance in % GDP 33.6 29.9 24.4 7.2 4.4 9.1
Current Account in bln SAR 618 508 277 -201 -241 -147
Current Account in % GDP 22.4 18.2 9.8 -8.2 -10.2 -5.6
2012 2013 2014 2015 07/16 07/17
Key Figures (period end)
Total Return in % 9.3 30.2 0.7 -14.6 -6.1 n.a.
P/E-ratio 14.4 16.4 18.2 15.9 14.7 12.9
P/B-ratio 1.8 2.0 2.1 1.6 1.5 1.4
RoE 12.3 12.2 11.5 10.2 9.9 10.6
2012 2013 2014 2015 2016f 2017f
World 3.4 3.3 3.4 3.1 3.1 3.4
Advanced Economies 1.5 1.2 1.9 1.9 1.8 1.8
USA 2.8 1.5 2.4 2.4 2.2 2.5
Euro Area -0.6 -0.4 0.9 1.7 1.5 1.4
Japan 1.4 1.6 0.0 0.5 0.3 0.1
United Kingdom 0.2 1.7 3.1 2.2 1.7 1.3
Emerging Market Economies 4.9 5.0 4.6 4.0 4.1 4.6
China 7.7 7.7 7.3 6.9 6.6 6.2
India 3.2 6.9 7.2 7.6 7.4 7.4
Russia 3.4 1.3 0.7 -3.7 -1.2 1.0
Brazil 0.9 2.7 0.1 -3.8 -3.3 0.5
Saudi Economic Chartbook August 2016
Page 17
Disclaimer
The information in this report was compiled in good faith from various public sources believed to be reliable. Whilst all reasonable care has been taken to ensure that the facts stated in this report are accurate and that the forecasts, opinions and expectations contained herein are fair and reasonable, Riyad Capital makes no representa-tions or warranties whatsoever as to the accuracy of the data and information provided and, in particular, Riyad Capital does not represent that the information in this report is complete or free from any error. This report is not, and is not to be construed as, an offer to sell or solicitation of an offer to buy any financial securities. Accordingly, no reliance should be placed on the accuracy, fairness or completeness of the information contained in this report. Riyad Capital accepts no liability whatsoever for any loss arising from any use of this report or its contents, and neither Riyad Capital nor any of its respective directors, officers or employees, shall be in any way responsible for the contents hereof. Riyad Capital or its employees or any of its affiliates may have a financial interest in securities or other assets referred to in this report.
Opinions, forecasts or projections contained in this report represent Riyad Capital's current opinions or judgment as at the date of this report only and are therefore subject to change without notice. There can be no assurance that future results or events will be consistent with any such opinions, forecasts or projections which represent only one possible outcome. Further such opinions, forecasts or projections are subject to certain risks, uncertain-ties and assumptions that have not been verified and future actual results or events could differ materially.
The value of, or income from, any investments referred to in this report may fluctuate and/or be affected by changes. Past performance is not necessarily an indicative of future performance. Accordingly, investors may receive back less than originally invested amount.
This report provide information of a general nature and do not address the circumstances, objectives, and risk tolerance of any particular investor. Therefore, it is not intended to provide personal investment advice and does not take into account the reader’s financial situation or any specific investment objectives or particular needs which the reader’s may have. Before making an investment decision the reader should seek advice from an inde-pendent financial, legal, tax and/or other required advisers.
This research report might not be reproduced, nor distributed in whole or in part, and all information; opinions, forecasts and projections contained in it are protected by the copyright rules and regulations.
Riyad Capital is a Limited Liability Company. Paid Up Capital SR 200 Million. Licensed by the Capital Market
Authority (No. 07070-37). CR No. 1010239234.
6775 Takhassusi St. – Olaya, Riyadh 12331-3712 (www.riyadcapital.com). Tel. +966 9200 12299