saurashtra universityetheses.saurashtrauniversity.edu/942/1/parekh_dh_thesis...i am indebted to...
TRANSCRIPT

Saurashtra University Re – Accredited Grade ‘B’ by NAAC (CGPA 2.93)
Parekh, Darshan H., 2012, “Formulation Development and Evaluation of Osmotic Drug Delivery System”, thesis PhD, Saurashtra University
http://etheses.saurashtrauniversity.edu/id/942 Copyright and moral rights for this thesis are retained by the author A copy can be downloaded for personal non-commercial research or study, without prior permission or charge. This thesis cannot be reproduced or quoted extensively from without first obtaining permission in writing from the Author. The content must not be changed in any way or sold commercially in any format or medium without the formal permission of the Author When referring to this work, full bibliographic details including the author, title, awarding institution and date of the thesis must be given.
Saurashtra University Theses Service http://etheses.saurashtrauniversity.edu
© The Author

FORMULATION DEVELOPMENT AND
EVALUATION OF OSMOTIC DRUG
DELIVERY SYSTEM
A Thesis
Submitted for the degree of
DOCTOR OF PHILOSOPHY In the
FACULTY OF PHARMACY
TO
SAURASHTRA UNIVERSITY, RAJKOT
Research guide: Submitted by:
Dr. H. M. TANK Darshan H. Parekh
M. Pharm, Ph. D M. Pharm.
S. S. INSTITUTE OF PHARMACEUTICAL EDUCATION AND RESEARCH,
HADALA, MORBI HIGHWAY, RAJKOT, GUJARAT, INDIA.

Certificate
This is to certify that the thesis entitled “FORMULATION DEVELOPMENT
AND EVALUATION OF OSMOTIC DRUG DELIVERY SYSTEM” submitted for
the Ph.D. degree in pharmacy by MR. DARSHAN H.PAREKH incorporate
original research work carried out by her under my supervision and no part
of the thesis has been submitted for any other degree.
Research guide:
Dr. H.M.Tank
M.Pharm, Ph.D,
Principal,
Matushree V.B.Manwar College of Pharmacy,
Dumiyani, Gujarat, India.
Forwarded through:
Dr. H.M.Tank
M.Pharm, Ph.D,
Principal,
Matushree V.B.Manwar College of Pharmacy,
Dumiyani, Gujarat, India.
Date:

DECLARATION
I here by declare that the topic entitled “FORMULATION DEVELOPMENT
AND EVALUATION OF OSMOTIC DRUG DELIVERY SYSTEM” Which is
submitted herewith to Saurashtra University, Rajkot for the award of Doctor
of Philosophy in the Faculty of Pharmacy is the result of work done by me in
S.S. Institute of Pharmaceutical Education and Research, Rajkot, under the
guidance of Dr. H. M. Tank, Principal, Matushree V.B.Manwar College of
Pharmacy, Dumiyani.
I, hereby, declare that Saurashtra University, Rajkot shall have the right to
preserve, use and disseminate this thesis, in print or electronic format, for
academic/research purpose
I further declare that the results of this work have not been previously
submitted for any degree or fellowship.
Place: Saurashtra University, Rajkot MR. DARSHAN H.PAREKH
Date: M.Pharm.

Statement under ordinance Ph.D 7 of
Saurashtra University
The contents of the thesis are my own work carried out under the
supervision of Dr. H.M.Tank. It leads to some contribution in Pharmacy
and is supported with necessary references.
Mr. Darshan H.Parekh,
M.Pharm.
Asst. Professor.
S.S.Institute of Pharmaceutical Education & Research,
Rajkot.

Dedicated
to
my beloved family,
friends and the
almighty…
ACKNOWLEDGEMENT
No research is ever the outcome of single individual’s talent or efforts. This project
work would not have been possible without the hearted encouragement, support and co-
operation of my parents, guide, teachers, friends and well wishers. This thesis is a fruit of
infinite encouragement, infallible guidance and unstinted cooperation received from
multidirectional aiming for a unidirectional goal. With heartiness I take opportunity to pen
down few words of heartfelt expression for all involved directly or indirectly in making this
thesis a success.
This work was carried out at the Department of Pharmaceutics and Pharmaceutical
Technology, S.S. Institute of Pharmaceutical Education and Research, Rajkot during the year
2007-2011. I am indebted for the same.
At the heart of every event lie causes, reason and a motivating force or an inspiration.
To a student, in whatever walk of life he may be, this inspiration is always there through a
guide, a mentor. With a deep sense of gratitude and the respect, I thank my esteemed guide
and preceptor Dr. H. M. Tank, Professor, Principal and Head of Pharmaceutics department,
Matushree V.B.Manwar College of Pharmacy, Rajkot for his inestimable guidance, valuable
suggestions and constant encouragement during the course of this study. To work under such
personality has been a great and inexplicable experience that will go along a way in my
memory in life. I consider myself fortunate for being his student. It is with affection and
reverence that I acknowledge my indebtness to him and his outstanding dedication, often far
beyond the call of duty. I consider myself extremely fortunate to have a chance to work
under his guidance.
I am indebted to Shree Rajubhai Dhariya, Trustee of S.S. Institute of
Pharmaceutical Education and Research for constant inspiration, encouragement and support
to carry out this work.
I also express my sincere thanks to Mr. Vikrambhai Patel, chairman Mr Rasikbhai
Chavda, vice chairman and Mrs. Hansaben Tank, trustee of S. S. Institute of
Pharmaceutical Education and Research for extending the facilities to work at the institute.
My heartfelt thanks go to my colleague Atul Kathiriya who took deep interest in the
work and was always there whenever I needed any guidance. His valuable suggestion,

directions and selfless support throughout the investigation were of great help
I am sincerely thankful to my friends and colleagues Jasmin Garala, Ramesh
Parmar, Ketan Shah, and the entire faculty of S.S. Institute of Pharmaceutical Education
and Research, Rajkot for their kind support and timely help to give the real shape of my
thesis.
I am extremely thankful to US Vitamins and Dow Chemicals, for providing gift
samples of drug and excipients.
I pray my sincere thanks to my best friends; Parag Tanna, Shital Fadadu, Saurabh
Tanna, Ankit Shah, Viral Kansara, Shalin Dharaiya and Mitesh for their help and moral
support.
I bow down with reverence and offer my heartfelt thanks to my family members for
their moral support, constant encouragement and patience absolutely needed to complete my
entire study. It was the blessing of them that gave me courage to face the challenges and
made my path easier.
I am indebted infinitely to the care, support and trust being shown by my loving wife
Neha; she is the actual driving force that enabled me to complete this work in time.
Lastly I thank the Almighty for giving me the strength to go through the rigours of
completing this work and always being there through the various phases of life.
Darshan Harshadbhai Parekh

Table of Contents
Chapter
no.
Content Page no.
1 INTRODUCTION 1-22
2 REVIEW OF LITERATURE 23-35
3 AIM OF THE PRESENT WORK 36-37
4 CALCULATION OF THEORETICAL DISSOLUTION PROFILE 38-40
5 PROFILE OF DRUG AND EXCIPIENTS 41-66
6 ANALYTICAL METHODS 67-77
7 PREFORMULATION STUDIES 78-93
8 MONOLAYER OSMOTIC DRUG DELIVERY SYSTEM 94-136
9 BILAYER OSMOTIC DRUG DELIVERY SYSTEM 137-165
10 TRILAYER OSMOTIC DRUG DELIVERY SYSTEM 166-195
11 SUMMARY AND CONCLUSIONS 196-202
12 REFERENCES 203-214

LIST OF TABLES
Table no. Title
Pg
no.
Table 1: Commercially available osmotic systems: 3
Table 2: List of Compounds that can be used as osmagents 16
Table 3: Pharmacokinetic parameters of Trimetazidine dihydrochloride 38
Table 4: Theoretically calculated % cumulative drug release of
trimetazidine dihydrochloride: 39
Table 5 : Use of carbopol 48
Table 6: Uses of povidone. 51
Table 7: Absorbance of Trimetazidine dihydrochloride at 270 nm 69
Table 8: Results of Specificity test for analytical method development 71
Table 9: Results of Method Precision 72
Table 10: Results of System Precision 73
Table 11: Results of inter day precision 74
Table 12: Results of intraday precision 74
Table 13: Results of Accuracy Test 75
Table 14: Results of Solution Stability 76
Table 15: Results of Analytical method 77
Table 16: Results of Organoleptic properties of Trimetazidine
dihydrochloride 79
Table 17: IR spectrum interpretation of trimetazidine dihydrochloride 80
Table 18: Relationship between % compressibility and flowability: 82
Table 19: Granulometry properties of powder drug and excipients 82
Table 20: Drug:Excipients combination and ratio for compatibility study 84
Table 21: Results of the physical observation 84
Table 22: Results of the content determination compatibility study 85
Table 23: Interpretation of DSC Thermogram of Drug, Exipients and
Mixture of Drug and excipients 92
Table 24: Trial formulations for Feasibility trial (Core) 94
Table 25: Trial formulations for Feasibility trial (Coating) 98
Table 26: Trial formulations for Optimization Of HPMC K4M for
monolayer osmotic tablets 101
Table 27: Trial formulations for Optimization Of Carbopol 71G for
monolayer osmotic tablets 104

Table 28: Optimization of osmogen (Sodium chloride and mannitol) for
monolayer osmotic tablets: 107
Table 29: Optimization of Coating composition for monolayer osmotic
tablets 110
Table 30: Specifications for weight variation in tablets as per
Pharmacopoeia of India 112
Table 31: Granulometry study result of the feasibility core trial 116
Table 32: Compression and coating parameters (for core and coated tablets) for monolayer osmotic tablets trial formulations
117
Table 33: % cumulative release data for coating feasibility trial for
monolayer osmotic tablets 119
Table 34: Statistical parameters for dissolution data of coating feasibility
trial for monolayer osmotic tablets 120
Table 35: % cumulative release data for optimization of HPMC K4M for
monolayer osmotic tablets 121
Table 36: Statistical parameters for dissolution data of optimization of
HPMC K4M for monolayer osmotic tablets 122
Table 37: % cumulative release data for optimization of Carbopol 71G for
monolayer osmotic tablets 123
Table 38: Statistical parameters for dissolution data of optimization of
Carbopol 71G for monolayer osmotic tablets 124
Table 39 : % cumulative release data for optimization of Osmogen for
monolayer osmotic tablets 124
Table 39 (a) : Statistical parameters for dissolution data of optimization of
osmogen 125
Table 40: % cumulative release data for optimization of Coating for
monolayer osmotic tablets 126
Table 41: Statistical parameters for dissolution data of optimization of
osmogen for monolayer osmotic tablets 127
Table 42: cumulative % drug release of the selected optimized formulation (MT20) in different dissolution medium
128
Table 43: Drug release rate for selected optimized formulation (MT20)
after duration of 8 hrs in alternative media 129
Table 44: Effect of agitation rate on in-vitro drug release of the
optimized formulation MT20 osmotic tablet 131
Table 45: Cumulative % drug release from optimized formulation MT20
with various orifice sizes 133
Table 46: Stability study data for the optimized monolayer osmotic
tablet batch (MT20): 135

Table 47: Trial formulations for Optimization Of HPMC K4M for bilayer
osmotic tablets 137
Table 48: Trial formulations for Optimization Of Carbopol 71 G for bilayer
osmotic tablets 140
Table 49: Trial formulations for Optimization Of Osmogen for bilayer
osmotic tablets 143
Table 50: Compression and coating parameters (for core and coated
tablets) of bilayer osmotic drug delivery system 150
Table 51: % cumulative release data for optimization of HPMC K4M for
bilayer osmotic drug delivery system 151
Table 52: Statistical parameters for dissolution data of optimization of
HPMC K4M for bilayer osmotic drug delivery system 152
Table 53: % cumulative release data for optimization of Carbopol 71G for
bilayer osmotic drug delivery system 153
Table 54: Statistical parameters for dissolution data of optimization of
Carbopol 71G for bilayer osmotic drug delivery system 154
Table 55: % cumulative release data for optimization of osmogen for
bilayer osmotic drug delivery system 154
Table 56: Statistical parameters for dissolution data of optimization of
osmogen for bilayer osmotic drug delivery system 155
Table 57: cumulative % drug release of the selected optimized
formulations (BT17) in different medium 157
Table 58: Drug release rate for selected optimized formulation (BT17)
after duration of 8 hrs in alternative media 158
Table 59: Effect of agitation rate on in-vitro drug release of the
optimized formulation BT17 osmotic tablet 160
Table 60: Cumulative % drug release from optimized formulation BT17
with various orifice sizes 162
Table 61: Stability study data for the optimized bilayer osmotic tablet
batch (BT17) 164
Table 62: Trial formulations for Optimization Of HPMC K4M for trilayer
osmotic tablets 166
Table 63: Trial formulations for Optimization Of Carbopol 71G for trilayer
osmotic tablets 171
Table 64: Trial formulations for Optimization Of osmogen (in drug layer)
for trilayer osmotic tablets 174
Table 65: Trial formulations for Optimization Of osmogen (in push layer)
for trilayer osmotic tablets 175
Table 66: Compression and coating parameters (for core and coated
tablets) for trilayer osmotic tablets 178

Table 67: % cumulative release data for optimization of HPMC K4M for
trilayer osmotic tablets 179
Table 68: Statistical parameters for dissolution data of optimization of
HPMC K4M for trilayer osmotic tablets 180
Table 69: % cumulative release data for optimization of Carbopol 71G for
trilayer osmotic tablets 181
Table 70: Statistical parameters for dissolution data of optimization of
Carbopol 71G for trilayer osmotic tablets 182
Table 71 : % cumulative release data for optimization of osmogen (Drug
layer) for trilayer osmotic tablets 183
Table 72: Statistical parameters for dissolution data of optimization of
osmogen (Drug layer) 184
Table 73: % cumulative release data for optimization of osmogen (Push
layer) for trilayer osmotic tablets 184
Table 74: Statistical parameters for dissolution data of optimization of
osmogen (Push layer) for trilayer osmotic tablets 185
Table 75: cumulative % drug release of the selected optimized
formulations (TT20) in different medium 187
Table 76: Drug release rate for selected optimized formulation (TT20)
after duration of 8 hrs in alternative media 188
Table 77: Effect of agitation rate on in-vitro drug release of the
optimized formulation TT20 osmotic tablet 190
Table 78: Cumulative % drug release from optimized formulation TT20
with various orifice sizes 192
Table 79: Stability study data for the optimized trilayer osmotic tablet
batch (TT20) 194

LIST OF FIGURES
Figure no. Title
Pg
no.
Figure 1: Schematic diagram of an elementary osmotic pump (a) and a
push–pull osmotic pump (b). 5
Figure 2. Cross-sectional diagram of OROS CT delivery system. 6
Figure 3. Cross-sectional diagram of L-OROS delivery system before
and during operation 6
Figure 4. Schematic diagram of controlled porosity osmotic pump
before and during operation. 8
Figure 5. Schematic diagram of sandwiched osmotic tablet before and
during operation. 8
Figure 6: Schematic view of delivery system having encapsulated
excipients 12
Figure 7: Time (hr) v/s % cumulative drug release of the theoretical
target release profile 39
Figure 8: UV spectrum of Trimetazidine dihydrochloride in distilled
water 68
Figure 9: Linearity curve of Trimetazidine dihydrochloride at 270 nm in
distilled water 70
Figure 10 (a): Infrared absorption spectrum of Trimetazidine
Dihydrochloride 80
Figure 10: DSC thermogram of trimetazidine dihydrochloride 86
Figure 11: DSC thermogram of trimetazidine dihydrochloride + HPMC
K4M 86
Figure 12: DSC thermogram of trimetazidine dihydrochloride + Carbopol
71G 87
Figure 13: DSC thermogram of Trimetazidine dihydrochloride + Lactose
Mono 87
Figure 14: DSC thermogram of trimetazidine dihydrochloride +
Povidone K30 88
Figure 15: DSC thermogram of trimetazidine dihydrochloride + Mg.
Stearate 88
Figure 16: DSC thermogram of trimetazidine dihydrochloride + Talc 89
Figure 17: DSC thermogram of HPMC K4M 89
Figure 18: DSC thermogram of Carbopol 71G 90
Figure 19: DSC thermogram of Lactose monohydrate 90
Figure 20: DSC thermogram of Povidone K/30 91

Figure 21: DSC thermogram of Magnesium stearate 91
Figure 22: DSC thermogram of Talc 92
Figure 23: % cumulative release v/s Time (hr) plot for coating feasibility
trial for monolayer osmotic tablets 120
Figure 24: % cumulative release v/s Time (hr) plot for optimization of
HPMC K4M for monolayer osmotic tablets 122
Figure 25: % cumulative release v/s Time (hr) plot for optimization of
Carbopol 71G for monolayer osmotic tablets 123
Figure 26: % cumulative release v/s Time (hr) plot for optimization of
osmogen for monolayer osmotic tablets 125
Figure 27 : % cumulative release v/s Time (hr) plot for optimization of
osmogen for monolayer osmotic tablets 126
Figure 28: % cumulative release v/s Time (hr) plot for optimized
formulation (MT20) to study the effect of Osmotically active Dissolution Medium on drug release
129
Figure 29: % cumulative release v/s Time (hr) plot for formulation MT20
to study the effect of agitation rate on drug release 131
Figure 30: % cumulative release v/s Time (hr) plot for formulation MT20
to study the effect of orifice size on drug release 133
Figure 31 : % cumulative release v/s Time (hr) plot for optimization of
HPMC K4M for bilayer osmotic drug delivery system 151
Figure 32: % cumulative release v/s Time (hr) plot for optimization of
Carbopol 71G for bilayer osmotic drug delivery system 153
Figure 33: % cumulative release v/s Time (hr) plot for optimization of
osmogen for bilayer osmotic drug delivery system 154
Figure 34: % cumulative release v/s Time (hr) plot for optimized
formulation (BT17) to study the effect of Osmotically active Dissolution Medium on drug release
158
Figure 35: % cumulative release v/s Time (hr) plot for formulation BT17
to study the effect of agitation rate on drug release 160
Figure 36: % cumulative release v/s Time (hr) plot for formulation BT17
to study the effect of orifice size on drug release 162
Figure 37: % cumulative release v/s Time (hr) plot for optimization of
HPMC K4M for trilayer osmotic tablets 180
Figure 38: % cumulative release v/s Time (hr) plot for optimization of
Carbopol 71G for trilayer osmotic tablets 182
Figure 39: % cumulative release v/s Time (hr) plot for optimization of
osmogen (Drug layer) for trilayer osmotic tablets 183
Figure 40: % cumulative release v/s Time (hr) plot for optimization of
osmogen (Push layer) for trilayer osmotic tablets 185

Figure 41: % cumulative release v/s Time (hr) plot for optimized
formulation (TT20) to study the effect of Osmotically active Dissolution Medium on drug release
188
Figure 42: % cumulative release v/s Time (hr) plot for formulation TT20
to study the effect of agitation rate on drug release 190
Figure 43: % cumulative release v/s Time (hr) plot for formulation TT20
to study the effect of orifice size on drug release 192

CHAPTER 1
INTRODUCTION
Chapter 1 Introduction
Osmotic Drug Delivery System Page 1
1.0 Introduction to osmotic Drug Delivery system:
In recent years, considerable attention has been focused on the development of novel
drug delivery systems (NDDS). The reason for this paradigm shift is relatively low development
cost and time required for introducing a NDDS as compared to developing a new chemical
entity. In the form of NDDS, an existing drug molecule can get a new life thereby, increasing its
market value, competitiveness, and patent life.
Among the various NDDS available in market, per oral controlled release (CR) systems
hold the major market share because of their obvious advantages of ease of administration and
better patient compliance [1]
. CR delivery systems provide desired concentration of drug at the
absorption site allowing maintenance of plasma concentrations within the therapeutic range and
reducing the dosing frequency. These products typically provide significant benefits over
immediate-release formulations, including greater effectiveness in the treatment of chronic
conditions, reduced side effects, and greater patient convenience due to a simplified dosing
schedule.A number of design options are available to control or modulate the drug release from a
dosage form. Majority of per oral CR dosage forms fall in the category of matrix, reservoir, or
osmotic systems. In matrix systems, the drug is embedded in a polymer matrix and the release
takes place by partitioning of drug into the polymer matrix and the release medium. In contrast,
reservoir systems have a drug core surrounded / coated by a rate controlling membrane.
However, factors like pH, presence of food, and other physiological factors may affect drug
release from conventional CR systems (matrix and reservoir). Osmotic systems utilize the
principles of osmotic pressure for the delivery of drugs. Drug release from these systems is
independent of pH and other physiological parameters to a large extent and it is possible to
modulate the release characteristics by optimizing the properties of drug and system [2]
. Alza
Corporation of the USA (now merged with Johnson & Johnson, USA) was first to develop an
oral osmotic pump and today also, they are the leaders in this field with a technology named
OROS. The oral osmotic pumps have certainly come a long way and the available products
based on this technology [1]
and number of patents granted in the last few years [3]
makes its
presence felt in the market. They are also known as GITS (gastro-intestinal therapeutic system)
and today, different types of osmotic pumps are available to meet variety of drug delivery
demands (Table 1). Osmotic pumps can be used as experimental tools to determine important
pharmacokinetic parameters of new or existing drugs. At the same time, they can also be utilized

Chapter 1 Introduction
Osmotic Drug Delivery System Page 2
to deliver drugs at a controlled and predetermined rate.
1.1. Osmotically controlled oral drug delivery
Osmotic systems utilize osmotic pressure as driving force for controlled delivery of
drugs. Fig. 1a shows schematic diagram of elementary osmotic pump (EOP), which in its
simplest design, consists of an osmotic core (containing drug with or without an osmagent)
coated with a semipermeable membrane (SPM). The dosage form, after coming in contact with
the aqueous fluids, imbibes water at a rate determined by the fluid permeability of the membrane
and osmotic pressure of core formulation [5]
. This osmotic imbibition of water results in
formation of a saturated solution of drug within the core, which is dispensed at a controlled rate
from the delivery orifice in the membrane. Though 60–80% of drug is released at a constant rate
from EOP, a lag time of 30–60 min is observed in most of the cases as the system hydrates
before zero-order delivery from the system begins [6]
. These systems are suitable for delivery of
drugs having moderate water solubility. Push–pull osmotic pump (PPOP) can be used for
delivery of drugs having extremes of water solubility. As shown in Fig. 1b, it is a bilayer tablet
coated with a SPM. Drug along with osmagents is present in the upper compartment whereas
lower compartment consists of polymeric osmotic agents [7,8]
. The drug compartment is
connected to the outside environment via a delivery orifice. After coming in contact with the
aqueous environment, polymeric osmotic layer swells and pushes the drug layer, thereby
delivering the drug in the form of a fine dispersion via the orifice [9]
. A number of modifications
are available for this type of system such as delayed push–pull system (as used in Covera HS,
extended release formulation for verapamil), multi-layer push–pull system (for pulsatile or
delayed drug delivery), and push–stick system (for delivery of insoluble drugs requiring high
loading, with an optional delayed, patterned, or pulsatile release profile). OROS-CT is used as a
once- or twice-a-day formulation for targeted delivery of drugs to the colon [10]
. The OROS-CT
can be a single osmotic unit or it can comprise of as many as five to six push–pull osmotic units
filled in a hard gelatin capsule (Fig. 2). After coming in contact with the gastrointestinal fluids,
gelatin capsule dissolves and the enteric coating prevents entry of fluids from stomach to the
system. As the system enters into the small intestine, the enteric coating dissolves and water is
imbibed into the core thereby causing the push compartment to swell. At the same time, flowable
gel is formed in the drug compartment which is pushed out of the orifice at a rate which is
precisely controlled by the rate of water transport across the SPM.

Chapter 1 Introduction
Osmotic Drug Delivery System Page 3
Table 1: Commercially available osmotic systems:
Systems and introducers Features of the system
(i) Osmotic pumps for experimental
research
ALZET
OSMET
Miniature implantable osmotic pumps
for laboratory animals.
Different models having delivery rates
from 0.25 to 10 µl/h and duration from
1 day to 4 weeks available. Delivery
profile independent of drug
formulation.
Used as experimental tools for human
pharmacological studies and can be
used for oral, rectal or vaginal
administration. Available with release
rate ranging from 8 to 120 µl/h.
II) Osmotic pumps for humans oral
Elementary osmotic pump (Alza)
Push-pull osmotic pump (Alza)
L- OROS (Alza)
Single layer tablet for delivery of drugs
having moderate water solubility.
Can be utilized for zero order delivery
as well as pulsed release.
Bilayer tablet, used to deliver drugs
having too low water solubility.
Products such as Ditropan XL
(Oxybutinin chloride), procardial XL
and Glucotrol XL are based on this
technology. Number of modifications
available such as delayed push-pull,
multi layer push pull and push stick
system.
Designed to deliver lipophilic liquid
formulations and is suitable for delivery
of insoluble drugs

Chapter 1 Introduction
Osmotic Drug Delivery System Page 4
OROS-CT
Portab System (Andrx Pharma, USA)
SCOT (Single Composition Osmotic
Tablet) (Andrx Pharma, USA)
ENSOTROL drug delivery system (Shire
Labs)
Zero Os (ADD drug delivery technologies)
Implantable
DUROS (Durect Corp.)
For targeted drug delivery to colon and
can be used for local or systemic
delivery
Tablet core consists of soluble agent,
which expands and creates microporous
channels for drug release.
Utilizes various osmotic modulating
agents and polymer coating to provide
zero order release.
Utilizes various solubilizing and
wicking agents for delivery of poorly
soluble drugs.
Specially for delivery of lipophilic
compounds. Consists of gel forming
agents in the core that form gel after
coming in contact with water. Drug is
released as a fine dispersion.
Miniature, implantable osmotic pumps
for long term, parenteral, zero order
delivery of patent therapeutic agents.
Deliver drugs at a precisely controlled
and constant rate within therapeutic
range for long periods.

Chapter 1 Introduction
Osmotic Drug Delivery System Page 5
Figure 1: Schematic diagram of an elementary osmotic pump (a) and a push–pull osmotic
pump (b).
III) Osmotic pumps for veterinary use
VITS (Veternary Implantable Therapeutic
System) (Alza)
RUTS (Ruminal therapeutic system)
(Alza)
Designed to deliver drugs at a
controlled rate in animals for a period
of 1 day to 1 year and can be implanted
subcutaneously or intraperitoneally.
For controlled delivery of drugs up to 1
year in the rumen of cattle and sheep.

Chapter 1 Introduction
Osmotic Drug Delivery System Page 6
Figure 2. Cross-sectional diagram of OROS CT delivery system.
Figure 3. Cross-sectional diagram of L-OROS delivery system before and during operation

Chapter 1 Introduction
Osmotic Drug Delivery System Page 7
Liquid OROS controlled release systems are designed to deliver drugs as liquid formulations and
combine the benefits of extended-release with high bioavailability [11]
. Fig. 3 shows the cross-sectional diagram
for L-OROS SOFTCAP delivery system before and during operation. These systems are suitable for controlled
delivery of liquid drug formulations including lipophilic self-emulsifying formulations (SEF). The liquid drug
formulation is present in a soft gelatin capsule, which is surrounded with the barrier layer, the osmotic layer, and
the release rate-controlling membrane. A delivery orifice is formed through these three layers. When the system
is in contact with the aqueous environment, water permeates across the rate controlling membrane and activates
the osmotic layer. The expansion of the osmotic layer results in the development of hydro- static pressure inside
the system, thereby forcing the liquid formulation to break through the hydrated gelatin capsule shell at the
delivery orifice. The liquid drug formulation is pumped through the delivery orifice. L-OROS HARDCAP is
similar to L-OROS SOFTCAP and consists of a liquid drug layer, a barrier layer, and an osmotic engine, all
encased in a hard gelatin capsule and coated with a SPM [12]
. A delivery orifice, drilled in the membrane at the
end of the drug layer, provides an outlet for the drug suspension. After coming in contact with the aqueous
environment, water is imbibed across the SPM, expanding the osmotic engine. The osmotic engine pushes
against the barrier, releasing drug through the delivery orifice.
In majority of cases, osmotic systems have a pre-formed passageway in the membrane from where the
drug release takes place. Controlled porosity osmotic pumps (CPOP), contain water-soluble additives in the
coating membrane, which after coming in contact with water, dissolve resulting in an in situ formation of a
microporous membrane (Fig. 4). The resulting membrane is substantially permeable to both water and dissolved
solutes and the mechanism of drug release from these systems was found to be primarily osmotic, with simple
diffusion playing a minor role [13–15]
.
Multi-particulate delayed release systems consist of pellets of drug (with or without osmagents) coated
with a SPM. These pellets, after coming in contact with the aqueous environment, imbibe water osmoticcally,
which results in a rapid expansion of the membrane leading to the formation of pores and drug release [16,17]
.
Use of asymmetric membranes in osmotic drug delivery that consist of very thin, dense skin structure
supported by a thicker, porous substructural layer is also described in the literature [18–22]
. These membranes have
high flux characteristics and thus, higher release rates for poorly water-soluble drugs can be obtained.
In sandwiched osmotic tablet (SOTS), a tablet core consisting of a middle push layer and two attached
drug layers is coated with a SPM [23]
. As seen in Fig. 5, both the drug layers are connected to the outside
environment via two delivery orifices (one on each side). After coming in contact with the aqueous environment,
the middle push layer containing swelling agents swells and the drug is released from the delivery orifices. The
advantage with this type of system is that the drug is released from the two orifices situated on two opposite
sides of the tablet and thus can be advantageous in case of drugs which are prone to cause local
irritation of gastric mucosa

Chapter 1 Introduction
Osmotic Drug Delivery System Page 8
Figure 4. Schematic diagram of controlled porosity osmotic pump before and during
operation.
Figure 5. Schematic diagram of sandwiched osmotic tablet before and during operation.

Chapter 1 Introduction
Osmotic Drug Delivery System Page 9
1.2 Formulation aspects:
Before discussing the formulation variables that affect the release of drugs from oral
osmotic systems, it will be prudent to deal with some of the theoretical aspects. The delivery of
agent from oral osmotic systems is controlled by the influx of solvent across the SPM, which in
turn carries the agent to the outside environment. Water influx into EOP can be described by the
following equation [5]
:
---------------------------------------------------(1)
Where dv/dt is water influx, A and h are the membrane area and membrane thickness,
respectively; Lp is mechanical permeability; σ is the reflection coefficient; and ΔΠ and Δp are
the osmotic and hydrostatic pressure differences, respectively, between the inside and outside of
the system. The general expression for the solute delivery rate, dM/dt, obtained by pumping
through the orifice is given by:
---------------------------------------------------------------(2)
Where C is the concentration of compound in the dispensed fluid.
Reflection coefficient takes into account the leakage of solute through the membrane. A
perfectly semi permeable membrane is selectively permeable to water only and doesnot allow
solute to pass through it. Thus, in case of a perfectly semipermeable membrane, σ is close to
unity. As size of the delivery orifice increases, hydrostatic pressure inside the system is
minimized and ΔΠ >> Δp. Since, osmotic pressure of the gastro intestinal fluid is negligible as
compared to that of core, Π can be safely substituted for ΔΠ. By replacing the product Lp σ, in
equation (1), by a constant K and substituting equation (1) in equation (2), the following
equation is obtained:
----------------------------------------------------------------(3)
The best possible way to achieve a constant release from osmotic systems is through proper
selection and optimization of the SPM (To maintain the first three terms on the right hand side of
the quation constant) and maintaining a saturated solution of drug within the core. As long as
excess solid agent is present inside the system, both Π and C in equation (3) can be maintained at
constant levels. Therefore, it is possible to obtain zero-order release rates from osmotic system
by maintaining the terms in equation (3) constant.

Chapter 1 Introduction
Osmotic Drug Delivery System Page 10
1.3. Factors that affect the drug release from osmotic pumps:
1.3.1 Solubility:
The kinetics of osmotic drug release is directly proportional to the solubility of the drug
within the core. Assuming a tablet core of pure drug, the fraction of core released with zero order
kinetics is given by the following equation [24, 25]
F(z} = 1-S/p-------------------------------------------------------equation (4)
Where, F(z) is the fraction released by zero order kinetics, S is the solubility of drug, and
p is the density of the core tablets. Drugs with the solubility of less than 0.05 gm/cc would be
released with more than 95 % zero order kinetics according to equation (4). However, the zero-
order relase rate would be slow according to equation (3), due to the small osmotic pressure
gradient. Conversely, highly water soluble drugs would demonstrate a high release rate that
would be zero-order for a small percentage of the initial drug load. Thus, the intrinsic water
solubility of many drugs might preclude them from incorporation into an osmotic pump.
However, it is possible to modulate the solubility of the drugs within the core, and thus, extend
this technology for delivery of drugs that might otherwise have been poor candidates for osmotic
delivery. Some of the approaches that have been used to deliver drugs having extremes of
solubility are:
1.3.1.1 Co compression of drugs with excipients:
Incorporation of excipients that modulate the solubility of drug within the core can be one
approach to control the release of drugs from the osmotic systems. McClelland and coworkers [24,
25] reported CPOP of a highly water-soluble drug, diltiazem hydrochloride (solubility more than
590 mg / ml at 37 C). Because of very high water-solubility, the majority of the drug fraction
was released predominantly at a first-order rather than the desired zero-order rate. The solubility
of diltiazem hydrochloride was reduced to 155 mg / ml by incorporation of sodium chloride (at
1M concentration) into the core tablet formulation. The modification resulted in more than 75%
of the drug to be released by zero-order kinetics over a 14-16 h period.
Controller porosity solubility modulated osmotic pumps for delivery of drugs having low water
solubility are described in US patent nos. 4946686 and 4994273 [26, 27].
The composition
described consists of controlled release solubility modulating agents, which are either surfactants
or complexing agents. In order to prolong the availability of these excipients within the device,

Chapter 1 Introduction
Osmotic Drug Delivery System Page 11
they were either surrounded by a rate controlling membrane or dispersed in a matrix. In the
examples, tablet cores of two different drugs, namely, simvastatin and lovastatin, along with the
solubility modulating agents were prepared and coated with a microporous membrane. The
release of drug from the systems was controlled for an extended period of 4-24 h.
Herbig et al. [20]
reported osmotic delivery of doxazosin, which has pH-dependent solubility.
Tablets cores containing drug, along with organic acids (succinin and adipic acid) to increase the
solubility of doxazosin within the core, were prepared and coated with asymmetric membranes.
The solubility of doxazosin was improved in the presence of organic acids and pH-independent
release patterns were obtained.
Use of polymer coated buffer components to modulate the drug solubility within the core is
described in US patent no. 4755180 [28].
Solubility of a weakly acidic drug, acetyl salicylic acid,
was modified by a basic excipient, which maintains alkaline pH within the device. The drug and
the solubility modifying agent (sodium acetate) were coated separately by a rate controlling film
of HPMC, mixed, and compressed in the form of a tablet. The tablet cores were coated and a
hole drilled in the membrane wall. Coating of sodium acetate ensures its availability within the
device for prolonged period and thus solubility of the drug is controlled throughout the operation
life span of the device. The drug was released in predominantly zero-order fashion for the
desired period of time.
Use of buffers, which react with the drug to produce a new compound having thermodynamic
properties different from the parent drug, is described in US patent no. 4,326,525 [29]
.
Theophylline, along with L-tartaric acid and polyvinyl pyrrolidone (PVP), was formulated in the
form of EOP. Theophylline, in presence of tartaric acid, is converted to theophylline tartarate.
Theophylline free-base had a solubility of 10 mg/ml and theophylline tartarate had a solubility of
220 mg/ml in water at 37 C. Drug release from the systems was found to be constant over a
period of 7 h.
In another study [30]
, solubility of a weakly acidic drug, nimesulide, was improved by using
alkalinizing agents like disodium hydrogen phosphate and sodium bicarbonate. Nimesulide,
along with different alkalinizing agents, was formulated in the form of EOP and release profile
compared with immediate release tablets. It was found that release of nimesulide from the
osmotic pumps was relatively slow and prolonged for 12 h.
Co-compression of drugs along with solubility modulating agents can also be utilized for
Chapter 1 Introduction
Osmotic Drug Delivery System Page 12
pulsatile delivery of drugs. This was demonstrated in the case of salbutamol [31–33]
, a highly
water-soluble drug (270 mg/ml in pure water). Solubility of salbutamol was reduced by the
addition of sodium chloride in the tablet core (11 mg/ml in a saturated salt solution). Salbutamol,
along with sodium chloride was formulated in the form of osmotic pumps, which after coming in
contact with the aqueous environment, initially imbibes water at a rate controlled by the osmotic
pressure of the core formulation. Due to the presence of excess of salbutamol within the tablets,
sodium chloride is depleted first from the device. This results in decrease of osmotic pressure of
the solution inside the tablets and thus the rate of water flow into the tablet decreases. However,
the solubility of salbutamol is increased due to a fall in sodium chloride concentration and its
delivery to the body actually increases. The net result is a tablet formulation that initially delivers
salbutamol at a relatively constant rate, until sodium chloride gets exhausted. After this, the
remaining drug is delivered as a large pulse. Using this approach, zero-order release was
achieved for about 7 h, followed by a pulsatile release of 7–9 h.
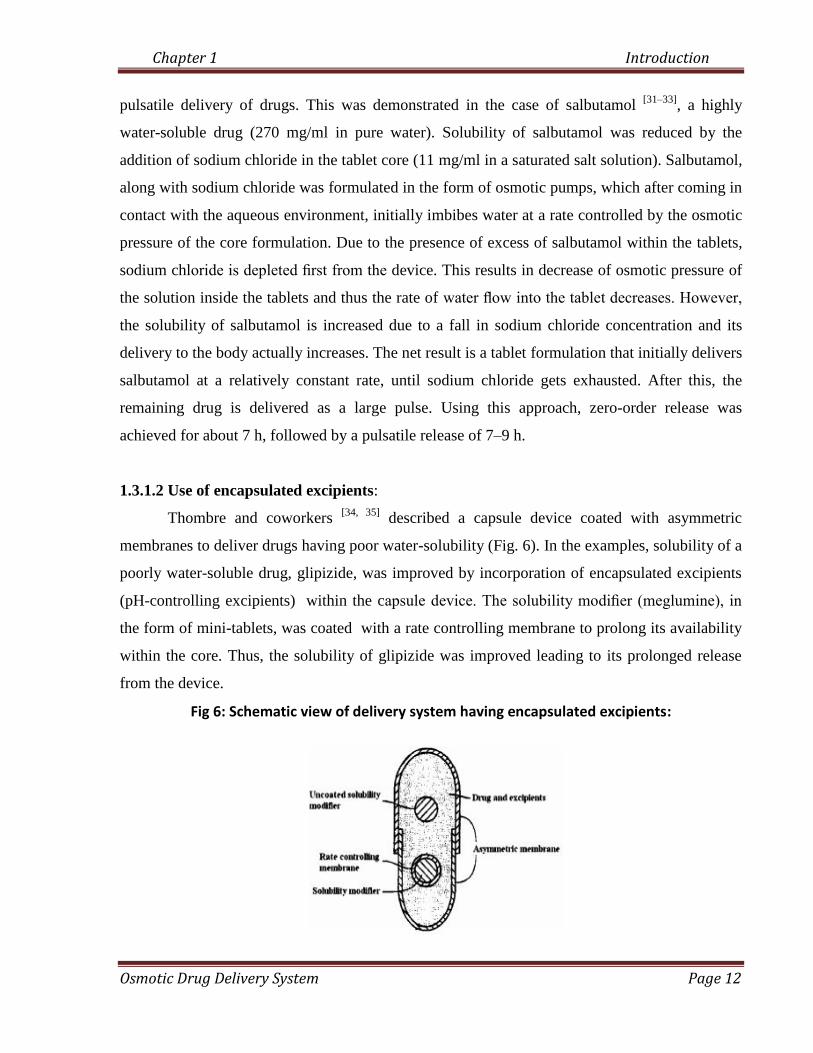
1.3.1.2 Use of encapsulated excipients:
Thombre and coworkers [34, 35]
described a capsule device coated with asymmetric
membranes to deliver drugs having poor water-solubility (Fig. 6). In the examples, solubility of a
poorly water-soluble drug, glipizide, was improved by incorporation of encapsulated excipients
(pH-controlling excipients) within the capsule device. The solubility modifier (meglumine), in
the form of mini-tablets, was coated with a rate controlling membrane to prolong its availability
within the core. Thus, the solubility of glipizide was improved leading to its prolonged release
from the device.
Fig 6: Schematic view of delivery system having encapsulated excipients:

Chapter 1 Introduction
Osmotic Drug Delivery System Page 13
1.3.3.3 Use of swellable polymers:
Swellable polymers can be utilized for osmotic delivery of drugs having poor aqueous
solubility. Examples using this approach are reported in US patent no. 4,992,278 [36]
for
carbamazepine, theo- phylline, acetylsalicylic acid, and nifedipine. The formulation mainly
consists of a compartment, containing the drug, swelling agents, and osmagents, coated with a
rate controlling membrane. Vinylpyrrolidone /vinyl acetate copolymer (Kollidon VA 64, BASF)
and polyethylene oxide (MW: 5 x 10⁶, Polyox -coagulant, Union Carbide) were used as swelling
agents. Uniform rate of swelling of these polymers ensures that the drug is released at a
relatively constant rate. Also, the pressure produced during swelling does not lead to rupture of
the system.
In addition, PPOP can also be utilized for delivery of drugs having either high, e.g. oxybutynin
chloride [37]
, or low water solubility, e.g. glipizide [38–41]
. Drug is released from the delivery
orifice in the form of very fine dispersion ready for dissolution and absorption.
Sandwiched osmotic tablets (SOTS) have also been utilized for osmotic delivery of water
insoluble drugs, such as nifedipine [23]
. The release profile from the tablets was found to be
comparable with the
commercially available push–pull osmotic system of the drug.
1.3.3.4 Use of effervescent mixtures:
Use of effervescent mixtures can be another approach to deliver poorly water soluble
drugs from osmotic dosage forms. After administration, the effervescent mixture containing the
drug is delivered under pressure through the delivery orifice in the membrane. This method of
enhancing release of poorly water-soluble drug is reported in US patent no. 4,036,228 [42]
. In one
of the examples, citric acid and sodium bicarbonate were used as the effervescent couple for the
delivery of acetyl salicylic acid. The formulation imbibes aqueous fluids across the membrane
causing the couple to generate an effervescent solution that dispenses the drug in a suspension
form.
1.3.3.5 Use of cyclodextrin derivatives:
Incorporation of the cyclodextrin–drug complex has also been used as an approach for
delivery of poorly water-soluble drugs from the osmotic systems. A CPOP has been described

Chapter 1 Introduction
Osmotic Drug Delivery System Page 14
for testosterone (having a solubility of 0.039 mg/ml at 37 C), solubility of which was improved
to 76.5 mg/ml through complexation with sulfobutyl ether-b-cyclodextrin sodium salt[43]
. In a
comparative study with hydroxypropyl-b-cyclodextrin (HP-b-CD) and a sugar mixture, it was
found that testosterone release from the device in the presence of (SBE)- -b-CD was mainly due
to osmotic pumping while for HP-b -CD, the major contribution was due to diffusion. In case of
the sugar mixture, the drug was poorly released due to the absence of solubilizer. Similar results
were obtained with prednisolone [44]
and chlorpromazine [45]
.
1.3.3.6 Resin modulation approach:
Release of a highly water-soluble drug, diltiazem hydrochloride from a CPOP was
modulated effec- tively using positively charged anion-exchange resin, poly (4-vinyl pyridine)
[25]. Pentaerythritol was used as osmotic agent and citric and adipic acids were added to maintain
a low core pH to assure that both the drug and resin carry a positive charge. The solubility of
diltiazem hydrochloride was reduced for an extended period and pH-independent zero-order
release was obtained.
1.3.3.7 Use of alternative salt form:
For an ionic drug, an alternative salt form can also be used as reported for metoprolol and
oxprenolol[2].
Hydrochloride salt used in commercial formulations of oxprenolol was found to
have high water solubility (70% w/v) making it difficult to achieve extended zero-order delivery
from osmotic systems. It was replaced by the less soluble succinate salt. In case of metoprolol,
they used fumarate salt form as drug and osmotic driving agent, instead of tartrate salt. These salt
forms were found to have optimum solubility and provided extended release up to 24 h.
1.3.3.8 Use of crystal habit modifier:
If the drug exists in more than one crystal form, each having different aqueous solubility,
it is benefi- cial to include a crystal modifying agents. One such example is reported in US
patent no. 5,284,662 [46]
, wherein a slightly soluble drug, carbamazepine, along with crystal
modifying agents (combination of hydroxymethyl cellulose and hydroxyethyl cellulose) and
other excipients was formulated in the form of osmotic pumps that were able to provide
approximately zero-order release for the desired period of time.

Chapter 1 Introduction
Osmotic Drug Delivery System Page 15
1.3.3.9 Use of Lyotropic crystals:
Use of lyotropic liquid crystals, to assist osmotic delivery of poorly water soluble drugs,
is also reported in the literature [47, 48]
. The lyotropic liquid crystals are non-polymeric
compounds, generally in the molecular weight range of 200–1500. Also known as amphipathic
compounds, these form mesophases and swell in presence of water. Compounds that can be used
as lyotropic liquid crystals include natural phosphatides such as phosphatidylcholine (lecithin),
phosphatidylethanolamine, phosphatidylserine, phosphatidylglycerol, and the like. Few examples
using this approach are mentioned in US patent no. 5,108,756 and 5,030,452. In these examples,
Alcolec lecithin (American Lecithin Co.,Atlanta, GA) and mixture of soybean phospholipids was
utilized for osmotic delivery of two insoluble drugs, namely, glipizide and prazosin. The
inventors claimed that the extended drug release up to 24 h was achieved.
1.3.3.10 Use of wicking agents:
Inclusion of wicking agents in the osmotic formulations has also been reported as an
approach for poorly water-soluble drugs [49]
. A wicking agent is dispersed throughout the
composition that enhances the contact surface area of drug with the incoming aqueous fluids.
Thus, the drug is released predominantly in a soluble form through the delivery orifice in the
membrane. The authors delivered nifedipine using this approach and some of the reported
wicking agents are colloidal silicon dioxide, PVP, sodium lauryl sulfate, etc.
1.3.2 Osmotic pressure
Osmotic pressure, like vapor pressure and boiling point, is a colligative property of a
solution in which a nonvolatile solute is dissolved in a volatile solvent. Osmotic pressure of a
solution is dependent on the number of discrete entities of solute present in the solution. From
Eq. (3), it is evident that the release rate of a drug from an osmotic system is directly
proportional to the osmotic pressure of the core formulation. For controlling the drug release
from these systems, it is important to optimize the osmotic pressure gradient between inside
compartment and the external environment. It is possible to achieve and maintain a constant
osmotic pressure by maintaining a saturated solution of osmotic agent in the compartment [6]
. If a
drug does not possess sufficient osmotic pressure, an osmagent can be added in the formulation.
Some of the compounds that can be used as osmagents are listed in Table 2.

Chapter 1 Introduction
Osmotic Drug Delivery System Page 16
Polymeric osmagents are mainly used in the fabrication of PPOPs and other modified devices for
controlled release of drugs with poor water solubility. These are swellable, hydrophilic polymers
that interact with the aqueous fluids and swell or expand to an equilibrium state. These polymers
have a capacity to retain a significant portion of the imbibed water within the polymer structure
[8].
It is possible to confirm the contribution of osmotic pressure in drug release from osmotic
systems by conducting the release studies in media of different osmotic pressure. The release
rates obtained can be plotted against the osmotic pressure difference across the device wall.
Using this approach, release of potassium chloride from CPOP was studied in aqueous media of
different osmotic pressure. An inverse relationship was found between the two [13,14]
. A linear
relationship was obtained confirming osmotic release from the system.
Table 2: List of Compounds that can be used as osmagents
Category Examples
Water-soluble salts of inorganic acids Magnesium chloride or sulfate; lithium, sodium, or
potassium chloride; lithium, sodium, or potassium
sulfate; sodium or potassium hydrogen phosphate,
etc.
Water-soluble salts of organic acids Sodium and potassium acetate, magnesium
succinate, sodium benzoate, sodium citrate,
sodium ascorbate, etc.
Water-soluble amino acids Glycine, leucine, alanine, methionine, etc.
Carbohydrates Arabinose, ribose, xylose, glucose, fructose,
galactose, mannose, sucrose, maltose, lactose,
raffinose, mannitol.
Organic polymeric osmagents Sodium carboxy methylcellulose, HPMC,
hydroxyethyl methylcellulose, cross-linked PVP,
polyethylene oxide, carbopols, polyacrylamides,
etc.

Chapter 1 Introduction
Osmotic Drug Delivery System Page 17
1.3.3 Delivery orifice:
Osmotic delivery systems contain at least one delivery orifice in the membrane for drug
release. The size of delivery orifice must be optimized in order to control the drug release from
osmotic systems. If the size of delivery orifice is too small, zero-order delivery will be affected
because of development of hydrostatic pressure within the core. This hydrostatic pressure may not be
relieved because of the small orifice size and may lead to deformation of delivery system, thereby
resulting in unpredictable drug delivery. On the other hand, size of delivery orifice should not also be
too large otherwise; solute diffusion from the orifice may take place. There are mathematical
calculations that can be used to calculate the optimum size of the delivery orifice [5]
. Drug release from
osmotic systems is not affected by the size of the delivery orifice withincertain limits as reported in the
following examples Drug release from osmotic pumps of nifedipine was studied as a function of
orifice diameter and no significant differences were found in the release profiles for orifice diameter
ranging from 0.25 to 1.41 mm [50]
. Drug release was somewhat rapid with an orifice diameter of 2.0
mm possibly because of significant diffusion. On the other hand, a longer lag time and unpredictable
and slower release rates were obtained from the systems without any orifice.
In a study by Theeuwes [5]
, a complete membrane controlled delivery of potassium chloride
was obtained with orifice diameter in the range of 0.075– 0.274 mm. At orifice size of 0.368 mm and
above, control over the delivery rate was lost because of significant contribution from diffusion and
possibly convection. However, no systematic trends were observed within the orifice diameter
between 0.075 and 0.274 mm.
Delivery orifices in the osmotic systems can be created with the help of a mechanical drill [30,
51–56], but for commercial production scale, tablets need to be produced using a continuous process.
Some of the reported processes to create delivery orifices in the osmotic systems are
1) Laser drilling
2) Systems with passage way formed in situ
3) Use of modified punches
4) Use of pore formers

Chapter 1 Introduction
Osmotic Drug Delivery System Page 18
1.3.4 Membrane types and characteristics
The choice of a rate-controlling membrane is an important aspect in the formulation
development of oral osmotic systems. From Eq. (3), the importance of rate-controlling
membrane in the drug release can be easily recognized. Drug release from osmotic systems is
independent of the pH and agitational intensity of the GI tract to a large extent. This is because
of selectively water permeable membrane and effective isolation of dissolution process from the
gut environment [2,5]
. To ensure that the coating is able to resist the pressure within the device,
thickness of membrane is usually kept between 200 and 300 mm [3]
. However, this may be
problematic in cases where the drug is having low osmotic pressure because of which incomplete
/ slow drug release may take place. Selecting membranes that are having high water
permeabilities can be a solution to this problem. One approach that can be utilized is by using
composite walls [64]
.The tablet cores are coated with a membrane that has a passageway through
the wall for releasing the agent. The wall is formed of a multiplicity of materials comprising a
material permeable to an external fluid and substantially impermeable to agent (like CA) and at
least one additional material selected from a group of materials that imparts stability to the wall
and enhances the permeability of the wall to fluids (like HPMC or hydroxyl butyl
methylcellulose). Another approach that can be explored is to use a multilayer composite coating
around the tablet [65]
. The first layer is a thick microporous film that provides the strength
required to withstand the internal pressure, while the second layer is a relatively thin SPM that
produces the osmotic flux. Hence, high delivery rates can be obtained even for drugs with poor
water solubility.
Some of the membrane variables that are important in the design of oral osmotic systems
are;
1.3.4.1. Type and nature of polymer
Since the membrane in osmotic systems is semipermeable in nature, any polymer that is
permeable to water but impermeable to solute can be selected. Some of the polymers that can be
used for above purpose include cellulose esters such as cellulose acetate, cellulose diacetate,
cellulose triacetate, cellulose propionate, cellulose acetate butyrate,etc. [66]
; cellulose ethers like
ethyl cellulose [67]
;and eudragits [68]
.
Cellulose acetate (CA) has been widely used to form rate-controlling membranes for

Chapter 1 Introduction
Osmotic Drug Delivery System Page 19
osmotic systems. CA films are insoluble, yet semipermeable to allow water to pass through the
tablet coating. The water permeability of CA membrane is relatively high and can be easily
adjusted by varying the degree of acetylation. As the acetyl content in the CA increases, the CA
film permeability decreases, and solvent resistance increases. The permeabilities of these films
can be further increased by the addition of hydrophilic flux enhancers. Incorporation of
plasticizer in CA coating formulation generally lowers the glass transition temperature, increases
the polymer-chain mobility, enhances the flexibility, and affects the permeability of the film [69]
.
Ethyl cellulose is also widely used in the formation of membranes for oral osmotic
systems. However, the water permeability of pure ethyl cellulose membrane is very low that may
result in slow release of drugs [70]
. Nevertheless, drug release from osmotic systems coated with
ethyl cellulose membrane can be enhanced by incorporation of water-soluble additives. Addition
of HPMC in the coating composition improves the permeability of ethyl cellulose membranes.
Tablet cores of potassium chloride coated with a mixture of ethyl cellulose and up to 24% of
HPMC, were shown to release the contents mainly through osmotic mechanism [70,71]
. In another
study [62]
, urea was added to commercially available ethyl cellulose aqueous dispersion
(Aquacoat) in an attempt to increase the release rates of potassium chloride and diltiazem
chloride from osmotic tablets. It was found that the drug release from these systems is affected
by coating thickness, plasticizer type and concentration, and pore-former level.
The use of eudragit acrylic latexes as membrane formers for osmotic systems has also
been reported in the literature [68]
. Potassium chloride tablets were coated with mixtures of
eudragit RS30D and RL30D containing triethyl citrate or acetyl tributyl citrate as plasticizers and
urea as a pore-forming agent. The release rate was most affected by the ratio of RS30D to
RL30D and the level of urea was found to have effect on lag time and burst strength. The type of
plasticizer and amount of pore former were alsofound to be critical for the desired release rates.
The mechanism of release from the formulations containing acetyl tributyl citrate as plasticizer
and 100% urea level (of total polymer solids) was found to be primarily osmotic and these
formulations exhibited similar release rates in water and phosphate buffer saline pH 7.4.
1.3.4.2. Membrane thickness
Thickness of the membrane has a profound effect on the drug release from osmotic
systems. It can be seen from Eq. (3) that release rate from osmotic systems is inversely

Chapter 1 Introduction
Osmotic Drug Delivery System Page 20
proportional to membrane thickness. Pellets of phenylpropanolamine coated with an aqueous
ethyl cellulose based films were found to release the drug mainly through the mechanisms of
osmotic pumping and diffusion [72]
. On studying the release as a function of coating thickness, it
was found that as the coating thickness increased from 9 to 50 mm, the drug release decreased in
an inversely proportional manner. In case of monolithic osmotic tablets of nifedipine, release
rates were found to decrease with increase in membrane thickness from 85 to 340 mm [50]
. An
increased resistance of the membrane to water diffusion resulted in this effect.
On the other hand, thickness of the membrane in case of asymmetric coating was found
to have insignificant effect on drug release. In a study by Herbig et al. [20]
, release rates were
found to be virtually unaffected by the overall membrane thickness in the range of 95–150 mm.
The possible reason for this may be the unique structure of the asymmetric membrane coatings in
which the porous substrate consists of open pores (void volume between 60 and 90%). Since
most of resistance to the transport is the skin structure rather than the porous substrate of the
asymmetric membranes, the thickness of the porous substrate had only a slight effect on the
release kinetics.
1.3.4.3. Type and amount of plasticizer
In pharmaceutical coatings, plasticizers or low molecular weight diluents are added to
modify the physical properties and improve film-forming characteristics of polymers. Plasticizers
can change visco-elastic behavior of polymers significantly. In particular, plasticizers can turn a
hard and brittle polymer into a softer, more pliable material, and possibly make it more resistant
to mechanical stress. These changes also affect the permeability of polymer films.
The effect of different types of plasticizers (TA and polyethylene glycols) on the water
permeation and mechanical properties of CA was reported by Guo [73].
The water permeability of
CA films was found to decrease with increasing plasticizer concentration to a minimum and then
increases with higher concentration of plasticizer. Low plasticizer concentrations were found to
decrease water permeability by their antiplasticization effect. This antiplasticization effect could
be because of interaction between the polymer and the plasticizer molecules that decreased the
molecular mobility of the polymer. In a similar study [74]
, Guo investigated the effect of PEG-600
on the sucrose permeability, void volume, and morphology of CA films. The sucrose
permeability was found to decrease with increasing PEG-600 concentration and increase

Chapter 1 Introduction
Osmotic Drug Delivery System Page 21
dramatically when they were plasticized by over 30% (w / w). The decrease in sucrose
permeability at lower plasticizer concentration was attributed to the antiplasticization effect. The
increase in sucrose permeability at higher plasticizer concentration was because of formation of
plasticizer channels, results of which were confirmed by the void volume and scanning electron
microscopic studies.
Liu et al. [75]
studied the influence of nature and amount of plasticizers on the properties
of CA membrane including drug release profile, thermal properties, microporosity, and
mechanical properties. Hydrophilic plasticizer (PEG-200) was found to increase the drug release,
whereas hydrophobic plasticizer (TA) was found to decrease the drug release from osmotic
pumps of nifedipine. Films plasticized with PEG developed completely porous structure after 24
h leaching, whereas films plasticized with TA retained their dense structure and porosity was
observed only on the surface. At low plasticizer levels (0–5% w / w), it was found that both the
ultimate tensile strength (σu) and elastic modulus (E) of dry membranes increased as the
plasticizer level increased and there was no significant difference because of the nature of
plasticizer. However, at higher plasticizer levels (5–40% w / w), both σu and E of membranes
decreased as plasticizer levels increased.
Drug release from potassium chloride tablets coated with microporous membrane was
found to decrease with increasing plasticizer concentrations from 24 to 48% w / w [62]
. Higher
release rates were observed with TEC as compared to dibutyl sebacate (DBS) at equal
concentrations. These results can be attributed to differences in aqueous solubilities of
plasticizers. Since DBS is more hydrophobic than TEC, it decreases the water permeability of the
membrane and hence the drug release.
In another study by Okimoto et al. [76]
, chlorpromazine (CLP) release from controlled
porosity osmotic tablets was found to increase with decreasing amounts of TEC. Drug release
was also found to be much faster in formulations containing PEG-400 as a plasticizer than with
TEC and was similar to that PEG-400 is not a very effective plasticizer.
Bindshaedler et al. [77]
have described mechanically strong films produced from CA
latexes. By proper choice of type of plasticizer and its content in the coating composition,
membranes comparable with those obtained from organic solutions can be produced from CA
latexes. Water-soluble plasticizers possessing some degree of volatility resulted in films that had
high ultimate tensile strength and elasticity modulus. In the series of films prepared with

Chapter 1 Introduction
Osmotic Drug Delivery System Page 22
cellulose latexes containing different types and amount of plasticizers, it was found that the films
plasticized with volatile additives (ethylene glycol monoacetate and ethylene glycol diacetate)
were nearly as strong as those resulting from evaporation of solution in acetone. The majority of
volatile plasticizer evaporates during the processing of the film at 60 C. On the other hand, more
permanent plasticizers (triethyl phosphate and diethyl tartarate) are retained in the film and yield
membranes that are weak and less resistant. Thus, by proper selection of these volatile
plasticizers, it is possible to balance two contradictory requirements, i.e. high mechanical
strength of films and initial high amounts of plasticizer. In a similar study by the same group of
workers [78]
, very volatile plasticizers, such as ethylene glycol monoacetate and ethylene glycol
diacetate, were used to produce films with low permeability. More permanent plasticizers, such
as diethyl tartrate or diacetin, resulted in films that were much more permeable.
1.4 Advantages of ODDS:
1. Drug release from these systems is independent of pH and other physiological parameters to a
large extent
2. Release Rates are Independent of Agent Properties
3. Can Deliver Macromolecules and Ionic Species
4. Relatively High Fluxes
5. Release Rates are not dependent on Environmental Conditions
6. Osmotic pumps can be used as experimental tools to determine important pharmacokinetic
parameters of new or existing drugs.
1.5 Disadvantages of ODDS:
1. Subject to dose dumping if membrane breaks [e.g. someone chews it]
2. Slightly more expensive to formulate than coating tablets
3. Possible hole plugging.

CHAPTER 2
REVIEW OF LITERATURE

Chapter 2 Review of Literature
Osmotic Drug Delivery System Page 23
2.0 Review of literature:
Theeuwes et al, 1983 85
Designed a system based on the principle of an elementary osmotic
pump to deliver Indomethacin in solution at a constant rate. Total amount of drug released &
80% of drug released at time t80 was studied. To allow selection of the optimal delivery rate into
the body, three different prototypes were prepared with respective values for release rate, amt
and t80: 7mg\hr, 85 mg, 11 hr, 9mg\hr, 85mg, 8 hr, and 12mg \hr, 85mg, 6hr. Systems were
found to deliver 70% of their content at zero – order rates. Delivery rates were independent of
pH, method of estimation & stirring rate. In GI tract of dogs system delivered at the same rate as
the vitro, which qualifies the in vitro test as bioanalogaus method predictive of the in vivo
performance of the dosage forms.
Theeuwes et al, 1985 86
Described oral osmotic system development aspects and evaluation for
Metoprolol fumarate and Oxprenolol succinate Release was unaffected by pH, dissolution
media, long term storage at different temperatures and test procedures.
.
Theeuwes et al, 1985 87
Developed an elementary osmotic pump, a new delivery system for
drugs or other active agents that delivers the agents by an osmotic process at a controlled rate.
Control resides in :(a) water permeation characteristics of a semipermeable membrane
surrounding the formulated agent, and (b) osmotic properties of the formulation. In its simplest
embodiment, the system is constructed by coating an osmotically active solid agent with the rate
controlling, semipermeable membrane. This membrane contains an orifice of critical size
through which solubilized agent is dispensed. The system contains the agent in solid form at
loading higher than 90% of the total volume, and the agent can be delivered at rates several order
of magnitude higher than can be achieved by solution diffusion through polymeric membranes.
The delivery rate, the fraction of total content delivered at zero order, and the system’s delivery
portal size have been calculated for delivery of a single compound. The release rate from the
system was found to be independent of outside agitation when the system was not deformed by
shaking action, the pH of the environment, and delivery portal size for sizes within a specified
Chapter 2 Review of Literature
Osmotic Drug Delivery System Page 24
range. The delivery rate from this system in vitro and in the GI tract of dogs was found to be
equal.
Zentner et al, 1985 88
Investigated the zero-order release of water soluble osmotically active
agents from tablets coated with controlled porosity walls containing Cellulose acetate. Release
rate was a function of the wall thickness, level of leachable additives incorporated, and
permeability of the polymer component of the walls, total solubility of the core tablet, drug
loading and the osmotic pressure difference across the wall. Rate of release was insensitive to the
pH and degree of the agitation in the receptor media.
Bindschaedler et al, 1987 89
Proposed the use of aqueous colloidal dispersion of cellulose
acetate instead of organic solutions as an alternative to obtain osmotic tablets. They observed
that the release rate of model drug potassium chloride from coated tablets produced from
aqueous dispersions was higher because semipermeable membranes produced from latexes were
more permeable to water and swollen to a greater extent than those prepared from organic
solutions. They also observed that the physico–chemical properties, concentration of plasticizer
and coating conditions determine the permeability and solute release rates of the membranes.
Haslam, 1989 90
Prepared an osmotic pump for the controlled release of Diltiazem. The core
consisted of Sodium bitartarate, Dilitizem and Povidone potassium, coated with a membrane that
is impermeable to solute but permeable to water, with a pH insensitive pore forming additive. A
solution containing Cellulose acetate, Sorbitol and Polyethylene glycol was used as a coating
agent. Controlled released was achieved at pH 1.2 and pH 7.5.
Edgren, 1990 91
Prepared a compressed drug core containing hydralazine HCl, coated with a
semi-permeable enteric composition consisting of Cellulose acetate, Hydroxypropyl
methylcellulose phthalate and triacetin. A 1.0 mm hole was laser drilled through the wall.
Hydralazine HCl release rate was found to be 0.5 mg/h in gastric fluid and 3 mg/h in intestinal
fluid.
Chapter 2 Review of Literature
Osmotic Drug Delivery System Page 25
Sutinen, 1990 92
Studied the release of lipophilic (Propranolol) and hydrophilic (Sotalol) weak
bases from silicone reservoir devices. Solid HCl salts of the drugs were entrapped between two
silicon membranes along with their buffering or osmotic additives. Drug release was achieved by
water influx into the core. Mannitol in the silicone membrane increased the water influx but did
not increase the release of model drug. Sodium chloride in the core increased water influx but the
pH of the core and the model drug release were unaffected. When Tris and/or Na2HPO4 added to
the core, the pH increased and the drug release rate also increased by several hundred folds.
Sotalol was too hydrophilic even in its unionized state to be released through the silicone walls.
Deters, 1994 93
Formulated an osmotic device for Doxazosin in which the first composition
contained Doxazosin, Polyethylene oxide and HPMC and a second composition contained
Polyethylene oxide, Sodium chloride and HPMC. The components were compressed to give a
bilayer tablet containing a drug layer and an osmotic push layer and coated with coating
composition consisting of 90% cellulose acetate and 10% polyethylene glycol. A 20mm orifice
was drilled. They obtained controlled release of 0.48 mg/h.
Lindstedt, 1994 94
studied the permeability of ethyl cellulose film was increased by addition of
HPMC in the film composition. They found that core of Potassium chloride coated with ethyl
cellulose and up to 24% HPMC, released their contents mainly through osmotic pumping. It was
reported that water permeability of a semipermeable membrane was the primary release rate-
regulating parameter in osmotic devices.
Brain et al, 1994 95
Outlined the mechanism governing the release of osmotically active agents
from hydrophobic polymeric monoliths. The release kinetic was loading dependent. Below
required loading, excipients released with zero order kinetics while above the percolation
diffusion & osmotic release mechanism occurs simultaneously resulting in a release profile that
appears to be diffusionally controlled but whose slope increases with excipient osmotic activity.
A model was developed to correlate concentration and density of the incorporated agents. The
tensile strength of elastic model system and hydraulic permeability of the polymer and the

Chapter 2 Review of Literature
Osmotic Drug Delivery System Page 26
fraction of particles released by dissolution and diffusion were correlated. The model was
correlated against data form experiments and the literature.
Brain et al, 1994 96
prepared Ethylenecovinylacetate monolith containing osmotic excipient of
varying particles size and at various volume fractions. The excipients chosen were Potassium
chloride, Sodium chloride, Sodium salicylate, Sodium phosphate, Monobasic sodium carbonate.
The total fraction released was found to be increased as the volumetric loading and the excipient
osmotic activity increased and was weakly inversely dependent on particle size. The total
fraction release was enhanced by osmotic pressure inducing polymer. A model was developed
based on the concept of distribution of particles wall thickness around encapsulated particles in
the monolith and the existence of a critical wall thickness. The model effectively explains the
contribution of osmotic rupturing to the overall fraction releasable.
Shah, 1995 97
Prepared an oral osmotic system for the controlled release of metoprolol, which
consisted of an osmotically active amount of a Metoprolol salt, a separate inner layer of a water
soluble coating material, a separate outer semipermeable layer and a passageway between the
two layers. System has improved adhesion to the core and avoided the disadvantages of usual
osmotic system, such as flaking of the outer layer breaking up due to the action of the body
fluids.
Wong, 1995 98
The osmotic device comprises of a drug compartment surrounded by a wall. KCI
98.7%, SIO2 1.2% & Stearic acid 0.1% w/w were compressed in to core of 500 mg and were
coated with an aqueous emulsion containing Ethyl acrylate – Methyl acrylate copolymer 36%,
ethyl cellulose 24% and PVA 4% w/w. The coated product was cured in a forced air oven for 30
hours at 50 C and a 0.37 mm exit pore was laser drilled. Zero order release of KCl was observed
from the coated tablets. The film characteristics were affected by curing time and temperature.
.
Vyas et al, 1995 99
Designed an elementary osmotic pump bearing Ciprofloxacin HCl, which
delivers drug by osmotic process. The system was coated with 2% cellulose solution. The

Chapter 2 Review of Literature
Osmotic Drug Delivery System Page 27
coating thickness was optimized. The exit pore was drilled on the system. The effect of variables,
which could influence release pattern, was elucidated. The system was subjected to stability
study at accelerated temperature conditions. The release profile of the developed system was
compared with conventional capsular form. The system was found to release drug at controlled
rate and showed appreciable stability.
Schultz, 1997 100
Investigated the effect of varying amount of TEC as plasticizer and micronized
talc. The mechanical properties of dry & swollen film samples & plasticizer elution from free
films during swelling were determined and compared to dissolution results. Increased
lipophilicity of Plasticizer led to an increase in swelling time of the pellets. The dissolution rate
was decreased by the use of more lipophilic plasticizer. The type of plasticizer employed had no
effect on the mechanical properties of dry and wet films containing various amounts of
plasticizer and talc. In addition, the dissolution rate was influenced mainly by the plasticizer
fraction. An increasing amount of talc had no effect on the mechanical properties of swollen film
but increased lag time of drug dissolution from the coated formulation.
Johnson, 1997 101
Prepared a once an year implantable osmotic delivery system (DUROS
leuprolide implant) for the treatment of advanced prostate cancer Leuprolide acetate was
formulated as a 37% solution in an aqueous and non-aqueous solution for use in the DUROS
application. The formulation was stable during the operational life of the implant (1 year). The
feasibility of the DUROS implants was demonstrated
Cardinal et al, 1997 102
Described delivery systems, which provide controlled release of drug
through different membranes by diffusion and/or osmotic pumping. Tablets containing Glipizide,
N – Methyl glucomine and Magnesium stearate were prepared and then coated with glycerol and
cellulose acetate solution. The tablet coating consisted of a largely porous layer. In simulated
intestinal fluid, the drug was released at a controlled rate (50% in 3.5 hours and 90% in 10-12
hours.).
Chapter 2 Review of Literature
Osmotic Drug Delivery System Page 28
Lee and co workers (1998) 103
prepared osmotic drug delivery system of metoprolol using
povidone and magnesium stearate. The cores were coated with cellulose acetate and
subsequently a bore with 0.5 mm diameter was drilled. Amount of the drug released during 0-2,
4-6 and 10-12 hours was 18.7, 61.2 and 92.5% respectively.
Magruder et al, 1999 104
A mixture of Salbutamol sulfate, Sodium chloride,
Carboxymethylcellulose and Polyvinyl pyrrolidone sulfate was compressed using 14.7-19.6 N
pressure. The cores were coated with a mixture of Cellulose acetate (39.8% acetyl content)
Cellulose acetate (32% acetyl content), Hydroxypropyl methyl cellulose in dichloromethane-
methanol (4:1), dried and a 0.25 mm hole was bored in the coating with a laser. Zero-order
release of Salbutamol sulfate was Obtained. The drug chamber contained a modulating agent,
which prompted the drug release.
Herbig et al, 1999 105
Developed a new type of membrane coating for osmotic drug delivery that
offers significant advantages over the membrane coating used in conventional osmotic tablets.
These new coatings have an asymmetric structure, similar to asymmetric membranes made for
reverse osmosis or ultra filtration, in that the coating consists of a porous substrate with a thin
outer skin. These asymmetric membrane coatings can be used to make osmotic drug delivery
formulations with several unique characteristics. High water fluxes can be achieved, facilitating
osmotic delivery of drugs with low solubility and making higher released. The permeability of
the coating to water can be adjusted by controlling the membrane structure, thereby allowing
control of the release kinetics without altering the coating material or significantly varying the
coating thickness. In addition, porosity of the skin can be controlled, minimizing the time lag
before drug delivery begins and allowing the drug to be released from a large number of delivery
ports. The coatings have also been applied to capsules and multiparticulate formulations.
Longxiao Liu, et al. 2000 106
, studied Sandwiched Osmotic Tablet System (SOTS) which is
composed of a sandwiched osmotic tablet core surrounded by a cellulose acetate membrane with
two orifices on both side surfaces prepared with the purpose of delivering nifedipine. The

Chapter 2 Review of Literature
Osmotic Drug Delivery System Page 29
sandwiched osmotic tablet core consists of a middle push layer and two attached drug layers.
Influences of tablet formulation variables, orifice size and membrane variables on nifedipine
release of SOTS have been studied. It wad observed that the SOTS gives fairly comparable in
vitro release features as that of commercialized push–pull osmotic tablet system, such as an
approximately constant rate up to 24 h and independence of release media and agitation rate.
Exempting side identification before drilling, it is easier to prepare the SOTS than the push–pull
osmotic tablet system.
En-Xian Lu, 2003 107
, studied a monolithic osmotic tablet system (MOTS) with two orifices in
both side surfaces. Water-insoluble naproxen was selected as the model drug. Gum arabic was
used as an osmotic, suspending and expanding agent and cellulose acetate (CA) was used as
semipermeable membrane. Polyethylene glycol 400 (PEG-400) was employed as plasticizer for
controlling membrane porosity. The influences of gum arabic, PEG-400, membrane thickness
and orifice size on the naproxen release profiles were investigated, and the optimal MOTS was
evaluated in different environment media and stirring rates. The optimal MOTS was found to be
able to deliver naproxen at a rate of approximately zero order up to 12 h in pH 6.8, cumulative
release at 12 h is 81%, independent on environment media and stirring rate. Therefore, this
MOTS can be used in oral drug-controlled delivery field, especially for water-insoluble drug
D. Prabakaran, 2003 108
Sustained release asymmetric membrane capsular systems were
developed for simultaneous oral delivery of rifampicin and isoniazid sodium in order to reduce
the problems associated with the multi drug therapy of tuberculosis. Dense semipermeable
membrane coating capsules were also prepared for the delivery of these drugs by adopting two
different filling approaches. Asymmetric membrane capsules provided sustained release of
rifampicin associated with initial burst release, where isoniazid release rates were comparatively
high due to higher aqueous solubility. Dense semipermeable membrane systems provided
controlled release of both drugs but were devoid of initial burst release of isoniazid. The system
provided satisfactory sustained release of rifampicin and isoniazid with initial burst release may
be sufficient to achieve minimum effective concentration in blood. In vitro dissolution kinetics of

Chapter 2 Review of Literature
Osmotic Drug Delivery System Page 30
the systems followed first order kinetics and statistical analysis of release rate data proved that
modified asymmetric system was better amongst the developed systems.
MEENA RANI, 2003 109
designed Osmotic Pump (OP) tablets and evaluated with the aim to
deliver diclofenac sodium (DS) in a controlled manner. In vitro evaluation was done in various
release me dia and kinetics was evaluated using the regression coefficient analysis. Effects of
orifice size, coating membrane type, coating thickness, static and stirred conditions and pH
variation were studied. In vivo evaluation was performed on six healthy human volunteers and
various pharmacokinetic parameters (cmax, tmax, AUC0–24, MRT) and relative bioavailability
were calculated. The drug release from OP tablets was dependent on the type and thickness of
the coating membrane, but was independent of the orifice size and static and stirred conditions of
the release medium. The OP tablets provided a prolonged and controlled DS release compared to
commercial sustained-release and conventional tablets of DS.
D. Prabakaran, 2003,110
studied the effect of appropriate hydrophilic polymers (HP) on the
release pattern of Plain Diltiazem elementary osmotic pump. Ingredients of the system were
optimized for parameters like drug:polymer ratio and amount of osmogent, for the desired
release pattern. From the results obtained, it was inferred that the release of freely water-soluble
drug Diltiazem from elementary osmotic pump can be controlled efficiently by the addition of
HPs in to the core formulations. The pumps gave better controlled release and time duration for
the release can be extended up to 24 h. This can lead to the development of these formulations as
potential candidate for once a day dosage form. The kinetics of drug release from formulations
follow Hixson–Crowell cube root model and mechanism of release would follow non-Fickian
diffusion process. It can be concluded from the study that HPs can play a considerable role in
controlling the release of Diltiazem (or other highly water-soluble drugs) from elementary
osmotic pumps.
Longxiao Liu, 2006,111
studied a method for the preparation of monolithic osmotic pump tablet
by coating the indented core tablet compressed by the punch with a needle. Atenolol was used as
Chapter 2 Review of Literature
Osmotic Drug Delivery System Page 31
the model drug, sodium chloride as osmotic agent and polyethylene oxide as suspending agent.
Ethyl cellulose was employed as semipermeable membrane containing polyethylene glycol 400
as plasticizer for controlling membrane permeability. It was observed that indentation size of
core tablet hardly affected drug release in the range of (1.00–1.14) mm. The optimal osmotic
tablet was found to be able to deliver atenolol at an approximately constant rate up to 24 h,
independent of both release media and agitation rate. The method that is simplified by coating
the indented core tablet with the elimination of laser drilling may be promising in the field of the
preparation of osmotic pump tablet.
M. W. E. Teunissen (1985) 112
investigated the utility of an osmotic rectal drug delivery system
as a tool in steady-state pharmacokinetic interaction studies using the cimetidine-antipyrine
interaction. It is concluded that the osmotic rectal drug delivery system is a useful tool in
pharmacokinetic interaction studies, because it provides very constant steady-state
concentrations, thus permitting investigation of the time course of drug interactions.
G. van den Berg, et al. (1990) 113
studied the influence of food on the bioavailability of
metoprolol from an OROS system; a study in healthy volunteers. The influence of food intake
on the bioavailability of metoprolol from an OROS system was investigated. No significant
difference was found between OROS administration to fasting subjects or after breakfast in any
of the kinetic parameters (AUC, Cmax, tmax, C24 and lag time). Therefore, metoprolol OROS
can be administered with breakfast.
Sapna N. Makhija, studied,114
a controlled porosity osmotic pump-based drug delivery system.
Pseudoephedrine was chosen as a model drug with an aim to develop a controlled release system
for a period of 12 h. Sodium bicarbonate was used as the osmogent. The effect of different ratios
of drug:osmogent on the in-vitro release was studied. Cellulose acetate (CA) was used as the
semipermeable membrane. Different channeling agents tried were diethylphthalate (DEP),
dibutylphthalate (DBP), dibutylsebacate (DBS) and polyethyleneglycol 400 (PEG 400). The
effect of polymer loading on in-vitro drug release was studied. It was found that drug release rate

Chapter 2 Review of Literature
Osmotic Drug Delivery System Page 32
increased with the amount of osmogent due to the increased water uptake, and hence increased
driving force for drug release. This could be retarded by the proper choice of channeling agent in
order to achieve the desired zero order release profile. Also the lag time seen with tablets coated
using diethylphthalate as channeling agent was reduced by using a hydrophilic plasticizer like
polyethyleneglycol 400 in combination with diethylphthalate. This system was found to deliver
pseudoephedrine at a zero order rate for 12 h. The effect of pH on drug release was also studied.
The optimized formulations were subjected to stability studies as per ICH guidelines at different
temperature and humidity conditions.
Xing Liu et al,115
evaluated the monolithic osmotic tablet system (MOTS) containing a solid
dispersion with the practically water-insoluble drug nifedipine in vitro and in vivo. In the drug
release study in vitro, the release profiles of this system had almost zero-order kinetics. The
influences of tablet formulation variables, sizes of the delivery orifice, membrane variables, and
values of pH in the dissolution medium on nifedipine release from MOTS have been
investigated. The results provided evidence that the tablet core played an important role in
MOTS. While orifice sizes and membrane variables affected the nifedipine release rate, MOTS
was independent of the dissolution medium. The appropriate orifice size was found to be in the
range of 0.5–1.0 mm. The coating membrane incorporating hydrophilic polyethylene glycol
(PEG) formed a porous structure. The human pharmacokinetics and relative bioavailability of
MOTS containing nifedipine were compared with a commercial Adalat_ osmotic tablet system
containing an equivalent dose of nifedipine following an oral single dose of 30 mg given to each
of 11 healthy volunteers in an open, randomized crossover study in vivo. The relative
bioavailability for MOTS was 112%. There was no statistically significant difference in the
pharmacokinetic parameters between two dosage forms. It is concluded that the monolithic
osmotic tablet controlled release system is feasible for a long-acting preparation as a once-daily
treatment.
Nurten Ozdemir et al 116
studied the effect of the delivery orifices and the concentration of
osmotic agents on the rate of release of the active material was investigated. For this purpose,
ibuprofen tablets were prepared and sodium chloride and polyethylene glycol 6000 were used as

Chapter 2 Review of Literature
Osmotic Drug Delivery System Page 33
osmotic agents. The tablets were coated with a mixture of cellulose acetate and polyethylene
glycol 400 by the use of a modified fluidized bed apparatus. Delivery orifices on the coated
tablets are produced using a microdrill. The tablets were tested for dissolution rate using the USP
paddle method. Finally, it was observed that the release rate of ibuprofen was influenced by the
concentration of osmotic agents sodium chloride and polyethylene glycol 6000.
N. Ramakrishna et al. 117
compared the performance of cellulose acetate (CA) and
ethylcellulose (EC)–HPMC combination coatings as semipermeable membranes (SPMs) for
osmotic pump tablets(OPTs) of naproxen sodium (NPS) so as to deliver a constant,
predetermined amount of drugin solution form over a fixed span of time, independent of external
environmental conditions. Osmotic pump tablets were designed with different coating variables
and optimized in terms of nature of plasticizer, membrane thickness, and orifice diameter. The
effect of insertion of an inner microporous film around the NPS core to minimize deformation of
the SPM due to peristaltic movement of the gut was also studied. Osmotic pump tablets
composed of membranes with water-soluble plasticizer, propyleneglycol (PG), released drug
mainly through diffusion, whereas those designed with CA and EC–HPMC (4:1) coats
containing water-insoluble plasticizer, castor oil, released their contents by perfect zero-order
kinetics over a prolonged period of time, though the average release rate that could be achieved
with the EC–HPMC (4:1) membrane was only about half the rate achieved with the CA
membrane for the same membrane thickness. Release rates for both the membranes decreased
with increasingmem brane thickness and were found to be independent of orifice diameter,
agitation intensity, and pH of the dissolution medium.
S. Mohammadi-Samani et al 118
produced a propranolol osmotic pump by coating the core
tablets with cellulose acetate. The effects of membrane thickness, pore size, and stirring rate on
the release rate of propranolol hydrochloride were studied. It was found that the thickness of
cellulose acetate membrane had a profound effect on the release rate of propranolol
hydrochloride from the membrane-coated tablets. The results showed that, when the membrane
thickness increased, the release rate of propranolol decreased. The drug release follows a zero-
order release when the delivery orifice is between 200 and 800 mm, but when the delivery orifice

Chapter 2 Review of Literature
Osmotic Drug Delivery System Page 34
size is increased to 1000 mm, the release kinetic is abnormal. Fluid dynamics have an important
effect on the delivery rate of propranolol from this device; the delivery rate increases as a
function of the fluid flow. The drug release is higher under a turbulent condition
Yong Gan et al. 119
prepared a Cyclodextrin Complex Osmotic Tablet for Glipizide Delivery.
Poorly soluble glipizide was selected as the model drug to prepare osmotic pump tablets (OPT)
with proper accessorial material after it was made an inclusion complex by kneading method in
order to increase solubility. Polyethylene glycol 4000 (PEG4000) and cellulose acetate (CA)
were selected as the coating materials, and acetone–water (95:5) co-solvent was employed as the
coating medium. The effects of the osmotic promoting agent, diameter of the drug-releasing
orifice, coating composition, and coat weight on the drug release profile were investigated. The
drug release profile of the optimal formulation was compared with a commercialized push–pull
osmotic tablet. The results indicated that glipizide–cyclodextrin inclusion complex OPT had
excellent zero-order release characteristics in vitro.
Amir M. Razaghi et al. 120
studied Release of Cyclobenzaprine Hydrochloride from
Osmotically Rupturable Tablets. Osmotically rupturable systems were developed and the release
of cyclobenzaprine hydrochloride (model drug) from the systems was investigated. Systems were
designed using mannitol (osmotic agent) and increasing amounts of polyethylene oxide (PEO,a
water-swellable polymer) surrounded by a semipermeable membrane. When placed in an
aqueous environment,osmo tic water imbibition into the systems distended and swelled the
systems until the membrane ruptured and released the active compound to the outside
environment. Tablets with increasing amount of PEO exhibited longer rupture times. This may
be due to osmotic pressure-modulating properties of the polymer,changi ng the rate of water
imbibition into the systems. The integrity of the membranes was investigated using high-pressure
mercury intrusion porosimetry. Minimal mercury intrusion into the membrane structure and core
tablet indicated membrane integrity and lack of defective areas or pinholes. The results were in
agreement with the release profiles where no drug release was detected prior to membrane
rupture. Mercury intrusion porosimetry appears to be a promising technique for evaluation of
membrane integrity. Once the systems ruptured,drug was released by osmotic pumping and

Chapter 2 Review of Literature
Osmotic Drug Delivery System Page 35
diffusion mechanisms through the ruptured area. There was a decrease in drug release rate with
inclusion of PEO in the core. The effects of film thickness on rupture and release times were
also investigated. Devices with thicker films produced longer rupture times. This is in agreement
with the theoretical prediction.
Amir M. Razaghi 121
carried out an Investigation of Cyclobenzaprine Hydrochloride Release
from Oral Osmotic Delivery Systems Containing a Water-Swellable Polymer. Oral osmotic
delivery systems containing polyethylene oxide (PEO, a waterswellable polymer) were designed
and the release of cyclobenzaprine hydrochloride (model drug) from the devices was
investigated. The systems consisted of model drug, mannitol (osmotic agent), and increasing
amounts of PEO surrounded by a semipermeable membrane drilled with a delivery orifice. There
was a decrease in drug release rate with PEO in the core. This may be due to solubility-
modulating properties of the polymer. Visual inspection of the devices with PEO showed
significant swelling during dissolution testing. Swelling (internal pressure) may influence water
imbibition rate into the core and subsequently drug release rate. The release rates were a function
of membrane thickness. The release rates were independent of orifice size (range of 150–510 m
diameter) and hydrodynamic conditions for the devices. This would be advantageous in the
delivery of drugs in man.

CHAPTER 3
AIM OF present WORK

Chapter 3 Aim of the present work
Osmotic Drug Delivery system Page 36
3.0 Aim of the present work:
Various physical and chemical approaches have been applied to produce a well-
characterized dosage form that controls drug input into the body within the specifications of the
desired release profile. This is generally accomplished by attempting to obtain “zero-order”
release from the dosage form, i.e., the rate of drug release is independent of the drug
concentration. Extended-release systems generally do not attain this type of release and usually
try to mimic zero-order release. Also factors like pH, presence of food, and other physiological
factors may affect drug release from conventional CR systems (matrix and reservoir). Osmotic
systems utilize the principles of osmotic pressure for the delivery of drugs. Drug release from
these systems is independent of pH and other physiological parameters to a large extent and it is
possible to modulate the release characteristics by optimizing the properties of drug and system.
At the same time, they can also be utilized to deliver drugs at a controlled and predetermined
rate.
Trimetazidine dihydrochloride is a clinically effective antianginal agent that has been
used in the prophylaxis and management of angina pectoris and in ischemia of neurosensorial
tissues also in Meniere’s disease 126
. It is freely soluble in water, is rapidly absorbed, and its half-
life is relatively short (t1/2 = 6.0 ± 1.4 h). Therefore, it is a potential candidate for extended-
release formulations; however, controlling its release is a challenging task due to its high water
solubility.
Most cardiovascular events are prone to occur in the early mornings hours with the
renewal of daily activities, and this is accompanied by various neurohumoral stimuli Precise
knowledge of the circadian variations paves the way to designing antianginal agents with an

Chapter 3 Aim of the present work
Osmotic Drug Delivery system Page 37
appropriate pharmacokinetic profile that ensures effective plasma concentration on trough and
continuous anti-ischemic and cardio protective effect.
Treatment of angina pectoris involves long term therapy. Conventional dosage regimen is
20 mg thrice daily. Hence the objective of our work was to formulate once daily tablets
containing 60 mg of drug to maintain steady drug blood levels, prolong therapeutic action and
improved patient compliance.
The purpose of this work was to formulate a solid dosage form system (tablets) for
Trimetazidine dihydrochloride using the principles of osmosis which will bring down its dosing
frequency to once a day and at the same time produce a zero-order release system. It was planned
to formulate the 3 types of osmotic drug delivery system viz. Monolayer osmotic Tablets
(Elementary osmotic pump), Bilayer osmotic tablets (Push-pull osmotic pump) and trilayer
osmotic tablets (Sandwitched osmotic tablet system). The amount of polymers and osmogens to
be incorporated in each formulation were decided by optimization technique. Evaluation of the
prepared tablets was performed by determination of the hardness, friability, content uniformity,
weight variation. The in vitro release studies for the determination of trimetazidine released from
the tablet formulations were performed and analyzed. The optimized formulations were then
compared with the theoretically calculated target release profile to select the best formulation.
The optimized formulations were subjected to various comparative tests to study the
effect of variables on release profiles of the optimized formulations. The effect of osmotically
active dissolution medium, effect of agitation rate and the effect of orifice diameter were studied.
The effect of the storage at high temperatures, namely, 40°C, 50°C, and 60°C for a period of 3
months on the chemical stability of the selected tablets and prediction of the shelf life was also
assessed.
CHAPTER 4
CALCULATION OF THEORETICAL
DISSOLUTION PROFILE

Chapter 4 Calculation of theoretical dissolution profile
Osmotic Drug Delivery System Page 38
4.0 Calculation of total dose and theoretical dissolution profile (target profile):
The pharmacokinetic parameters of Trimetazidine dihydrochloride were utilized for the
calculation total dose and the theoretical drug release profile for 24 h, once a day, osmotic drug
delivery of Trimetazidine dihydrochloride. .
4.1 Calculation of the amount of trimetazidine dihydrochloride to be incorporated in a
single tablet: 131
The amount of trimetazidine dihydrchloride to be incorporated in a single tablet was
determined using the following formula:
Dt = Di (1 + 0.693 x t/t1/2)
Where, Dt is the total dose to be incorporated,
Di is the dose of the immediate-release formulation (20mg)
t is the dosing interval (24hr)
t1/2 is the biological half life of the drug (7 hours)
Putting the values in the above equation, the amount of trimetazidine dihydrochloride needed to
be incorporated into a unit dosage form in order to achieve a 24-hour sustained release was found
out to be 62.268 mg. Hence it was decided to formulate a tablet having 60 mg of trimetazidine
dihydrochloride.
4.2 Calculation of theoretical dissolution profile (target profile) with zero order release
kinetics:
The pharmacokinetics parameters of Trimetazidine dihydrochloride which were utilized
for the calculation of theoretical dissolution profile (target profile) are as below:
Table 3: Pharmacokinetic parameters of Trimetazidine dihydrochloride Bioavailability
(F)
Therapeutic
Concentration
mg/1itre
Volume of
Distribution
(Vd)
1itre/kg
Half life
(h)
Steady state
plasma
concentration
(Css)
µg/ml
82% 0.59 – 1.30 5.1 7 96

Chapter 4 Calculation of theoretical dissolution profile
Osmotic Drug Delivery System Page 39
The immediate release part of sustained release tablet of Trimetazidine dihydrochloride tablet
can be calculated using the following formula:
Immediate release part = (Css x Vd) / F
Where, Css is Steady state plasma concentration,
Vd is volume of distribution and
F is Fraction bioavailable.
Putting the values for the parameters in the above equation, the immediate release part in
a 60 mg sustained release tablet of Trimetazidine dihydrochloride came out to be 5.97 mg
(≈ 6mg).
As we intended to formulate an osmotic drug delivery system, it was decided to have a
lag phase of 2 hrs, which would permit the flow of fluids through the semipermeable membrane,
in order to develop a suitable osmotic pressure to release the drug from the tablet. This meant
that there should be almost no drug release in the initial two hours. For calculating the drug
release from 3rd
hour onwards, the portion of immediate release (6mg) and the maintenance dose
(remaining 54 mg) were each divided by the remaining 22 hours and the fractions were added to
give the drug release per hour. The theoretical release profile (target profile) calculated is as
shown below in Table 4:
Table 4: Theoretically calculated % cumulative drug release of trimetazidine dihydrochloride:
Time
(hr)
Total Amt of Drug
release (mg)
% cumulative
drug release
1 0 0 2 0 0 3 2.73 4.5 4 5.45 9.1 5 8.18 13.6 6 10.91 18.2 7 13.64 22.7 8 16.36 27.3 9 19.09 31.8
10 21.82 36.4 11 24.55 40.9 12 27.27 45.5 13 30.00 50.0 14 32.73 54.5 15 35.45 59.1 16 38.18 63.6 17 40.91 68.2

Chapter 4 Calculation of theoretical dissolution profile
Osmotic Drug Delivery System Page 40
18 43.64 72.7 19 46.36 77.3 20 49.09 81.8 21 51.82 86.4 22 54.55 90.9 23 57.27 95.5 24 60.00 100.0
The graph of Time (hr) v/s % cumulative drug release was plotted to get the r2 value for the
target profile as shown in Figure 7.
Figure 7: Time (hr) v/s % cumulative drug release of the theoretical target release profile
All the trial batches were compared with the target release profile using similarity factor (F2) and
difference factor (F1) to select the best trial formulation.
R² = 0.9992
0
10
20
30
40
50
60
70
80
90
100
110
0 2 4 6 8 10 12 14 16 18 20 22 24
cum
ula
tive
% r
ele
ase
Time (hr)

CHAPTER 5
PROFILE OF DRUG AND
EXCIPIENTS

Chapter 5 Profile of Drug and excipients
Osmotic Drug Delivery System Page 41
5.0 Profile of Drug and excipients:
5.1 List of Drug and excipients used:
Sr. no. Material Manufacturer/Supplier
1 Trimetazidine
dihydrchloride USV Limited, Mumbai.
2 HPMC K4M Dow Chemicals Ltd.
3 Carbopol 71G Noveon
4 Lactose monohydrate DMV Fontera
5 Isopropyl alccohol Samir tech. chem. Pvt.
Ltd. 6 Povidone K/30 ISP Technologies
7 Sodium chloride Merck Limited
8 Talc Lar Chem Industries
9 Magnesium stearate Vasundhara Rasayans Ltd
10 Cellulose acetate Qualigens Fine Chemicals
11 Dibutyl cebecate Qualigens Fine Chemicals
12 Ethanol Qualigens Fine Chemicals
13 Acetone Qualigens Fine Chemicals
14 Ferric Oxide Red Dow Chemicals Ltd.
15 Ferric Oxide Yellow Dow Chemicals Ltd.
16 Magnesium sulphate Merck Limited
17 Mannitol DMV Fontera

Chapter 5 Profile of Drug and excipients
Osmotic Drug Delivery System Page 42
5.2 Drug and excipients profile 127
:
5.2.1 Profile of Trimetazidine dihydrochloride:
Trimetazidine dihydrochloride:
It protects the ischaemic cell from the metabolic consequences of ischaemia. It
specifically opposes intracellular acidification, reduction in energy production and free
radical over production. Trimetazidine prevents the electro physiological manifestations of
ischaemia.
5.2.1.1 Chemistry:
Trimetazidine dihydrochloride
IUPAC name: 1-[(2,3,4-trimethoxyphenyl)methyl] piperazine
Molecular formula: Cl4H22N203.2HCI
5.2.1.2 Structural formula:
OMe
5.2.1.3 Molecular weight: 339.3
5.2.1.4 Action and use: Vasodilator
5.2.1.5 Definition:
1-[(2,3,4-trimethoxyphenyl)methyl] piperazine having a percentage content of 98.5 °A to
101.5% (dried substance).
.2HCI

Chapter 5 Profile of Drug and excipients
Osmotic Drug Delivery System Page 43
5.2.1.6 Characters:
Appearance
White or almost white, crystalline powder, slightly hygroscopic.
Solubility
Freely soluble in water, sparingly soluble in alcohol
5.2.1.7 Identification:
A. Infrared absorption spectrophotometry
The spectrum obtained is compared with the Reference spectrum of Trimetazidine
dihydrochloride in Pharmacopoeia of Europe.
B. Dissolve 25 mg in 5 ml of water R. 2 ml of the solu tion gives reaction of
chlorides.
5.2.1.8 Melting point: 220-225°C
5.2.1.9 Mechanism of Action:
Trimetazidine dihydrochloride (TMZ) is an anti-ischemic compound whose
precise mode of action is unknown, although several studies have suggested a metabolic
effect, and there have been reports of protection of mitochondria against oxidative stress
damage. Using a Langendorff rat heart model, scientists examined the effects of
TMZ on the mitochondrial damage following 30 minutes of ischemia and 5 minutes of
reperfusion. Mitochondrial respiration with succinate, glutamate-malate and ascorbate-
N,N,N',N'- tetramethylphenylenediamine (TMPD) as substrates was significantly
decreased following ischemia-reperfusion. Preperfusion with 10(-5)
M TMZ had no effect
on these rates in normoxic or ischemic hearts. However, 103)
M TMZ significantly decreased the
glutamate-malate rate in mitochondria from normoxic hearts, and this rate was not

Chapter 5 Profile of Drug and excipients
Osmotic Drug Delivery System Page 44
further decreased following ischemia-reperfusion, and 10°) M TMZ also partially
protected ascorbate-TMPD activity. The effect on glutamate-malate was probably due to an
inhibition of complex I by TMZ, which specifically inhibited reduced nicotinamideadenine-
dinucleotide-cytochrome c reductase and complex I in lysed mitochondria They also
studied the effects of TMZ on the activity of pyruvate dehydrogenase (PDH) in
normoxic and ischemic hearts perfused with 0.5 mM palmitate, which caused the enzyme to
be almost completely inactivated. After short periods of ischemia (10-20 minutes) the PDH
inactivation by palm itate was progressively lost. Preperfusion with 10°) M TMZ had a
tendency to decrease lactate dehydrogenase release, accompanied by maintenance of the
inhibition of PDH by palmitate. This may allow the heart to oxidize fatty acids
preferentially during reperfusion, hence removing possible toxic acyl esters.
5.2.1.10 Pharmacokinetics:
Trimetazidine is absorbed through the intestinal mucosa with a Tmax (time to reach maximum
concentration) of 5.4 hours. The Cmax is 89 microg/L. the t75 (time during which the plasma
concentration remains above 75% of Cmax) is 11 hours. The bioavailability is 87%, slightly
inferior with trimetazidine modified release than with the immediate-release formulation,
explaining the increase in the dose of trimetazidine (35 mg compared with 20 mg for the
immediate-release tablet). The bioavailability is not influenced by food. The steady state is
reached 2 to 3 days after starting the treatment. The volume of distribution, unaffected by the
modified-release formulation, is 4.8 L/kg which means good tissue diffusion. Protein binding
affinity is low (16%), with equal binding to albumin and alpha-glycoprotein. No uptake of
trimetazidine in red blood cells was observed. The major drug related component observed in
plasma and urine was unchanged trimetazidine. In addition to the parent drug, 10 metabolites
were detected in urine. Seven routes of metabolism have been identified in man: 2 phase I
oxidation and 5 phase II conjugation routes. Trimetazidine and its metabolites are predominantly
eliminated in urine. A small proportion of trimetazidine is excreted in the faeces (about 6% of
the administered dose). The renal trimetazidine clearance is 350 ml/min and is independent of
the urine and plasma concentration of the drug, whereas it is correlated with renal creatinine
clearance. That is why the elimination half-life is shorter in the healthy patient compared with

Chapter 5 Profile of Drug and excipients
Osmotic Drug Delivery System Page 45
the elderly patient (7 and 12 hours, respectively). Trimetazidine can be safely prescribed without
adapting the dose in elderly patients and in case of renal insufficiency (if creatinine clearance
remains above 15 ml/min).
5.2.1.11 Pharmacokinetic features of the immediate release formulation (20 mg) :
Cmin = 28.4 µg/L
Cmax= 94.7 µg/L
Elimination half life = 7 hrs
5.2.1.12 Indications
Ischaemic heart disease (angina pectoris, sequelae of infarction)
5.2.1.13 Dosage:
Adults: 20 mg thrice daily after meals.
Children: Not recommended.
5.2.1.14 Contraindications: Hypersensitivity
5.2.1.15 Special Precautions:
Paediatric: Not recommended
Pregnancy: Should not be used
Lactation: Should not be used
Elderly: Caution should be taken
5.2.1.16 Side effects: G.I.disturbances, nausea, vomiting.
5.2.1.17 Drug interactions: None reported

Chapter 5 Profile of Drug and excipients
Osmotic Drug Delivery System Page 46
5.2.2 HYDROXYPROPYL METHYLCELLULOSE (HPMC)
5.2.2.1 Synonyms
HPMC, Hydroxypropyl methyl cellulose, Benecel MHPC,Methocel, Methyl cellulose propylene
glycol ether, Methyl hydroxylpropyl cellulose, Metolose
5.2.2.2 Chemical name
Cellulose hydroxylpropyl methyl ether
5.2.2.3 Functional category
Coating agent, film former, rate controlling polymer for sustained release, suspending agent,
tablet binder, Viscosity increasing agent.
5.2.2.4 Application in Pharmaceutical Formulation:
Hypromellose is widely used in oral, ophthalmic and topical pharmaceutical formulationIn oral
products, hypromellose is primarily used as a tablet binder, in film coating and as a matrix for
used in extended release tablet formulation. Depending upon the viscosity grad, concentration of
2 – 20% w/w is used for film coating solutions to film coat tablets.
Hypromellose is also used as a suspending agents and thickening agent in topical
formulation. Hypromellose is also used as an emulsifier, and stabilizers in gels and ointment.
In addition hypromellose is also used in the manufacturing off capsule, as adhesive
inplastic bandages and as a wetting agent for hard contact lenses.
5.2.2.5 Description:
Hypromellose is an odor less and tasteless, White to creamy white powder.
5.2.2.6 Typical properties:
pH : 5.5 -8.0 for 1 % w/w aqueous solution
Density (Bulk) : 0.341 gm/cm3
Density (Tapped) : 0.557 gm/cm3

Chapter 5 Profile of Drug and excipients
Osmotic Drug Delivery System Page 47
Density (True) : 1.326 gm/cm3
Glass transition temperature : 170 – 180
Moisture content : Hypromellose absorb moisture from the atmosphere
Solubility : Practically insoluble in hot water, in acetone, in ethanol,
in ether and in toluene. It swells in water forming an
opalescent, viscous colloidal solution
Specific gravity : 1.26
5.2.2.7 Stability and Storage Conditions:
HPMC is stable and should be stored in air tight container.
5.2.2.8 Incompatibility:
Hypromellose is incompatible with some oxidizing agents
5.2.2.9 Safety:
HPMC is generally regarded as nontoxic and nonirritant material however excessive oral
consumption may have laxative effect.
5.2.3 CARBOPOL 71 G(CP 974 P NF)
Carbomer are synthetic high molecular weight polymer of acrylic acid, that croslinked with
eitherallyl sucrose or allyl ethers of pentaery thritol.
5.2.3.1 Synonyms
Acritamer, Acrilic acid polymer, Carbomer, Carboxyvinyl polymer, Poly acrylic acid.
5.2.3.2 Chemical Name
Carbomer

Chapter 5 Profile of Drug and excipients
Osmotic Drug Delivery System Page 48
5.2.3.3 Molecular Weight
3x10⁶
D
5.2.3.4 Functional Category
Bioadhesive, Emulsifying agent, suspending agent, tablet binder, viscosity increasing agent,
Release modifying agent.
5.2.3.6 Application in Pharmaceutical Formulation or Technology:
Carbopol 934 is used mainly in liquid or semisolid pharmaceutical formulations as
suspending or viscosity increasing agent and in formulation including Creams, gels and
ointments for ophthalmic, rectal and topical preparations.
In the tablet formulations carbomers are used as dry or wet binder and as a rate
controlling excipients.
Carbomer rasines have also been investigated in the preparation of sustained release
matrix beads, as enzyme inhibitors of intestinal proteases in peptide containing dosage forms, as
a bioadhesive patch for cervical patch and for intranasally administered microspears, in magnetic
granules for site specific drug delivery to the esophagus and in oral mucoadhesive controlled
drug delivery system
Table 5 : Use of carbopol
Use Concentration
Emulsifying agent 0.1 - 0.5%
Gelling agent 0.5 – 2.0 %
Suspending agent 0.5 – 1 %
Tablet binder 5.0 – 10 %
5.2.3.7 Description:
Carbopol is white, fluffy powder, having slight characteristic odour. It is hygroscopic.
Chapter 5 Profile of Drug and excipients
Osmotic Drug Delivery System Page 49
5.2.3.8 Typical properties
pH : 2.7 – 3.5 for a 0.5 %w/v aqueous dispersion
2.5 – 3.0 for 1 % w/v aqueous dispersion
Density (Bulk) :1.76 – 2.08 gm/cm3
Density (Tapped) :1.4 gm/cm3
Glass transition temperature : 100 – 105 c
Particle size distribution : primary particle average about 0.2 um in diameter
Solubility : Soluble in water and after neutralization in ethanol (95%)
and glycerin.
Specific gravity : 1.41
Viscosity : 0.5% w/v 30500 – 39400 mpa
5.2.3.9 Stability and Storage Conditions:
Carbopol is stable and should be stored in tight containers.
5.2.3.10 Incompatibilities:
Carbomer are discoloured by resorsinol and are incompatible with phenol,cationic
polymers strong acids and high level of electrolite
5.2.3.11 Safety:
It is regarded as essentially nontoxic and nonirritant materials.

Chapter 5 Profile of Drug and excipients
Osmotic Drug Delivery System Page 50
5.2.4 Povidone
5.2.4.1 Nonproprietary Names
BP: Povidone
JP: Povidone
PhEur: Povidonum
USP: Povidone
5.2.4.2 Synonyms
E1201; Kollidon; Plasdone; poly[1-(2-oxo-1-pyrrolidinyl)ethylene]; polyvidone;
polyvinylpyrrolidone; PVP; 1-vinyl-2-pyrrolidinone polymer
5.2.4.3 Chemical Name and CAS Registry Number
1-Ethenyl-2-pyrrolidinone homopolymer [9003-39-8]
5.2.4.4 Structural Formula
5.2.4.5 Functional Category
Disintegrant; dissolution aid; suspending agent; tablet binder.
5.2.4.6 Applications in Pharmaceutical Formulation or Technology
Although povidone is used in a variety of pharmaceutical formulations, it is primarily used in
solid-dosage forms. In tableting, povidone solutions are used as binders in wet-granulation

Chapter 5 Profile of Drug and excipients
Osmotic Drug Delivery System Page 51
processes. Povidone is also added to powder blends in the dry form and granulated in situ by the
addition of water, alcohol, or hydroalcoholic solutions. Povidone is used as a solubilizer in oral
and parenteral formulations and has been shown to enhance dissolution of poorly soluble drugs
from solid-dosage forms. Povidone solutions may also be used as coating agents. Povidone is
additionally used as a suspending, stabilizing, or viscosity-increasing agent in a number of
topical and oral suspensions and solutions. The solubility of a number of poorly soluble active
drugs may be increased by mixing with povidone. Special grades of pyrogen-free povidone are
available and have been used in parenteral formulations.
Table 6: Uses of povidone.
Use Concentration
(%)
Carrier for drugs 10–25
Dispersing agent Up to 5
Eye drops 2–10
Suspending agent Up to 5
Tablet binder, tablet diluent, or coating
agent 0.5–5
5.2.4.7 Description
Povidone occurs as a fine, white to creamy-white colored, odorless or almost odorless,
hygroscopic powder. Povidones with K-values equal to or lower than 30 are manufactured by
spray-drying and occur as spheres. Povidone K-90 and higher K-value povidones are
manufactured by drum drying and occur as plates.
5.2.4.8 Typical Properties
Acidity/alkalinity: pH = 3.0–7.0 (5% w/v aqueous solution).
Density (bulk): 0.29–0.39 g/cm3

Chapter 5 Profile of Drug and excipients
Osmotic Drug Delivery System Page 52
Density (tapped): 0.39–0.54 g/cm3
Density (true): 1.180 g/cm
Melting point: softens at 1508C
5.2.4.9 Solubility:
freely soluble in acids, chloroform, ethanol (95%), ketones, methanol, and water; practically
insoluble in ether, hydrocarbons, and mineral oil. In water, the concentration of a solution is
limited only by the viscosity of the resulting solution, which is a function of the K-value.
5.2.4.10 Stability and Storage Conditions
Povidone darkens to some extent on heating at 150 C, with a reduction in aqueous solubility. It is
stable to a short cycle of heat exposure around 110–130 C; steam sterilization of an aqueous
solution does not alter its properties. Aqueous solutions are susceptible to mold growth and
consequently require the addition of suitable preservatives. Povidone may be stored under
ordinary conditions without undergoing decomposition or degradation. However, since the
powder is hygroscopic, it should be stored in an airtight container in a cool, dry place
5.2.4.11 Incompatibilities
Povidone is compatible in solution with a wide range of inorganic salts, natural and synthetic
resins, and other chemicals. It forms molecular adducts in solution with sulfathiazole, sodium
salicylate, salicylic acid, phenobarbital, tannin, and other compounds. The efficacy of some
preservatives, e.g. thimerosal, may be adversely affected by the formation of complexes with
povidone.

Chapter 5 Profile of Drug and excipients
Osmotic Drug Delivery System Page 53
5.2.5 Lactose, Monohydrate
5.2.5.1 Nonproprietary Names
BP: Lactose monohydrate
PhEur: Lactosum monohydricum
JP: Lactose
USPNF: Lactose monohydrate
5.2.5.2 Chemical Name and CAS Registry Number
O-b-D-Galactopyranosyl-(1!4)-a-D-glucopyranose monohydrate [64044-51-5]
5.2.5.3 Empirical Formula and Molecular Weight
C12H22O11.H2O 360.31
5.2.5.4 Structural Formula
5.2.5.5 Functional Category
Binding agent; diluent for dry-powder inhalers; tablet binder; tablet and capsule diluent.
5.2.5.6 Applications in Pharmaceutical Formulation or Technology
Lactose is widely used as a filler or diluent in tablets and capsules, and to a more limited
extent in lyophilized products and infant formulas. Lactose is also used as a diluent in dry-
Chapter 5 Profile of Drug and excipients
Osmotic Drug Delivery System Page 54
powder inhalation. Various lactose grades are commercially available that have different
physical properties such as particle size distribution and flow characteristics. This permits the
selection of the most suitable material for a particular application; for example, the particle size
range selected for capsules is often dependent on the type of encapsulating machine used.
Usually, fine grades of lactose are used in the preparation of tablets by the wet-granulation
method or when milling during processing is carried out, since the fine size permits better mixing
with other formulation ingredients and utilizes the binder more efficiently. Other applications of
lactose include use in lyophilized products, where lactose is added to freeze-dried solutions to
increase plug size and aid cohesion. Lactose is also used in combination with sucrose
(approximately 1:3) to prepare sugar-coating solutions. Direct-compression grades of lactose
monohydrate are available as granulated/agglomerated a-lactose monohydrate, containing small
amounts of anhydrous lactose. Direct-compression grades are often used to carry lower
quantities of drug and this permits tablets to be made without granulation. Other directly
compressible lactoses are spray-dried lactose and anhydrous lactose.
5.2.5.7 Description
In the solid state, lactose appears as various isomeric forms,depending on the crystallization and
drying conditions, i.e. α -lactose monohydrate, β -lactose anhydrous, and α -lactose anhydrous.
The stable crystalline forms of lactose are α -lactose monohydrate, β -lactose anhydrous, and
stable α -lactose anhydrous. Lactose occurs as white to off-white crystalline particles or powder.
Lactose is odorless and slightly sweet-tasting; α -lactose is approximately 20% as sweet as
sucrose, while β -lactose is 40% as sweet.
5.2.5.8 Typical Properties
Density (true): 1.545 g/cm3 (a-lactose monohydrate)
Density (bulk): 0.75 g/cm3
Density (tapped): 0.88 g/cm3
Melting point: 201–202 C (for dehydrated α -lactose monohydrate)
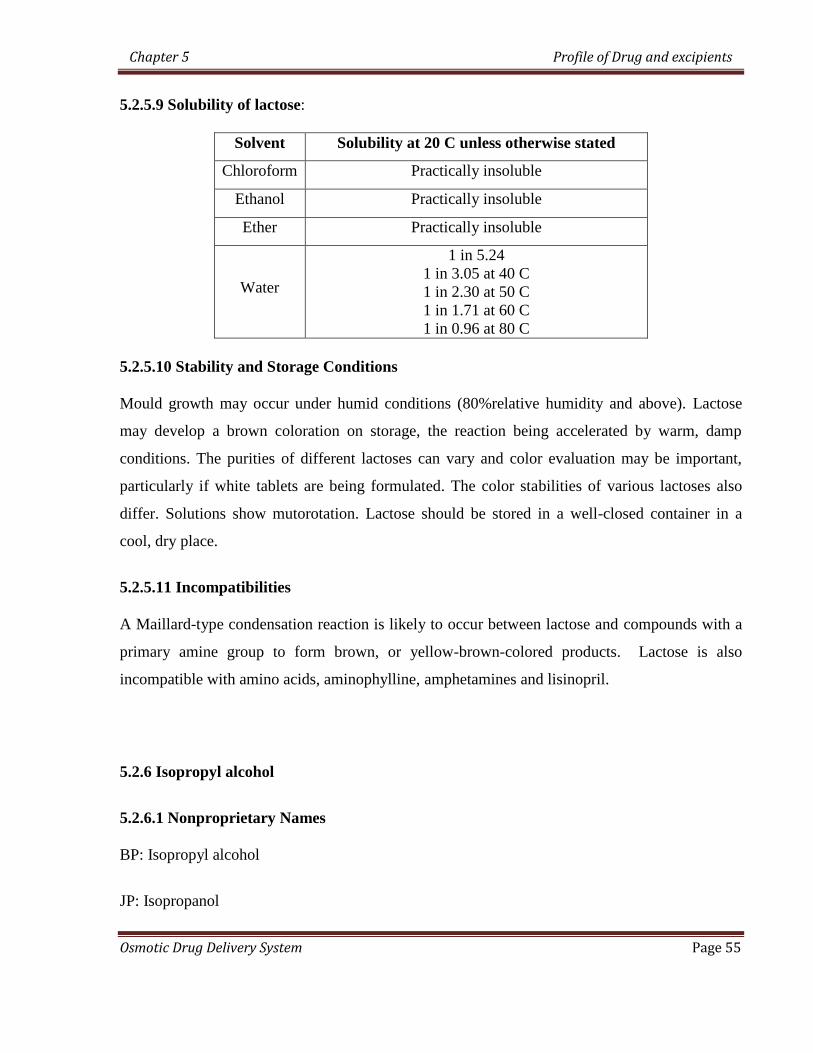
Chapter 5 Profile of Drug and excipients
Osmotic Drug Delivery System Page 55
5.2.5.9 Solubility of lactose:
Solvent Solubility at 20 C unless otherwise stated
Chloroform Practically insoluble
Ethanol Practically insoluble
Ether Practically insoluble
Water
1 in 5.24
1 in 3.05 at 40 C
1 in 2.30 at 50 C
1 in 1.71 at 60 C
1 in 0.96 at 80 C
5.2.5.10 Stability and Storage Conditions
Mould growth may occur under humid conditions (80%relative humidity and above). Lactose
may develop a brown coloration on storage, the reaction being accelerated by warm, damp
conditions. The purities of different lactoses can vary and color evaluation may be important,
particularly if white tablets are being formulated. The color stabilities of various lactoses also
differ. Solutions show mutorotation. Lactose should be stored in a well-closed container in a
cool, dry place.
5.2.5.11 Incompatibilities
A Maillard-type condensation reaction is likely to occur between lactose and compounds with a
primary amine group to form brown, or yellow-brown-colored products. Lactose is also
incompatible with amino acids, aminophylline, amphetamines and lisinopril.
5.2.6 Isopropyl alcohol
5.2.6.1 Nonproprietary Names
BP: Isopropyl alcohol
JP: Isopropanol

Chapter 5 Profile of Drug and excipients
Osmotic Drug Delivery System Page 56
PhEur: Alcohol isopropylicus
USP: Isopropyl alcohol
5.2.6.2 Synonyms
Dimethyl carbinol; IPA; isopropanol; petrohol; 2-propanol; sec-propyl alcohol.
5.2.6.3 Chemical Name and CAS Registry Number
Propan-2-ol [67-63-0]
5.2.6.4 Empirical Formula and Molecular Weight
C3H8O 60.1
5.2.6.5 Structural Formula
5.2.6.6 Functional Category
Disinfectant; solvent
5.2.6.7 Applications in Pharmaceutical Formulation or Technology
Isopropyl alcohol (propan-2-ol) is used in cosmetics and pharmaceutical formulations primarily
as a solvent in topical formulations. It is not recommended for oral use owing to its toxicity.
Although it is used in lotions, the marked degreasing properties of isopropyl alcohol may limit its
usefulness in preparations used repeatedly. Isopropyl alcohol is also used as a solvent both for
tablet film-coating and for tablet granulation, where the isopropyl alcohol is subsequently
removed by evaporation. It has also been shown to significantly increase the skin permeability of
nimesulide from carbomer 934. Isopropyl alcohol has some antimicrobial activity and a 70% v/v

Chapter 5 Profile of Drug and excipients
Osmotic Drug Delivery System Page 57
aqueous solution is used as a topical disinfectant. Therapeutically, isopropyl alcohol has been
investigated for the treatment of postoperative nausea or vomiting.
5.2.6.8 Description
Isopropyl alcohol is a clear, colorless, mobile, volatile, flammable liquid with a characteristic,
spirituous odor resembling that of a mixture of ethanol and acetone; it has a slightly bitter taste.
5.2.6.9 Typical Properties
Boiling point: 82.4 C
Flammability: flammable.
Freezing point: -89.5 C
Melting point: -88.5 C
5.2.6.10 Solubility:
miscible with benzene, chloroform, ethanol (95%), ether, glycerin, and water. Soluble in acetone;
insoluble in salt solutions. Forms an azeotrope with water, containing 87.4% w/w isopropyl
alcohol (boiling point 80.37 C).
5.2.6.11 Stability and Storage Conditions:
Isopropyl alcohol should be stored in an airtight container in a cool, dry place.
5.2.6.12 Incompatibilities
Incompatible with oxidizing agents such as hydrogen peroxide and nitric acid, which cause
decomposition. Isopropyl alcohol may be salted out from aqueous mixtures by the addition of
sodium chloride, sodium sulfate, and other salts, or by the addition of sodium hydroxide.
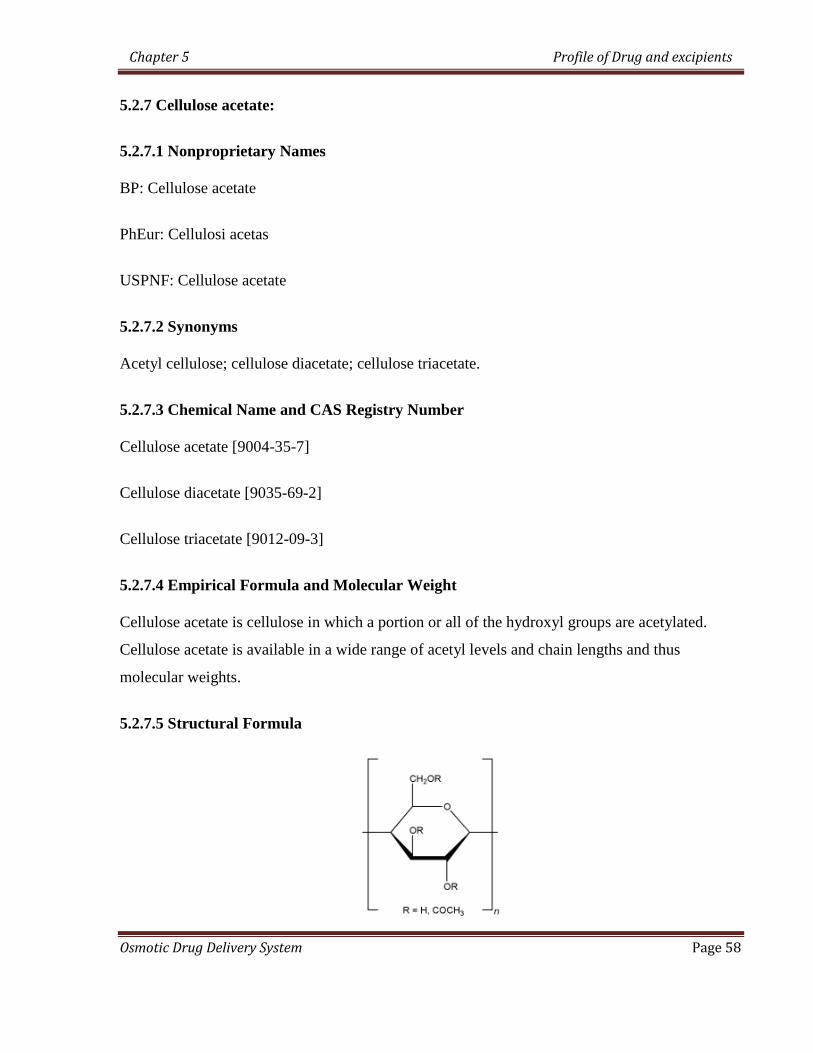
Chapter 5 Profile of Drug and excipients
Osmotic Drug Delivery System Page 58
5.2.7 Cellulose acetate:
5.2.7.1 Nonproprietary Names
BP: Cellulose acetate
PhEur: Cellulosi acetas
USPNF: Cellulose acetate
5.2.7.2 Synonyms
Acetyl cellulose; cellulose diacetate; cellulose triacetate.
5.2.7.3 Chemical Name and CAS Registry Number
Cellulose acetate [9004-35-7]
Cellulose diacetate [9035-69-2]
Cellulose triacetate [9012-09-3]
5.2.7.4 Empirical Formula and Molecular Weight
Cellulose acetate is cellulose in which a portion or all of the hydroxyl groups are acetylated.
Cellulose acetate is available in a wide range of acetyl levels and chain lengths and thus
molecular weights.
5.2.7.5 Structural Formula

Chapter 5 Profile of Drug and excipients
Osmotic Drug Delivery System Page 59
5.2.7.6 Functional Category
Coating agent; extended release agent; tablet and capsule diluents
5.2.7.7 Applications in Pharmaceutical Formulation or Technology
Cellulose acetate is widely used in pharmaceutical formulations both in sustained-release
applications and for taste masking. Cellulose acetate is used as a semipermeable coating on
tablets, especially on osmotic pump-type tablets and implants. This allows for controlled,
extended release of actives. Cellulose acetate films, in conjunction with other materials, also
offer sustained release without the necessity of drilling a hole in the coating as is typical with
osmotic pump systems. Cellulose acetate and other cellulose esters have also been used to form
drug-loaded microparticles with controlled-release characteristics. Cellulose acetate films are
used in transdermal drug delivery systems and also as film coatings on tablets or granules for
taste masking. For example, acetaminophen granules have been coated with a cellulose acetate-
based coating before being processed to provide chewable tablets. Extended-release tablets can
also be formulated with cellulose acetate as a directly compressible matrix former. The release
profile can be modified by changing the ratio of active to cellulose acetate and by incorporation
of plasticizer, but was shown to be insensitive to cellulose acetate molecular weight and particle
size distribution. Therapeutically, cellulose acetate has been used to treat cerebral aneurysms,
and also for spinal perimedullary arterio-venous fistulas.
5.2.7.8 Description
Cellulose acetate occurs as a white to off-white powder, free-flowing pellets, or flakes. It is
tasteless and odorless, or may have a slight odor of acetic acid.
5.2.7.9 Typical Properties
Density (bulk): typically 0.4 g/cm3 for powders
Glass transition temperature: 170–190 C
Melting point: melting range 230–300 C
Chapter 5 Profile of Drug and excipients
Osmotic Drug Delivery System Page 60
5.2.7.10 Solubility:
The solubility of cellulose acetate is greatly influenced by the level of acetyl groups present. In
general, cellulose acetates are soluble in acetone–water blends of varying ratios,
dichloromethane–ethanol blends, dimethyl formamide, and dioxane. The cellulose acetates of
higher acetyl level are generallymore limited in solvent choice than are the lower-acetyl
materials.
5.2.7.11 Stability and Storage Conditions
Cellulose acetate is stable if stored in a well-closed container in a cool, dry place. Cellulose
acetate hydrolyzes slowly under prolonged adverse conditions such as high temperature and
humidity, with a resultant increase in free acid content and odor of acetic acid.
5.2.7.12 Incompatibilities
Cellulose acetate is incompatible with strongly acidic or alkaline substances. Cellulose acetate is
compatible with the following plasticizers: diethyl phthalate, polyethylene glycol, triacetin, and
triethyl citrate
5.2.8 Dibutyl Cebecate
5.2.8.1 Nonproprietary Names
USPNF: Dibutyl sebacate
5.2.8.2 Synonyms
Butyl sebacate; decanedioic acid, dibutyl ester; dibutyl decanedioate; dibutyl 1,8-
octanedicarboxylate; Kodaflex DBS.
5.2.8.3 Chemical Name and CAS Registry Number
Decanedioic acid, di-n-butyl ester [109-43-3]

Chapter 5 Profile of Drug and excipients
Osmotic Drug Delivery System Page 61
5.2.8.4 Empirical Formula and Molecular Weight
C18H34O4 314.47
5.2.8.5 Structural Formula
5.2.8.6 Functional Category
Plasticizer.
5.2.8.7 Applications in Pharmaceutical Formulation or Technology
Dibutyl sebacate is used in oral pharmaceutical formulations as a plasticizer for film coatings on
tablets, beads, and granules, at concentrations of 10–30% by weight of polymer. It is also used as
a plasticizer in controlled-release tablets and microcapsule preparations. Dibutyl sebacate is also
used as a synthetic flavor and flavour adjuvant in food products; for example, up to 5 ppm is
used in ice cream and nonalcoholic beverages.
5.2.8.7 Description
Dibutyl sebacate is a clear, colorless, oily liquid with a bland to slight butyl odor.
5.2.8.8 Typical Properties
Boiling point: 344–349 C
Flash point: 193 C
Melting point: -10 C
5.2.8.9 Stability and Storage Conditions
Dibutyl sebacate is stable. It is not reactive with water and hazardous polymerization does not
occur. Dibutyl sebacate should be stored in a closed container in a cool, dry location.
5.2.8.10 Incompatibilities
Dibutyl sebacate is incompatible with strong oxidizing materials and strong alkalis.

Chapter 5 Profile of Drug and excipients
Osmotic Drug Delivery System Page 62
5.2.9 Sodium chloride:
5.2.9.1 Nonproprietary Names
BP: Sodium chloride
JP: Sodium chloride
PhEur: Natrii chloridum
USP: Sodium chloride
5.2.9.2 Synonyms
Alberger; chlorure de sodium; common salt; hopper salt; natural halite; rock salt; saline; salt; sea
salt; table salt.
5.2.9.3 Chemical Name and CAS Registry Number
Sodium chloride [7647-14-5]
5.2.9.4 Empirical Formula and Molecular Weight
NaCl 58.44
5.2.9.5 Structural Formula
NaCl
5.2.9.6 Functional Category
Tablet and capsule diluent; tonicity agent
5.2.9.7 Applications in Pharmaceutical Formulation or Technology
Sodium chloride is widely used in a variety of parenteral and nonparenteral pharmaceutical
formulations, where the primary use is to produce isotonic solutions. Sodium chloride has been

Chapter 5 Profile of Drug and excipients
Osmotic Drug Delivery System Page 63
used as a lubricant and diluent in capsules and direct-compression tablet formulations in the past,
although this practice is no longer common. Sodium chloride has also been used as a channeling
agent and as an osmotic agent in the cores of controlled-release tablets. It has been used as a
porosity modifier in tablet coatings, and to control drug release from microcapsules.
5.2.9.8 Description
Sodium chloride occurs as a white crystalline powder or colorless crystals; it has a saline taste.
The crystal lattice is a face-centered cubic structure. Solid sodium chloride contains no water of
crystallization although, below 08C, salt may crystallize as a dihydrate.
5.2.9.9 Typical Properties
Boiling point: 141.3 C
Density:
2.17 g/cm3;
1.20 g/cm3 for saturated aqueous solution.
Density (bulk): 0.93 g/cm3
Density (tapped): 1.09 g/cm3
5.2.9.10 Stability and Storage Conditions
Aqueous sodium chloride solutions are stable but may cause the separation of glass particles
from certain types of glass containers. Aqueous solutions may be sterilized by autoclaving or
filtration. The solid material is stable and should be stored in a well-closed container, in a cool,
dry place. It has been shown that the compaction characteristics and the mechanical properties
of tablets are influenced by the relative humidity of the storage conditions under which sodium
chloride was stored
5.2.9.11 Incompatibilities
Aqueous sodium chloride solutions are corrosive to iron. They also react to form precipitates
with silver, lead, and mercury salts. Strong oxidizing agents liberate chlorine from acidified

Chapter 5 Profile of Drug and excipients
Osmotic Drug Delivery System Page 64
solutions of sodium chloride. The solubility of the antimicrobial preservative methylparaben is
decreased in aqueous sodium chloride solutions and the viscosity of carbomer gels and solutions
of hydroxyethyl cellulose or hydroxypropyl cellulose is reduced by the addition of sodium
chloride.
5.2.10 Mannitol
5.2.10.1 Nonproprietary Names
BP: Mannitol
JP: D-Mannitol
PhEur: Mannitolum
USP: Mannito
5.2.10.2 Synonyms
Cordycepic acid; C*PharmMannidex; E421; manna sugar; D-mannite; mannite; Mannogem;
Pearlitol.
5.2.10.3 Chemical Name and CAS Registry Number
D-Mannitol [69-65-8]
5.2.10.4 Empirical Formula and Molecular Weight
C6H14O6 182.17
5.2.10.5 Structural Formula
Chapter 5 Profile of Drug and excipients
Osmotic Drug Delivery System Page 65
5.2.10.6 Functional Category
Diluent; diluent for lyphilized preparations; sweetening agent; tablet and capsule diluent; tonicity
agent.
5.2.10.7 Applications in Pharmaceutical Formulation or Technology
Mannitol is widely used in pharmaceutical formulations and food products. In pharmaceutical
preparations it is primarily used as a diluent (10–90% w/w) in tablet formulations, where it is of
particular value since it is not hygroscopic and may thus be used with moisture-sensitive active
ingredients. Mannitol may be used in direct-compression tablet applications, for which the
granular and spray-dried forms are available, or in wet granulations. Granulations containing
mannitol have the advantage of being dried easily. Specific tablet applications include antacid
preparations, glyceryl trinitrate tablets, and vitamin preparations. Mannitol is commonly used as
an excipient in the manufacture of chewable tablet formulations because of its negative heat of
solution, sweetness, and ‘mouth feel’.Also úsed as an osmotic agent
5.2.10.8 Description
Mannitol is D-mannitol. It is a hexahydric alcohol related to mannose and is isomeric with
sorbitol.
Mannitol occurs as a white, odorless, crystalline powder, or free-flowing granules. It has a sweet
taste, approximately as sweet as glucose and half as sweet as sucrose, and imparts a cooling
sensation in the mouth. Microscopically, it appears as orthorhombic needles when crystallized
from alcohol. Mannitol
shows polymorphism
5.2.10.9 Typical Properties
Flash point: <150 C
Density (bulk):
0.430 g/cm3 for powder;
0.7 g/cm3 for granules.

Chapter 5 Profile of Drug and excipients
Osmotic Drug Delivery System Page 66
Density (tapped):
0.734 g/cm3 for powder;
0.8 g/cm3 for granules.
Density (true): 1.514 g/cm3
5.2.10.10 Stability and Storage Conditions
Mannitol is stable in the dry state and in aqueous solutions. Solutions may be sterilized by
filtration or by autoclaving and if necessary may be autoclaved repeatedly with no adverse
physical or chemical effects. In solution, mannitol is not attacked by cold, dilute acids or alkalis,
nor by atmospheric oxygen in the absence of catalysts. Mannitol does not undergo Maillard
reactions. The bulk material should be stored in a well-closed container in a cool, dry place.
5.2.10.11 Incompatibilities
Mannitol solutions, 20% w/v or stronger, may be salted out by potassium chloride or sodium
chloride. Precipitation has been reported to occur when a 25% w/v mannitol solution was
allowed to contact plastic. Sodium cephapirin at 2 mg/mL and 30 mg/mL concentration is
incompatible with 20% w/v aqueous mannitol solution. Mannitol is incompatible with xylitol
infusion and may form complexes with some metals such as aluminum, copper, and iron.
Reducing sugar impurities in mannitol have been implicated in the oxidative degradation of a
peptide in a lyophilized formation. Mannitol was found to reduce the oral bioavailability of
cimetidine compared to sucrose.

CHAPTER 6
ANALYTICAL METHODS

Chapter 6 Analytical method
Osmotic Drug Delivery System Page 67
6.0 ANALYTICAL METHOD
6.1 DEVELOPMENT OF ANALYTICAL METHOD
6.1.1 Selection of solvent
Distilled water was selected as a dissolution media because it proved to be most
suitable for development of osmotic pressure by dissolving the osmogens and also had good
permeability through the semi permeable membrane coating on the prepared tablets.
Solubility of Trimetazidine dihydrochloride in distilled water.
Solubility of drug in distilled water was determined by dissolving the known quantity
of drug in cumulative manner with the aid of sonication till the drug remains insoluble.
The solubility of Trimetazidine dihydrochloride in distilled water was found to be 9.7
mg/ml
6.1.2 Determination of λmax.
The absorption maxima of Trimetazidine dihydrochloride was determined by running
the spectrum of drug solution in double beam ultraviolet spectrophotometer
Procedure
UV spectrum of the drug was carried out in distilled water . Trimetazidine dihydrochloride
(10 mg) was accurately weighed and dissolved in distilled water. The solution was then diluted
using the same medium. An 80 ug/m1 solution was kept in a fused silica cell and UV spectrum
was recorded in the wavelength range of 200-400 nm range in U.V. Spectrophotometer
(SCHIMADHZU).
The spectrum peak point graph of absorbance of Trimetazidine dihydrochloride
versus wave length was shown in figure No.7.
The Trimetazidine dihydrochloride shows the absorbance maxima at 270 nm.in
distilled water.

Chapter 6 Analytical method
Osmotic Drug Delivery System Page 68
Figure 8: UV spectrum of Trimetazidine dihydrochloride in distilled water
6.2 VALIDATION OF ANALYTICAL METHOD128, 129
.
6.2.1 Linearity and Range.
6.2.1.1 Linearity
The linearity of an analytical procedure is its ability (within a given range) to obtain
test results which are directly proportional to the concentration (amount) of analyte in the
sample.
A linear relationship should be evaluated across the range of the analytical procedure.
It may be demonstrated directly on the active substance (by dilution of a standard stock
solution) and/or on separate weighings of synthetic mixtures of the product components,
using the proposed procedure. The latter aspect can be studied during investigation of the
range128, 129
.
6.2.1.2 Range
The range of an analytical procedure is the interval between the upper and lower
concentration (amounts) of analyte in the sample (including these concentrations) for which it
has been demonstrated that the analytical procedure has a suitable level of precision, accuracy
and linearity.

Chapter 6 Analytical method
Osmotic Drug Delivery System Page 69
The specified range is normally derived from linearity studies and depends on the
intended application of the procedure. It is established by confirming that the analytical
procedure provides an acceptable degree of linearity, accuracy and precision when applied to
samples containing amounts of analyte within or at the extremes of the specified range of the
analytical procedure128, 129
.
Procedure
Trimetazidine dihydrochloride (10mg) was accurately weighed and dissolved in 100
ml of medium [distilled water] to give a stock solution of concentration 100 ug/ml. From
this stock aliquots of solutions were transferred into nine 10 ml volumetric flasks and the
final volume was adjusted with the appropriate medium to give concentrations of 5, 10, 20,
30, 40, 50, 60, 70 and 80 ug/ml. The absorbances were measured at 270 nrn against a blank
medium.
This experiment was performed in replicate of three and the average of absorbance
was calculated and curve of absorbance verses concentration was plotted. The results were
shown in table no.6.
Acceptance criteria: The absorbance of solution of drug in solution be linear with
concentration of drug in solution with lower (5ug/ml) and higher level (80μg/ml) of target
concentration i.e. 30 µg/ml.
Table 7: Absorbance of Trimetazidine dihydrochloride at 270 nm.
Conc.
(µg/ml)
Absorbance Average
Series 1 Series 2 Series 3
0 0 0 0 0.000
5 0.013 0.012 0.012 0.012
10 0.028 0.025 0.026 0.026
20 0.056 0.06 0.06 0.059
30 0.084 0.084 0.084 0.084
40 0.114 0.112 0.111 0.112
50 0.146 0.14 0.141 0.142
60 0.167 0.168 0.168 0.168
70 0.186 0.183 0.184 0.184
80 0.199 0.199 0.199 0.199

Chapter 6 Analytical method
Osmotic Drug Delivery System Page 70
Figure 9: Linearity curve of Trimetazidine dihydrochloride at 270 nm in distilled
water
cal carve in distilled water
y = 0.0026x + 0.0037
R2 = 0.9922
0.000
0.050
0.100
0.150
0.200
0.250
0 20 40 60 80 100
conc (mcg/ml)
Ab
s
The results of Linearity test shows that the absorbance of the Trimetazidine
dihydrochloride in distilled water at 270 nm is linear (r2=0.992) with concentration range of
5ug/ml to 80ug/ml.
6.2.2 Specificity
Specificity is the ability to assess unequivocally the analyte in the presence of
components, which may be expected to be present. Typically these might include impurities,
degradants, matrix, etc128, 129
.
Specificity test is done by measuring the absorbance of placebo solution standard
solution and mixing of placebo and standard solution.
Procedure:
Standard solutions were prepared by dissolving 10 mg of accurately weighed drug in
500 ml of distilled water with aid of sonication for 20 minute. From this stock solution, 30 ml
of solution was withdrawn and diluted up to 100 ml with same media in 100 ml volumetric
flask.

Chapter 6 Analytical method
Osmotic Drug Delivery System Page 71
Placebo solution was prepared by the addition and mixing of excipients required for
the formulation in 500 ml of distilled water. From this solution 30 ml of the solution was
diluted up to 100 ml with the same media in 100 ml volumetric flask.
Mixture of drug and placebo were prepared by dissolving accurately weighing 10 mg
of drug and equivalent quantity of mixed excipients required in formulation in 500 ml of
distilled water in volumetric flask with aid of sonication for 20 minutes. From this solution 30
ml of solution was withdrawn and was diluted up to 100 ml with same media in 100 ml
volumetric flask. All these three solutions were filtered through 0.45μm filter and scan in U.V
in overlay mode was taken.
Acceptance criteria: There should not be any marked change in the absorbance of the
standard after addition of placebo. Also the placebo solution should not show significant
absorbance.
The results were shown in table no.8.
Table 8: Results of Specificity test for analytical method development
Test solution Absorbance at 270 nm
Placebo 0.001
Standard 0.084
Standard + Placebo 0.083
The results of the specificity test showed that there is no placebo interference at 270
nm.
6.2.3 Precision:
The precision of an analytical procedure expresses the closeness of agreement (degree
of scatter) between a series of measurements obtained from multiple sampling of the same
homogeneous sample under the prescribed conditions. Precision may be considered at three
levels: repeatability, intermediate precision and reproducibility.
Precision should be investigated using homogeneous, authentic samples. However, if
it is not possible to obtain a homogeneous sample it may be investigated using artificially
prepared samples or a sample solution128, 129
.
The precision of an analytical procedure is usually expressed as the variance, standard
deviation or coefficient of variation of a series of measurements.

Chapter 6 Analytical method
Osmotic Drug Delivery System Page 72
A. Method precision:
Method precision test was performed by measuring the absorbance of the target
solution of target concentration at its λ max in six replicates128, 129
.
Procedure:
Stock solution was prepared according to the earlier procedure and suitable dilution
was made to prepare 30 μg/ml solutions. The absorbance of these solutions was measured at
270 nm. This experiment was performed in six replicates. Standard deviation and %R.S.D
between six absorbances were calculated as shown in table no.8.
Acceptance criteria: The %R.S.D should not be more than 2%.
Table 9: Results of Method Precision.
Sample I.D. Absorbance at 270 nm
T1 0.087
T2 0.086
T3 0.084
T4 0.086
T5 0.087
T6 0.084
Avg. 0.08566
S.D. 0.001366
%RSD 1.604
The results of the method precision show that the percentage RSD of the absorbance
is less than 2%.
B. System Precision:
System precision test was done by measuring the absorbance of solution at small time
interval in replicates of nine. This test is also known as repeatability128, 129
.
Procedure:
The stock solution was prepared as described previously and suitable dilution was
made to prepare 30 μg/ml solutions. The absorbance of this solution was read at 270 nm at
small time interval in 9 replicates. The R.S.D and standard deviation was shown in table no.9
Acceptance criteria: The %R.S.D should not be more than 1 %.

Chapter 6 Analytical method
Osmotic Drug Delivery System Page 73
Table 10: Results of System Precision.
Sr.no Absorbance at
270 nm
1 0.084
2 0.084
3 0.084
4 0.083
5 0.084
6 0.085
7 0.084
8 0.084
9 0.084
Avg. 0.084
S.D. 0.0005
%RSD 0.5952
The results of the system precision shows that the % RSD of the absorbance is less
than 1%
C. Interday and Intraday Precision:
Interday precision was done by measuring the absorbance of 30 μg/ml solution of
Trimetazidine dihydrochloride in distilled water at 270 nm at 2 hours interval within a day.
Intraday precision test was done by measuring the measuring the absorbance of the 30
μg/ml solution of Trimetazidine dihydrochloride distilled water at 270 nm in three day128, 129
.
The average, standard deviation and percentage RSD of the absorbance was
calculated as show in Table 11 and12.

Chapter 6 Analytical method
Osmotic Drug Delivery System Page 74
Table 11: Results of inter day precision Table 12: Results of intraday precision
.
The results of the intraday and interday precisions shows that the %RSD of the
absorbance is less than 1%
6.2.4 Accuracy
The accuracy of an analytical procedure expresses the closeness of agreement
between the value which is accepted either as a conventional true value or an accepted
reference value and the value found. This is sometimes termed trueness128, 129
.
Accuracy should be established across the specified range of the analytical procedure.
Procedure:
Prepare the blend of placebo and the active by mixing the active drug in to the
placebo powder at 25%, 50%, 75%, 100%, 125%, 150% level of the target concentration
each in triplicate. Analyze the recovery of sample as per proposed test method and calculate
the amount of drug recovered at each spike level and 5 recovery at each spike level. The
results were shown in table no. 12.
Time Absorbance
at 270 nm
09:00AM 0.084
12:00AM 0.084
05:00AM 0.083
Avg. 0.084
S.D 0.000707
%RSD 0.8333
Day Absorbance
at 270 nm
1st Day 0.084
2nd Day 0.083
3rd Day 0.083
Avg. 0.08333
S.D. 0.000577
%RSD 0.6

Chapter 6 Analytical method
Osmotic Drug Delivery System Page 75
Table 13: Results of Accuracy Test.
Recovery
Level
Amount
Of Drug
Recovered(mg)
Amount
of Drug
added(mg)
%Recovery Average S.D. %RSD
25%
14.95 15 99.67 100.04
0.49
0.49
14.98 15 99.87
15.09 15 100.60
50%
29.60 30 98.67 99.69
0.89
0.89
30.08 30 100.27
30.04 30 100.13
75%
44.2 45 98.22 99.48
1.14
1.15
44.9 45 99.78
45.2 45 100.44
100%
59.0 60 98.33 98.94
0.79
0.80
59.9 60 99.83
59.2 60 98.67
125%
74.2 75 98.93 100.13
1.14
1.14
75.9 75 101.20
75.2 75 100.27
150%
90.9 90 101.00
100.07 0.94 0.94 89.2 90 99.11
90.1 90 100.11
Acceptance criteria: the difference between the individual recovery and the average
recovery at each spike level shall be ± 2% and the recovery shall be not less than 98% and not
more than 102%.
The percentage RSD for the triplicate at each spike level shall be not more than 2%.

Chapter 6 Analytical method
Osmotic Drug Delivery System Page 76
6.2.5 Robustness test
The robustness of an analytical method is a measure of capacity to maintained
unaffected by small, deliberate variation in method parameters and provides an indication of
its reliability during normal usage128, 129
.
Robustness test was done by measuring the solution stability for 8 hours.
Procedure
The main stock solution was prepared as described previously. From this stock
aliquots of solutions were transferred into 10 ml volumetric flasks and the final volume was
adjusted with the appropriate medium to give concentrations of 10, 20, 30, 40 ug/ml solution.
The absorbances of these solutions were measured in interval of 1 hour for 8 hours.
The results of Solution Stability were shown in table no.14.
Table 14: Results of Solution Stability.
Time (hr) Absorbance at 270 nm
10 ug/ml 20 ug/ml 30 ug/ml 40 ug/ml
Initial 0.028 0.054 0.083 0.116
1 0.027 0.053 0.083 0.115
2 0.028 0.053 0.084 0.116
3 0.028 0.054 0.084 0.114
4 0.028 0.054 0.084 0.115
5 0.028 0.054 0.083 0.116
6 0.028 0.052 0.082 0.114
7 0.027 0.053 0.084 0.116
8 0.0275 0.054 0.084 0.116
Avg. 0.027722 0.053444 0.083444 0.115333
S.D. 0.00044 0.00072 0.00072 0.00086
%RSD 1.5906 1.3593 0.87 0.75
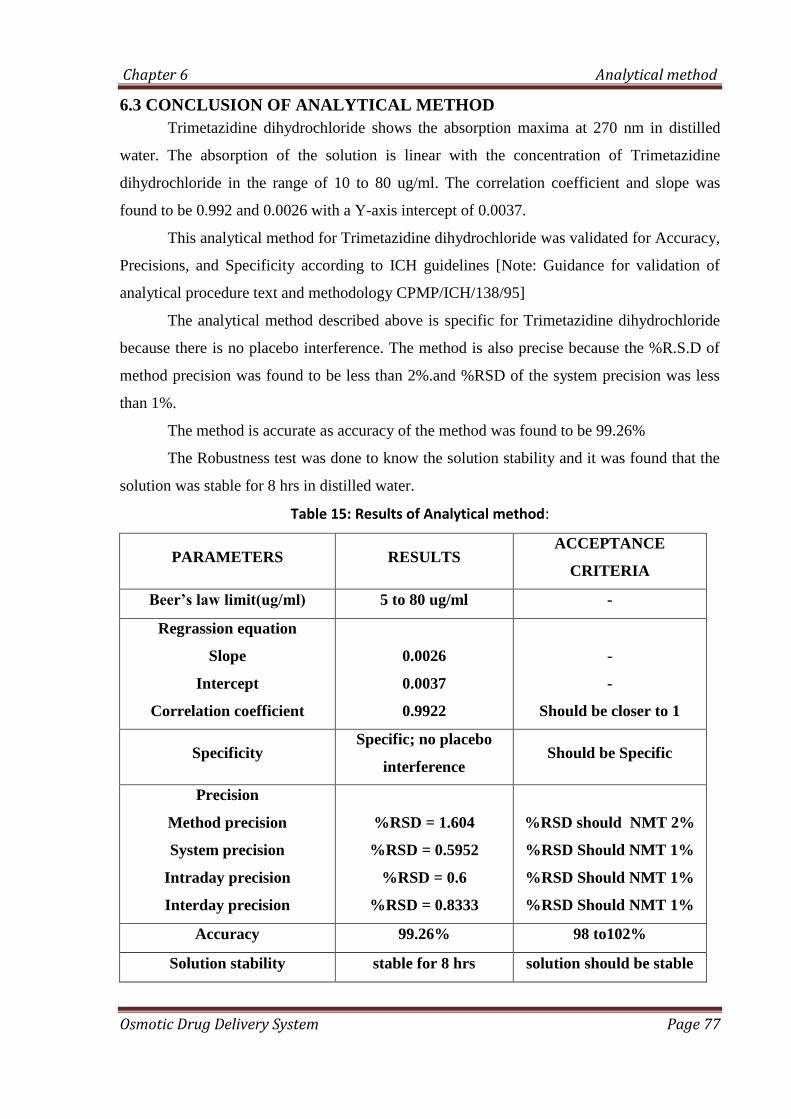
Chapter 6 Analytical method
Osmotic Drug Delivery System Page 77
6.3 CONCLUSION OF ANALYTICAL METHOD
Trimetazidine dihydrochloride shows the absorption maxima at 270 nm in distilled
water. The absorption of the solution is linear with the concentration of Trimetazidine
dihydrochloride in the range of 10 to 80 ug/ml. The correlation coefficient and slope was
found to be 0.992 and 0.0026 with a Y-axis intercept of 0.0037.
This analytical method for Trimetazidine dihydrochloride was validated for Accuracy,
Precisions, and Specificity according to ICH guidelines [Note: Guidance for validation of
analytical procedure text and methodology CPMP/ICH/138/95]
The analytical method described above is specific for Trimetazidine dihydrochloride
because there is no placebo interference. The method is also precise because the %R.S.D of
method precision was found to be less than 2%.and %RSD of the system precision was less
than 1%.
The method is accurate as accuracy of the method was found to be 99.26%
The Robustness test was done to know the solution stability and it was found that the
solution was stable for 8 hrs in distilled water.
Table 15: Results of Analytical method:
PARAMETERS RESULTS ACCEPTANCE
CRITERIA
Beer’s law limit(ug/ml) 5 to 80 ug/ml -
Regrassion equation
Slope
Intercept
Correlation coefficient
0.0026
0.0037
0.9922
-
-
Should be closer to 1
Specificity Specific; no placebo
interference Should be Specific
Precision
Method precision
System precision
Intraday precision
Interday precision
%RSD = 1.604
%RSD = 0.5952
%RSD = 0.6
%RSD = 0.8333
%RSD should NMT 2%
%RSD Should NMT 1%
%RSD Should NMT 1%
%RSD Should NMT 1%
Accuracy 99.26% 98 to102%
Solution stability stable for 8 hrs solution should be stable

CHAPTER 7
PREFORMULATION STUDIES

Chapter 7 Preformulation Studies
Osmotic Drug Delivery System Page 78
List of equipments used:
Sr. no Equipment /instrument Make
1 Electronic Balance Shimadzu
2 Halogen moisture balance Mettler Toledo
3 Hot air oven Polar Industries
4 pH meter Lab india
5 Tray drier Cintex
6 8 Station compression machine Cadmach
7 Sieve shaker Cisa
8 Water purifier Barnstead
9 Fourier infra red spectrophotometer Shimadzu
10 UV visible double beam
spectrophotometer Shimadzu
11 Friability tester Electrolab
12 Vernier calipers (digital) Miyutoyo
13 Hardness tester 8M Dr. Schleunger
14 Cleaning machine Roots multiclean Ltd
15 Standard weight box Mettler
16 Thermometer Shoze
17 Dissolution test apparatus USP Electrolab
18 Tapped Density Apparatus Veego

Chapter 7 Preformulation Studies
Osmotic Drug Delivery System Page 79
7.0 PREFORMULATION STUDY122-125
.
Preformulation studies are the first step in the rational development of dosage form of
a drug substance. The objective of preformulation studies is to develop a portfolio of
information about the drug substance, so that this information is useful to develop
formulation. Preformulation can be defined as investigation of physical and chemical
properties of drug substance alone and when combined with excipients.
Preformulation investigations are designed to identify those physicochemical
properties and excipients that may influence the formulation design, method of manufacture,
and pharmacokinetic-biopharmaceutical properties of the resulting product.
7.1 Organoleptic Characteristics122
The color, odor, and taste of the Trimetazidine dihydrochloride were characterized
and recorded using descriptive terminology; the results were shown in the table no.16
7.2 Microscopic Examination122
In this study, pure drug was examined under compound microscope for crystal
morphology. The results were shown in table no.16
Table 16: Results of Organoleptic properties of Trimetazidine dihydrochloride
Properties Results
Description Crystalline
Taste Slightly bitter
Odor Odor less
Colour Off white
7.3 Melting point determination:
The melting point of Trimetazidine dihydrochloride was determined by capillary method
using programmable melting point apparatus (Veego Scientific, Model -VMPPM).
Precautions were taken to maintain the uniform heating of silicon bath, in which the capillary
containing the drug was placed.

Chapter 7 Preformulation Studies
Osmotic Drug Delivery System Page 80
The melting point of trimetazidine dihydrochloride was found to be 222°C, which was
within the range given in the British Pharmacopoeia (220-225°C)42
. Hence range observed is
having good agreement with official value.
7.4 Infra Red Spectrum:
IR absorption spectrum of Trimetazidine dihydrochloride was recorded by
potassium bromide dispersion technique in which dry sample of drug and potassium
bromide was mixed uniformly and the mixed powder blend was placed in sample
holder and an IR spectrum was recorded using FTIR spectrophotometer (FTIR-8400s).
The infrared absorption spectrum of trimetazidine dihydrochloride obtained on a FTIR
with diffused reflectance assembly is presented in Figure 10 (a). Spectral assignments for
major absorption bands provided in Table 17 are consistent with the structure of trimetazidine
dihydrochloride.
Figure 10 (a) : Infrared absorption spectrum of Trimetazidine Dihydrochloride
Table 17: IR spectrum interpretation of trimetazidine dihydrochloride
Frequency (cm-1
) Assignment
1211 cm-1
, 1232 cm-1
, 1288 cm-1
3 Aromatic methoxy (-OCH3)
2908 cm-1
, 2945 cm-1
, 2989 cm-1
3 Methyl stretching (-CH3)
1600 cm-1
-1430 cm-1
Aromatic C-N ring stretching
2980 cm-1
Aromatic CH stretching

Chapter 7 Preformulation Studies
Osmotic Drug Delivery System Page 81
7.5 Sieve Analysis123
Standard sieves of different meshes as per the specifications of USP were arranged in
a nest with courses at the top. A sample of the 40 mesh passed powder was placed on top
sieve. This sieve set was fixed to the mechanical shaker apparatus and shaken for a certain
period of times. The powder retained on each sieve was weighed and percentage of powder
retained on each sieve was calculated using the initial weight taken. The results were shown
in the table no.19
7.6 Bulk Density122, 87
:
An accurately weighed quantity of powder, which was previously passed through
sieve # 40 [USP] and carefully poured into graduated cylinder. Then after pouring the powder
into the graduated cylinder the powder bed was made uniform without disturbing. Then the
volume was measured directly from the graduation marks on the cylinder as ml. The volume
measure was called as the bulk volume and the bulk density is calculated by following
formula;
Bulk density = Weight of powder / Bulk volume
The results were shown in table no.19
7.7 Tapped Density122, 87
After measuring the bulk volume the same measuring cylinder was set into tap density
apparatus. The tap density apparatus was set to 300 taps drop per minute and operated for 500
taps. Volume was noted as (Va) and again tapped for 750 times and volume was noted as
(Vb). If the difference between Va and Vb not greater than 2% then Vb is consider as final
tapped volume. The tapped density is calculated by the following formula
Tapped density = Weight of powder / Tapped volume
Results were shown in table no.19

Chapter 7 Preformulation Studies
Osmotic Drug Delivery System Page 82
7.6 Carr’s Index [Compressibility Index] and Hausner’s Ratio
Carr’s index and Hausner’s ratio measure the propensity of powder to be compressed
and the flowability of powder. Carr’s index and Hausner’s ratio can be calculated from the
bulk and tapped density.
Carr’s index = Tapped density - Bulk density X 100
Tapped Density
Hausner’s ratio = Tapped density / Bulk density
The relationship between % compressibility and flowability is shown in Table 18
Table 18 : Relationship between % compressibility and flowability:
% Compressibility Flowability
5-15 Excellent
12-16 Good
18-21 Fair passable
23-25 Poor
33-38 Very Poor
< 40 Very very poor
The results of the above granulometry studies were as shown in table no.19
Table 19: Granulometry properties of powder drug and excipients
Parameter
Results
Trimetazidine
dihydrochloride
HPMC
K4M
Carbopol
71G
Povidone
K30
Lactose
mono
Loss on Drying
(%w/w) 1.55 0.497 0.376 0.43 0.35
Bulk Density
(gm/cm3) 0.309
0.314 0.18 0.29 0.73
Tapped Density
(gm/cm3) 0.4123 0.557 0.296 0.39 0.122
Compressibility
Index 36.419 43.62 39.19 25.64 14.11
Hauser’s Ratio 1.572 1.774 1.644 1.344 1.164
Particle size 180-350 um 1-3um 2-4um 75-130
um
65-175
um
Chapter 7 Preformulation Studies
Osmotic Drug Delivery System Page 83
7.7 Drug Excipients Compatibility Study123
Protocol for drug-excipients compatibility
(a) Drug: Excipients Ratio
1. API alone
2. API:Diluent:- 1:8
3. API:Binders and Lubricant :-1:1
4. API:Polymer:-1:5
(b) Pack details
Plain glass vials with rubber stopper and aluminum seal
(c) Storage condition
1. 40ºC/75 %RH
2. 60ºC
3. Control sample at 2-8°C
(d) Testing Frequency
1. 2nd
week for sample charged at 60ºC
2. 4th
week sample charged at 40ºC/75%RH
Physical observation shall be done at every week, up to 4 week
(e) Test to be performed
1. Description
2. DSC of initial sample
3. Content determination by U.V
Procedure
API and excipients were thoroughly mixed in predetermined ratio given above and
passed through the sieve no.40. The blend was filled in plain glass vials and closed with grey
rubber stoppers and sealed with aluminum seal and charged in to stress condition at 2-8ºC,
60ºC and 40º C/75%RH. Similarly API was also kept at all condition as per the sample.
Samples were withdrawn for analysis within two day of sampling date as per the
compatibility study plan.

Chapter 7 Preformulation Studies
Osmotic Drug Delivery System Page 84
Table 20 : Drug:Excipients combination and ratio for compatibility study
Batch
no.
Drug-Excipients
combination
D:E
ratio
D:E
(g)
Batch
size
(g)
Labeled
claim
(per gm)
A API alone - - 6 1
B API + HPMC K4M 1:5 2:10 12 166.67
C API + Carbopol 71G 1:5 2:10 12 166.67
D API + Lactose 1:8 2:16 18 125
E API + Povidone K30 1:1 3:3 6 500
F API + Mg.Stearate 1:1 3:3 6 500
G API + Talc 1:1 3:3 6 500
Physical observation
Physical observation of sample was done at every week for any color change or lumps
formation and flow. The results of the physical observation were shown in table no.21 There
was no color change and no lumps observed in sample charged at 40ºc/75%RH for 1 month
and 60ºc for 15 days.
Table 21: Results of the physical observation
Batch
no. Initial
40ºc/75%RH 60º
1st
week
2nd
week
3rd
week
4th
week
1st
week
2nd
week
A Off-White + + + + + +
B Off-White + + + + + +
C Off-White + + + + + +
D White + + + + + +
E Off-White + + + + + +
F Off-White + + + + + +
G Off-White + + + + + +
+ indicates the there is no change in colure or lumps formation

Chapter 7 Preformulation Studies
Osmotic Drug Delivery System Page 85
7.8 Content determination
The content of Trimetazidine dihydrochloride in each sample was determined by the
assaying the sample in U.V at 270 nm. Weight of the powder equivalent to 60 mg of
Trimetazidine dihhydrochloride was accurately weighed and dissolved in 500 ml distilled
water in a volumetric flask with the aid of sonication for 20 min in bath sonicator. Five ml of
sample was withdrawn from this solution and dilute up to 25 ml with distilled water in a
volumetric flask. The sample was filtered through the 0.45 um mdi filter and absorbance of
this solution was measured at 270 nm. in U.V. The content of each sample was determined in
replicates of three.
The results were shown in table no.22
Table 22: Results of the content determination compatibility study
Batch no. Controlled Sample at 2-8ºc 40ºc/75%RH for 1month 60ºc for 15 day
A 101.05(±1.99) 99.08(±0.81) 98.58(±0.38)
B 96.12(±3.71) 95.69(±3.01) 95.13(±2.92)
C 98.21(±1.72) 97.23(±2.42) 98.09(±1.96)
D 101.29(±1.21) 99.82(±0.55) 99.26(±0.49)
E 100.68(±1.59) 98.03(±1.123) 96.67(±3.21)
F 97.17(±4.20) 98.58(±1.11) 97.60(±0.74)
G 102.83(±2.56) 100.37(±2.40) 97.60(±0.122)
The results of the content determination shows that the amount of trimetazidine
dihydrochloride was recovered in all the sample loaded at 40°c/75%RH for one month and
60°c for 15 day, indicating that there is no incompatibility between drug and excipients.
7.9 Differential scanning calorimetry
A differential scanning calorimeter was used for thermal analysis of drug and mixture
of drug and excipients. The drug and excipients were passed through the sieve no. 60 and
mixed in ratio as shown in table no.15 the drug alone and mixture of drug and excipients was
weighed directly in the pierced DSC aluminum pan (Aluminum Standard 40 ul) and scanned
at the temperature range of 50-300 °c and at heating rate of 10 °c/min. and nitrogen purging
rate 50 ml/min. the thermogram obtained were observed for any interaction.

Chapter 7 Preformulation Studies
Osmotic Drug Delivery System Page 86
The DSC thermogram of drug, drug-excipients, and excipients were shown in
following figures.
Figure 10: DSC thermogram of trimetazidine dihydrochloride
Figure 11: DSC thermogram of trimetazidine dihydrochloride + HPMC K4M
Sample Holder: Aluminum Standard 40ul
Module: DSC822e/500/800/427210/8184/16/05/05,
Method: trimetazidine dihydrochloride 50.0-300.0°C 10.00°C/min N2 50.0 ml/min
Method Name: trimetazidine dihydrochloride
mW
-16
-14
-12
-10
-8
-6
-4
-2
0
min
°C 60 80 100 120 140 160 180 200 220 240 260 280
0 2 4 6 8 10 12 14 16 18 20 22 24
^exo
Lab: METTLER SW 7.01 e R TA METTLER TOLEDO S
Sample Holder: Aluminum Standard 40ul Module: DSC822e/500/800/427210/8184/16/05/05, 16.05.2005 15:29:00
50.0-300.0°C 10.00°C/min N2 50.0 ml/min
Integral -336.22 mJ normalized -74.72 Jg^-1 Onset 191.13 °C Endset 207.38 °C
mW
-6
-4
-2
0
2
min
°C 60 80 100 120 140 160 180 200 220 240 260 280
0 2 4 6 8 10 12 14 16 18 20 22 24
^exo
Lab: METTLER SW 7.01 e R TA METTLER TOLEDO S
Trimetazidine dihycrochloride+HPMC K4M
Trimetazidine dihycrochloride

Chapter 7 Preformulation Studies
Osmotic Drug Delivery System Page 87
Figure 12: DSC thermogram of trimetazidine dihydrochloride + Carbopol 71G
Figure 13: DSC thermogram of Trimetazidine dihydrochloride + Lactose Mono
Sample Holder: Aluminum Standard 40ul
Module: DSC822e/500/800/427210/8184/16/05/05, 16.05.2005 15:29:00
50.0-300.0°C 10.00°C/min N2 50.0 ml/min
Integral -350.51 mJ Onset 192.59 °C Endset 209.77 °C
mW
-2
-1
0
1
2
3
min
°C 60 80 100 120 140 160 180 200 220 240 260 280
0 2 4 6 8 10 12 14 16 18 20 22 24
^exo Trimetazidine dihycrochloride+Carbopol 71G
Lab: METTLER SW 7.01 e R TA METTLER TOLEDO S
Sample Holder: Aluminum Standard 40ul
Module: DSC822e/500/800/427210/8184/16/05/05, 16.05.2005 15:29:00
Integral -305.26 mJ normalized -76.31 Jg^-1 Onset 194.71 °C Endset 211.59 °C
Integral -333.61 mJ normalized -83.40 Jg^-1 Onset 164.14 °C Endset 177.03 °C
mW
-10
-8
-6
-4
-2
0
min
°C 60 80 100 120 140 160 180 200 220 240 260 280
0 2 4 6 8 10 12 14 16 18 20 22 24
^exo Trimetazidine dihydrochloride + Lactose mono
Lab: METTLER SW 7.01 e R TA METTLER TOLEDO S
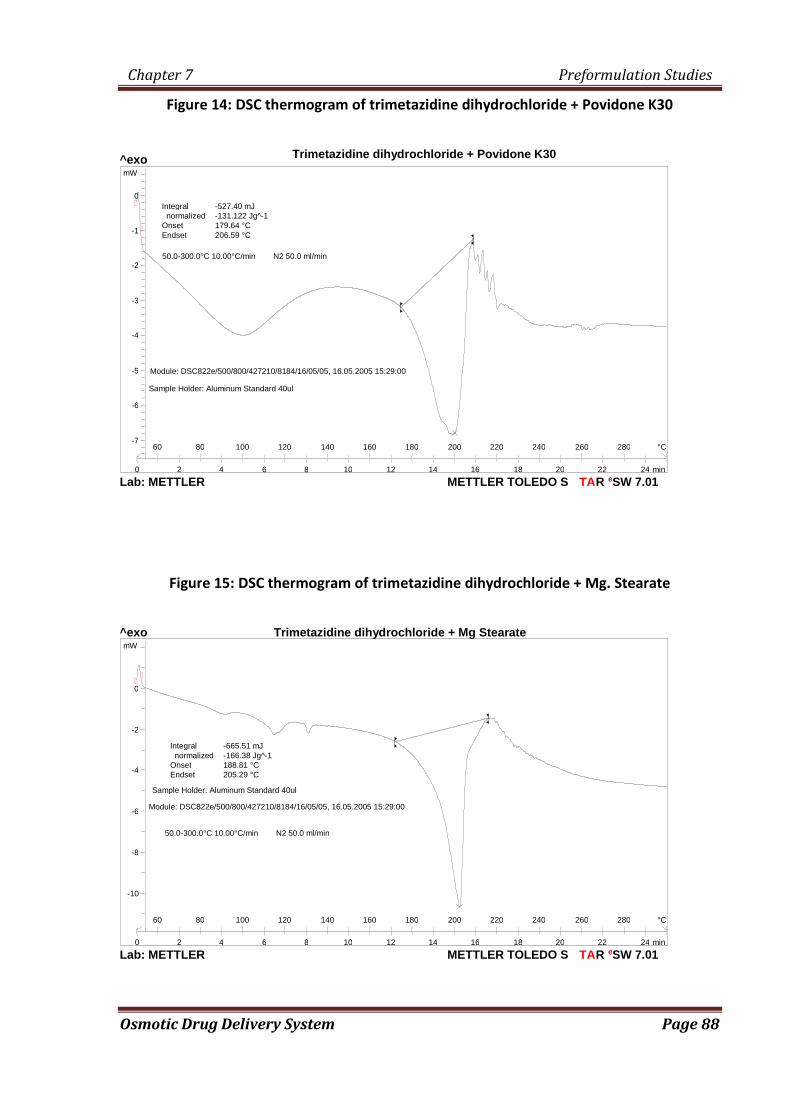
Chapter 7 Preformulation Studies
Osmotic Drug Delivery System Page 88
Figure 14: DSC thermogram of trimetazidine dihydrochloride + Povidone K30
Figure 15: DSC thermogram of trimetazidine dihydrochloride + Mg. Stearate
Trimetazidine dihydrochloride + Povidone K30
50.0-300.0°C 10.00°C/min N2 50.0 ml/min
Sample Holder: Aluminum Standard 40ul Module: DSC822e/500/800/427210/8184/16/05/05, 16.05.2005 15:29:00
Integral -527.40 mJ normalized -131.122 Jg^-1 Onset 179.64 °C Endset 206.59 °C
mW
-7
-6
-5
-4
-3
-2
-1
0
min
°C 60 80 100 120 140 160 180 200 220 240 260 280
0 2 4 6 8 10 12 14 16 18 20 22 24
^exo
Lab: METTLER SW 7.01 e R TA METTLER TOLEDO S
Sample Holder: Aluminum Standard 40ul Module: DSC822e/500/800/427210/8184/16/05/05, 16.05.2005 15:29:00
50.0-300.0°C 10.00°C/min N2 50.0 ml/min
Integral -665.51 mJ normalized -166.38 Jg^-1 Onset 188.81 °C Endset 205.29 °C
mW
-10
-8
-6
-4
-2
0
min
°C 60 80 100 120 140 160 180 200 220 240 260 280
0 2 4 6 8 10 12 14 16 18 20 22 24
^exo Trimetazidine dihydrochloride + Mg Stearate
Lab: METTLER SW 7.01 e R TA METTLER TOLEDO S

Chapter 7 Preformulation Studies
Osmotic Drug Delivery System Page 89
Figure16: DSC thermogram of trimetazidine dihydrochloride + Talc
Figure 17: DSC thermogram of HPMC K4M
Sample Holder: Aluminum Standard 40ul
Module: DSC822e/500/800/427210/8184/16/05/05, 16.05.2005 15:29:00
50.0-300.0°C 10.00°C/min N2 50.0 ml/min
Integral -915.87 mJ normalized -218.06 Jg^-1 Onset 191.48 °C Endset 208.25 °C
mW
-16
-14
-12
-10
-8
-6
-4
-2
0
min
°C 60 80 100 120 140 160 180 200 220 240 260 280
0 2 4 6 8 10 12 14 16 18 20 22 24
^exo Trimetazidine dihydrochloride+ talc
Lab: METTLER SW 7.01 e R TA METTLER TOLEDO S
Sample Holder: Aluminum Standard 40ul
Module: DSC822e/500/800/427210/8184/16/05/05, 16.05.2005 15:29:00
50.0-300.0°C 10.00°C/min N2 50.0 ml/min
Integral -284.20 mJ normalized -71.05 Jg^-1 Onset 56.34 °C Endset 110.07 °C
mW
0
1
2
3
4
min
°C 60 80 100 120 140 160 180 200 220 240 260 280
0 2 4 6 8 10 12 14 16 18 20 22 24
^exo
Lab: METTLER SW 7.01 e R TA METTLER TOLEDO S
HPMC K4M
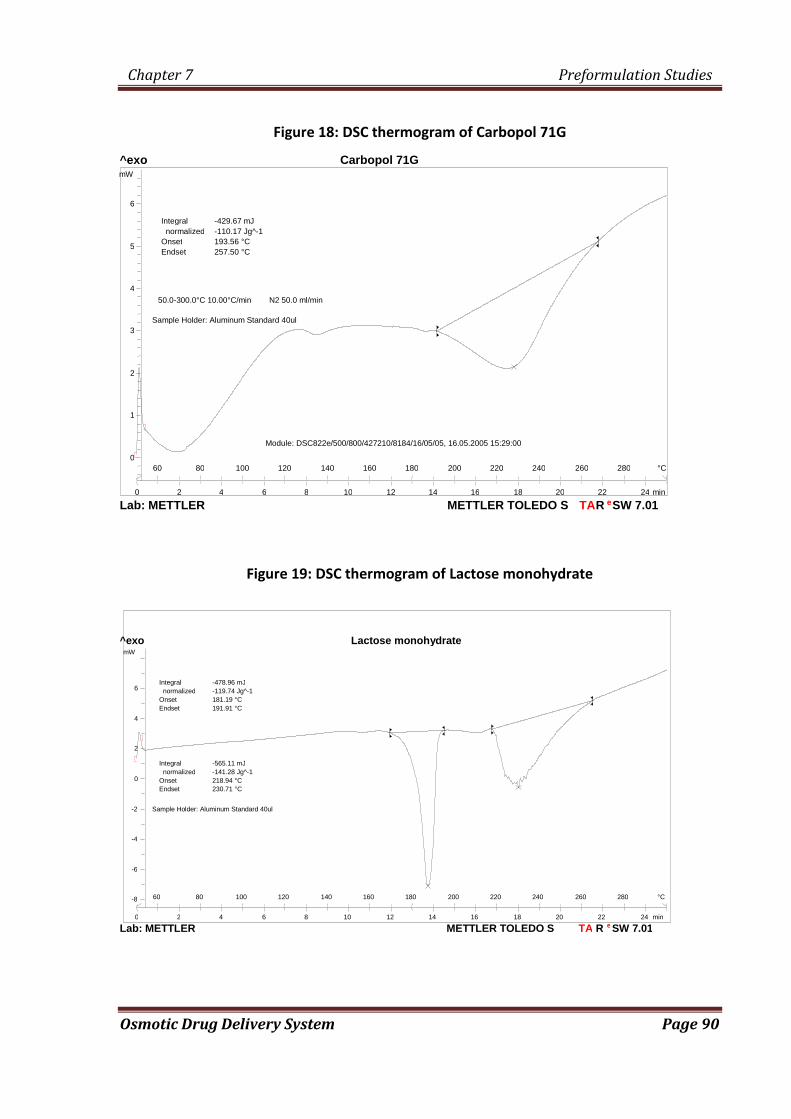
Chapter 7 Preformulation Studies
Osmotic Drug Delivery System Page 90
Figure 18: DSC thermogram of Carbopol 71G
Figure 19: DSC thermogram of Lactose monohydrate
Sample Holder: Aluminum Standard 40ul
Module: DSC822e/500/800/427210/8184/16/05/05, 16.05.2005 15:29:00
50.0-300.0°C 10.00°C/min N2 50.0 ml/min
Integral -429.67 mJ normalized -110.17 Jg^-1 Onset 193.56 °C Endset 257.50 °C
mW
0
1
2
3
4
5
6
min
°C 60 80 100 120 140 160 180 200 220 240 260 280
0 2 4 6 8 10 12 14 16 18 20 22 24
^exo Carbopol 71G
Lab: METTLER SW 7.01 e R TA METTLER TOLEDO S
Sample Holder: Aluminum Standard 40ul
Integral -565.11 mJ normalized -141.28 Jg^-1 Onset 218.94 °C Endset 230.71 °C
Integral -478.96 mJ normalized -119.74 Jg^-1 Onset 181.19 °C Endset 191.91 °C
mW
-8
-6
-4
-2
0
2
4
6
min
°C 60 80 100 120 140 160 180 200 220 240 260 280
0 2 4 6 8 10 12 14 16 18 20 22 24
^exo Lactose monohydrate
Lab: METTLER SW 7.01 e R TA METTLER TOLEDO S

Chapter 7 Preformulation Studies
Osmotic Drug Delivery System Page 91
Figure 20: DSC thermogram of Povidone K/30
Figure 21: DSC thermogram of Magnesium stearate
Sample Holder: Aluminum Standard 40ul Module: DSC822e/500/800/427210/8184/16/05/05, 16.05.2005 15:29:00
Method: trimetazidine dihydrochloride 50.0-300.0°C 10.00°C/min N2 50.0 ml/min
Integral -489.89 mJ normalized -122.47 Jg^-1 Onset 108.09 °C Endset 124.80 °C
98.84 °C
mW
-8
-6
-4
-2
0
2
min
°C 60 80 100 120 140 160 180 200 220 240 260 280
0 2 4 6 8 10 12 14 16 18 20 22 24
^exo
Lab: METTLER SW 7.01 e R TA METTLER TOLEDO S
Sample Holder: Aluminum Standard 40ul
Module: DSC822e/500/800/427210/8184/16/05/05, 16.05.2005 15:29:00
50.0-300.0°C 10.00°C/min N2 50.0 ml/min
Integral -606.02 mJ normalized -151.51 Jg^-1 Onset 54.39 °C Endset 95.122 °C
P.V.P K29/30, 28.06.2006 16:24:50 P.V.P K29/30, 4.0000 mg
mW
-10
-8
-6
-4
-2
min
°C 60 80 100 120 140 160 180 200 220 240 260 280
0 2 4 6 8 10 12 14 16 18 20 22 24
^exo Povidone K/30
Lab: METTLER SW 7.01 e R TA METTLER TOLEDO S

Chapter 7 Preformulation Studies
Osmotic Drug Delivery System Page 92
Figure 22: DSC thermogram of Talc
Table 23: Interpretation of DSC Thermogram of Drug, Exipients and Mixture of Drug and excipients
Combination Onset
(°c)
End set
(°c)
Peak
(°c)
Integral
(mj)
Trimetazidine dihydrochloride 190.61°c 210.03°c 203.47 1056.08
Trimetazidine dihydrochloride
+ HPMC K4M 191.13 207.38 200.05 336.22
Trimetazidine dihydrochloride
+ Carbopol 71 G 192.59 209.77 204 350.51
Trimetazidine dihydrochloride
+ Lactose mono 194.71 211.59 198 305.26
Trimetazidine dihydrochloride
+ Povidone K30 179.64 206.59 200 527.40
Trimetazidine dihydrochloride
+ Mg. Stearate 188.81 205.29 202 665.51
Trimetazidine dihydrochloride
+ Talc 191.48 208.25 202 915.87
HPMC K4M 56.11 110.09 - 287.03
Sample Holder: Aluminum Standard 40ul
Module: DSC822e/500/800/427210/8184/16/05/05, 16.05.2005 15:29:00
Method: trimetazidine dihydrochloride 50.0-300.0°C 10.00°C/min N2 50.0 ml/min
Method Name: trimetazidine dihydrochloride
talc, 28.06.2006 10:57:31 talc, 4.0000 mg
mW
1.5
2.0
2.5
3.0
3.5
min
°C 60 80 100 120 140 160 180 200 220 240 260 280
0 2 4 6 8 10 12 14 16 18 20 22 24
^exo Talc
Lab: METTLER SW 7.01 e R TA METTLER TOLEDO S

Chapter 7 Preformulation Studies
Osmotic Drug Delivery System Page 93
Carbopol 71G 193.56 257.50 - 429.67
Lactose mono 218.94 230.71 - 565.11
Povidone K30 54.39 95.122 - 606.02
Mg.Stearate 82.82 98.84 - 489.89
Talc - - - -
The thermal behavior of the pure drug, respective excipients and the combination of
drug and excipients is compared
The DSC trace of trimetazidine dihydrochloride showed a sharp endothermic peak at
203.47°c. In the DSC trace of the mixture of trimetazidine and excipients, the sharp
endothermic peak observed neared to 203.47°c, in the majority of case. Melting endotherm of
the drug was well preserved with a slight change in terms of broadening of peak or shifting
towards the lower temperature. Thus these minor changes in the melting endotherm of drug
could be due to the mixing of drug and excipients, which lowers the purity of each
component in the mixture and may not necessarily indicating potential incompatibility.

CHAPTER 8
MONOLAYER OSMOTIC
DRUG DELIVERY SYSTEM

Chapter 8 Monolayer osmotic drug delivery system
Osmotic Drug Delivery System Page 94
8.0 Experimental trial for Monolayer osmotic Tablets of Trimetazidine dihydrochloride
8.1 Feasibility trial of Core tablet:
Batch size: 200 tablets Table 24: Trial formulations for Feasibility trial (Core)
Sr
no.
Batch Code CT 1 CT2 CT 3 CT 4 CT 5 CT 6 CT 7
Ingredients Qty.
mg/Tab
Qty.
mg/200
Tab
Qty.
mg/Tab
Qty.
mg/200
Tab
Qty.
mg/Tab
Qty.
mg/200
Tab
Qty
mg/Tab
Qty.
mg/200
Tab
Qty.
mg/Tab
Qty.
mg/200
Tab
Qty.
mg/Tab
Qty.
mg/200
Tab
Qty.
mg/Tab
Qty.
mg/200
Tab
Dry Mix
1 Trimetazidine 60 12000 60 12000 60 12000 60 12000 60 12000 60 12000 60 12000
2 HPMC K4M 100 20000 100 20000 100 20000 100 20000 100 20000 100 20000 100 20000
3 Lactose Mono 155 31000 155 31000 155 31000 160 32000 155 31000 150 30000 145 29000
Binder Solution
4 Povidone K30 20 4000 20 4000 20 4000 15 3000 20 4000 25 5000 30 6000
5 IPA -- Qs 20000 qs 18000 qs 20000 qs 20000 qs 20000 qs 20000
6 Water qs 15000 -- -- qs 2000 -- -- -- -- -- -- -- -
Extra Granular
7 Carbopol 71 G 125 25000 125 25000 125 25000 125 25000 125 25000 125 25000 125 25000
8 Na. Clorde 30 6000 30 6000 30 6000 30 6000 30 6000 30 6000 30 6000
9 Mg Stearate 5 1000 5 1000 5 1000 5 1000 5 1000 5 1000 5 1000
10 Talc 5 1000 5 1000 5 1000 5 1000 5 1000 5 1000 5 1000
Core tab Wt 500 100000 500 120000 500 100000 500 100000 500 100000 500 100000 500 100000
Chapter 8 Monolayer osmotic drug delivery system
Osmotic Drug Delivery System Page 95
Granulation process:
a. Dry mixing:
TMZ, HPMC K4M and Lactose mono were dry mixed in the above proportion in a
polybag manually.
b. Binder solution preparation:
Povidone K30 was dissolved in various proportions of IPA and water as per the above
table.
c. Granulation:
Dry mix blend was granulated with prepared binder solution.
d. Drying:
Wet mass was dried at 50 C in oven to get LOD below 2%w/w using Halogen moisture
detector at 105 C temperature.
e. Sizing:
Dried granules were passed through 20# sieve.
f. Extragranular mixing:
Above sized granules were mixed with Carbopol 71G, sodium chloride and talc for 10
minutes at 24 rpm in an octagonal blender.
g. Lubrication:
The above granules were lubricated with 60# passed Magnesium stearate for 5 minutes at
24 rpm in an octagonal blender.
h. Compression:
Lubricated granules were compressed using 9.0 mm, round, standard concave punches,
plain on both the sides in rotary compression machine.
Chapter 8 Monolayer osmotic drug delivery system
Osmotic Drug Delivery System Page 96
8.1.1 Characterization of lubricated granules:
The lubricated granules prepared as above were subjected to the following tests to select the best
trial batch for further optimization
8.1.1.1 Sieve Analysis123
Standard sieves of different meshes as per the specifications of USP were arranged in a
nest with courses at the top. A sample of the 40 mesh passed powder was placed on top sieve.
This sieve set was fixed to the mechanical shaker apparatus and shaken for a certain period of
times. The powder retained on each sieve was weighed and percentage of powder retained on
each sieve was calculated using the initial weight taken. The results were shown in the table
no.31
8.1.1.2 Bulk Density122,124
:
An accurately weighed quantity of powder, which was previously passed through sieve #
40 [USP] and carefully poured into graduated cylinder. Then after pouring the powder into the
graduated cylinder the powder bed was made uniform without disturbing. Then the volume was
measured directly from the graduation marks on the cylinder as ml. The volume measure was
called as the bulk volume and the bulk density is calculated by following formula;
Bulk density = Weight of powder / Bulk volume
The results were shown in table no. 31
8.1.1.3 Tapped Density122,124
After measuring the bulk volume the same measuring cylinder was set into tap density
apparatus. The tap density apparatus was set to 300 taps drop per minute and operated for 500
taps. Volume was noted as (Va) and again tapped for 750 times and volume was noted as (Vb).
If the difference between Va and Vb not greater than 2% then Vb is consider as final tapped
volume. The tapped density is calculated by the following formula
Tapped density = Weight of powder / Tapped volume
Results were shown in table no. 31
Chapter 8 Monolayer osmotic drug delivery system
Osmotic Drug Delivery System Page 97
8.1.1.4 Carr’s Index [Compressibility Index] and Hausner’s Ratio
Carr’s index and Hausner’s ratio measure the propensity of powder to be compressed and
the flowability of powder. Carr’s index and Hausner’s ratio can be calculated from the bulk and
tapped density.
Carr’s index = Tapped density - Bulk density X 100
Tapped Density
Hausner’s ratio = Tapped density / Bulk density

Chapter 8 Monolayer osmotic drug delivery system
Osmotic Drug Delivery System Page 98
8.2 Feasibility trial of Coating:
Batch size: 200 tablets Table 25: Trial formulations for Feasibility trial Coating
Sr
no.
Batch Code MT 1 MT 2 MT 3 MT 4
Ingredients Qty
mg/Tab
Qty.
mg/200
Tab
Qty.
mg/Tab
Qty.
mg/200
Tab
Qty.
mg/Tab
Qty.
mg/200
Tab
Qty.
mg/Tab
Qty.
mg/200
Tab
Dry Mix
1 Trimetazidine 60 12000 60 12000 60 12000 60 12000
2 HPMC K4M 100 20000 100 20000 100 20000 100 20000
3 Lactose Mono 150 30000 150 30000 150 30000 150 30000
Binder Solution
4 Povidone K30 25 5000 25 5000 25 5000 25 5000
5 IPA qs 20000 qs 20000 qs 20000 qs 20000
Extra Granular
6 Carbopol 71 G 125 25000 125 25000 125 25000 125 25000
7 Na. Clorde 30 6000 30 6000 30 6000 30 6000
8 Mg Stearate 5 1000 5 1000 5 1000 5 1000
9 Talc 5 1000 5 1000 5 1000 5 1000
Core tab Wt 500 100000 500 100000 500 100000 500 100000
Coating
% wt. Gain 5% 7% 10% 12%
10 Celulose Acetate
(75%) 18.75 3750 26.25 5250 37.5 7500 45 9000
11 Dbutylcebacate
(25%) 6.25 1250 8.75 1750 12.5 2500 15 3000
12 Ethanol (50%) QS 18333 QS 25666 QS 36666 QS 44000
13 Acetone (50%) QS 18333 QS 25666 QS 36666 QS 44000
Coated tab wt. 525 141666 535 158332 550 183332 560 200000

Chapter 8 Monolayer osmotic drug delivery system
Osmotic Drug Delivery System Page 99
Tablet manufacturing process:
a. Dry mixing:
TMZ, HPMC K4M and Lactose mono were dry mixed in the above proportion in a
polybag manually.
b. Binder solution preparation:
Povidone K30 was dissolved in IPA with stirring.
c. Granulation:
Dry mix blend was granulated with prepared binder solution.
d. Drying:
Wet mass was dried at 50 C in oven to get LOD below 2%w/w using Halogen moisture
detector at 105 C temperature.
e. Sizing:
Dried granules were passed through 20# sieve.
f. Extragranular mixing:
Above sized granules were mixed with Carbopol 71G, sodium chloride and talc for 10
minutes at 24 rpm in an octagonal blender.
g. Lubrication:
The above granules were lubricated with 60# passed Magnesium stearate for 5 minutes at
24 rpm in an octagonal blender
h. Compression:
Lubricated granules were compressed using 9.0 mm, round, standard concave punches,
plain on both the sides in rotary compression machine.
i. Preparation of coating solution:
Coating solution was prepared by dissolving Cellulose acetate and dibutyl cebecate
(75:25) in a mixture of ethanol and acetone (50:50) with constant stirring.
j. Coating process:
Core tablets were coated with prepared coating solution using conventional coating pan
machine. The coating parameter s were as follows:
Inlet air temperature : 45 C
Bed temperature : 38 C
Pan rpm : 6 to 8 rpm

Chapter 8 Monolayer osmotic drug delivery system
Osmotic Drug Delivery System Page 100
Atomization Air pressure : 2.0 psi
The average weight of tablet was checked periodically to achieve the desired target
weight gain.
( 5%, 7%, 10% and 12%)
The coated tablets were dried at 50 C for 30 min in conventional coating pan at 1-2 rpm.
k. Drilling of orifice:
One orifice with a diameter of 0.5 mm was drilled on either side of coated tablet using a
microdrill.
The coated tablets were then subjected to in vitro analysis to select the best formulation
for the optimization of HPMC K4M.

Chapter 8 Monolayer osmotic drug delivery system
Osmotic Drug Delivery System Page 101
8.3 Optimization of HPMC K4M for monolayer osmotic tablets:
Batch size: 200 tablets Table 26: Trial formulations for Optimization Of HPMC K4M for monolayer osmotic tablets
Sr.No
Batch No MT5 MT6 MT 3 MT7 MT8
Ingredients Qty.
mg/Tab
Qty
mg/200 tab Qty. mg/Tab
Qty
mg/200tab Qty. mg/Tab
Qty
mg/200 tab
Qty.
mg/Tab
Qty
mg/200 tab
Qty.
mg/Tab
Qty
mg/200 tab
Dry Mix
1 Trimetazidne 60 12000 60 12000 60 12000 60 12000 60 12000
2 HPMC K4M 50 10000 75 15000 100 20000 125 25000 150 30000
3 Lactose Mono 200 40000 175 35000 150 30000 125 25000 100 20000
Binder Solution
4 Povidone K30 25 5000 25 5000 25 5000 25 5000 25 5000
6 Isopropyl
alcohol Qs 20000 Qs 20000 qs 20000 qs 20000 qs 20000
Extra Granular
6 Carbopol 71 G 125 25000 125 25000 125 25000 125 25000 125 25000
7 NaCl 30 6000 30 6000 30 6000 30 6000 30 6000
8 Mg Stearate 5 1000 5 1000 5 1000 5 1000 5 1000
9 Talc 5 1000 5 1000 5 1000 5 1000 5 1000
Core tab Wt 500 120000 500 120000 500 120000 500 120000 500 120000
Coating
% wt. Gain 10% 10% 10% 10% 10%
10 Cellulose
Acetate (75%) 37.5 7500 37.5 7500 37.5 7500 37.5 7500 37.5 7500
11 Dibutylcebacate
(25%) 12.5 2500 12.5 2500 12.5 2500 12.5 2500 12.5 2500
12 Ethanol (50%) QS 36667 QS 36667 QS 36667 QS 36667 QS 36667
13 Acetone (50%) QS 36667 QS 36667 QS 36667 QS 36667 QS 36667
Coated tab wt. 550 203334 550 203334 550 203334 550 203334 550 203334

Chapter 8 Monolayer osmotic drug delivery system
Osmotic Drug Delivery System Page 102
Tablet manufacturing process:
a. Dry mixing:
TMZ, HPMC K4M and Lactose mono were dry mixed in the above proportion in a
polybag manually. The change in quantity of HPMC K4M was compensated with a
change in quantity of lactose mono
b. Binder solution preparation:
Povidone K30 was dissolved in IPA with stirring.
c. Granulation:
Dry mix blend was granulated with prepared binder solution.
d. Drying:
Wet mass was dried at 50 C in oven to get LOD below 2%w/w using Halogen moisture
detector at 105 C temperature.
e. Sizing:
Dried granules were passed through 20# sieve.
f. Extragranular mixing:
Above sized granules were mixed with Carbopol 71G, sodium chloride and talc for 10
minutes at 24 rpm in an octagonal blender.
g. Lubrication:
The above granules were lubricated with 60# passed Magnesium stearate for 5 minutes at
24 rpm in an octagonal blender
h. Compression:
Lubricated granules were compressed using 9.0 mm, round, standard concave punches,
plain on both the sides in rotary compression machine.
i. Preparation of coating solution:
Coating solution was prepared by dissolving Cellulose acetate and dibutyl cebecate
(75:25) in a mixture of ethanol and acetone (50:50) with constant stirring.
j. Coating process:
Core tablets were coated with prepared coating solution using conventional coating pan
machine. The coating parameters were as follows:
Inlet air temperature : 45 C

Chapter 8 Monolayer osmotic drug delivery system
Osmotic Drug Delivery System Page 103
Bed temperature : 38 C
Pan rpm : 6 to 8 rpm
Atomization Air pressure : 2.0 psi
The average weight of tablet was checked periodically to achieve 10% weight gain of
core tablet.
The coated tablets were dried at 50 C for 30 min in conventional coating pan at 1-2 rpm.
k. Drilling of orifice:
One orifice with a diameter of 0.5 mm was drilled on either side of coated tablet using a
microdrill.
The prepared tablets were then subjected to in vitro analysis to select the best formulation
for the optimization of Carbopol 71 G.

Chapter 8 Monolayer osmotic drug delivery system
Osmotic Drug Delivery System Page 104
8.4 Optimization of Carbopol 71G for monolayer osmotic tablets:
Batch size: 200 tablets Table 27: Trial formulations for Optimization Of Carbopol 71G for monolayer osmotic tablets
Sr.No Batch No MT9 MT10 MT11 MT6 MT12
Ingredients
Qty.
mg/Tab
Qty
mg/200 tab
Qty.
mg/Tab
Qty
mg/200 tab
Qty.
mg/Tab
Qty
mg/200 tab
Qty.
mg/Tab
Qty
mg/200 tab
Qty.
mg/Tab
Qty
mg/200 tab
Dry Mix
1 Trimetazidne 60 12000 60 12000 60 12000 60 12000 60 12000
2 HPMC K4M 75 15000 75 15000 75 15000 75 15000 75 15000
3 Lactose Mono 250 50000 225 45000 200 40000 175 35000 150 30000
Binder Solution
4 Povidone K30 25 5000 25 5000 25 5000 25 5000 25 5000
5 IPA (90%) qs 20000 Qs 20000 qs 20000 qs 20000 Qs 20000
Extra Granular
6 Carbopol 71 G 50 10000 75 15000 100 20000 125 25000 150 30000
7 NaCl 30 6000 30 6000 30 6000 30 6000 30 6000
8 Mg Stearate 5 1000 5 1000 5 1000 5 1000 5 1000
9 Talc 5 1000 5 1000 5 1000 5 1000 5 1000
Core tab Wt 500 120000 500 120000 500 120000 500 120000 500 120000
Coating
% wt. Gain 10% 10% 10% 10% 10%
10 Cellulose Acetate (75%) 37.5 7500 37.5 7500 37.5 7500 37.5 7500 37.5 7500
11 Dibutylcebacate (25%) 12.5 2500 12.5 2500 12.5 2500 12.5 2500 12.5 2500
12 Ethanol (50%) QS 36667 QS 36667 QS 36667 QS 36667 QS 36667
13 Acetone (50%) QS 36667 QS 36667 QS 36667 QS 36667 QS 36667
Coated tab wt. 550 203334 550 203334 550 203334 550 203334 550 203334
Chapter 8 Monolayer osmotic drug delivery system
Osmotic Drug Delivery System Page 105
Tablet manufacturing process:
a. Dry mixing:
TMZ, HPMC K4M and Lactose mono were dry mixed in the above proportion in a
polybag manually. The change in quantity of Carbopol 71G was compensated with a
change in quantity of lactose mono.
b. Binder solution preparation:
Povidone K30 was dissolved in IPA with stirring.
c. Granulation:
Dry mix blend was granulated with prepared binder solution.
d. Drying:
Wet mass was dried at 50 C in oven to get LOD below 2%w/w using Halogen moisture
detector at 105 C temperature.
e. Sizing:
Dried granules were passed through 20# sieve.
f. Extragranular mixing:
Above sized granules were mixed with Carbopol 71G (varying proportion), sodium
chloride and talc for 10 minutes at 24 rpm in an octagonal blender.
g. Lubrication:
The above granules were lubricated with 60# passed Magnesium stearate for 5 minutes at
24 rpm in an octagonal blender
h. Compression:
Lubricated granules were compressed using 9.0 mm, round, standard concave punches,
plain on both the sides in rotary compression machine.
i. Preparation of coating solution:
Coating solution was prepared by dissolving Cellulose acetate and dibutyl cebecate
(75:25) in a mixture of ethanol and acetone (50:50) with constant stirring.
j. Coating process:
Core tablets were coated with prepared coating solution using conventional coating pan
machine. The coating parameters were as follows:
Inlet air temperature : 45 C

Chapter 8 Monolayer osmotic drug delivery system
Osmotic Drug Delivery System Page 106
Bed temperature : 38 C
Pan rpm : 6 to 8 rpm
Atomization Air pressure : 2.0 psi
The average weight of tablet was checked periodically to achieve 10% weight gain of core
tablet.
The coated tablets were dried at 50 C for 30 min in conventional coating pan at 1-2 rpm.
k. Drilling of orifice:
One orifice with a diameter of 0.5 mm was drilled on either side of coated tablet using a
microdrill.
The prepared tablets were subjected to in vitro evaluation to select the best formulation for
optimization of Osmogen (Sodium chloride and Mannitol)

Chapter 8 Monolayer osmotic drug delivery system
Osmotic Drug Delivery System Page 107
8.5 Optimization of Osmogens (Sodium chloride and mannitol) for monolayer osmotic tablets:
Batch size: 200 tablets Table 28: Optimization of osmogen (Sodium chloride and mannitol) for monolayer osmotic tablets:
Sr.
No
Batch No MT11 MT13 MT14 MT15 MT16 MT17 MT18
Ingredients
Qty.
mg/Tab
Qty
mg/200
tab
Qty.
mg/Tab
Qty
mg/200
tab
Qty.
mg/Tab
Qty
mg/200
tab
Qty.
mg/Tab
Qty
mg/200
tab
Qty.
mg/Tab
Qty
mg/200
tab
Qty.
mg/Tab
Qty
mg/200
tab
Qty.
mg/Tab
Qty
mg/200
tab
Dry mix
1 Trimetazidine 60 12000 60 12000 60 12000 60 12000 60 12000 60 12000 60 12000
2 HPMC K4M 75 15000 75 15000 75 15000 75 15000 75 15000 75 15000 75 15000
3 Lactose Mono 200 40000 210 42000 190 38000 200 40000 190 38000 180 36000 200 40000
Binder Solution
4 Povidone K30 25 5000 25 5000 25 5000 25 5000 25 5000 25 5000 25 5000
5 IPA (90%) Qs 20000 qs 20000 qs 20000 qs 20000 qs 20000 qs 20000 qs 20000
Extra Granular
7 Carbopol 71 G 100 20000 100 20000 100 20000 100 20000 100 20000 100 20000 100 20000
8 NaCl 30 6000 20 4000 40 8000 0 0 0 0 0 0 15 3000
9 Mannitol 0 0 0 0 0 0 30 6000 40 8000 50 10000 15 3000
10 Mg Stearate 5 1000 5 1000 5 1000 5 1000 5 1000 5 1000 5 1000
11 Talc 5 1000 5 1000 5 1000 5 1000 5 1000 5 1000 5 1000
Core tab Wt 500 120000 500 120000 500 120000 500 120000 500 120000 500 120000 500 120000
Coating
% wt. Gain 10% 10% 10% 10% 10% 10% 10%
12 CelluloseAcetate(75%) 37.5 7500 37.5 7500 37.5 7500 37.5 7500 37.5 7500 37.5 7500 37.5 7500
13 Dibutylcebacate (25%) 12.5 2500 12.5 2500 12.5 2500 12.5 2500 12.5 2500 12.5 2500 12.5 2500
14 Ethanol (50%) QS 36667 QS 36667 QS 36667 QS 36667 QS 36667 QS 36667 QS 36667
15 Acetone (50%) QS 36667 QS 36667 QS 36667 QS 36667 QS 36667 QS 36667 QS 36667
Coated tab wt. 550 203334 550 203334 550 203334 550 203334 550 203334 550 203334 550 203334

Chapter 8 Monolayer osmotic drug delivery system
Osmotic Drug Delivery System Page 108
Tablet manufacturing process:
a. Dry mixing:
TMZ, HPMC K4M and Lactose mono were dry mixed in the above proportion in a
polybag manually. The change in quantity of Mannitol/Sodium chloride was
compensated with a change in quantity of lactose mono.
b. Binder solution preparation:
Povidone K30 was dissolved in IPA with stirring.
c. Granulation:
Dry mix blend was granulated with prepared binder solution.
d. Drying:
Wet mass was dried at 50 C in oven to get LOD below 2%w/w using Halogen moisture
detector at 105 C temperature.
e. Sizing:
Dried granules were passed through 20# sieve.
f. Extragranular mixing:
Above sized granules were mixed with Carbopol 71G , mannitol/sodium chloride (in
varying proportions as per above table) and talc for 10 minutes at 24 rpm in an octagonal
blender.
g. Lubrication:
The above granules were lubricated with 60# passed Magnesium stearate for 5 minutes at
24 rpm in an octagonal blender
h. Compression:
Lubricated granules were compressed using 9.0 mm, round, standard concave punches,
plain on both the sides in rotary compression machine.
i. Preparation of coating solution:
Coating solution was prepared by dissolving Cellulose acetate and dibutyl cebecate
(75:25) in a mixture of ethanol and acetone (50:50) with constant stirring.
j. Coating process:
Core tablets were coated with prepared coating solution using conventional coating pan
machine. The coating parameters were as follows:

Chapter 8 Monolayer osmotic drug delivery system
Osmotic Drug Delivery System Page 109
Inlet air temperature : 45 C
Bed temperature : 38 C
Pan rpm : 6 to 8 rpm
Atomization Air pressure : 2.0 psi
The average weight of tablet was checked periodically to achieve 10% weight gain of
core tablet.
The coated tablets were dried at 50 C for 30 min in conventional coating pan at 1-2 rpm.
k. Drilling of orifice:
One orifice with a diameter of 0.5 mm was drilled on either side of coated tablet using a
microdrill.
The prepared tablets were subjected to in vitro evaluation to select the best formulation
for optimization of Coating composition.

Chapter 8 Monolayer osmotic drug delivery system
Osmotic Drug Delivery System Page 110
8.6 Optimization of Coating composition for monolayer osmotic tablets:
Table 29: Optimization of Coating composition for monolayer osmotic tablets
Batch size: 200 tablets
Sr.No
Batch No MT11 MT19 MT20
Ingredients Qty.
mg/Tab
Qty
mg/200
tab
Qty.
mg/Tab
Qty
mg/200
tab
Qty.
mg/Tab
Qty
mg/200
tab
Dry mix
1 Trimetazidine 60 12000 60 12000 60 12000
2 HPMC K4M 75 15000 75 15000 75 15000
3 Lactose Mono 200 40000 200 40000 200 40000
Binder Solution
4 Povidone K30 25 5000 25 5000 25 5000
5 IPA (90%) qs 20000 qs 20000 qs 20000
Extra Granular
6 Carbopol 71 G 100 20000 100 20000 100 20000
7 NaCl 30 6000 30 6000 30 6000
8 Mg Stearate 5 1000 5 1000 5 1000
9 Talc 5 1000 5 1000 5 1000
Core tab Wt 500 120000 500 120000 500 120000
Coating
% wt. Gain 10% 10% 10%
10 CelluloseAcetate 37.5(75%) 7500 35 (70%) 7000 40 (80%) 8000
11 Dibutylcebacate 12.5(25%) 2500 15 (30%) 3000 10 (20%) 2000
12 Ethanol (50%) QS 36667 QS 36667 QS 36667
13 Acetone (50%) QS 36667 QS 36667 QS 36667
Coated tab wt. 550 203334 550 203334 550 203334
Tablet manufacturing process:
a. Dry mixing:
TMZ, HPMC K4M and Lactose mono were dry mixed in the above proportion in a
polybag manually.
b. Binder solution preparation:
Povidone K30 was dissolved in IPA with stirring.

Chapter 8 Monolayer osmotic drug delivery system
Osmotic Drug Delivery System Page 111
c. Granulation:
Dry mix blend was granulated with prepared binder solution.
d. Drying:
Wet mass was dried at 50 C in oven to get LOD below 2%w/w using Halogen moisture
detector at 105 C temperature.
e. Sizing:
Dried granules were passed through 20# sieve.
f. Extragranular mixing:
Above sized granules were mixed with Carbopol 71G,sodium chloride and talc for 10
minutes at 24 rpm in an octagonal blender.
g. Lubrication:
The above granules were lubricated with 60# passed Magnesium stearate for 5 minutes at
24 rpm in an octagonal blender
h. Compression:
Lubricated granules were compressed using 9.0 mm, round, standard concave punches,
plain on both the sides in rotary compression machine.
i. Preparation of coating solution:
Coating solution was prepared by dissolving Cellulose acetate and dibutyl cebecate
(75:25, 70:30 and 80:20) in a mixture of ethanol and acetone (50:50) with constant
stirring.
j. Coating process:
Core tablets were coated with prepared coating solution using conventional coating pan
machine. The coating parameters were as follows:
Inlet air temperature : 45 C
Bed temperature : 38 C
Pan rpm : 6 to 8 rpm
Atomization Air pressure : 2.0 psi
The average weight of tablet was checked periodically to achieve 10% weight gain of
core tablet.
The coated tablets were dried at 50 C for 30 min in conventional coating pan at 1-2 rpm.
Chapter 8 Monolayer osmotic drug delivery system
Osmotic Drug Delivery System Page 112
k. Drilling of orifice:
One orifice with a diameter of 0.5 mm was drilled on either side of coated tablet using a
microdrill.
The prepared tablets were subjected to in vitro evaluation to select the best formulation
for optimization of Coating composition
The optimized formulation was then subjected to stability study as per ICH guidelines for
stability study.
8.7 Compression and coating parameters:
8.7.1 Weight variation:
To find out weight variation, 20 tablets of each type of formulation were weighed
individually using an electronic balance, average weight was calculated and individual
tablet weight was then compared with average value to find the deviation in weight from
average weight.
The specifications for tablets to pass the weight variation test as per Pharmacopoeia of
India are mentioned in Table 30. Not more than 2 of the individual masses deviate from the
average mass by more than the percentage deviation shown in Table 30 and none deviates
by more than twice the percentage.
Table 30: Specifications for weight variation in tablets as per Pharmacopoeia of India.
Sr no. Average Weight of tablet % allowable
deviation
1 80 mg or less 10
2 More than 80 mg but less than 250
mg 7.5
3 250 mg or more 5
8.7.2 Hardness:
For each type of formulation the hardness values for 10 tablets were determined
Chapter 8 Monolayer osmotic drug delivery system
Osmotic Drug Delivery System Page 113
using Monsanto hardness tester. The tablet was held along its oblong axis in between the
two jaws of the tester. At this point, reading should be 0 kg/cm2. Then constant force
was applied by rotating the knob until the tablet fractured. The value at this point was
noted in kg/cm2
8.7.3 Thickness:
The thickness of the tablets was determined using a Digital Vernier Calliper (Mitutoyo CD-
6"CS). Five tablets from each type of formulation were used and average values were
calculated.
8.7.4 Friability:
For each type of formulation the friability was determined as follows-
Twenty tablets were weighed accurately and placed in Roche friabilator. The
speed of rotation of Roche friabilator was kept 25 rpm. The drum was rotated 100 times.
The tablets were removed and then weighed. The percent friability was determined
using following formula:
% friability = initial weight - final weight x 100
Initial weight
According to Indian Pharmacopoeia, friability of the prepared tablets should not exceed
1%w/w
8.7.5 Orifice diameter size:
The orifice diameter of 10 intact tablets was measured using a Digital Vernier Calliper
(Mitutoyo CD-6"CS) and the average value was reported.
8.8 In vitro dissolution study:
All the feasibility trial batches were subjected to In vitro dissolution study for drug release and to
study the effect of variables. The operating conditions for drug release were adjusted as follows.
Dissolution test apparatus : USP type II (paddle)
Speed : 50 RPM

Chapter 8 Monolayer osmotic drug delivery system
Osmotic Drug Delivery System Page 114
Temperature : 37° C ± 0.5 ° C
Dissolution medium : 900 ml distilled water
Sampling time : every 1 hr
Sample withdrawn : 10 ml
Method of analysis : UV spectrophotometer
UV maxima : 270 nm
Samples were suitably diluted and absorbance was measured. Cumulative percentage drug
released was calculated for each batch. The study was performed in triplicate and the average
was reported.
8.9 Statistical treatment:
The data of % cumulative release from each trial batch were subjected to kinetic release studies
to assess the fit into the zero-order release kinetics. The r2 value was found out to determine the
best fit zero order release kinetics. The trial batch having the nearest value to 1 was selected as
the best trial formulation. Also the difference factor (f1) and similarity factor (f2) for each batch
was found out by comparing it with the theoretical target release profile using the following
equations:
where Rt and Tt are the cumulative percentage dissolved at each of the selected n time points of
the reference and test product respectively. The factor f1 is proportional to the average difference
between the two profiles, where as factor f2 is inversely proportional to the average squared
difference between the two profiles, with emphasis on the larger difference among all the time-
points. The factor f2 measures the closeness between the two profiles.
Values of f1 (<15) and f2 (>50) indicate, that the curves can be considered similar.
Chapter 8 Monolayer osmotic drug delivery system
Osmotic Drug Delivery System Page 115
8.10 Effect of variables on release profiles of optimized formulations for monolayer osmotic
tablets:
The optimized formulation was then subjected to various comparative tests under
different conditions to study the following effects of variables:
a. Effect of Osmotically active Dissolution Medium on drug release
b. Effect of Agitation rate on drug release
c. Effect of orifice size on the drug release from optimized formulations
8.11 Stability study:
The optimized formulation was subject to accelerated stability study at various
temperature and humidity conditions as per the criterion mentioned in the ICH guidelines for
stability study, to see whether the final product is sufficiently rugged for marketing worldwide
under various climated conditions including tropical, subtropical and temperate.
.

Chapter 8 Monolayer osmotic drug delivery system
Osmotic Drug Delivery System Page 116
8.12 Results and discussion for Monolayer osmotic Tablets of Trimetazidine
dihydrochloride
8.12.1 Characterization of lubricated granules:
The result obtained from the granulometry study is shown in the table below:
Table 31: Granulometry study result of the feasibility core trial:
Batch No CT1 CT2 CT3 CT4 CT5 CT6 CT7
Bulk Density (gm/ml) 0.452 0.442 0.472 0.449 0.452 0.482 0.462
Tapped Density
(gm/ml) 0.621 0.593 0.593 0.592 0.572 0.591 0.582
Carr’s Index 27.214 25.464 20.405 24.155 20.979 18.443 20.619
Hausner Ration 1.374 1.342 1.256 1.318 1.265 1.226 1.260
Angle of Repose 48 47 38 44 42 38 43
LOD % w/w (at 105ºC) 1.92 1.82 1.69 1.57 1.68 1.29 1.63
Sieve analysis
% Retained on 20# 12 8 6.5 4 8 5.2 6
% Retained on 40# 30 18 19 22 26 25 23
% Retained on 60# 22 27 25 26 27 30 29
% Retained on 80# 10 29 17 18 15 22 21
% Retained on 100# 5 12 19 15 12 10 18
% Passed through 100# 21 6 13.5 15 12 7.8 3
100 100 100 100 100 100 100
From the above trial it is evident that trial CT6 having an angle of repose of 380,
Hausner’s ratio of 1.226 and Carr’s index of 18.443, shows the best flow and compressibility
properties among all the trial granule batches. Hence the trial batch CT6 was selected as the
optimized batch for preparation of compressed tablets.

Chapter 8 Monolayer osmotic drug delivery system
Osmotic Drug Delivery System Page 117
8.12.2 Compression and coating parameters (for core and coated tablets)
Table 32: Compression and coating parameters (for core and coated tablets) for monolayer osmotic tablets trial formulations:
Batch
No
Core Tablets Parameter Coated Tablets Parameter
Avg wt
(mg)
Hardness
kg/cm2
Thickness
(mm)
Friability
(%)
Weight
Variation
Avg wt
(mg)
Thickness
(mm)
Weight
Variation
Initial Wt.
(mg)
Final wt.
(mg)
% wt.
gain
Orifice diameter
(mm)
CT1 502 6.5 5.8 0.18 Complies -- -- -- -- -- -- --
CT2 503 6.8 5.82 0.201 Complies -- -- -- -- -- -- --
CT3 501 7.8 5.91 0.208 Complies -- -- -- -- -- -- --
CT4 503 4.8 5.82 0.128 Complies -- -- -- -- -- -- --
CT5 504 6.2 5.91 0.125 Complies -- -- -- -- -- -- --
CT6 502 8.1 5.95 0.201 Complies -- -- -- -- -- -- --
CT7 501 8.9 5.92 0.305 Complies -- -- -- -- -- -- --
MT1 504 6.9 5.96 0.218 Complies 524 6.01 Complies 504 524 3.97 0.52
MT2 500 7.1 5.89 0.258 Complies 536 6.02 Complies 500 536 7.20 0.51
MT3 500 8.1 5.86 0.256 Complies 551 6.09 Complies 500 551 10.20 0.53
MT4 502 7.8 5.92 0.247 Complies 559 6.09 Complies 502 559 11.35 0.51
MT5 503 7.6 5.91 0.289 Complies 551 6.1 Complies 503 551 9.54 0.54
MT6 502 7.5 5.96 0.242 Complies 550 6.08 Complies 502 550 9.56 0.56
MT7 502 7.6 5.99 0.282 Complies 549 6.05 Complies 502 549 9.36 0.52
MT8 502 7.6 5.98 0.212 Complies 548 6.1 Complies 502 548 9.16 0.54
MT9 503 7.9 5.94 0.231 Complies 550 6.11 Complies 503 550 9.34 0.52
MT10 504 7.8 5.92 0.172 Complies 549 6.06 Complies 504 549 8.93 0.5
MT11 504 8.1 5.89 0.156 Complies 550 6.04 Complies 504 550 9.13 0.52
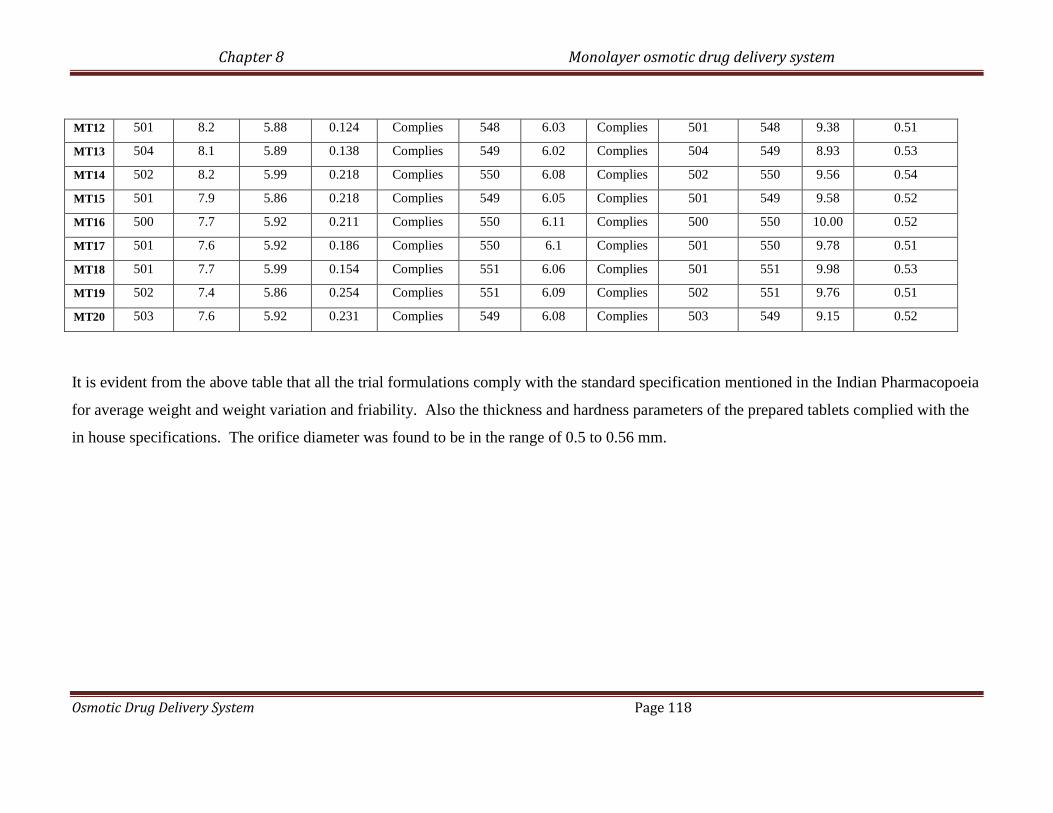
Chapter 8 Monolayer osmotic drug delivery system
Osmotic Drug Delivery System Page 118
MT12 501 8.2 5.88 0.124 Complies 548 6.03 Complies 501 548 9.38 0.51
MT13 504 8.1 5.89 0.138 Complies 549 6.02 Complies 504 549 8.93 0.53
MT14 502 8.2 5.99 0.218 Complies 550 6.08 Complies 502 550 9.56 0.54
MT15 501 7.9 5.86 0.218 Complies 549 6.05 Complies 501 549 9.58 0.52
MT16 500 7.7 5.92 0.211 Complies 550 6.11 Complies 500 550 10.00 0.52
MT17 501 7.6 5.92 0.186 Complies 550 6.1 Complies 501 550 9.78 0.51
MT18 501 7.7 5.99 0.154 Complies 551 6.06 Complies 501 551 9.98 0.53
MT19 502 7.4 5.86 0.254 Complies 551 6.09 Complies 502 551 9.76 0.51
MT20 503 7.6 5.92 0.231 Complies 549 6.08 Complies 503 549 9.15 0.52
It is evident from the above table that all the trial formulations comply with the standard specification mentioned in the Indian Pharmacopoeia
for average weight and weight variation and friability. Also the thickness and hardness parameters of the prepared tablets complied with the
in house specifications. The orifice diameter was found to be in the range of 0.5 to 0.56 mm.

Chapter 8 Monolayer osmotic drug delivery system
Osmotic Drug Delivery System Page 119
8.12.3 In vitro dissolution study:
The dissolution profile results for the various formulation trials are as follows:
8.12.3.1 Coating feasibility trial:
Table 33: % cumulative release data for coating feasibility trial for monolayer osmotic tablets
(Average reported for 3 readings)
% cumulative release
Time
(hr) MT 1 MT 2 MT 3 MT 4
0 0 0 0 0
1 9.3 5.1 2.1 0
2 15.2 10.2 5.2 3.2
4 35.1 24.3 17.4 12.2
6 63.5 48.2 28.2 24.1
8 80.3 72.5 34.4 30.6
12 94.5 88.6 47.3 80.5
18 98.2 97.2 74.1 75.2
24 99.2 99.3 95.2 89.7

Chapter 8 Monolayer osmotic drug delivery system
Osmotic Drug Delivery System Page 120
Figure 23: % cumulative release v/s Time (hr) plot for coating feasibility trial for monolayer
osmotic tablets
Table 34: Statistical parameters for dissolution data of coating feasibility trial for monolayer osmotic tablets
Parameters MT 1 MT 2 MT 3 MT 4
f1 (Difference Factor) 81.50 63.17 14.37 22.10
f2 (Similarity factor) 24.00 28.79 61.82 49.71
Zero order kinetic
(r2 value)
0.783 0.848 0.992 0.9587
From the above results of % cumulative release and zero order kinetic (r2 value), it was seen that
batch MT3 and MT4 showed good zero order release kinetics. Batch MT3 showed a cumulative
release of 95%, which was comparatively higher than the % cumulative release of MT4 after 24
hours. Also analyzing the f1(<15) and f2(>50) values, it was seen that batch MT3 showed a
release profile which could be considered similar to the theoretical target profile. Hence batch
T3 was further optimized for HPMC K4M concentration.
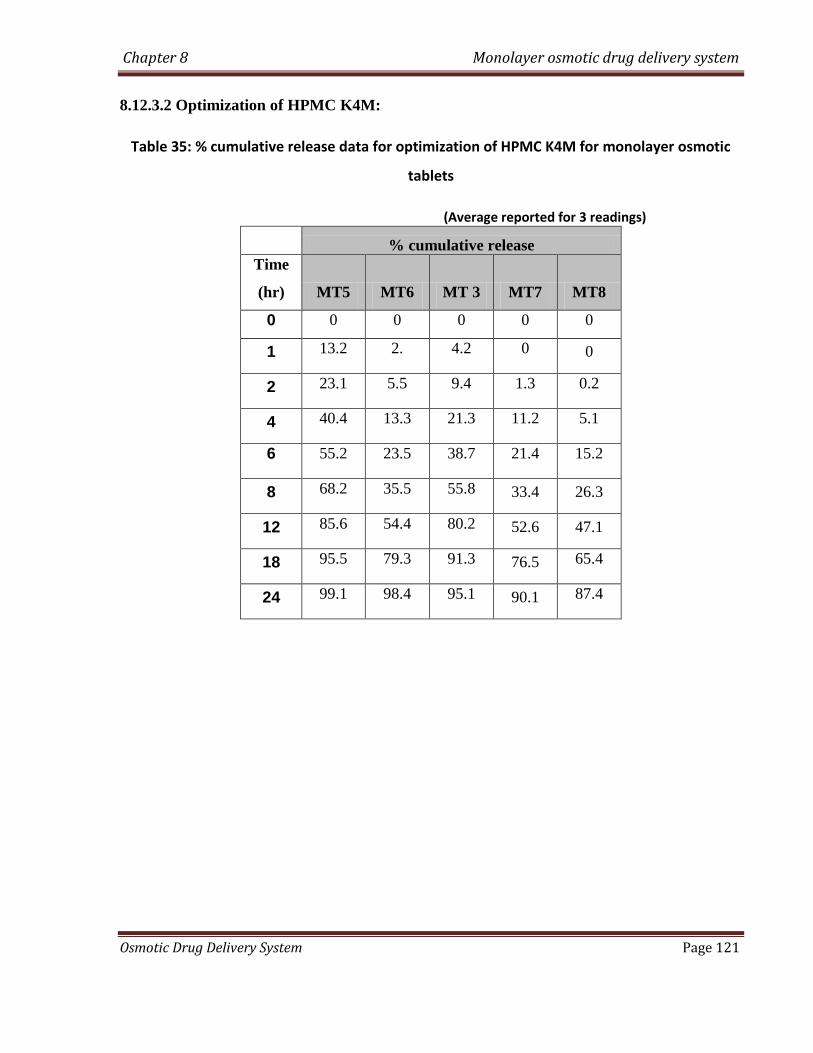
Chapter 8 Monolayer osmotic drug delivery system
Osmotic Drug Delivery System Page 121
8.12.3.2 Optimization of HPMC K4M:
Table 35: % cumulative release data for optimization of HPMC K4M for monolayer osmotic
tablets
(Average reported for 3 readings)
% cumulative release
Time
(hr) MT5 MT6 MT 3 MT7 MT8
0 0 0 0 0 0
1 13.2 2. 4.2 0 0
2 23.1 5.5 9.4 1.3 0.2
4 40.4 13.3 21.3 11.2 5.1
6 55.2 23.5 38.7 21.4 15.2
8 68.2 35.5 55.8 33.4 26.3
12 85.6 54.4 80.2 52.6 47.1
18 95.5 79.3 91.3 76.5 65.4
24 99.1 98.4 95.1 90.1 87.4

Chapter 8 Monolayer osmotic drug delivery system
Osmotic Drug Delivery System Page 122
Figure 24: % cumulative release v/s Time (hr) plot for optimization of HPMC K4M for monolayer osmotic tablets
Table 36: Statistical parameters for dissolution data of optimization of HPMC K4M for monolayer osmotic tablets
Parameter MT5 MT6 MT 3 MT7 MT8
f1 (Difference Factor) 76.00 62.61 47.74 11.44 11.29
f2 (Similarity factor) 26.87 14.74 35.81 63.33 58.86
Zero order kinetic
(r2 value)
0.8568 0.994 0.9057 0.9857 0.9872
From the above results of % cumulative release and zero order kinetic (r2 value), it is
seen that batch MT6, MT7 and MT8 showed good zero order release. But it can be seen from
the % cumulative release profile that the tablets of batch MT7 and MT8 did not achieve 100%
release after 24 hours. Batch MT6 showed a cumulative release of 99% after 24 hours. Also
analyzing the f1 and f2 value of batch MT6, it was concluded that the formulation MT6 showed
similar release profile to the theoretical target release profile. Hence batch MT6 was further
optimized for Carbopol 71G concentrations.

Chapter 8 Monolayer osmotic drug delivery system
Osmotic Drug Delivery System Page 123
8.12.3.3 Optimization of Carbopol 71G:
Table 37: % cumulative release data for optimization of Carbopol 71G for monolayer osmotic tablets
(Average reported for 3 readings)
% Cumulative release
Time
(hr) MT9 MT10 MT11 MT6 MT12
0 0 0 0 0 0
1 17.2 10.4 1.5 5.2 0
2 29.3 18.3 4.5 12.1 0
4 46.4 40.5 14.5 25.3 2.1
6 60.4 52.1 19.2 39.3 14.1
8 75.6 65.2 34.1 52.2 24.4
12 93.1 85.6 53.5 71.3 43.2
18 98.2 99.4 85.3 89.4 65.4
24 99.3 98.2 99.1 99.1 81.1
Figure 25: % cumulative release v/s Time (hr) plot for optimization of Carbopol 71G for monolayer osmotic tablets

Chapter 8 Monolayer osmotic drug delivery system
Osmotic Drug Delivery System Page 124
Table 38: Statistical parameters for dissolution data of optimization of Carbopol 71G for monolayer osmotic tablets
Parameter MT9 MT10 MT11 MT6 MT12
f1 (Difference Factor) 90.25 72.65 14.88 44.43 16.06
f2 (Similarity factor) 23.23 27.76 59.64 38.12 51.73
Zero order kinetic
(r2 value)
0.803 0.8633 0.9882 0.9488 0.9822
From the above results of % cumulative release and zero order kinetic (r2 value), it is seen that
batch MT11 and MT12 showed good zero order release. But it can be seen from the %
cumulative release profile that the tablets of batch T12 did not achieve 100% release after 24
hours. Batch T11 showed a cumulative release of 99% after 24 hours. Also analyzing the f1 and
f2 value of trial formulation MT11, a similarity could be established between it and the
theoretical target profile. Hence batch T11 was further optimized for osmogen concentration.
8.12.3.4 Optimization of osmogen:
Table 39 : % cumulative release data for optimization of Osmogen for monolayer osmotic tablets
(Average reported for 3 readings)
% Cumulative release
Time
(hr) MT11 MT13 MT14 MT15 MT16 MT17 MT18
0 0 0 0 0 0 0 0
1 1.5 0 6.1 0 7.1 11.2 3.3
2 4.5 2.1 13.4 0 14.3 17.4 7.4
4 14.5 15.3 25.2 12.2 27.2 32.3 19.2
6 19.2 29.4 37.3 24.2 38.1 43.2 33.4
8 34.1 40.3 48.4 38.3 46.8 52.4 45.5
12 53.5 60.5 67.1 60.2 65.6 71.5 64.3
18 85.3 80.4 87.3 84.4 84.2 89. 85.2
24 99.1 90.1 99.3 95.4 96.1 99.8 99.7

Chapter 8 Monolayer osmotic drug delivery system
Osmotic Drug Delivery System Page 125
Figure 26: % cumulative release v/s Time (hr) plot for optimization of osmogen for monolayer osmotic tablets
0
20
40
60
80
100
120
0 2 4 6 8 10 12 14 16 18 20 22 24Time (hr)
% c
um
ula
tiv
e r
ele
as
e
T11
T13
T14
T15
T16
T17
T18
Table 39 (a) : Statistical parameters for dissolution data of optimization of osmogen
Parameter MT11 MT13 MT14 MT15 MT16 MT17 MT18
f1 (Difference Factor) 14.88 23.17 40.76 18.40 41.13 52.13 30.87
f2 (Similarity factor) 59.64 50.20 40.52 51.44 40.96 33.90 45.68
Zero order kinetic
(r2 value)
0.9882 0.9644 0.9659 0.973 0.9643 0.9492 0.9574
From the above results of % cumulative release and zero order kinetic (r2 value), it is seen that
batch MT11 and MT16 showed good zero order release as compared to the other trial batches.
But it can be seen from the % cumulative release profile that the tablets of batch T16 achieved a
96% release after 24 hours. Batch T11 showed a cumulative release of 99% after 24 hours. Also
analyzing the f1 and f2 value of trial formulation MT11, a similarity could be established
between it and the theoretical target profile Hence batch T11 was further optimized for coating
concentration.

Chapter 8 Monolayer osmotic drug delivery system
Osmotic Drug Delivery System Page 126
8.12.3.5 Optimization of coating:
Table 40: % cumulative release data for optimization of Coating for monolayer osmotic tablets
(Average reported for 3 readings)
% cumulative release
Time
(hr) MT11 MT19 MT20
0 0 2.2 0
1 1.5 9.3 2.2
2 4.5 16.4 6.6
4 14.5 30.1 14.5
6 19.2 44.3 23.4
8 34.1 57.5 34.3
12 53.5 76.3 55.2
18 85.3 95.4 80.4
24 99.1 99.4 100
Figure 27 : % cumulative release v/s Time (hr) plot for optimization of osmogen for monolayer osmotic tablets
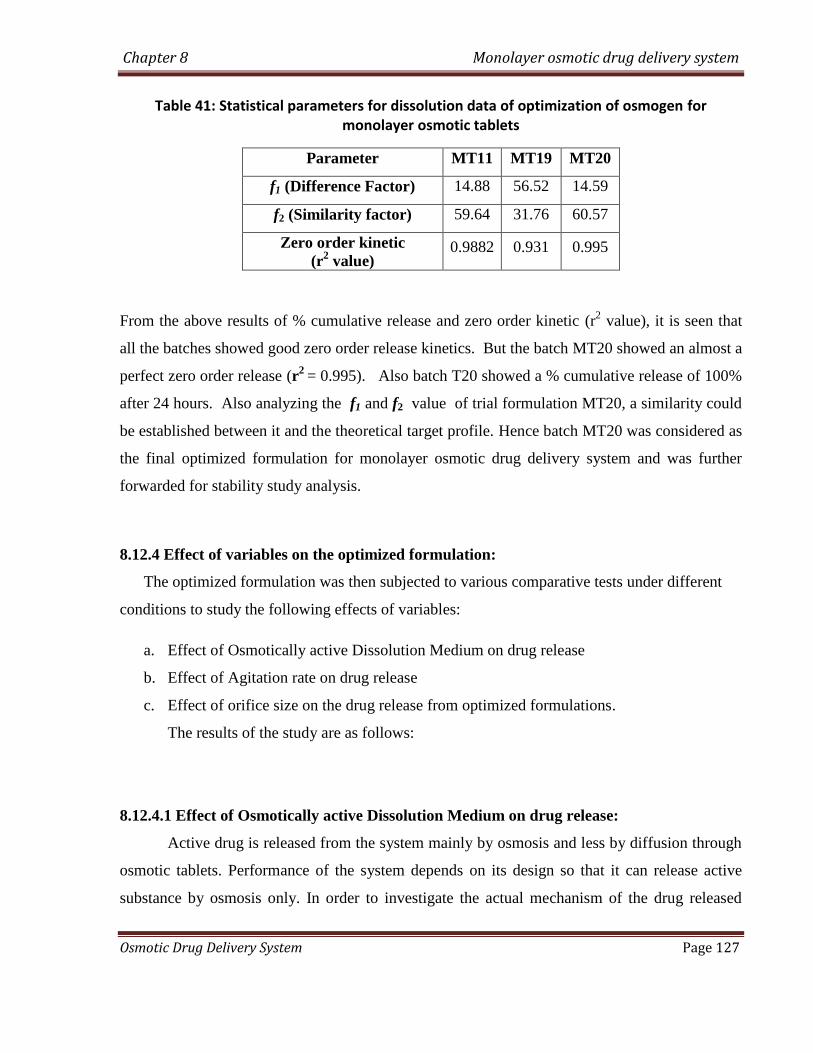
Chapter 8 Monolayer osmotic drug delivery system
Osmotic Drug Delivery System Page 127
Table 41: Statistical parameters for dissolution data of optimization of osmogen for monolayer osmotic tablets
Parameter MT11 MT19 MT20
f1 (Difference Factor) 14.88 56.52 14.59
f2 (Similarity factor) 59.64 31.76 60.57
Zero order kinetic
(r2 value)
0.9882 0.931 0.995
From the above results of % cumulative release and zero order kinetic (r2 value), it is seen that
all the batches showed good zero order release kinetics. But the batch MT20 showed an almost a
perfect zero order release (r2
= 0.995). Also batch T20 showed a % cumulative release of 100%
after 24 hours. Also analyzing the f1 and f2 value of trial formulation MT20, a similarity could
be established between it and the theoretical target profile. Hence batch MT20 was considered as
the final optimized formulation for monolayer osmotic drug delivery system and was further
forwarded for stability study analysis.
8.12.4 Effect of variables on the optimized formulation:
The optimized formulation was then subjected to various comparative tests under different
conditions to study the following effects of variables:
a. Effect of Osmotically active Dissolution Medium on drug release
b. Effect of Agitation rate on drug release
c. Effect of orifice size on the drug release from optimized formulations.
The results of the study are as follows:
8.12.4.1 Effect of Osmotically active Dissolution Medium on drug release:
Active drug is released from the system mainly by osmosis and less by diffusion through
osmotic tablets. Performance of the system depends on its design so that it can release active
substance by osmosis only. In order to investigate the actual mechanism of the drug released

Chapter 8 Monolayer osmotic drug delivery system
Osmotic Drug Delivery System Page 128
from the tablet, dissolution study was conducted in water (0-8 h), 2.4 % w/w magnesium
sulphate solution in water (8-16 hr) and in water (17-24 hr) alternatively. Table shows
dissolution profile for the optimized formulation (MT20) in water (upto 8th hour), then
magnesium sulphate (upto 16th hour) and lastly followed by water (upto 24th hour).
Table 42: cumulative % drug release of the selected optimized formulation (MT20) in
different dissolution medium
Time
(hr)
Dissolution
media
cumulative % drug
release for optimized
batch (MT20)
0
water
0
1 2.2
2 6.6
4 14.5
6 23.4
8 34.3
8
2.4% magnesium
sulphate solution
34.3
12 40.1
16 44.8
16
water
44.8
20 59.8
24 72.4
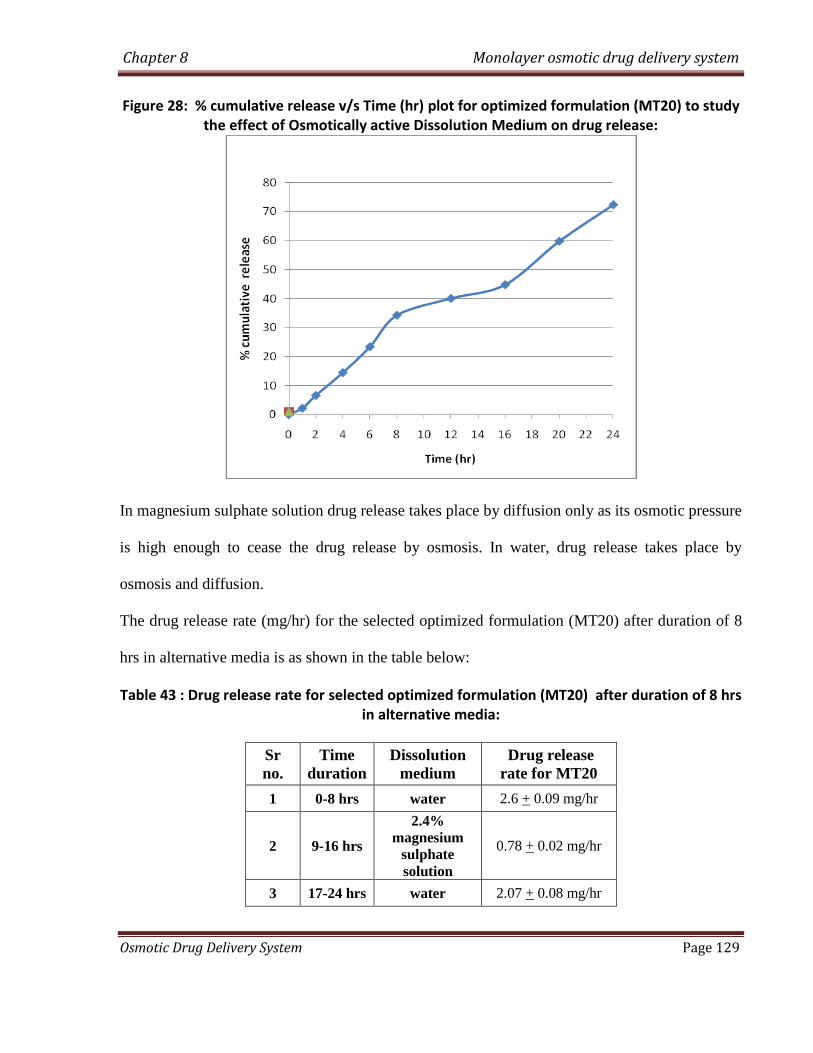
Chapter 8 Monolayer osmotic drug delivery system
Osmotic Drug Delivery System Page 129
Figure 28: % cumulative release v/s Time (hr) plot for optimized formulation (MT20) to study the effect of Osmotically active Dissolution Medium on drug release:
In magnesium sulphate solution drug release takes place by diffusion only as its osmotic pressure
is high enough to cease the drug release by osmosis. In water, drug release takes place by
osmosis and diffusion.
The drug release rate (mg/hr) for the selected optimized formulation (MT20) after duration of 8
hrs in alternative media is as shown in the table below:
Table 43 : Drug release rate for selected optimized formulation (MT20) after duration of 8 hrs in alternative media:
Sr
no.
Time
duration
Dissolution
medium
Drug release
rate for MT20
1 0-8 hrs water 2.6 + 0.09 mg/hr
2 9-16 hrs
2.4%
magnesium
sulphate
solution
0.78 + 0.02 mg/hr
3 17-24 hrs water 2.07 + 0.08 mg/hr

Chapter 8 Monolayer osmotic drug delivery system
Osmotic Drug Delivery System Page 130
Drug release rate of 2.6 + 0.09 mg/hr was observed with water for first 8 hr for the
optimized formulation MT20 while in the next 8 hours i.e upto 16th
hour, in 2.4 % magnesium
sulphate solution it was found to be 0.78 + 0.02 mg/hr. Again in water for next 8 hrs i.e upto 24th
hour it was found to increase upto 2.07 + 0.08 mg/hr. The results revealed that in water, effective
osmotic pressure across the membrane was obtained which led to high drug release rate.
Pressure drop across the membrane was very less in case of magnesium sulphate solution, which
shows slow drug release rate.
From above results it can be concluded that in case of osmotic drug delivery system, the
drug release rate is mainly contributed by osmotic pressure only.
8.12.4.2 Effect of Agitation rate on drug release
The optimized formulation MT20 was subjected to dissolution study at different agitation
rates. In the present investigation dissolution study was performed at three different agitation
rates. Agitation rates of 50, 100 and 150 rpm were selected for the study.
The following table shows percent drug release from the optimized formulation at three
different agitation rates with time.

Chapter 8 Monolayer osmotic drug delivery system
Osmotic Drug Delivery System Page 131
Table 44: Effect of agitation rate on in-vitro drug release of the optimized formulation MT20 osmotic tablet:
Time
(hr)
cumulative % drug released
of MT20
50 rpm 100 rpm 150 rpm
0 0 0 0
1 2.3 2.6 2.7
2 6.4 6.1 7.2
4 15.1 15.5 16.1
6 22.7 27.5 28.1
8 35.5 36.5 37.5
12 57.2 56.4 57.9
18 81.5 82.3 84.3
24 99.8 99.6 99.1
Figure 29: % cumulative release v/s Time (hr) plot for formulation MT20 to study the effect of
agitation rate on drug release

Chapter 8 Monolayer osmotic drug delivery system
Osmotic Drug Delivery System Page 132
When drug is released by diffusion mechanism only, agitation rates have significant effect on
drug release due to the formation of saturated drug layer on the surface of the tablets, which
reduces further drug release. However, this phenomenon was not observed with osmotic pressure
driven drug release system as could be seen with the above data. No significant changes were
observed during drug release study with agitation rate, which strongly indicates that release of
the drug from the system takes place mainly through osmotic pressure generated within the
system. Therefore, it might be predicted that the mobility of the gastrointestinal tract hardly
affected the drug release of the prepared osmotic tablet. Since drug release was independent of
agitation rate, the prepared osmotic tablets might exhibit a comparable in vitro/in vivo release
profile.
8.12.4.3 Effect of orifice size on the drug release from optimized formulations:
To study the effect of orifice size on the drug release from the optimized formulations,
the in vitro analysis of the selected tablets formulations was carried out. Coated tablets were
selected from each of the optimized batch and orifices with varying sizes (0.5 mm, 1.0 mm,
1.5mm and 2.0mm) were drilled using a mechanical microdrill. The shape and diameter of the
created orifice was visually inspected and measured using a 50 X microscope. The data for the
cumulative % drug release with varying orifice size for the selected formulation MT20 is as
shown in the table below:

Chapter 8 Monolayer osmotic drug delivery system
Osmotic Drug Delivery System Page 133
Table 45: Cumulative % drug release from optimized formulation MT20 with various orifice
sizes
Time
(hr)
cumulative % drug released
Orifice size (MT20)
0.2
mm
0.5
mm
1.0
mm
1.5
mm
2.0
mm
0 0 0.1 0.2 0.4 1.4
1 1.4 2.3 2.6 2.7 3.8
2 2.5 6.4 6.1 7.2 11.8
4 8.1 15.1 15.5 16.1 24.6
6 14.6 22.7 27.5 28.1 37.8
8 21.6 35.5 36.5 37.5 46.5
12 31.4 57.2 56.4 57.9 78.4
18 46.8 81.5 82.3 84.3 98.6
24 64.9 99.8 99.6 99.1 99.6
Figure 30: % cumulative release v/s Time (hr) plot for formulation MT20 to study the effect of orifice size on drug release

Chapter 8 Monolayer osmotic drug delivery system
Osmotic Drug Delivery System Page 134
As can be seen from the results of the above study of varying orifice sizes, it was observed that
there was no significant change in the drug release pattern with orifice size in the range of 0.5
mm to 1.5mm. However, as can be seen from the above observations, it was found that a
comparative higher release pattern and rapid release of drug was seen in tablets drilled with an
orifice of 2.0 mm. It was found that almost 100% drug was released around the 20th
hour and
hence a sustained release comparable to the theoretical target release profile was not achieved.
This may be due to the result of higher diffusion of fluids from the bigger orifice. On the other
hand, a low release rate and anomalous release were exhibited at an orifice diameter of 0.2 mm.
The drug or excipients granules in insoluble form may occlude such a small orifice, therefore,
leading to a low drug release rate.
Hence it was concluded that the release rates were independent of the orifice size in the range of
0.5mm to 1.5mm. However, a higher orifice size (2.0mm) or a lower orifice size (0.2mm) had a
significant influence on the release rate of drug from the osmotic drug delivery system.
8.12.5 Accelerated Stability studies of the optimized formulation for monolayer osmotic
drug delivey system:
The stability of a product can be ensured during its various phases of development and to
arrive at the proper storage conditions and the expiry date. This is the requirement in most of the
countries and is stipulated by the regulatory agencies of those countries. These studies would
very quickly identify the need, if any; to stabilize the active substance or the formulation and
save invaluable time and effort from being spend on an unmarketable formulation. With the
recent trend towards globalization of manufacturing operation, it is imperative that the final
product be sufficiently rugged for marketing worldwide under various climatic conditions
including tropical, sub tropical and temperate.
The accelerated stability testing was performed on the selected formulation (MT20)
which gave the most optimum results amongst all the previous trial batch formulation. The test
was carried out by placing the tablets of each selected formula in closed glass container in an
ALU ALU Blister pack and stored in thermostatically controlled ovens adjusted at different
temperatures and humidity percentage, namely, 40⁰C/75%, 30⁰C/65% and 25⁰C/60%
(maintained using a saturated solution of NaCl) for a period of 3 months. The stored tablets were

Chapter 8 Monolayer osmotic drug delivery system
Osmotic Drug Delivery System Page 135
examined visually for any changes in color and/or appearance every month. Also the average
weight, hardness and loss on drying of the selected batch formulations were determined at a
period of 1 month for total 3 months. Three tablets were taken from the ovens after a period of 1
month for 3 months and analyzed for the determination of cumulative % drug release. Limits
were set for each of the above parameter (i.e. average weight, hardness, loss on drying and
cumulative % drug release) using the ICH guidelines for accelerated stability studies.
The results of the optimized formulations MT20 after conducting accelerated stability studies for
3 months are as follows:
Table 46: Stability study data for the optimized monolayer osmotic tablet batch (MT20):
Monolayer osmotic Tablets (Alu-Alu Blister Pack) Batch MT20
Sr.
No Test Limit Initial
Storage condition
40⁰C/75% 30⁰C/65% 25⁰C/60%
1
Month
2
Month
3
Month
1
Month
2
Month
3
Month
3
Month
1 Description * * * * * * * * *
2 Avg. Wt 500mg ± 3% 500.2 500.4 501 500.9 500 501 501.2 500.9
3 Hardness NLT 5.0
kg/cm2 7.5 7.4 7.3 7.6 7.5 7.8 7.4 7.9
4 Loss on
Drying NMT 5% 2.26% 2.50% 2.75% 2.80% 2.30% 2.38% 2.45% 2.50%
5 Dissolution
Time (hr) % Drug Dissolved (as an average of 3 readings)
2 NMT 5% 6.2 5.1 5.3 6.8 5.4 6.1 6.6 5.2
6 10-30% 23.3 23.9 22.3 23.5 24.3 24.2 23.4 22.4
8 20-40% 34.2 35.2 35.4 33.9 35.4 35.1 34.4 35.6
12 45-65 % 55.1 56.3 54.1 54.6 54.2 56.7 55.2 54.2
18 65 -85% 80.8 81.9 79.9 78.3 81.6 79.3 80.4 81.3
24 NLT 85 % 100.0 99.2 98.8 98.4 100.0 99.3 100.0 99.1
6
f1
(Difference
Factor)
<15
1.9 2.1 1.9 1.6 1.9 0.4 1.9
7
f2
(Similarity
factor)
>50
92.6 92.0 89.6 93.0 91.7 99.2 92.8
* White to off white, round, biconvex film coated tablets

Chapter 8 Monolayer osmotic drug delivery system
Osmotic Drug Delivery System Page 136
It can be seen from the above table, that there was no significant variation in the physical
appearance, average weight, hardness and loss of drying after placing the tablets at various
temperature and humidity conditions for a period of 3 months.
Also the cumulative % drug release data showed that the optimized formulation (MT20)
released a drug amount, within the limits laid down as per the ICH guidelines for stability
studies. A very low f1 value and a value of f2 higher than 50 in each of the above formulation
batches at various time intervals, suggested that the release profile remained similar to the initial
release profile even after subjecting the tablets to the above temperature and humidity parameters
for a period of 3 months. Hence it was concluded that the optimized formulation batches did not
show any significant change in their release profiles after 3 months duration under the above
temperature and humidity conditions.
Thus the optimized formulations could be considered stable for a period of 2 years.

CHAPTER 9
BILAYER OSMOTIC DRUG
DELIVERY SYSTEM

Chapter 9 Bilayer Osmotic drug delivery system
Osmotic Drug Delivery System Page 137
9.0 Experimental trials for Bilayer Osmotic Tablets of Trimetazidine Dihydrochloride:
9.1 Optimization of HPMC K4M:
Table 47: Trial formulations for Optimization Of HPMC K4M for bilayer osmotic tablets Batch size: 200 tablets
Sr.N
o
Batch No BT1 BT2 BT3 BT4 BT5
Ingredients
Qty.
mg/Ta
b
Qty
mg/20
0 tab
Qty.
mg/Ta
b
Qty
mg/20
0 tab
Qty.
mg/Ta
b
Qty
mg/20
0 tab
Qty.
mg/Ta
b
Qty
mg/20
0 tab
Qty.
mg/Ta
b
Qty
mg/20
0 tab
Drug layer
(Layer 1)
1 Trimetazidine 60 12000 60 12000 60 12000 60 12000 60 12000
2 HPMC K4M 50 10000 75 15000 100 20000 125 25000 139.5 27900
3 Lactose Mono 89.5 17900 64.5 12900 39.5 7900 14.5 2900 0 0
4 Ferric oxide Red 2 400 2 400 2 400 2 400 2 400
5 Nacl 30 6000 30 6000 30 6000 30 6000 30 6000
6 Povidone K30 12.5 2500 12.5 2500 12.5 2500 12.5 2500 12.5 2500
7 isopropyl alcohol qs 14000 qs 14000 qs 14000 qs 14000 qs 14000
8 Mg Stearate 3 600 3 600 3 600 3 600 3 600
9 Talc 3 600 3 600 3 600 3 600 3 600
Wt. 250 50000 250 50000 250 50000 250 50000 250 50000
Push layer
(Layer 2)
10 Carbopol 71 G 60 12000 60 12000 60 12000 60 12000 60 12000
11 Lactose DCl 21 141.5 28300 141.5 28300 141.5 28300 141.5 28300 141.5 28300
12 Povidone K30 12.5 2500 12.5 2500 12.5 2500 12.5 2500 12.5 2500
13 NaCl 30 6000 30 6000 30 6000 30 6000 30 6000
14 Mg Stearate 3 600 3 600 3 600 3 600 3 600
15 Talc 3 600 3 600 3 600 3 600 3 600
Core tab Wt 500 100000 500 100000 500 100000 500 100000 500 100000
Coating
% wt. gain 10% 10% 10% 10% 20 10%
16 Celulose Acetate
(75%) 40 8000 40 8000 40 8000 40 8000 40 8000
17 Dibutylcebacate
(25%) 10 2000 10 2000 10 2000 10 2000 10 2000
18 Ethanol (50%) QS 36667 QS 36667 QS 36667 QS 36667 QS 36667
19 Acetone (50%) QS 36667 QS 36667 QS 36667 QS 36667 QS 36667
Coated tab wt. 550 110000 550 110000 550 110000 550 110000 550 110000

Chapter 9 Bilayer Osmotic drug delivery system
Osmotic Drug Delivery System Page 138
Procedure:
Layer 1 (Drug Layer)
a. Dry mixing:
TMZ, HPMC K4M, Lactose mono, NaCl and FeO(colourant) were dry mixed in the
above proportion in a polybag manually. The increase in the quantity of HPMC K4M in
each batch was compensated with a corresponding decrease in the quantity of Lactose
mono.
b. Binder solution preparation:
Povidone K30 was dissolved in IPA with stirring.
c. Granulation:
Dry mix blend was granulated with prepared binder solution.
d. Drying:
Wet mass was dried at 50 C in oven to get LOD below 2%w/w using Halogen moisture
detector at 105 C temperature.
e. Sizing:
Dried granules were passed through 20# sieve.
f. Lubrication:
The above blend was mixed with talc for 5 min at 24 rpm in an octagonal blender. This
blend was then lubricated with Mg stearate for 5 min at 24 rpm in an octagonal blender
Layer 2 (Push layer):
g. Mixing:
Carbopol 71G, sodium chloride, Lactose DCL, Povidone K 30 and talc were mixed for 20
minutes at 24 rpm in an octagonal blender.
h. Lubrication:
The above granules were lubricated with 60# passed Magnesium stearate for 5 minutes at
24 rpm in an octagonal blender
i. Compression:

Chapter 9 Bilayer Osmotic drug delivery system
Osmotic Drug Delivery System Page 139
The bilayer tablet was compressed using the above prepared blend 1 and blend 2 using a
bilayer rotary compression machine.
Lubricated granules were compressed using 9.0 mm, round, standard concave punches,
plain on both the sides in rotary compression machine.
j. Preparation of coating solution:
Coating solution was prepared by dissolving Cellulose acetate and dibutyl cebecate
(75:25) in a mixture of ethanol and acetone (50:50) with constant stirring.
k. Coating process:
Core tablets were coated with prepared coating solution using conventional coating pan
machine. The coating parameters were as follows:
Inlet air temperature : 45 C
Bed temperature : 38 C
Pan rpm : 6 to 8 rpm
Atomization Air pressure : 2.0 psi
The average weight of tablet was checked periodically to achieve 10% weight gain of core
tablet.
The coated tablets were dried at 50 C for 30 min in conventional coating pan at 1-2 rpm.
l. Drilling of orifice:
One orifice with a diameter of 0.5 mm was drilled on the coloured side of coated tablet
using a microdrill.
m. In vitro dissolution study:
The prepared tablets were then subjected to in vitro analysis to select the best formulation
for the optimization of Carbopol 71 G

Chapter 9 Bilayer Osmotic drug delivery system
Osmotic Drug Delivery System Page 140
9.2 Optimization of Carbopol 71G:
Table 48: Trial formulations for Optimization Of Carbopol 71 G for bilayer osmotic tablets Batch size: 200 tablets
Sr. No
Batch No BT6 BT4 BT7 BT8 BT9
Ingredients Qty.
mg/Tab
Qty mg/200
tab
Qty. mg/Tab
Qty mg/200
tab
Qty. mg/Tab
Qty mg/200
tab
Qty. mg/Tab
Qty mg/200
tab
Qty. mg/Tab
Qty mg/200
tab
Drug layer
1 Trimetazidine 60 12000 60 12000 60 12000 60 12000 60 12000
2 HPMC K4M 125 25000 125 25000 125 25000 125 25000 125 25000
3 Lactose Mono 14.5 2900 14.5 2900 14.5 2900 14.5 2900 14.5 2900
4 Ferric oxide Red 2 400 2 400 2 400 2 400 2 400
5 Nacl 30 6000 30 6000 30 6000 30 6000 30 6000
6 Povidone K30 12.5 2500 12.5 2500 12.5 2500 12.5 2500 12.5 2500
7 isopropyl alcohol qs 14000 qs 14000 qs 14000 qs 14000 qs 14000
8 Mg Stearate 3 600 3 600 3 600 3 600 3 600
9 Talc 3 600 3 600 3 600 3 600 3 600
Wt. 250 50000 250 50000 250 50000 250 50000 250 50000
Push layer (Layer 2)
10 Carbopol 71 G 45 9000 60 12000 80 16000 100 20000 120 24000
11 Lactose DCl 21 156.5 31300 141.5 28300 121.5 24300 101.5 20300 81.5 16300
12 Povidone K30 12.5 2500 12.5 2500 12.5 2500 12.5 2500 12.5 2500
13 NaCl 30 6000 30 6000 30 6000 30 6000 30 6000
14 Mg Stearate 3 600 3 600 3 600 3 600 3 600
15 Talc 3 600 3 600 3 600 3 600 3 600
Core tab Wt 500 100000 500 100000 500 100000 500 100000 500 100000
Coating
% wt. gain 10% 10% 10% 10% 10%
16 Celulose Acetate
(75%) 40 8000 40 8000 40 8000 40 8000 40 8000
17 Dibutylcebacate
(25%) 10 2000 10 2000 10 2000 10 2000 10 2000
18 Ethanol (50%) QS 36667 QS 36667 QS 36667 QS 36667 QS 36667
19 Acetone (50%) QS 36667 QS 36667 QS 36667 QS 36667 QS 36667
Coated tab wt. 550 110000 550 110000 550 110000 550 110000 550 110000

Chapter 9 Bilayer Osmotic drug delivery system
Osmotic Drug Delivery System Page 141
Procedure:
Layer 1 (Drug Layer)
a. Dry mixing:
TMZ, HPMC K4M, Lactose mono, NaCl and FeO(colourant) were dry mixed in the
above proportion in a polybag manually.
b. Binder solution preparation:
Povidone K30 was dissolved in IPA with stirring.
c. Granulation:
Dry mix blend was granulated with prepared binder solution.
d. Drying:
Wet mass was dried at 50 C in oven to get LOD below 2%w/w using Halogen moisture
detector at 105 C temperature.
e. Sizing:
Dried granules were passed through 20# sieve.
f. Lubrication:
The above blend was mixed with talc for 5 min at 24 rpm in an octagonal blender. This
blend was then lubricated with Mg stearate for 5 min at 24 rpm in an octagonal blender
Layer 2 (Push layer):
g. Mixing:
Carbopol 71G, sodium chloride, Lactose DCL, Povidone K 30 and talc were mixed for 20
minutes at 24 rpm in an octagonal blender. The increase in the weight of Carbopol 71G
for each batch was compensated with a corresponding decrease in the weight of Lactose
DCL
h. Lubrication:
The above granules were lubricated with 60# passed Magnesium stearate for 5 minutes at
24 rpm in an octagonal blender
i. Compression:
The bilayer tablet was compressed using the above prepared blend 1 and blend 2 using a
bilayer rotary compression machine.

Chapter 9 Bilayer Osmotic drug delivery system
Osmotic Drug Delivery System Page 142
Lubricated granules were compressed using 9.0 mm, round, standard concave punches,
plain on both the sides in rotary compression machine.
j. Preparation of coating solution:
Coating solution was prepared by dissolving Cellulose acetate and dibutyl cebecate
(75:25) in a mixture of ethanol and acetone (50:50) with constant stirring.
h. Coating process:
Core tablets were coated with prepared coating solution using conventional coating pan
machine. The coating parameters were as follows:
Inlet air temperature : 45 C
Bed temperature : 38 C
Pan rpm : 6 to 8 rpm
Atomization Air pressure : 2.0 psi
The average weight of tablet was checked periodically to achieve 10% weight gain of core
tablet.
The coated tablets were dried at 50 C for 30 min in conventional coating pan at 1-2 rpm.
i. Drilling of orifice:
One orifice with a diameter of 0.5 mm was drilled on the coloured side of coated tablet
using a microdrill.
The prepared tablets were subjected to in vitro evaluation to select the best formulation for
optimization of Coating composition

Chapter 9 Bilayer Osmotic drug delivery system
Osmotic Drug Delivery System Page 143
9.3 Optimization of Osmogen:
Table 49: Trial formulations for Optimization Of Osmogen for bilayer osmotic tablets Batch size: 200 tablets
Sr.No
Batch No BT10 BT8 BT11 BT12 BT13 BT14
Ingredients Qty.
mg/Tab
Qty mg/200
tab
Qty. mg/Tab
Qty mg/200
tab
Qty. mg/Tab
Qty mg/200
tab
Qty. mg/Tab
Qty mg/200
tab
Qty. mg/Tab
Qty mg/200
tab
Qty. mg/Tab
Qty mg/200
tab
Drug layer (Layer 1)
1 Trimetazidine 60 12000 60 12000 60 12000 60 12000 60 12000 60 12000
2 HPMC K4M 125 25000 125 25000 125 25000 125 25000 125 25000 125 25000
3 Lactose Mono 24.5 4900 14.5 2900 4.5 900 14.5 2900 14.5 2900 24.5 4900
4 Ferric oxide Red 2 400 2 400 2 400 2 400 2 400 2 400
5 NaCl 20 4000 30 6000 40 8000 30 6000 30 6000 20 4000
6 Mannitol 0 0 0 0 0 0 0 0 0 0 0 0
7 Povidone K30 12.5 2500 12.5 2500 12.5 2500 12.5 2500 12.5 2500 12.5 2500
8 isopropyl alcohol
qs 14000 qs 14000 qs 14000 qs 14000 qs 14000 qs 14000
9 Mg Stearate 3 600 3 600 3 600 3 600 3 600 3 600
10 Talc 3 600 3 600 3 600 3 600 3 600 3 600
Wt. 250 50000 250 50000 250 50000 250 50000 250 50000 250 50000
Push layer (Layer 2)
11 Carbopol 71 G 100 20000 100 20000 100 20000 100 20000 100 20000 100 20000
12 Lactose DCl 21 101.5 20300 101.5 20300 101.5 20300 111.5 22300 91.5 18300 91.5 18300
13 Povidone K30 12.5 2500 12.5 2500 12.5 2500 12.5 2500 12.5 2500 12.5 2500
14 NaCl 30 6000 30 6000 30 6000 20 4000 40 8000 40 8000
15 Mannitol 0 0 0 0 0 0 0 0 0 0 0 0
16 Mg Stearate 3 600 3 600 3 600 3 600 3 600 3 600
17 Talc 3 600 3 600 3 600 3 600 3 600 3 600
Core tab Wt 500 100000 500 100000 500 100000 500 100000 500 100000 500 100000
Coating
% wt. gain 10% 10% 10% 10% 10% 10%
18 Celulose
Acetate (75%) 40 8000 40 8000 40 8000 40 8000 40 8000 40 8000
19 Dibutylcebacate
(25%) 10 2000 10 2000 10 2000 10 2000 10 2000 10 2000
20 Ethanol (50%) QS 36667 QS 36667 QS 36667 QS 36667 QS 36667 QS 36667
21 Acetone (50%) QS 36667 QS 36667 QS 36667 QS 36667 QS 36667 QS 36667
Coated tab wt. 550 110000 550 110000 550 110000 550 110000 550 110000 550 110000
Continued----

Chapter 9 Bilayer Osmotic drug delivery system
Osmotic Drug Delivery System Page 144
9.3 (contd) Optimization of Osmogen (Part II)
Table 49 (contd): Trial formulations for Optimization Of osmogen for bilayer osmotic tablets
Sr.No
Batch No BT15 BT16 BT17 BT18 BT19 BT20
Ingredients Qty.
mg/Tab
Qty mg/200
tab
Qty. mg/Tab
Qty mg/200
tab
Qty. mg/Tab
Qty mg/200
tab
Qty. mg/Tab
Qty mg/200
tab
Qty. mg/Tab
Qty mg/200
tab
Qty. mg/Tab
Qty mg/200
tab
Drug layer (Layer 1)
1 Trimetazidine 60 12000 60 12000 60 12000 60 12000 60 12000 60 12000
2 HPMC K4M 125 25000 125 25000 125 25000 125 25000 125 25000 125 25000
3 Lactose Mono 4.5 900 14.5 2900 14.5 2900 14.5 2900 24.5 4900 14.5 2900
4 Ferric oxide Red 2 400 2 400 2 400 2 400 2 400 2 400
5 NaCl 40 8000 0 0 0 0 30 6000 15 3000 0 0
6 Mannitol 0 0 30 6000 30 6000 0 0 15 3000 40 8000
7 Povidone K30 12.5 2500 12.5 2500 12.5 2500 12.5 2500 12.5 2500 12.5 2500
8 isopropyl alcohol qs 14000 qs 14000 qs 14000 qs 14000 qs 14000 qs 14000
9 Mg Stearate 3 600 3 600 3 600 3 600 3 600 3 600
10 Talc 3 600 3 600 3 600 3 600 3 600 3 600
Wt. 250 50000 250 50000 250 50000 250 50000 260 52000 260 52000
Push layer (Layer 2)
11 Carbopol 71 G 100 20000 100 20000 100 20000 100 20000 100 20000 100 20000
12 Lactose DCl 21 111.5 22300 91.5 18300 91.5 18300 91.5 18300 91.5 18300 91.5 18300
13 Povidone K30 12.5 2500 12.5 2500 12.5 2500 12.5 2500 12.5 2500 12.5 2500
14 NaCl 20 4000 0 0 40 8000 0 0 20 4000 30 6000
15 Mannitol 0 0 40 8000 0 0 40 8000 20 4000 0 0
16 Mg Stearate 3 600 3 600 3 600 3 600 3 600 3 600
17 Talc 3 600 3 600 3 600 3 600 3 600 3 600
Core tab Wt 500 100000 500 100000 500 100000 500 100000 510 102000 500 100000
Coating
% wt. gain 10% 10% 10% 10% 10% 10%
18 Celulose Acetate
(75%) 40 8000 40 8000 40 8000 40 8000 40 8000 40 8000
19 Dibutylcebacate
(25%) 10 2000 10 2000 10 2000 10 2000 10 2000 10 2000
20 Ethanol (50%) QS 36667 QS 36667 QS 36667 QS 36667 QS 36667 QS 36667
21 Acetone (50%) QS 36667 QS 36667 QS 36667 QS 36667 QS 36667 QS 36667
Coated tab wt. 550 110000 550 110000 550 110000 550 110000 560 112000 550 110000

Chapter 9 Bilayer Osmotic drug delivery system
Osmotic Drug Delivery System Page 145
Chapter 9 Bilayer Osmotic drug delivery system
Osmotic Drug Delivery System Page 146
Procedure:
Layer 1 (Drug Layer)
a. Dry mixing:
TMZ, HPMC K4M, Lactose mono, NaCl and Mannitol (Osmogens) and FeO(colourant)
were dry mixed in the above proportion in a polybag manually. The proportion of NaCl
and Mannitol was varied in each trial batch as per the above table
b. Binder solution preparation:
Povidone K30 was dissolved in IPA with stirring.
c. Granulation:
Dry mix blend was granulated with prepared binder solution.
d. Drying:
Wet mass was dried at 50 C in oven to get LOD below 2%w/w using Halogen moisture
detector at 105 C temperature.
e. Sizing:
Dried granules were passed through 20# sieve.
f. Lubrication:
The above blend was mixed with talc for 5 min at 24 rpm in an octagonal blender. This
blend was then lubricated with Mg stearate for 5 min at 24 rpm in an octagonal blender
Layer 2 (Push layer):
g. Mixing:
Carbopol 71G, sodium chloride, Mannitol, Lactose DCL, Povidone K 30 and talc were
mixed for 20 minutes at 24 rpm in an octagonal blender. The proportion of NaCl and
Mannitol was varied in the push layer as per the above table.
h. Lubrication:
The above granules were lubricated with 60# passed Magnesium stearate for 5 minutes at
24 rpm in an octagonal blender.
i. Compression:

Chapter 9 Bilayer Osmotic drug delivery system
Osmotic Drug Delivery System Page 147
The bilayer tablet was compressed using the above prepared blend 1 and blend 2 using a
bilayer rotary compression machine. Lubricated granules were compressed using 9.0 mm,
round, standard concave punches, plain on both the sides in rotary compression machine.
j. Preparation of coating solution:
Coating solution was prepared by dissolving Cellulose acetate and dibutyl cebecate
(75:25) in a mixture of ethanol and acetone (50:50) with constant stirring.
h. Coating process:
Core tablets were coated with prepared coating solution using conventional coating pan
machine. The coating parameters were as follows:
Inlet air temperature : 45 C
Bed temperature : 38 C
Pan rpm : 6 to 8 rpm
Atomization Air pressure : 2.0 psi
The average weight of tablet was checked periodically to achieve 10% weight gain of core
tablet.
The coated tablets were dried at 50 C for 30 min in conventional coating pan at 1-2 rpm.
ii. Drilling of orifice:
One orifice with a diameter of 0.5 mm was drilled on the coloured side of coated tablet
using a microdrill.
The prepared tablets were subjected to in vitro evaluation to select the best formulation for
optimization of osmogen
The optimized formulation was then subjected to stability study as per ICH
guidelines for stability study.
9.4 Compression and coating parameters for bilayer osmotic tablets:
The above prepared tablets were analysed for the various compression and coating parameters as
discussed for monolayer osmotic tablets viz. Weight variation, hardness, friability, % weight gain
for coated tablets and orifice diameter.

Chapter 9 Bilayer Osmotic drug delivery system
Osmotic Drug Delivery System Page 148
9.5 In vitro dissolution study for bilayer osmotic tablets:
All the feasibility trial batches were subjected to In vitro dissolution study for drug release and to
study the effect of variables. The operating conditions for drug release were adjusted as follows.
Dissolution test apparatus : USP type II (paddle)
Speed : 50 RPM
Temperature : 37° C ± 0.5
Dissolution medium : 900 ml distilled water
Sampling time : every 1 hr
Sample withdrawn : 10 ml
Method of analysis : UV spectrophotometer
UV maxima : 270 nm
Samples were suitably diluted and absorbance was measured. Cumulative percentage drug
released was calculated for each batch. The study was performed in triplicate and the average
was reported.
9.6 Statistical treatment for bilayer osmotic tablets:
The data of % cumulative release from each trial batch were subjected to kinetic release studies to
assess the fit into the zero-order release kinetics. The r2 value was found out to determine the best
fit zero order release kinetics. The trial batch having the nearest value to 1 was selected as the
best trial formulation. Also the difference factor (f1) and similarity factor (F2) for each batch was
found out by comparing it with the theoretical target release profile
9.7 Effect of variables on release profiles of optimized formulations for bilayer osmotic
tablets:
The optimized formulation was then subjected to various comparative tests under different
conditions to study the following effects of variables:

Chapter 9 Bilayer Osmotic drug delivery system
Osmotic Drug Delivery System Page 149
a. Effect of Osmotically active Dissolution Medium on drug release
b. Effect of Agitation rate on drug release
c. Effect of orifice size on the drug release from optimized formulations
9.8 Stability study of optimized formulation of bilayer osmotic tablets :
The optimized formulation was subject to accelerated stability study at various
temperature and humidity conditions as per the criterion mentioned in the ICH guidelines for
stability study, to see whether the final product is sufficiently rugged for marketing worldwide
under various climated conditions including tropical, subtropical and temperate.
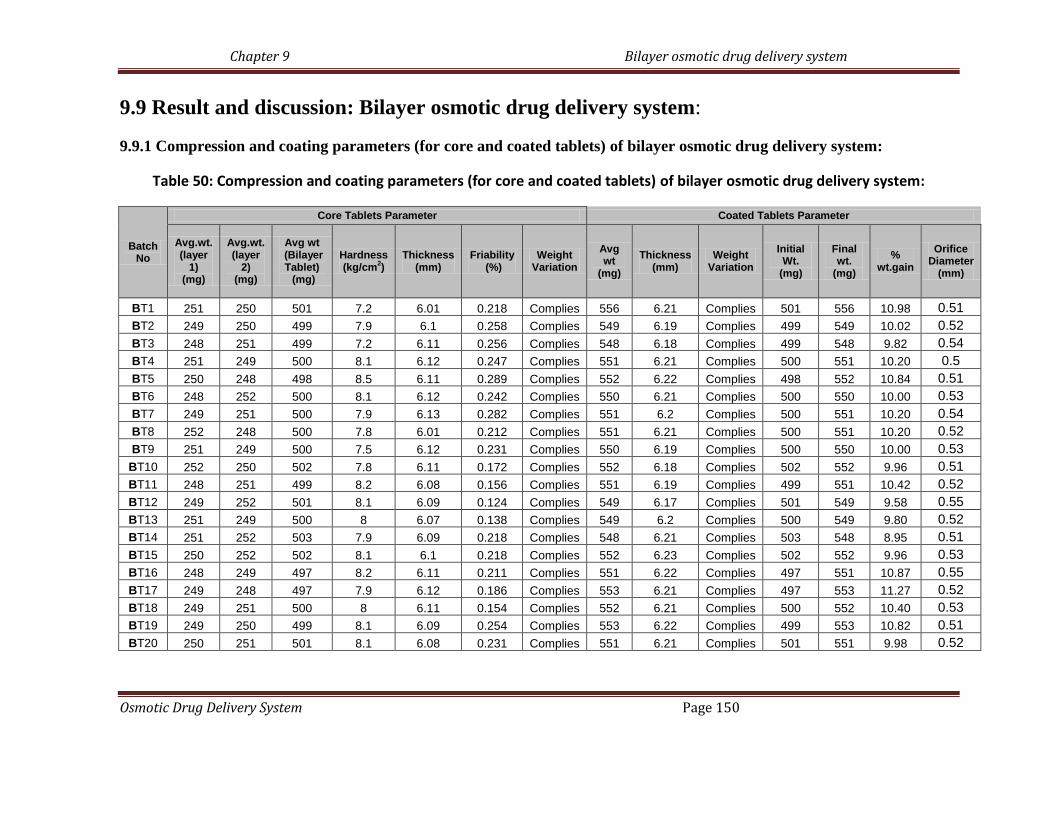
Chapter 9 Bilayer osmotic drug delivery system
Osmotic Drug Delivery System Page 150
9.9 Result and discussion: Bilayer osmotic drug delivery system:
9.9.1 Compression and coating parameters (for core and coated tablets) of bilayer osmotic drug delivery system:
Table 50: Compression and coating parameters (for core and coated tablets) of bilayer osmotic drug delivery system:
Batch No
Core Tablets Parameter Coated Tablets Parameter
Avg.wt. (layer
1) (mg)
Avg.wt. (layer
2) (mg)
Avg wt (Bilayer Tablet) (mg)
Hardness (kg/cm
2)
Thickness (mm)
Friability (%)
Weight Variation
Avg wt
(mg)
Thickness (mm)
Weight Variation
Initial Wt.
(mg)
Final wt.
(mg)
% wt.gain
Orifice Diameter
(mm)
BT1 251 250 501 7.2 6.01 0.218 Complies 556 6.21 Complies 501 556 10.98 0.51
BT2 249 250 499 7.9 6.1 0.258 Complies 549 6.19 Complies 499 549 10.02 0.52
BT3 248 251 499 7.2 6.11 0.256 Complies 548 6.18 Complies 499 548 9.82 0.54
BT4 251 249 500 8.1 6.12 0.247 Complies 551 6.21 Complies 500 551 10.20 0.5
BT5 250 248 498 8.5 6.11 0.289 Complies 552 6.22 Complies 498 552 10.84 0.51
BT6 248 252 500 8.1 6.12 0.242 Complies 550 6.21 Complies 500 550 10.00 0.53
BT7 249 251 500 7.9 6.13 0.282 Complies 551 6.2 Complies 500 551 10.20 0.54
BT8 252 248 500 7.8 6.01 0.212 Complies 551 6.21 Complies 500 551 10.20 0.52
BT9 251 249 500 7.5 6.12 0.231 Complies 550 6.19 Complies 500 550 10.00 0.53
BT10 252 250 502 7.8 6.11 0.172 Complies 552 6.18 Complies 502 552 9.96 0.51
BT11 248 251 499 8.2 6.08 0.156 Complies 551 6.19 Complies 499 551 10.42 0.52
BT12 249 252 501 8.1 6.09 0.124 Complies 549 6.17 Complies 501 549 9.58 0.55
BT13 251 249 500 8 6.07 0.138 Complies 549 6.2 Complies 500 549 9.80 0.52
BT14 251 252 503 7.9 6.09 0.218 Complies 548 6.21 Complies 503 548 8.95 0.51
BT15 250 252 502 8.1 6.1 0.218 Complies 552 6.23 Complies 502 552 9.96 0.53
BT16 248 249 497 8.2 6.11 0.211 Complies 551 6.22 Complies 497 551 10.87 0.55
BT17 249 248 497 7.9 6.12 0.186 Complies 553 6.21 Complies 497 553 11.27 0.52
BT18 249 251 500 8 6.11 0.154 Complies 552 6.21 Complies 500 552 10.40 0.53
BT19 249 250 499 8.1 6.09 0.254 Complies 553 6.22 Complies 499 553 10.82 0.51
BT20 250 251 501 8.1 6.08 0.231 Complies 551 6.21 Complies 501 551 9.98 0.52

Chapter 9 Bilayer osmotic drug delivery system
Osmotic Drug Delivery System Page 151
It is evident from the above table that all the trial formulations comply with the standard
specification mentioned in the Indian Pharmacopoeia for average weight, weight variation and
friability. Also the thickness and hardness parameters of the prepared tablets complied with the
in house specifications. The orifice diameter was found to be in the range of 0.5 to 0.55 mm.
9.9.2 In vitro dissolution study for bilayer osmotic drug delivery system:
The dissolution profile results for the various formulation trials for bilayer osmotic drug
delivery system are as follows:
9.9.2.1 Optimization of HPMC K4M for bilayer osmotic drug delivery system:
Table 51 : % cumulative release data for optimization of HPMC K4M for bilayer osmotic drug delivery system
(Average reported for 3 readings)
% cumulative release
Time
(hr) BT 1 BT 2 BT 3 BT 4 BT5
0 0 0 0 0 0
1 8.2 5.1 2.1 0 0
2 12.3 8.4 6.2 1.3 0
4 30.4 22.5 18.3 10.4 4.1
6 61.1 49.4 33.4 22.6 13.2
8 72.2 62.4 50.2 33.8 22.3
12 79.3 75.6 66.4 52.4 44.4
18 85.4 80.5 78.2 65.3 61.3
24 88.3 84.4 80.3 77.4 75.2

Chapter 9 Bilayer osmotic drug delivery system
Osmotic Drug Delivery System Page 152
Figure 31: % cumulative release v/s Time (hr) plot for optimization of HPMC K4M for bilayer osmotic drug delivery system
Table 52: Statistical parameters for dissolution data of optimization of HPMC K4M for bilayer osmotic drug delivery system
Parameter BT 1 BT 2 BT 3 BT 4 BT5
f1 (Difference Factor) 68.26 52.86 36.73 17.82 19.72
f2 (Similarity factor) 28.31 33.68 41.75 50.21 46.20
Zero order kinetic
(r2 value)
0.7698 0.8226 0.8963 0.9656 0.979
From the above results of % cumulative release and zero order kinetic (r2 value), it was seen that
batch BT4 and BT5 showed good zero order release kinetics. But BT4 showed a slightly higher
% cumulative release than BT5. Also analyzing the f1 and f2 values of the formulation BT4, it
was found to show a similar release profile to the theoretical release target profile. The batch
BT5 also showed a slightly higher lag release (4 hrs) as compared to BT4. Hence BT4 was
further selected for Carbopol 71G optimization.

Chapter 9 Bilayer osmotic drug delivery system
Osmotic Drug Delivery System Page 153
9.9.2.2 Optimization of Carbopol 71G for bilayer osmotic drug delivery system:
Table 53: % cumulative release data for optimization of Carbopol 71G for bilayer osmotic drug delivery system:
(Average reported for 3 readings)
% cumulative release
Time
(hr) BT 6 BT 4 BT 7 BT 8 BT9
0 0 0 0 0 0
1 0 0 0 0 0
2 1.2 1.4 1.7 2.1 3.1
4 10.4 10.3 11.2 10.2 13.2
6 19.2 22.5 21.3 23.3 26.3
8 28.3 33.4 35.4 38.4 45.2
12 48.8 52.3 55.2 58.6 62.8
18 60.6 65.2 70.6 77.5 83.6
24 69.2 77.4 82.2 88.4 92.2
Figure 32: % cumulative release v/s Time (hr) plot for optimization of Carbopol 71G for bilayer osmotic drug delivery system:

Chapter 9 Bilayer osmotic drug delivery system
Osmotic Drug Delivery System Page 154
Table 54: Statistical parameters for dissolution data of optimization of Carbopol 71G for bilayer osmotic drug delivery system:
Parameter BT 6 BT 4 BT 7 BT 8 BT9
f1 (Difference Factor) 18.18 17.82 15.98 14.30 24.63
f2 (Similarity factor) 44.72 50.21 53.65 54.37 47.92
Zero order kinetic
(r2 value)
0.9638 0.9656 0.9671 0.9673 0.9573
From the above results of % cumulative release and zero order kinetic (r2 value), it was seen that
batch all the batches showed good zero order release kinetics. But BT8 and BT9 showed a
slightly higher % cumulative release nearer to the target profile. Between BT8 and BT9, batch
BT8 showed a better zero order release kinetic parameter. Also analyzing f1 and f2 values of the
formulation BT8, it was found to show a similar release profile to the theoretical release target
profile. Hence BT8 was selected for further optimization of osmogen.
9.9.2.3 Optimization of Osmogen for bilayer osmotic drug delivery system:
Table 55: % cumulative release data for optimization of osmogen for bilayer osmotic drug delivery system:
(Average reported for 3 readings)
% cumulative release Time
(hr) BT10 BT8 BT11 BT12 BT13 BT14 BT15 BT16 BT17 BT18 BT19 BT20
0 0 0 0 0 0 0 0 0 0 0 0 0
1 0 0 0 0 0 0 0 0 0 0 0 0
2 0 2.1 6.2 1.2 0 0 7 2.5 0 1.2 3.1 2.3
4 6.2 10.1 16.3 11.4 9.2 5.1 18.4 12.3 9.1 11.2 12.2 13.6
6 18.3 23.3 30.4 22.3 21.1 19.4 32.2 25.1 21.3 26.3 24.3 26.3
8 33.5 38.2 45.3 35.6 36.3 34.1 38.3 38.6 37.5 37.3 38.3 39.3
12 53.6 58.3 62.8 51.5 60.8 58.3 53.5 62.5 58.8 61.6 64.3 62.2
18 76.5 77.2 80.3 72.4 82.6 80.4 74.8 85.3 84.3 84.5 85.8 84.4
24 87.3 88.4 91.3 80.3 98.1 97.2 82.3 100 100.1 99.2 100.1 98.6

Chapter 9 Bilayer osmotic drug delivery system
Osmotic Drug Delivery System Page 155
Figure 33: % cumulative release v/s Time (hr) plot for optimization of osmogen for bilayer osmotic drug delivery system:
Table 56: Statistical parameters for dissolution data of optimization of osmogen for bilayer osmotic drug delivery system:
Parameter BT10 BT8 BT11 BT12 BT13 BT14 BT15 BT16 BT17 BT18 BT19 BT20
f1 (Difference
Factor) 12.02 17.3 27.57 14.88 13.71 12.61 24.63 19.13 13.34 17.67 19.5 20.23
f2 (Similarity
factor) 58.11 54.37 46.69 53.31 54.67 58.01 48.25 51.59 52.67 52.91 48.88 51.18
Zero order kinetic
(r2 value) 0.973 0.967 0.959 0.969 0.979 0.977 0.962 0.98 0.982 0.977 0.977 0.977

Chapter 9 Bilayer osmotic drug delivery system
Osmotic Drug Delivery System Page 156
From the above results of % cumulative release and zero order kinetic (r2 value), it was seen that
all the batches showed good zero order release kinetics. But BT16, BT17 and BT19 showed a
slightly higher % cumulative release nearer to the target profile. Between BT16, BT17 and
BT19, batch BT17 showed a slightly better zero order release kinetic parameter. Also analyzing
f1 and f2 values of the formulation BT17, it was found to show a similar release profile to the
theoretical release target profile. Hence BT17 was selected as the final optimized batch for
bilayer osmotic drug delivery system and was further forwarded for stability study analysis.
9.9.3 Effect of variables on the optimized formulation:
The optimized formulation (BT 17) was then subjected to various comparative tests under
different conditions to study the following effects of variables:
a. Effect of Osmotically active Dissolution Medium on drug release
b. Effect of Agitation rate on drug release
c. Effect of orifice size on the drug release from optimized formulations.
The results of the study are as follows:
9.9.3.1 Effect of Osmotically active Dissolution Medium on drug release:
The effect of osmotically active dissolution medium on drug release from bilayer osmotic
tablets was carried out in a procedure similar to that in the case of monolayer osmotic drug
delivery system. In order to investigate the actual mechanism of the drug released from the
tablet, dissolution study was conducted in water (0-8 h), 2.4 % w/w magnesium sulphate solution
in water (8-16 hr) and in water (17-24 hr) alternatively. Table shows dissolution profile for the
optimized formulation (BT17) in water (upto 8th hour), then magnesium sulphate (upto 16th
hour) and lastly followed by water (upto 24th hour).

Chapter 9 Bilayer osmotic drug delivery system
Osmotic Drug Delivery System Page 157
Table 57: cumulative % drug release of the selected optimized formulations (BT17) in
different medium
Time
(hr)
Dissolution
media
cumulative % drug
release for optimized
batch (BT17)
0
water
0
1 0
2 0
4 9.1
6 21.3
8 37.5
8
2.4% magnesium
sulphate solution
37.5
12 41.5
16 48.6
16
water
48.6
20 61.4
24 73.4

Chapter 9 Bilayer osmotic drug delivery system
Osmotic Drug Delivery System Page 158
Figure 34 : % cumulative release v/s Time (hr) plot for optimized formulation (BT17) to study the
effect of Osmotically active Dissolution Medium on drug release:
The drug release rate (mg/hr) for the selected optimized formulation (BT17) after duration of 8
hrs in alternative media is as shown in the table below:
Table 58 : Drug release rate for selected optimized formulation (BT17) after duration of 8 hrs in alternative media:
Sr
no.
Time
duration
Dissolution
medium
Drug release
rate for BT17
1 0-8 hrs water 2.81 + 0.06
mg/hr
2 9-16 hrs
2.4%
magnesium
sulphate
solution
0.8325 + 0.01
mg/hr
3 17-24 hrs water 1.186 + 0.04
mg/hr

Chapter 9 Bilayer osmotic drug delivery system
Osmotic Drug Delivery System Page 159
Drug release rate of 2.81 + 0.06 mg/hr was observed with water for first 8 hr for the
optimized formulation BT17 while in the next 8 hours i.e upto 16th
hour, in 2.4 % magnesium
sulphate solution it was found to be 0.8325 + 0.01 mg/hr. Again in water for next 8 hrs i.e upto
24th
hour it was found to increase upto 1.186 + 0.04 mg/hr. The results revealed that in water,
effective osmotic pressure across the membrane was obtained which led to high drug release
rate. Pressure drop across the membrane was very less in case of magnesium sulphate solution,
which shows slow drug release rate.
From above results it can be concluded that as in the case of monolayer osmotic tablets,
for bilayer osmotic tablets also, the drug release rate is mainly contributed by osmotic pressure
only.
9.9.3.2 Effect of Agitation rate on drug release
The optimized formulation BT17 was subjected to dissolution study at different agitation
rates. In the present investigation dissolution study was performed at three different agitation
rates. Agitation rates of 50, 100 and 150 rpm were selected for the study.
The following table shows percent drug release from the optimized formulation BT17 at
three different agitation rates with time.

Chapter 9 Bilayer osmotic drug delivery system
Osmotic Drug Delivery System Page 160
Table 59 : Effect of agitation rate on in-vitro drug release of the optimized formulation BT17 osmotic tablet:
Time
(hr)
cumulative % drug released
of BT17
50 rpm 100 rpm 150 rpm
0 0 0 0.2
1 0.1 0.3 0.8
2 0.6 0.4 1.2
4 7.9 8.2 9.1
6 22.1 22.8 23.4
8 38.5 39.8 40.1
12 57.9 59.6 61.5
18 83.1 82.9 86.4
24 99.8 99.6 99.8
Figure 35: % cumulative release v/s Time (hr) plot for formulation BT17 to study the effect of
agitation rate on drug release

Chapter 9 Bilayer osmotic drug delivery system
Osmotic Drug Delivery System Page 161
As can be seen with above data, no significant changes were observed during drug release study
with agitation rate, which strongly indicates that release of the drug from the system takes place
mainly through osmotic pressure generated within the system. Therefore, it might be predicted
that the mobility of the gastrointestinal tract hardly affected the drug release of the prepared
osmotic tablet. Since drug release was independent of agitation rate, the prepared osmotic tablets
might exhibit a comparable in vitro/in vivo release profile.
9.9.3.3 Effect of orifice size on the drug release from optimized formulations:
To study the effect of orifice size on the drug release from the optimized formulations,
the in vitro analysis of the selected tablets formulations was carried out. Coated tablets were
selected from the optimized batch BT17 and orifices with varying sizes (0.5 mm, 1.0 mm,
1.5mm and 2.0mm) were drilled using a mechanical micro drill. The shape and diameter of the
created orifice was visually inspected and measured using a 50 X microscope. The data for the
cumulative % drug release with varying orifice size for the selected formulation BT17 is as
shown in the table below:

Chapter 9 Bilayer osmotic drug delivery system
Osmotic Drug Delivery System Page 162
Table 60: Cumulative % drug release from optimized formulation BT17 with various orifice sizes
Time
(hr)
cumulative % drug released
Orifice size (BT17)
0.2
mm
0.5
mm
1.0
mm
1.5
mm
2.0
mm
0 0.1 0 0.2 0 0.8
1 0.2 0.1 0.8 0.3 2.4
2 0.2 0.6 1.2 0.4 4.2
4 2.3 7.9 9.1 8.2 13.4
6 7.4 22.1 23.4 22.8 29.8
8 14.8 38.5 40.1 39.8 48.4
12 23.4 57.9 61.5 59.6 73.4
18 39.4 83.1 86.4 82.9 96.2
24 61.5 99.8 99.8 99.6 99.8
Figure 36: % cumulative release v/s Time (hr) plot for formulation BT17 to study the effect of orifice size on drug release

Chapter 9 Bilayer osmotic drug delivery system
Osmotic Drug Delivery System Page 163
As can be seen from the results of the above study of varying orifice sizes, it was
observed that there was no significant change in the drug release pattern with orifice size in the
range of 0.5 mm to 1.5mm. However, as can be seen from the above observations, it was found
that a comparative higher release pattern and rapid release of drug was seen in tablets drilled
with an orifice of 2.0 mm. It was found that almost 100% drug was released around the 18th
hour
and hence a sustained release comparable to the theoretical target release profile was not
achieved. This may be due to the result of higher diffusion of fluids from the bigger orifice. On
the other hand, a low release rate and anomalous release were exhibited at an orifice diameter of
0.2 mm. The drug or excipients granules in insoluble form may occlude such a small orifice,
therefore, leading to a low drug release rate.
Hence it was concluded that the release rates were independent of the orifice size in the
range of 0.5mm to 1.5mm. However, a higher orifice size (2.0mm) or a lower orifice size
(0.2mm) had a significant influence on the release rate of drug from the osmotic drug delivery
system.
9.9.4 Accelerated Stability studies of the optimized formulation for osmotic bilayer drug
delivery system:
The accelerated stability testing was performed on the selected formulation (BT17) which gave
the most optimum results amongst all the previous trial batch formulation. The test was carried
out by placing the tablets of each selected formula in closed glass container in an ALU ALU
Blister pack and stored in thermostatically controlled ovens adjusted at different temperatures
and humidity percentage, namely, 40⁰C/75%, 30⁰C/65% and 25⁰C/60% (maintained using a
saturated solution of NaCl) for a period of 3 months. The stored tablets were examined visually
for any changes in color and/or appearance every month. Also the average weight, hardness and
loss on drying of the selected batch formulations were determined at a period of 1 month for total
3 months. Three tablets were taken from the ovens after a period of 1 month for 3 months and
analyzed for the determination of cumulative % drug release. Limits were set for each of the
above parameter (i.e. average weight, hardness, loss on drying and cumulative % drug release)
using the ICH guidelines for accelerated stability studies.

Chapter 9 Bilayer osmotic drug delivery system
Osmotic Drug Delivery System Page 164
The results of the optimized formulations BT17 after conducting accelerated stability studies for
3 months are as follows:
Table 61: Stability study data for the optimized bilayer osmotic tablet batch (BT17):
Bilayer osmotic Tablets (Alu-Alu Blister Pack) Batch BT17
Sr.
No Test Limit Initial
Storage condition
40⁰C/75% 30⁰C/65% 25⁰C/60%
1
Month
2
Month
3
Month
1
Month
2
Month
3
Month
3
Month
1 Description * * * * * * * * *
2 Avg. Wt 500mg ± 3% 500.4 500.4 500.3 500.9 500 501 501.2 500.9
3 Hardness NLT 5.0 kg/cm2 7.6 7.4 7.4 7.6 7.5 7.7 7.5 7.9
4 Loss on Drying NMT 5% 2.30% 2.38% 2.75% 2.80% 2.26% 2.50% 2.45% 2.50%
5 Dissolution
Time (hr) % Drug Dissolved (as an average of 3 readings)
2 NMT 5% 0.0 0.4 0.2 0.1 0.3 0.1 0.1 0.0
6 10-30% 21.3 21.7 22.1 21.8 21.5 21.3 21.4 22.1
8 20-40% 37.5 35.2 35.4 36.4 36.2 36.4 36.8 36.4
12 45-65 % 58.8 57.4 57.4 57.3 58.1 58.2 58.6 58.5
18 65 -85% 84.3 84.2 84.3 84.3 84.1 84.1 84.3 83.9
24 NLT 85 % 100.1 99.2 99.4 99.6 100.0 99.3 100.0 99.1
6 f1 (Difference
Factor) <15
1.8 1.7 1.2 0.9 0.9 0.4 1.2
7 f2 (Similarity
factor) >50
90.5 90.0 93.7 96.4 96.0 98.9 94.8
* bicoloured (white and red) , round, biconvex film coated tablets

Chapter 9 Bilayer osmotic drug delivery system
Osmotic Drug Delivery System Page 165
It can be seen from the above table, that there was no significant variation in the physical
appearance, average weight, hardness and loss of drying after placing the tablets at various
temperature and humidity conditions for a period of 3 months.
Also the cumulative % drug release data showed that the optimized formulation (BT17)
released a drug amount, within the limits laid down as per the ICH guidelines for stability
studies. A very low f1 value and a value of f2 higher than 50 in each of the above formulation
batches at various time intervals, suggested that the release profile remained similar to the initial
release profile even after subjecting the tablets to the above temperature and humidity parameters
for a period of 3 months. Hence it was concluded that the optimized formulation batches did not
show any significant change in their release profiles after 3 months duration under the above
temperature and humidity conditions.
Thus the optimized formulations could be considered stable for a period of 2 years.

CHAPTER 10
TRILAYER OSMOTIC
DRUG DELIVERY SYSTEM

Chapter 10 Trilayer osmotic drug delivery system
Osmotic Drug Delivery System Page 166
10.0 Experimental trials for Trilayer Osmotic Tablet of Trimetazidine Dihydrochloride
10.1 Optimization of HPMC K4M:
Batch size: 200 tablets Table 62: Trial formulations for Optimization Of HPMC K4M for trilayer osmotic tablets
Sr.No
Batch no. TT1 TT2 TT3 TT4 TT5 TT6 TT7
Ingredients Qty
mg/Tab
Qty mg/200
tab
Qty mg/Tab
Qty mg/200
tab
Qty mg/Tab
Qty mg/200
tab
Qty mg/Tab
Qty mg/200
tab
Qty mg/Tab
Qty mg/200
tab
Qty mg/Tab
Qty mg/200
tab
Qty mg/Tab
Qty mg/200
tab
Drug layer I
1 Trimetazidine 30 6000 30 6000 30 6000 30 6000 30 6000 30 6000 30 6000
2 HPMC K4M 30 6000 40 8000 50 10000 60 12000 70 14000 80 16000 90 18000
3 Lactose Mono 105 21000 95 19000 85 17000 75 15000 65 13000 55 11000 45 9000
4 NaCl 20 4000 20 4000 20 4000 20 4000 20 4000 20 4000 20 4000
6 Povidone K30 10 2000 10 2000 10 2000 10 2000 10 2000 10 2000 10 2000
7 IPA (90%) qs 11200 qs 11200 qs 11200 qs 11200 qs 11200 qs 11200 qs 11200
8 Mg Stearate 2 400 2 400 2 400 2 400 2 400 2 400 2 400
9 Talc 1 200 1 200 1 200 1 200 1 200 1 200 1 200
Wt. 200 40000 200 40000 200 40000 200 40000 200 40000 200 40000 200 40000
Push Layer
10 Carbopol 71 G 80 16000 80 16000 80 16000 80 16000 80 16000 80 16000 80 16000
11 Lactose DCl 21 87 17400 87 17400 87 17400 87 17400 87 17400 87 17400 87 17400
12 Povidone K30 10 2000 10 2000 10 2000 10 2000 10 2000 10 2000 10 2000
13 NaCl 20 4000 20 4000 20 4000 20 4000 20 4000 20 4000 20 4000
14 Mg Stearate 2 400 2 400 2 400 2 400 2 400 2 400 2 400
15 Talc 1 200 1 200 1 200 1 200 1 200 1 200 1 200
Wt 200 40000 200 40000 200 40000 200 40000 200 40000 200 40000 200 40000
Drug layer II
17 Trimetazidine 30 6000 30 6000 30 6000 30 6000 30 6000 30 6000 30 6000
18 HPMC K4M 30 6000 40 8000 50 10000 60 12000 70 14000 80 16000 80 16000
19 Lactose Mono 105 21000 95 19000 85 17000 75 15000 65 13000 55 11000 55 11000
20 NaCl 20 4000 20 4000 20 4000 20 4000 20 4000 20 4000 20 4000
22 Povidone K30 10 2000 10 2000 10 2000 10 2000 10 2000 10 2000 10 2000

Chapter 10 Trilayer osmotic drug delivery system
Osmotic Drug Delivery System Page 167
23 IPA (90%) Qs 11200 qs 11200 qs 11200 qs 11200 qs 11200 qs 11200 qs 11200
24 Mg Stearate 2 400 2 400 2 400 2 400 2 400 2 400 2 400
25 Talc 1 200 1 200 1 200 1 200 1 200 1 200 1 200
Wt. 200 40000 200 40000 200 40000 200 40000 200 40000 200 40000 200 40000
Total weight 600 120000 600 120000 600 120000 600 120000 600 120000 600 120000 600 120000
Coating
% wt. Gain
10%
10%
10%
10%
10%
10%
10%
27 Celulose Acetate
(75%) 45 9000 45 9000 45 9000 45 9000 45 9000 45 9000 45 9000
28 Dibutylcebacate
(25%) 15 3000 15 3000 15 3000 15 3000 15 3000 15 3000 15 3000
29 Ethanol (50%) QS 44000 QS 44000 QS 44000 QS 44000 QS 44000 QS 44000 QS 44000
30 Acetone (50%) QS 44000 QS 44000 QS 44000 QS 44000 QS 44000 QS 44000 QS 44000
Coated tab wt. 660 132000 660 132000 660 132000 660 132000 660 132000 660 132000 660 132000
Chapter 10 Trilayer osmotic drug delivery system
Osmotic Drug Delivery System Page 168
Procedure:
For formulating the trilayer osmotic tablet, a push layer was sandwitched between two drug
layers. The composition of each drug layer was identical.
Formulation of drug layer I and drug layer II
a. Dry mixing:
TMZ, HPMC K4M, Lactose mono, and NaCl were dry mixed in the proportion required
as per the above table in a polybag manually. The increase in the quantity of HPMC K4M
in each batch was compensated with a corresponding decrease in the quantity of Lactose
mono.
b. Binder solution preparation:
Povidone K30 was dissolved in IPA with stirring.
c. Granulation:
Dry mix blend was granulated with prepared binder solution:
Wet mass was dried at 50 C in oven to get LOD below 2%w/w using Halogen moisture
detector at 105 C temperature.
d. Sizing:
Dried granules were passed through 20# sieve.
e. Lubrication:
The above blends were individually mixed with talc for 5 min at 24 rpm in an octagonal
blender. This blend was then lubricated with Mg stearate for 5 min at 24 rpm in an
octagonal blender.
The prepared drug layer blend was weighed and divided in two equal parts to compose
the two drug layers.
Formulation of Push layer:
f. Mixing:
Carbopol 71G, sodium chloride, Lactose DCL, Povidone K 30 and talc were mixed for
20 minutes at 24 rpm in an octagonal blender.

Chapter 10 Trilayer osmotic drug delivery system
Osmotic Drug Delivery System Page 169
g. Lubrication:
The above granules were lubricated with 60# passed Magnesium stearate for 5 minutes at
24 rpm in an octagonal blender.
h. Compression:
The trilayer tablet was compressed manually using the above prepared blends using a
rotary compression machine.
Initially the granule blends of drug layer I (weighing 200mg) was filled in the die punch
cavity. Then the granule blend of the push layer was (weighing 200mg) filled on top of it.
Finally the blend of drug layer II (weighing 200 mg) was filled in the die cavity.
The filled lubricated granules were compressed manually one at a time using 9.0 mm,
round, standard concave punches, plain on both the sides in rotary compression machine.
i. Preparation of coating solution:
Coating solution was prepared by dissolving Cellulose acetate and dibutyl cebecate
(75:25) in a mixture of ethanol and acetone (50:50) with constant stirring.
j. Coating process:
Core tablets were coated with prepared coating solution using conventional coating pan
machine. The coating parameters were as follows:
Inlet air temperature : 45 C
Bed temperature : 38 C
Pan rpm : 6 to 8 rpm
Atomization Air pressure : 2.0 psi
The average weight of tablet was checked periodically to achieve 10% weight gain of
core tablet.
The coated tablets were dried at 50 C for 30 min in conventional coating pan at 1-2 rpm.

Chapter 10 Trilayer osmotic drug delivery system
Osmotic Drug Delivery System Page 170
k. Drilling of orifice:
One orifice with a diameter of 0.5 mm was drilled on the coloured side of coated tablet
using a microdrill.
l. In vitro dissolution study:
The prepared tablets were then subjected to in vitro analysis to select the best formulation
for the optimization of Carbopol 71 G

Chapter 10 Trilayer osmotic drug delivery system
Osmotic Drug Delivery System Page 171
10.2 Optimization of Carbopol 71G:
Table 63: Trial formulations for Optimization Of Carbopol 71G for trilayer osmotic tablets
Batch size: 200 tablets:
Sr.No
Batch no. TT8 TT9 TT10 TT5 TT11 TT12 TT13
Ingredients Qty
mg/Tab
Qty mg/200
tab Qty
mg/Tab
Qty mg/200
tab Qty
mg/Tab
Qty mg/200
tab Qty
mg/Tab
Qty mg/200
tab Qty
mg/Tab
Qty mg/200
tab Qty
mg/Tab
Qty mg/200
tab Qty
mg/Tab
Qty mg/200
tab
Drug layer I
1 Trimetazidine 30 6000 30 6000 30 6000 30 6000 30 6000 30 6000 30 6000
2 HPMC K4M 70 14000 70 14000 70 14000 70 14000 70 14000 70 14000 70 14000
3 Lactose Mono 65 13000 65 13000 65 13000 65 13000 65 13000 65 13000 65 13000
4 NaCl 20 4000 20 4000 20 4000 20 4000 20 4000 20 4000 20 4000
6 Povidone K30 10 2000 10 2000 10 2000 10 2000 10 2000 10 2000 10 2000
7 IPA (90%) qs 11200 qs 11200 qs 11200 qs 11200 qs 11200 qs 11200 qs 11200
8 Mg Stearate 2 400 2 400 2 400 2 400 2 400 2 400 2 400
9 Talc 1 200 1 200 1 200 1 200 1 200 1 200 1 200
Wt. 200 40000 200 40000 200 40000 200 40000 200 40000 200 40000 200 40000
Push Layer
10 Carbopol 71 G 50 10000 60 12000 70 14000 80 16000 90 18000 100 20000 110 22000
11 Lactose DCl 21 117 23400 107 21400 97 19400 87 17400 77 15400 67 13400 57 11400
12 Povidone K30 10 2000 10 2000 10 2000 10 2000 10 2000 10 2000 10 2000
13 NaCl 20 4000 20 4000 20 4000 20 4000 20 4000 20 4000 20 4000
14 Mg Stearate 2 400 2 400 2 400 2 400 2 400 2 400 2 400
15 Talc 1 200 1 200 1 200 1 200 1 200 1 200 1 200
Wt 200 40000 200 40000 200 40000 200 40000 200 40000 200 40000 200 40000
Drug layer II
17 Trimetazidine 30 6000 30 6000 30 6000 30 6000 30 6000 30 6000 30 6000
18 HPMC K4M 70 14000 70 14000 70 14000 70 14000 70 14000 70 14000 70 14000
19 Lactose Mono 65 13000 65 13000 65 13000 65 13000 65 13000 65 13000 65 13000
20 NaCl 20 4000 20 4000 20 4000 20 4000 20 4000 20 4000 20 4000
22 Povidone K30 10 2000 10 2000 10 2000 10 2000 10 2000 10 2000 10 2000
23 IPA (90%) qs 11200 qs 11200 qs 11200 qs 11200 qs 11200 qs 11200 qs 11200

Chapter 10 Trilayer osmotic drug delivery system
Osmotic Drug Delivery System Page 172
24 Mg Stearate 2 400 2 400 2 400 2 400 2 400 2 400 2 400
25 Talc 1 200 1 200 1 200 1 200 1 200 1 200 1 200
Wt. 200 40000 200 40000 200 40000 200 40000 200 40000 200 40000 200 40000
Total weight 600 120000 600 120000 600 120000 600 120000 600 120000 600 120000 600 120000
Coating
% wt. Gain 10% 10% 10% 10% 10% 10% 10%
27 Celulose Acetate (75%) 45 9000 45 9000 45 9000 45 9000 45 9000 45 9000 45 9000
28 Dibutylcebacate (25%) 15 3000 15 3000 15 3000 15 3000 15 3000 15 3000 15 3000
29 Ethanol (50%) QS 44000 QS 44000 QS 44000 QS 44000 QS 44000 QS 44000 QS 44000
30 Acetone (50%) QS 44000 QS 44000 QS 44000 QS 44000 QS 44000 QS 44000 QS 44000
Coated tab wt. 660 132000 660 132000 660 132000 660 132000 660 132000 660 132000 660 132000
Method:
The trilayer tablets for optimization of Carbopol 71 G were prepared using the same method as mentioned above; the increase in the
weight of Carbopol in the push layer was compensated with the corresponding decrease in the weight of Lactose DCI. The prepared
tablets were subjected to in vitro evaluation to select the best formulation for optimization of osmogen
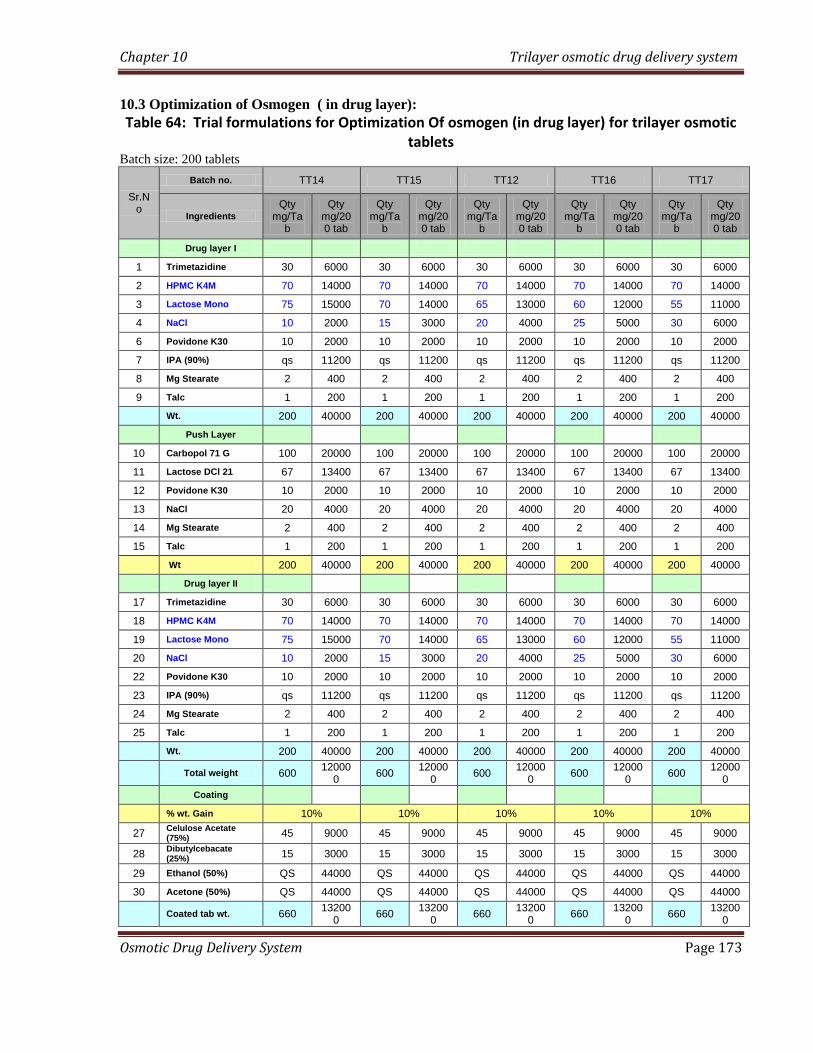
Chapter 10 Trilayer osmotic drug delivery system
Osmotic Drug Delivery System Page 173
10.3 Optimization of Osmogen ( in drug layer):
Table 64: Trial formulations for Optimization Of osmogen (in drug layer) for trilayer osmotic tablets
Batch size: 200 tablets
Sr.No
Batch no. TT14 TT15 TT12 TT16 TT17
Ingredients
Qty mg/Ta
b
Qty mg/200 tab
Qty mg/Ta
b
Qty mg/200 tab
Qty mg/Ta
b
Qty mg/200 tab
Qty mg/Ta
b
Qty mg/200 tab
Qty mg/Ta
b
Qty mg/200 tab
Drug layer I
1 Trimetazidine 30 6000 30 6000 30 6000 30 6000 30 6000
2 HPMC K4M 70 14000 70 14000 70 14000 70 14000 70 14000
3 Lactose Mono 75 15000 70 14000 65 13000 60 12000 55 11000
4 NaCl 10 2000 15 3000 20 4000 25 5000 30 6000
6 Povidone K30 10 2000 10 2000 10 2000 10 2000 10 2000
7 IPA (90%) qs 11200 qs 11200 qs 11200 qs 11200 qs 11200
8 Mg Stearate 2 400 2 400 2 400 2 400 2 400
9 Talc 1 200 1 200 1 200 1 200 1 200
Wt. 200 40000 200 40000 200 40000 200 40000 200 40000
Push Layer
10 Carbopol 71 G 100 20000 100 20000 100 20000 100 20000 100 20000
11 Lactose DCl 21 67 13400 67 13400 67 13400 67 13400 67 13400
12 Povidone K30 10 2000 10 2000 10 2000 10 2000 10 2000
13 NaCl 20 4000 20 4000 20 4000 20 4000 20 4000
14 Mg Stearate 2 400 2 400 2 400 2 400 2 400
15 Talc 1 200 1 200 1 200 1 200 1 200
Wt 200 40000 200 40000 200 40000 200 40000 200 40000
Drug layer II
17 Trimetazidine 30 6000 30 6000 30 6000 30 6000 30 6000
18 HPMC K4M 70 14000 70 14000 70 14000 70 14000 70 14000
19 Lactose Mono 75 15000 70 14000 65 13000 60 12000 55 11000
20 NaCl 10 2000 15 3000 20 4000 25 5000 30 6000
22 Povidone K30 10 2000 10 2000 10 2000 10 2000 10 2000
23 IPA (90%) qs 11200 qs 11200 qs 11200 qs 11200 qs 11200
24 Mg Stearate 2 400 2 400 2 400 2 400 2 400
25 Talc 1 200 1 200 1 200 1 200 1 200
Wt. 200 40000 200 40000 200 40000 200 40000 200 40000
Total weight 600 12000
0 600
120000
600 12000
0 600
120000
600 12000
0
Coating
% wt. Gain 10% 10% 10% 10% 10%
27 Celulose Acetate (75%)
45 9000 45 9000 45 9000 45 9000 45 9000
28 Dibutylcebacate (25%)
15 3000 15 3000 15 3000 15 3000 15 3000
29 Ethanol (50%) QS 44000 QS 44000 QS 44000 QS 44000 QS 44000
30 Acetone (50%) QS 44000 QS 44000 QS 44000 QS 44000 QS 44000
Coated tab wt. 660 13200
0 660
132000
660 13200
0 660
132000
660 13200
0

Chapter 10 Trilayer osmotic drug delivery system
Osmotic Drug Delivery System Page 174
Method:
The trilayer tablets for optimization of osmogen in the drug layer were prepared using the same
method as mentioned above; the increase in the weight of NaCl (osmogen) in each drug layer
layer was compensated with the corresponding decrease in the weight of Lactose mono. The
prepared tablets were subjected to in vitro evaluation to select the best formulation for
optimization of osmogen (in push layer)

Chapter 10 Trilayer osmotic drug delivery system
Osmotic Drug Delivery System Page 175
10.4 Optimization of osmogen (in Push layer):
Table 65: Trial formulations for Optimization Of osmogen (in push layer) for trilayer osmotic tablets Batch size: 200 tablets:
Sr.No
Batch no. TT18 TT19 TT16 TT20 TT21
Ingredients Qty
mg/Tab
Qty mg/200 tab
Qty mg/Ta
b
Qty mg/200 tab
Qty mg/Ta
b
Qty mg/200 tab
Qty mg/Ta
b
Qty mg/200 tab
Qty mg/Ta
b
Qty mg/200 tab
Drug layer I
1 Trimetazidine 30 6000 30 6000 30 6000 30 6000 30 6000
2 HPMC K4M 70 14000 70 14000 70 14000 70 14000 70 14000
3 Lactose Mono 60 12000 60 12000 60 12000 60 12000 60 12000
4 NaCl 25 5000 25 5000 25 5000 25 5000 25 5000
6 Povidone K30 10 2000 10 2000 10 2000 10 2000 10 2000
7 IPA (90%) qs 11200 qs 11200 qs 11200 qs 11200 Qs 11200
8 Mg Stearate 2 400 2 400 2 400 2 400 2 400
9 Talc 1 200 1 200 1 200 1 200 1 200
Wt. 200 40000 200 40000 200 40000 200 40000 200 40000
Push Layer
10 Carbopol 71 G 100 20000 100 20000 100 20000 100 20000 100 20000
11 Lactose DCl 21 77 15400 72 14400 67 13400 62 12400 57 11400
12 Povidone K30 10 2000 10 2000 10 2000 10 2000 10 2000
13 NaCl 10 2000 15 3000 20 4000 25 5000 30 6000
14 Mg Stearate 2 400 2 400 2 400 2 400 2 400
15 Talc 1 200 1 200 1 200 1 200 1 200
Core tab Wt 200 40000 200 40000 200 40000 200 40000 200 40000
Drug layer II
17 Trimetazidine 30 6000 30 6000 30 6000 30 6000 30 6000
18 HPMC K4M 70 14000 70 14000 70 14000 70 14000 70 14000
19 Lactose Mono 60 12000 60 12000 60 12000 60 12000 60 12000
20 NaCl 25 5000 25 5000 25 5000 25 5000 25 5000
22 Povidone K30 10 2000 10 2000 10 2000 10 2000 10 2000
23 IPA (90%) qs 11200 qs 11200 qs 11200 qs 11200 Qs 11200
24 Mg Stearate 2 400 2 400 2 400 2 400 2 400
25 Talc 1 200 1 200 1 200 1 200 1 200
Wt. 200 40000 200 40000 200 40000 200 40000 200 40000
Total weight 600 120000 600 120000 600 120000 600 120000 600 120000
Coating
% wt. Gain 10% 10% 10% 10% 10%
27 Celulose Acetate (75%)
45 9000 45 9000 45 9000 45 9000 45 9000
28 Dibutylcebacate (25%)
15 3000 15 3000 15 3000 15 3000 15 3000
29 Ethanol (50%) QS 44000 QS 44000 QS 44000 QS 44000 QS 44000
30 Acetone (50%) QS 44000 QS 44000 QS 44000 QS 44000 QS 44000
Coated tab wt. 660 132000 660 132000 660 132000 660 132000 660 132000
Chapter 10 Trilayer osmotic drug delivery system
Osmotic Drug Delivery System Page 176
Method:
The trilayer tablets for optimization of osmogen in the push layer were prepared using the same
method as mentioned above for optimization of HPMC K4M; the increase in the weight of NaCl
(osmogen) in push layer was compensated with the corresponding decrease in the weight of
Lactose mono in the push layer.
The optimized formulation was then subjected to stability study as per ICH guidelines for
stability study.
10.5 Compression and coating parameters:
The above prepared tablets were analysed for the various compression and coating parameters as
discussed for monolayer osmotic tablets viz. Weight variation, hardness, friability, % weight
gain for coated tablets and orifice diameter. The results of the study are mentioned in table 66
10.6 In vitro dissolution study
All the feasibility trial batches were subjected to In vitro dissolution study for drug release and to
study the effect of variables. The operating conditions for drug release were adjusted as follows.
Dissolution test apparatus : USP type II (paddle)
Speed : 50 RPM
Temperature : 37° C ± 0.5
Dissolution medium : 900 ml distilled water
Sampling time : every 1 hr
Sample withdrawn : 10 ml
Method of analysis : UV spectrophotometer
UV maxima : 270 nm

Chapter 10 Trilayer osmotic drug delivery system
Osmotic Drug Delivery System Page 177
Samples were suitably diluted and absorbance was measured. Cumulative percentage drug
released was calculated for each batch. The study was performed in triplicate and the average
was reported.
10.7 Statistical treatment:
The data of % cumulative release from each trial batch were subjected to kinetic release studies
to assess the fit into the zero-order release kinetics. The r2 value was found out to determine the
best fit zero order release kinetics. The trial batch having the nearest value to 1 was selected as
the best trial formulation. Also the difference factor (f1) and similarity factor (F2) for each batch
was found out by comparing it with the theoretical target release profile
10.8 Effect of variables on release profiles of optimized formulations for trilayer osmotic
tablets:
The optimized formulation was then subjected to various comparative tests under different
conditions to study the following effects of variables:
a. Effect of Osmotically active Dissolution Medium on drug release
b. Effect of Agitation rate on drug release
c. Effect of orifice size on the drug release from optimized formulations
10.9 Stability study:
The optimized formulation was subject to accelerated stability study at various
temperature and humidity conditions as per the criterion mentioned in the ICH guidelines for
stability study, to see whether the final product is sufficiently rugged for marketing worldwide
under various climate conditions including tropical, subtropical and temperate.

Chapter 10 Trilayer osmotic drug delivery system
Osmotic Drug Delivery System Page 178
10.10 Result and Discussion: Trial layer osmotic drug delivery system
10.10.1 Compression and coating parameters (for core and coated tablets) of trilayer osmotic drug delivery system:
Table 66: Compression and coating parameters (for core and coated tablets) for trilayer osmotic tablets:
Batch No
Core Tablets Parameter Coated Tablets Parameter
Avg wt (Trilayer Tablet) (mg)
Hardness (kg/cm
2)
Thickness (mm)
Friability (%)
Weight Variation
Avg wt
(mg)
Thickness (mm)
Weight Variation
Initial Wt.
(mg)
Final wt.
(mg)
% wt.gain
Orifice Diameter
(mm)
TT1 603 7.2 7.01 0.218 Complies 665.1 7.21 Complies 603 665.1 10.30 0.52
TT2 605 7.9 7.1 0.258 Complies 665.4 7.14 Complies 605 665.4 9.98 0.55
TT3 601 7.2 7.11 0.256 Complies 662.5 7.16 Complies 601 662.5 10.23 0.52
TT4 611 8.1 7.12 0.247 Complies 673.1 7.21 Complies 611 673.1 10.16 0.51
TT5 605 8.5 7.11 0.289 Complies 666.5 7.17 Complies 605 666.5 10.17 0.53
TT6 599 8.1 7.12 0.242 Complies 659.1 7.19 Complies 599 659.1 10.03 0.55
TT7 602 7.9 7.12 0.282 Complies 664.5 7.2 Complies 602 664.5 10.38 0.52
TT8 603 7.8 7.05 0.212 Complies 667.5 7.21 Complies 603 667.5 10.70 0.53
TT9 605 7.5 7.11 0.231 Complies 668.5 7.19 Complies 605 668.5 10.50 0.51
TT10 604 7.8 7.1 0.172 Complies 665.4 7.21 Complies 604 665.4 10.17 0.52
TT11 607 8.2 7.2 0.156 Complies 669.2 7.25 Complies 607 669.2 10.25 0.51
TT12 601 8.1 6.9 0.124 Complies 661.2 7.14 Complies 601 661.2 10.02 0.52
TT13 605 8 7.2 0.138 Complies 665.5 7.21 Complies 605 665.5 10.00 0.54
TT14 602 7.9 7.1 0.218 Complies 664.1 7.21 Complies 602 664.1 10.32 0.5
TT15 600 8.1 7.1 0.218 Complies 665.2 7.23 Complies 600 665.2 10.87 0.51
TT16 604 8.2 7.1 0.211 Complies 665.2 7.25 Complies 604 665.2 10.13 0.53
TT17 605 7.9 7.21 0.186 Complies 666.4 7.31 Complies 605 666.4 10.15 0.54
TT18 606 8 7.15 0.154 Complies 667.4 7.25 Complies 606 667.4 10.13 0.52
TT19 605 8.1 7.2 0.254 Complies 666.4 7.29 Complies 605 666.4 10.15 0.53
TT20 603 8.1 7.1 0.231 Complies 664.2 7.21 Complies 603 664.2 10.15 0.51
TT21 603 8.1 7.1 0.231 Complies 664.2 7.21 Complies 603 664.2 10.15 0.51

Chapter 10 Trilayer osmotic drug delivery system
Osmotic Drug Delivery System Page 179
It is evident from the above table that all the trial formulations comply with the standard
specification mentioned in the Indian Pharmacopoeia for average weight, weight variation and
friability. Also the thickness and hardness parameters of the prepared tablets complied with the
in house specifications. The orifice diameter was found to be in the range of 0.5 to 0.55 mm.
10.10.2 In vitro dissolution study for trilayer osmotic drug delivery system:
The dissolution profile results for the various formulation trials are as follows:
10.10.2.1 Optimization of HPMC K4M for trilayer osmotic tablets:
Table 67: % cumulative release data for optimization of HPMC K4M for trilayer osmotic tablets
(Average reported for 3 readings)
% cumulative release
Time
(hr) TT 1 TT 2 TT 3 TT 4 TT5 TT6 TT7
0 0 0 0 0 0 0 0
1 11.2 6.1 1.1 0 0 0 0
2 23.3 13.6 4.2 1.3 0 0 0
4 42.4 25.3 12.3 8.3 3.1 1.2 0
6 55.1 39.4 24.4 18.2 12.5 10.1 8.2
8 71.2 55.5 35.2 28.4 22.3 18.4 12.3
12 92.8 75.6 55.3 49.6 40.4 38.5 30.9
18 99.3 92. 82.8 72.5 60.5 55.6 50.3
24 100 100 92.6 85.1 80.2 78.2 70.2

Chapter 10 Trilayer osmotic drug delivery system
Osmotic Drug Delivery System Page 180
Figure 37: % cumulative release v/s Time (hr) plot for optimization of HPMC K4M for trilayer osmotic tablets
Table 68: Statistical parameters for dissolution data of optimization of HPMC K4M for trilayer
osmotic tablets
Parameter TT 1 TT 2 TT 3 TT 4 TT5 TT6 TT7
f1 (Difference Factor) 80.72 48.46 17.67 8.14 20.45 26.69 37.68
f2 (Similarity factor) 23.75 34.54 58.46 61.29 48.31 43.63 36.49
Zero order kinetic
(r2 value)
0.835 0.938 0.981 0.984 0.986 0.979 0.971
From the above results of % cumulative release and zero order kinetic (r2 value), it was seen that
batch TT4 and TT5 showed good zero order release kinetics. Batch TT4 showed a slightly better
% cumulative release after 24 hours (85.1%) as compared to batch TT5 (80.2%). Also analyzing
the f1 and f2 values of the formulation TT4, it was found to show a similar release profile to the
theoretical release target profile hence was selected for further optimization of Carbopol 71G.

Chapter 10 Trilayer osmotic drug delivery system
Osmotic Drug Delivery System Page 181
10.10.2.2 Optimization of Carbopol 71G for trilayer osmotic drug delivery system:
Table 69: % cumulative release data for optimization of Carbopol 71G for trilayer osmotic tablets
(Average reported for 3 readings)
% cumulative release
Time
(hr)
TT8 TT9 TT10 TT4 TT11 TT12 TT13
0 0 0 0 0 0 0 0
1 0 0 0 0 0 0 0
2 0 0 0 1.3 0 1.2 2.3
4 2.1 2.1 3.1 8.3 4.4 6.6 9.3
6 8.3 10.3 12.2 18.2 14.3 17.1 21.3
8 14.5 19.4 20.6 28.4 25.1 29.2 35.4
12 35.4 37.3 39.8 49.6 45.5 49.6 57.3
18 53.3 56.2 59.1 72.5 64.3 70.1 74.2
24 75.6 79.4 80.3 85.1 84.4 89.3 90.4
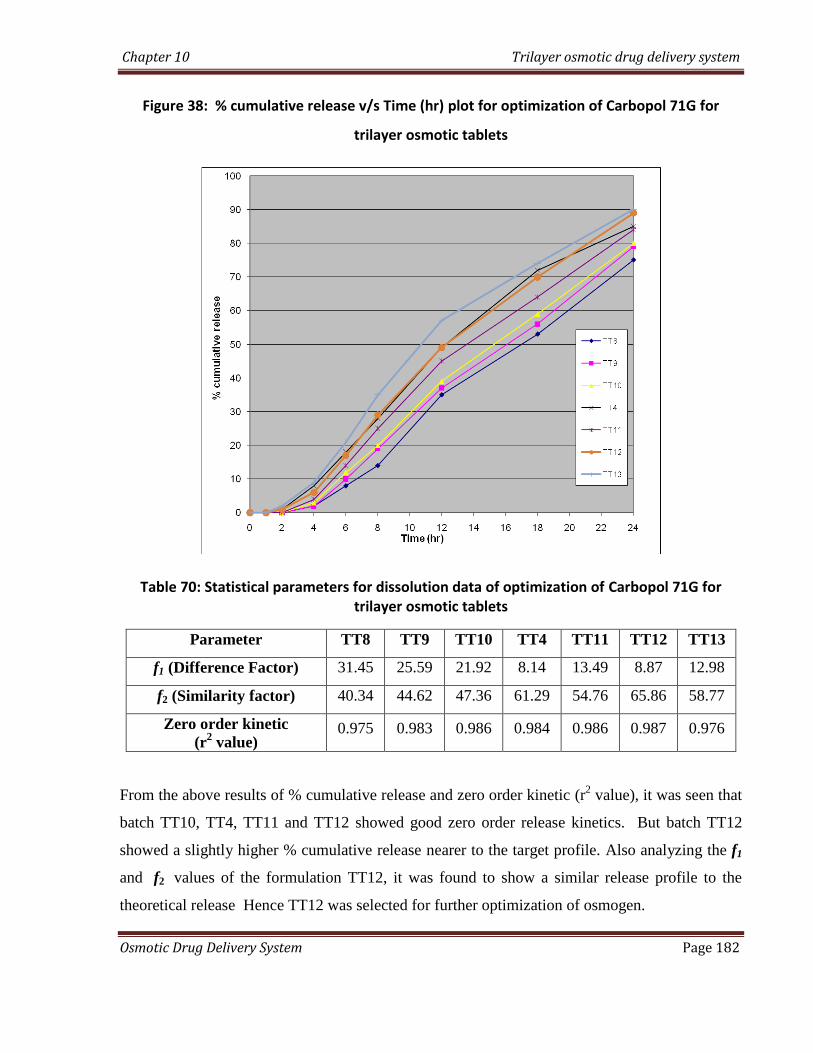
Chapter 10 Trilayer osmotic drug delivery system
Osmotic Drug Delivery System Page 182
Figure 38: % cumulative release v/s Time (hr) plot for optimization of Carbopol 71G for
trilayer osmotic tablets
Table 70: Statistical parameters for dissolution data of optimization of Carbopol 71G for trilayer osmotic tablets
Parameter TT8 TT9 TT10 TT4 TT11 TT12 TT13
f1 (Difference Factor) 31.45 25.59 21.92 8.14 13.49 8.87 12.98
f2 (Similarity factor) 40.34 44.62 47.36 61.29 54.76 65.86 58.77
Zero order kinetic
(r2 value)
0.975 0.983 0.986 0.984 0.986 0.987 0.976
From the above results of % cumulative release and zero order kinetic (r2 value), it was seen that
batch TT10, TT4, TT11 and TT12 showed good zero order release kinetics. But batch TT12
showed a slightly higher % cumulative release nearer to the target profile. Also analyzing the f1
and f2 values of the formulation TT12, it was found to show a similar release profile to the
theoretical release Hence TT12 was selected for further optimization of osmogen.

Chapter 10 Trilayer osmotic drug delivery system
Osmotic Drug Delivery System Page 183
10.10.2.3 Optimization of Osmogen (Drug layer):
Table 71: % cumulative release data for optimization of osmogen (Drug layer) for trilayer osmotic tablets:
(Average reported for 3 readings)
% cumulative release
Time
(hr) TT14 TT15 TT12 TT16 TT17
0 0 0 0 0 0
1 0 0 0 0 0
2 0 0 1.1 1.8 3.2
4 0 1.2 6.2 7.3 10.1
6 10.2 12.3 17.1 19.8 23.9
8 19.3 22.8 29.8 31.2 37.2
12 45.4 47.1 49.4 52.4 58.3
18 65.2 68.6 70.1 76.3 79.4
24 85.1 89.6 89.2 91.5 95.8
Figure 39: % cumulative release v/s Time (hr) plot for optimization of osmogen (Drug layer) for trilayer osmotic tablets:

Chapter 10 Trilayer osmotic drug delivery system
Osmotic Drug Delivery System Page 184
Table 72: Statistical parameters for dissolution data of optimization of osmogen (Drug layer):
Parameter TT14 TT15 TT12 TT16 TT17
f1 (Difference Factor) 17.89 13.49 8.87 9.68 15.47
f2 (Similarity factor) 51.78 58.14 65.86 65.96 57.38
Zero order kinetic
(r2 value)
0.972 0.977 0.987 0.991 0.981
From the above results of % cumulative release and zero order kinetic (r2 value), it was seen that
batch TT16 showed the best zero order release kinetics. Also it showed an acceptable %
cumulative release (91.5%). Also analyzing the f1 and f2 values of the formulation TT16, it was
found to show a similar release profile to the theoretical release. Hence batch TT16 was selected
for further optimization of osmogen in push layer.
10.10.2.4: Optimization of Osmogen (Push layer):
Table 73: % cumulative release data for optimization of osmogen (Push layer) for trilayer osmotic tablets:
(Average reported for 3 readings)
% cumulative release
Time
(hr) TT18 TT16 TT19 TT20 TT21
0 0 0 0 0 0
1 0 0 0 0 0
2 0 1.4 1.6 0.7 5.5
4 5.2 6.2 8.4 9.5 11.4
6 15.4 17.7 21.6 23.4 27.9
8 28.5 29.3 33.8 35.6 39.6
12 48.1 49.7 53.3 56.2 58.5
18 69.2 70.4 76.5 79.9 81.3
24 86.6 89.7 94.3 99.5 99.7

Chapter 10 Trilayer osmotic drug delivery system
Osmotic Drug Delivery System Page 185
Figure 40: % cumulative release v/s Time (hr) plot for optimization of osmogen (Push layer) for trilayer osmotic tablets:
Table 74: Statistical parameters for dissolution data of optimization of osmogen (Push layer)
for trilayer osmotic tablets:
Parameter TT18 TT16 TT19 TT20 TT21
f1 (Difference Factor) 10.34 8.87 10.04 11.88 18.04
f2 (Similarity factor) 59.53 65.86 66.53 61.43 54.19
Zero order kinetic
(r2 value)
0.983 0.9878 0.9874 0.9987 0.9856
From the above results of % cumulative release and zero order kinetic (r2 value), it was seen all
batches showed good zero order release kinetics. But, batch TT20 showed the best zero order
release kinetics, nearer to the target profile. Also it showed 99% cumulative release after 24 hrs.
The values of f1 and f2 confirmed the similarity between the release profile of batch TT20 and
the theoretical target release profile. Hence batch TT20 was selected as the optimized batch for
trilayer osmotic tablets and was further forwarded for stability study analysis.

Chapter 10 Trilayer osmotic drug delivery system
Osmotic Drug Delivery System Page 186
10.10.3 Effect of variables on the optimized formulation:
The optimized formulation was then subjected to various comparative tests under different
conditions to study the following effects of variables:
a. Effect of Osmotically active Dissolution Medium on drug release
b. Effect of Agitation rate on drug release
c. Effect of orifice size on the drug release from optimized formulations.
The results of the study are as follows:
10.10.3.1 Effect of Osmotically active Dissolution Medium on drug release:
The effect of osmotically active dissolution medium on drug release from trilayer osmotic
tablets was carried out in a procedure similar to that in the case of monolayer osmotic drug
delivery system. In order to investigate the actual mechanism of the drug released from the
tablet, dissolution study was conducted in water (0-8 h), 2.4 % w/w magnesium sulphate solution
in water (8-16 hr) and in water (17-24 hr) alternatively. Table shows dissolution profile for the
optimized formulation (TT20) in water (upto 8th hour), then magnesium sulphate (upto 16th
hour) and lastly followed by water (upto 24th hour).

Chapter 10 Trilayer osmotic drug delivery system
Osmotic Drug Delivery System Page 187
Table 75: cumulative % drug release of the selected optimized formulations (TT20) in
different medium
Time
(hr)
Dissolution
media
cumulative % drug
release for optimized
batch (TT20)
0
water
0
1 0
2 2.3
4 9.5
6 23.4
8 35.6
8
2.4% magnesium
sulphate solution
35.6
12 43.5
16 47.4
16
water
47.4
20 68.4
24 79.2

Chapter 10 Trilayer osmotic drug delivery system
Osmotic Drug Delivery System Page 188
Figure 41: % cumulative release v/s Time (hr) plot for optimized formulation (TT20) to study the effect
of Osmotically active Dissolution Medium on drug release:
The drug release rate (mg/hr) for the selected optimized formulation (TT20) after duration of 8
hrs in alternative media is as shown in the table below:
Table 76: Drug release rate for selected optimized formulation (TT20) after duration of 8 hrs in alternative media:
Sr
no.
Time
duration
Dissolution
medium
Drug release
rate for TT20
1 0-8 hrs water 2.67 + 0.05 mg/hr
2 9-16 hrs
2.4%
magnesium
sulphate
solution
0.885 + 0.02 mg/hr
3 17-24 hrs water 2.385 + 0.06 mg/hr

Chapter 10 Trilayer osmotic drug delivery system
Osmotic Drug Delivery System Page 189
Drug release rate of 2.67 + 0.05 mg/hr was observed with water for first 8 hr for the
optimized formulation MT20 while in the next 8 hours i.e upto 16th
hour, in 2.4 % magnesium
sulphate solution it was found to be 0.885 + 0.02 mg/hr. Again in water for next 8 hrs i.e upto
24th
hour it was found to increase upto 2.385 + 0.06 mg/hr. The results revealed that in water,
effective osmotic pressure across the membrane was obtained which led to high drug release
rate. Pressure drop across the membrane was very less in case of magnesium sulphate solution,
which shows slow drug release rate.
From above results it can be concluded that as in the case of monolayer osmotic tablets,
for trilayer osmotic tablets also, the drug release rate is mainly contributed by osmotic pressure
only.
10.3.3.2 Effect of Agitation rate on drug release
The optimized formulation TT20 was subjected to dissolution study at different agitation
rates. In the present investigation dissolution study was performed at three different agitation
rates. Agitation rates of 50, 100 and 150 rpm were selected for the study.
The following table shows percent drug release from the optimized formulation TT20 at
three different agitation rates with time.

Chapter 10 Trilayer osmotic drug delivery system
Osmotic Drug Delivery System Page 190
Table 77 : Effect of agitation rate on in-vitro drug release of the optimized formulation TT20 osmotic tablet:
Time
(hr)
cumulative % drug released
of TT20
50 rpm 100 rpm 150 rpm
0 0 0.2 0.8
1 0.4 0.9 101
2 2.6 3.4 3.3
4 10.4 11.2 11.8
6 22.5 23.1 24.1
8 37.6 38.1 39.4
12 55.9 56.1 55.7
18 80.1 81.2 82.8
24 99.6 99.5 99.6
Figure 42: % cumulative release v/s Time (hr) plot for formulation TT20 to study the effect of
agitation rate on drug release

Chapter 10 Trilayer osmotic drug delivery system
Osmotic Drug Delivery System Page 191
As seen in the above data, no significant changes were observed during drug release
study with agitation rate, which strongly indicates that release of the drug from the system takes
place mainly through osmotic pressure generated within the system. Therefore, it might be
predicted that the mobility of the gastrointestinal tract hardly affected the drug release of the
prepared osmotic tablet. Since drug release was independent of agitation rate, the prepared
trilayer osmotic tablets might exhibit a comparable in vitro/in vivo release profile.
10.10.3.3 Effect of orifice size on the drug release from optimized formulations:
To study the effect of orifice size on the drug release from the optimized formulations,
the in vitro analysis of the selected tablets formulations was carried out. Coated tablets were
selected from the optimized batch TT20 and orifices with varying sizes ( 0.5 mm, 1.0 mm,
1.5mm and 2.0mm) were drilled using a mechanical microdrill (Servo Product, Co., Pasadena,
CA), equipped with cobalt microdrill (Guhring, Germany) on both sides of the tablets. The
shape and diameter of the created orifice was visually inspected and measured using a 50 X
microscope. The data for the cumulative % drug release with varying orifice size for the selected
formulation TT20 is as shown in the table below:

Chapter 10 Trilayer osmotic drug delivery system
Osmotic Drug Delivery System Page 192
Table 78: Cumulative % drug release from optimized formulation TT20 with various orifice
sizes
Time
(hr)
cumulative % drug released
Orifice size (TT20)
0.2
mm
0.5
mm
1.0
mm
1.5
mm
2.0
mm
0 0.1 0 0.2 0.8 2.4
1 0.2 0.4 0.8 1.1 4.1
2 0.3 2.7 3.4 4.1 6.8
4 2.3 11.4 11.5 13.4 17.9
6 5.9 23.2 23.1 25.9 31.5
8 14.8 38.4 38.1 40.2 46.8
12 22.4 56.1 56.1 56.1 71.5
18 40.2 81.2 81.2 83.4 94.8
24 59.5 99.7 99.5 99.6 99.8
Figure 43: % cumulative release v/s Time (hr) plot for formulation TT20 to study the effect of orifice size on drug release

Chapter 10 Trilayer osmotic drug delivery system
Osmotic Drug Delivery System Page 193
As can be seen from the results of the above study of varying orifice sizes, it was observed that
there was no significant change in the drug release pattern with orifice size in the range of 0.5
mm to 1.5mm. However, as can be seen from the above observations, it was found that a
comparative higher release pattern and rapid release of drug was seen in tablets drilled with an
orifice of 2.0 mm. It was found that almost 100% drug was released around the 18th
hour and
hence a sustained release comparable to the theoretical target release profile was not achieved.
This may be due to the result of higher diffusion of fluids from the bigger orifice. On the other
hand, a low release rate and anomalous release were exhibited at an orifice diameter of 0.2 mm.
The drug or excipients granules in insoluble form may occlude such a small orifice, therefore,
leading to a low drug release rate.
Hence it was concluded that the release rates were independent of the orifice size in the range of
0.5mm to 1.5mm. However, a higher orifice size (2.0mm) or a lower orifice size (0.2mm) had a
significant influence on the release rate of drug from the osmotic drug delivery system.
10.10.4 Accelerated Stability studies of the optimized formulation for osmotic trilayer drug
delivery system:
The accelerated stability testing was performed on the selected formulation (TT20) which gave
the most optimum results amongst all the previous trial batch formulation. The test was carried
out by placing the tablets of each selected formula in closed glass container in an ALU ALU
Blister pack and stored in thermostatically controlled ovens adjusted at different temperatures
and humidity percentage, namely, 40⁰C/75%, 30⁰C/65% and 25⁰C/60% (maintained using a
saturated solution of NaCl) for a period of 3 months. The stored tablets were examined visually
for any changes in color and/or appearance every month. Also the average weight, hardness and
loss on drying of the selected batch formulations were determined at a period of 1 month for total
3 months. Three tablets were taken from the ovens after a period of 1 month for 3 months and
analyzed for the determination of cumulative % drug release. Limits were set for each of the
above parameter (i.e. average weight, hardness, loss on drying and cumulative % drug release)
using the ICH guidelines for accelerated stability studies.
The results of the optimized formulations TT20 after conducting accelerated stability studies for
3 months are as follows:
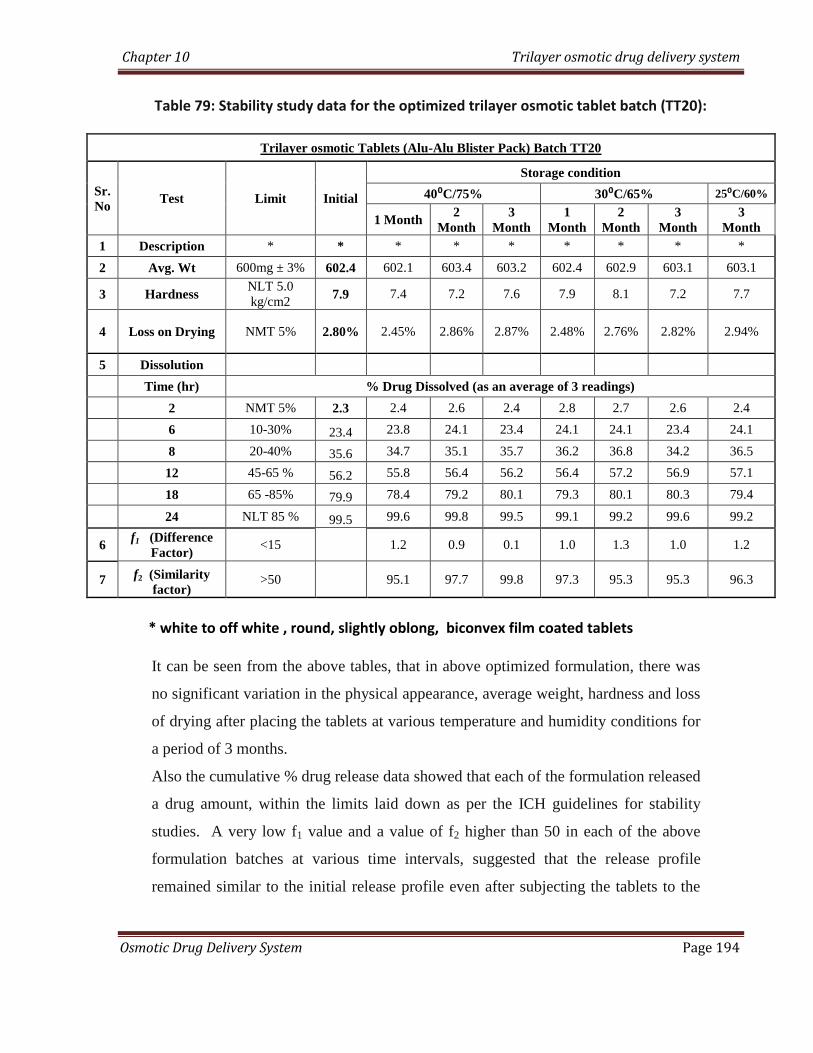
Chapter 10 Trilayer osmotic drug delivery system
Osmotic Drug Delivery System Page 194
Table 79: Stability study data for the optimized trilayer osmotic tablet batch (TT20):
Trilayer osmotic Tablets (Alu-Alu Blister Pack) Batch TT20
Sr.
No Test Limit Initial
Storage condition
40⁰C/75% 30⁰C/65% 25⁰C/60%
1 Month 2
Month
3
Month
1
Month
2
Month
3
Month
3
Month
1 Description * * * * * * * * *
2 Avg. Wt 600mg ± 3% 602.4 602.1 603.4 603.2 602.4 602.9 603.1 603.1
3 Hardness NLT 5.0
kg/cm2 7.9 7.4 7.2 7.6 7.9 8.1 7.2 7.7
4 Loss on Drying NMT 5% 2.80% 2.45% 2.86% 2.87% 2.48% 2.76% 2.82% 2.94%
5 Dissolution
Time (hr) % Drug Dissolved (as an average of 3 readings)
2 NMT 5% 2.3 2.4 2.6 2.4 2.8 2.7 2.6 2.4
6 10-30% 23.4 23.8 24.1 23.4 24.1 24.1 23.4 24.1
8 20-40% 35.6 34.7 35.1 35.7 36.2 36.8 34.2 36.5
12 45-65 % 56.2 55.8 56.4 56.2 56.4 57.2 56.9 57.1
18 65 -85% 79.9 78.4 79.2 80.1 79.3 80.1 80.3 79.4
24 NLT 85 % 99.5 99.6 99.8 99.5 99.1 99.2 99.6 99.2
6 f1 (Difference
Factor) <15
1.2 0.9 0.1 1.0 1.3 1.0 1.2
7 f2 (Similarity
factor) >50
95.1 97.7 99.8 97.3 95.3 95.3 96.3
* white to off white , round, slightly oblong, biconvex film coated tablets
It can be seen from the above tables, that in above optimized formulation, there was
no significant variation in the physical appearance, average weight, hardness and loss
of drying after placing the tablets at various temperature and humidity conditions for
a period of 3 months.
Also the cumulative % drug release data showed that each of the formulation released
a drug amount, within the limits laid down as per the ICH guidelines for stability
studies. A very low f1 value and a value of f2 higher than 50 in each of the above
formulation batches at various time intervals, suggested that the release profile
remained similar to the initial release profile even after subjecting the tablets to the

Chapter 10 Trilayer osmotic drug delivery system
Osmotic Drug Delivery System Page 195
above temperature and humidity parameters for a period of 3 months. Hence it was
concluded that the optimized formulation batches did not show any significant
change in their release profiles after 3 months duration under the above temperature
and humidity conditions.
Thus the optimized formulations could be considered stable for a period of 2 years.
CHAPTER 11
SUMMARY AND
CONCLUSIONS
Chapter 11 Summary and conclusions
Osmotic drug delivery systems Page 196
11.0 Summmary and conclusions:
The present work was aimed at formulating a solid dosage form system (tablets) for
Trimetazidine dihydrochloride using the principles of osmosis which will bring down its
dosing frequency to once a day and at the same time produce a zero-order release system. It
was planned to formulate the 3 types of osmotic drug delivery system viz. Monolayer
osmotic Tablets (Elementary osmotic pump), Bilayer osmotic tablets (Push-pull osmotic
pump) and trilayer osmotic tablets (Sandwitched osmotic tablet system).
11.1 Formulation of monolayer osmotic drug delivery system (Elementary osmotic
pump):
A monolayer osmotic tablet was formulated by coating the core tablet (containing 60
mg of drug and osmogen) with a semi permeable membrane to permit the penetration of
water and drilling an orifice which would permit the release of drug after development of
suitable osmotic pressure.
For formulating a monolayer osmotic tablet, initially core and coating feasibility trials
were carried out to select the best formulation for optimization study. Optimization study of
HPMC K4M, Carbopol 71G, Osmogen (Mannitol and sodium chloride) and coating
composition was done by varying the proportion of each in various formulations (MT1 to
MT20) and analysing the release profile kinetics. Comparison of the release profiles of each
formulations was made with the theoretically calculated target release profile using the f1
(Difference Factor) and f2 (Similarity factor). Formulation MT20 was selected as the final
optimized formulation for monolayer osmotic drug delivery system. It showed an almost
perfect zero order release (r2 = 0.995) and almost 100 % release after 24 hours. However
Chapter 11 Summary and conclusions
Osmotic drug delivery systems Page 197
there was a release of more than 7% of drug in the initial two hours and hence did not show a
lag phase which is desired in case of osmotic drug delivery systems. To achieve this lag
phase and to further fine tune the release characteristics and achieve desirable control over
the release kinetics, it was decided to formulate a bilayer osmotic drug delivery system.
11.2 Formulation of bilayer osmotic drug delivery system (Push-pull osmotic system):
A bilayer osmotic tablet was formulated by compressing two seperate layers viz a
drug layer and a push layer (osmogen). The compressed tablet was then coated with a
semipermeable membrane and an orifice of suitable size was drilled to permit the release of
drug.
Optimization study of HPMC K4M, Carbopol 71G, and Osmogen was done by
varying the proportion of each in various formulations (BT1 to BT20) and analysing the
release profile kinetics. Comparison of the release profiles of each formulations was made
with the theoretically calculated target release profile using the f1 (Difference Factor) and f2
(Similarity factor). Bilayer osmotic tablets showed better release kinetics as compared to the
monolayer osmotic tablets. However, formulation BT17 was selected as the final optimized
formulation for bilayer osmotic drug delivery system. It showed a good zero order release (r2
= 0.982) and almost 100 % release after 24 hours. Also it showed no release in the inital two
hours and hence we could achieve a desired inital lag phase of 2 hrs required for osmotic
drug delivery system. However the major drawback was the side identification of the drug
layer for drilling of orifice. A colorant (ferric oxide red) was added to the drug layer to help
in side identification for drilling of orifice, which gave a slightly bizarre look to the tablet.

Chapter 11 Summary and conclusions
Osmotic drug delivery systems Page 198
To further fine tune the release kinetics and eliminate the disadvantage of side identification,
it was decided to formulate a trilayer osmotic drug delivery system.
11.3 Formulation of trlayer osmotic drug delivery system (sandwitched osmotic tablet
system):
A trilayer osmotic tablet system was formulated by compressing two layers of drug
(30 mg each) on either side of a central push layer (osmogen). However compression of the
trilayer tablet was found to be a tedious and time consuming process as each layer weighing
200mg had to be individually filled in the die cavity. The tablet system was then coated with
a semipermeable membrane and orifices of specific sizes were drilled on both the sides of the
tablet; thus eliminating the problem of side identification.
Optimization study of HPMC K4M, Carbopol 71G, and Osmogen (in drug layer and
push layer) was done by varying the proportion of each in various formulations (TT1 to
TT21) and analysing the release profile kinetics. Comparison of the release profiles of each
formulations was made with the theoretically calculated target release profile using the f1
(Difference Factor) and f2 (Similarity factor). Trilayer osmotic tablets showed better release
kinetics as compared to the bilayer osmotic tablets. Formulation TT20 was selected as the
final optimized formulation for trilayer osmotic drug delivery system. It showed an almost
perfect zero order release (r2 = 0.9987) and almost 100 % release after 24 hours. Also it
showed no release in the inital two hours and hence we could achieve a desired inital lag
phase of 2 hrs required for osmotic drug delivery system. The major advantage achieved was
the elimination of side identification problem and hence no colorant was required to be added
in the formulation; which gave an aesthetic look to the tablet, instead of a multi colored
tablet.

Chapter 11 Summary and conclusions
Osmotic drug delivery systems Page 199
Thus we could conclude that if the compression process could be automated for a
trilayer osmotic tablet preparation, it could be the system of choice amongst all the three
forms of osmotic tablets, as it offered desirable release kinetics and showed no constraints of
side identification; which was seen with bilayer tablet formulations.
11.4 Effect of variables on release profiles of optimized formulations:
The optimized formulations (MT20, BT17 and TT20) were subjected to various
comparative tests to study the effect of variables on release profiles of the optimized
formulations. The effect of osmotically active dissolution medium, effect of agitation rate
and the effect of orifice diameter were studied.
11.4.1 Effect of Osmotically active Dissolution Medium on drug release:
To study the effect of osmotically active dissolution medium, the optimized
formulations were subjected to dissolution studies in alternative media at an interval of 8 hrs.
The dissolution study was conducted in water (0-8 h), 2.4 % w/w magnesium sulphate
solution in water (8-16 hr) and in water (17-24 hr) alternatively. A sharp retardation in the
drug release was observed when the tablets were kept in the 2.4 % w/w magnesium sulphate
solution in water; which showed that in water, effective osmotic pressure across the
membrane was obtained which led to high drug release rate. Pressure drop across the
membrane was very less in case of magnesium sulphate solution, which shows slow drug
release rate.
From above results it can be concluded that in case of the optimized formulations of osmotic
drug delivery system, the drug release rate is mainly contributed by osmotic pressure only.

Chapter 11 Summary and conclusions
Osmotic drug delivery systems Page 200
11.4.2 Effect of Agitation rate on drug release:
Optimized formulations (MT20, BT17 and TT20) were subjected to dissolution study
at different agitation rates. In the present investigation dissolution study was performed at
three different agitation rates. Agitation rates of 50, 100 and 150 rpm were selected for the
study.
No significant changes were observed during drug release study with agitation rate, which
strongly indicates that release of the drug from the system takes place mainly through
osmotic pressure generated within the system. Therefore, it might be predicted that the
mobility of the gastrointestinal tract hardly affected the drug release of the prepared osmotic
tablet. Since drug release was independent of agitation rate, the prepared osmotic tablets
might exhibit a comparable in vitro/in vivo release profile.
11.4.3 Effect of orifice size on the drug release from optimized formulations:
To study the effect of orifice size on the drug release from the optimized
formulations, the in vitro analysis of the selected tablets formulations was carried out.
Coated tablets were selected from each of the optimized batch and orifices with varying sizes
(0.5 mm, 1.0 mm, 1.5mm and 2.0mm) were drilled. It was observed that there was no
significant change in the drug release pattern with orifice size in the range of 0.5 mm to
1.5mm. However, it was found that a comparative higher release pattern and rapid release of
drug was seen in tablets drilled with an orifice of 2.0 mm. It was found that almost 100%
drug was released around the 18th
hour and hence a sustained release comparable to the
theoretical target release profile was not achieved. This may be due to the result of higher
diffusion of fluids from the bigger orifice. On the other hand, a low release rate and

Chapter 11 Summary and conclusions
Osmotic drug delivery systems Page 201
anomalous release were exhibited at an orifice diameter of 0.2 mm. The drug or excipients
granules in insoluble form may occlude such a small orifice, therefore, leading to a low drug
release rate.
Hence it was concluded that the release rates were independent of the orifice size in the range
of 0.5mm to 1.5mm. However, a higher orifice size (2.0mm) or a lower orifice size (0.2mm)
had a significant influence on the release rate of drug from the osmotic drug delivery system.
11.5 Accelerated stability study of optimized formulations:
The accelerated stability testing was performed on the selected formulas which gave the most
optimum results amongst all the previous trial batch formulation. The test was carried out by
placing the tablets of each selected formula in closed glass container in an ALU ALU Blister
pack and stored in thermostatically controlled ovens adjusted at different temperatures and
humidity percentage, namely, 40⁰C/75%, 30⁰C/65% and 25⁰C/60%
It was observed that there was no significant variation in the physical appearance, average
weight, hardness and loss of drying after placing the tablets at various temperature and
humidity conditions for a period of 3 months.
Also the cumulative % drug release data showed that each of the formulation released a drug
amount, within the limits laid down as per the ICH guidelines for stability studies. A very
low f1 value and a value of f2 higher than 50 in each of the formulation batches at various
time intervals, suggested that the release profile remained similar to the initial release profile
even after subjecting the tablets to the above temperature and humidity parameters for a
period of 3 months. Hence it was concluded that the optimized formulation batches did not

Chapter 11 Summary and conclusions
Osmotic drug delivery systems Page 202
show any significant change in their release profiles after 3 months duration under the above
temperature and humidity conditions.
Thus the optimized formulations could be considered stable for a period of 2 years.
It can thus be concluded that osmotic tablets systems could be used as a potential tool
for delivering zero-order release for highly water soluble drugs like Trimetazidine
dihydrochloride; which have a comparatively lower half-life. It was found to reduce the dose
dumping; as is the case with most sustained release matrix tablet systems and can
simultaneously reduce the dose frequency of the drug to once a day; thus providing a better
patient compliance.

CHAPTER 12
REFERENCES

Chapter 12 References
Osmotic Drug Delivery System Page 203
List of References:
[1] R.K. Verma, S. Garg, Current status of drug delivery technologies and future directions,
Pharm. Technol.-On Line (http: / /www.pharmaportal.com) 25 (2001) 1–14.
[2] F. Theeuwes, D.R. Swanson, G. Guittard, A. Ayer, S. Khanna, Osmotic delivery systems for
the beta-adrenoceptor antagonists metoprolol and oxprenolol: design and evaluation of systems
for once-daily administration, Br. J. Clin. Pharmacol. 19 (1985) 69S–76S.
[3] G. Santus, R.W. Baker, Osmotic drug delivery: A review of the patent literature, J. Control.
Release 35 (1995) 1–21.
[4] R.K.Verma, B. Mishra, S. Garg, Osmotically controlled oral drug delivery, Drug Dev. Ind.
Pharm. 26 (2000) 695–708.
[5] F. Theeuwes, Elementary osmotic pump, J. Pharm. Sci. 64 (1975) 1987–1991.
[6] R.L. Jerzewski, Y.W. Chien, Osmotic drug delivery, in: A. Kydonieus (Ed.), Treatise On
Controlled Drug Delivery: Fundamentals, Optimization, Application, Marcel Dekker, New York,
1992, pp. 225–253.
[7] P.S.L.Wong, B. Barclay, J.C. Deters, F. Theeuwes, Osmotic device with dual thermodynamic
activity, US patent 4,612,008, Sept. 16, 1986.
[8] R. Cortese, F. Theeuwes, Osmotic device with hydrogel driving member, US patent
4,327,725, May 4, 1982.
[9] D.R. Swanson, B.L. Barclay, P.S.L. Wong, F. Theeuwes, Nifedipine gastrointestinal
therapeutic system, Am. J. Med. 83 (Suppl. 6B) (1987) 3–9.
[10] F. Theeuwes, P.S.L.Wong, T.L. Burkoth, D.A. Fox, Osmotic systems for colon-targeted
drug delivery, in: P.R. Bieck(Ed.), Colonic Drug Absorption and Metabolism, Marcel Dekker,
New York, 1993, pp. 137–158.

Chapter 12 References
Osmotic Drug Delivery System Page 204
[11] L. Dong, K. Shafi, J. Wan, P. Wong, A novel osmotic delivery system: L-OROS Softcap, in:
Proceedings of the International Symposium on Controlled Release of Bioactive Materials, Paris
(July), 2000, CD ROM.
[12] L. Dong, P. Wong, S. Espinal, L-OROS HARDCAP: A new osmotic delivery system for
controlled release of liquid formulation, in: Proceedings of the International Symposium on
Controlled Release of Bioactive Materials, San Diego (June), 2001, CD-ROM.
[13] G.M. Zentner, G.S. Rork, K.J. Himmelstein, The controlled porosity osmotic pump, J.
Control. Release 1 (1985) 269–282.
[14] G.M. Zentner, G.S. Rork, K.J. Himmelstein, Osmotic flow through controlled porosity
films: An approach to delivery of water soluble compounds, J. Control. Release 2 (1985) 217–
229.
[15] G.M. Zentner, G.S. Rork, K.J. Himmelstein, Controlled porosity osmotic pump, US patent
4,968,507, Nov. 6, 1990
.
[16] P. Schultz, P. Kleinebudde, A new multiparticulate delayed release system. Part I.
Dissolution properties and release mechanism, J. Control. Release 47 (1997) 181–189.
[17] P. Schultz, I. Tho, P. Kleinebudde, A new multiparticulate delayed release system. Part II.
Coating formulation and properties of free films, J. Control. Release 47 (1997) 191–199.
[18] J.R. Cardinal, S.M. Herbig, R.W. Korsmeyer, J. Lo, K.L. Smith, A.G. Thombre, Use of
asymmetric membranes in delivery devices, US patent 5,612,059, March 18, 1997.
[19] J.R. Cardinal, S.M. Herbig, R.W. Korsmeyer, J. Lo, K.L. Smith, A.G. Thombre,
Asymmetric membranes in delivery devices, US patent 5,698,220, Dec. 16, 1997.
[20] S.M. Herbig, J.R. Cardinal, R.W. Korsmeyer, K.L. Smith, Asymmetric-membrane tablet
coatings for osmotic drug delivery, J. Control. Release 35 (1995) 127–136.
[21] A.G. Thombre, J.R. Cardinal, A.R. DeNoto, S.M. Herbig, K.L. Smith, Asymmetric
membrane capsules for osmotic drug delivery I. Development of a manufacturing process, J.
Control. Release 57 (1999) 55–64.
Chapter 12 References
Osmotic Drug Delivery System Page 205
[22] A.G. Thombre, J.R. Cardinal, A.R. DeNoto, D.C. Gibbes, Asymmetric membrane capsules
for osmotic drug delivery II. In vitro and in vivo drug release performance, J. Control. Release
57 (1999) 65–73.
[23] L. Liu, J. Ku, G. Khang, B. Lee, J.M. Rhee, H.B. Lee, Nifedipine controlled delivery by
sandwiched osmotic tablet system, J. Control. Release 68 (2000) 145–156.
[24] G.A. McClelland, S.C. Sutton, K. Engle, G.M. Zentner, The solubility-modulated osmotic
pump: In vitro/ in vivo release of diltiazem hydrochloride, Pharm. Res. 8 (1991) 88–92.
[25] G.M. Zentner, G.A. McClelland, S.C. Sutton, Controlled porosity solubility- and resin-
modulated osmotic drug delivery systems for release of diltiazem hydrochloride, J. Control.
Release 16 (1991) 237–244.
[26] G.A. McClelland, G.M. Zentner, Solubility modulated drug delivery system, US patent
4,946,686, Aug. 7, 1990.
[27] G.M. Zentner, G.A. McClelland, Solubility modulated drug delivery device, US patent
4,994,273, Feb. 19, 1991.
[28] A.D. Ayer, P.S.L. Wong, Dosage form comprising solubility regulating member, US patent
4,755,180, July 5, 1988.
[29] D. Swanson, D. Edgren, Osmotic device that improves delivery properties of agent in situ,
US patent 4,326,525, April 27, 1982.
[30] R.K. Verma, B. Mishra, Studies on formulation and evaluation of oral osmotic pumps of
nimesulide, Pharmazie 54 (1999) 74–75.
[31] P.R. Magruder, B. Barclay, P.S.L. Wong, F. Theeuwes, Composition comprising
salbutamol, US patent 4,751,071, June 14, 1988.
[32] P.R. Magruder, B. Barclay, P.S.L. Wong, F. Theeuwes, Constant release system with pulsed
release, US patent 4,777,049, Oct. 11, 1988.
[33] P.R. Magruder, B. Barclay, P.S.L. Wong, F. Theeuwes, Composition comprising a
therapeutic agent and a modulating agent, US patent 4,851,229, July 25, 1989.

Chapter 12 References
Osmotic Drug Delivery System Page 206
[34] A.G. Thombre, Delivery device having encapsulated excipients, US patent 5,697,922, Dec.
16, 1997.
[35] A.G. Thombre, A.R. DeNoto, D.C. Gibbes, Delivery of glipizide from asymmetric
membrane capsules using encapsulated excipients, J. Control. Release 60 (1999) 333– 341.
[36] S.C. Khanna, Therapeutic system for sparingly soluble active ingredients, US patent
4,992,278, Feb. 12, 1991.
[37] G.V. Guittard, F. Jao, S.M. Marks, D.J. Kidney, F. Gumucio, Dosage form comprising
oxybutynin, US patent 5,840,754, Nov. 24, 1998.
[38] A.L. Kuczynski, A.D. Ayer, P.S.L.Wong, Oral hypoglycemic glipizide granulation, U.S.
patent 5,024,843, June 18, 1991.
[39] A.L. Kuczynski, A.D. Ayer, P.S.L. Wong, Delivery system for administration blood glucose
lowering drug, US patent 5,091,190, Feb. 25, 1992.
[40] A.L. Kuczynski, A.D. Ayer, P.S.L. Wong, Dosage form for administering oral
hypoglycemic glipizide, US patent 5,545,413, Aug. 13, 1996.
[41] A.L. Kuczynski, A.D. Ayer, P.S.L. Wong, Method for lowering blood glucose, US patent
5,591,454, Jan. 7, 1997.
[42] F. Theeuwes, Osmotic dispenser with gas generating means, US patent 4,036,228, July 19,
1977.
[43] K. Okimoto, R.A. Rajewski, V.J. Stella, Release of testosterone from an osmotic pump
tablet utilizing (SBE)- -b- 7mCD as both a solubilizing and an osmotic pump agent, J. Control.
Release 58 (1999) 29–38.
[44] K. Okimoto, M. Miyake, N. Ohnishi, R.A. Rajewski, V.J. Stella, T. Irie, K. Uekama, Design
and evaluation of an osmotic pump tablet (OPT) for prednisolone, a poorly water soluble drug,
using (SBE)- -b-CD, Pharm. Res. 15 (1998) 1562–1568.
Chapter 12 References
Osmotic Drug Delivery System Page 207
[45] K. Okimoto, A. Ohike, R. Ibuki, O. Aoki, N. Ohnishi, T. Irie, K. Uekama, R.A. Rajewski,
V.J. Stella, Design and evaluation of an osmotic pump tablet (OPT) for chlorpromazine using
(SBE)- -b-CD, Pharm. Res. 16 (1999) 549–554.
[46] A.D. Koparkar, S.B. Shah, Oral osmotic system for slightly soluble active agents, US patent
5,284,662, Feb. 8, 1994.
[47] W.J. Curatolo, Dispensing devices powered by lyotropic liquid crystals, US patent
5,108,756, April 28, 1992.
[48] W.J. Curatolo, Dispensing devices powered by lyotropic liquid crystals, US patent
5,030,452, Jan. 12, 1989.
[49] E.M. Rudnic, B.A. Burnside, H.H. Flanner, S.E. Wassink, R.A. Couch, J.E. Pinkett,
Osmotic drug delivery system, US patent 6,110,498, Aug. 29, 2000.
[50] L. Liu, G. Khang, J.M. Rhee, H.B. Lee, Monolithic osmotic tablet system for nifedipine
delivery, J. Control. Release 67 (2000) 309–322.
[51] F. Theeuwes, D. Swanson, P. Wong, P. Bonsen, V. Place, K.Heimlich, K.C. Kwan,
Elementary osmotic pump for indomethacin, J. Pharm. Sci. 72 (1983) 253–258.
[52] N. Ozdemir, J. Sahin, Design of a controlled release osmotic pump system of ibuprofen, Int.
J. Pharm. 158 (1997) 91–97.
[53] S. Mohammadi-Samani, M. Adrangui, M.R. Siahi-Shadbad, A. Nokhodchi, An approach to
controlled-release dosage form of propranolol hydrochloride, Drug Dev. Ind. Pharm. 26 (2000)
91–94.
[54] S.V. Sastry, I.K. Reddy, M.A. Khan, Atenolol gastrointestinal therapeutic system:
optimization of formulation variables using response surface methodology, J. Control. Release
45 (1997) 121–130.
[55] S.V. Sastry, M.D. DeGennaro, I.K. Reddy, M.A. Khan, Atenolol gastrointestinal therapeutic
system. I. Screening of formulation variables, Drug Dev. Ind. Pharm. 23 (1997) 157–165.
Chapter 12 References
Osmotic Drug Delivery System Page 208
[56] S.V. Sastry, M.A. Khan, Aqueous-based polymeric dispersion: Face-centered cubic design
for the development of atenolol gastrointestinal therapeutic system, Pharm. Dev. Tech. 3 (1998)
423–432.
[57] F. Theeuwes, R.J. Saunders, W.S. Mefford, Process for forming outlet passageways in pills
using a laser, US patent 4,088,864, May 9, 1978.
[58] C. Chen, D. Lee, J. Xie, Controlled release formulation for water insoluble drugs in which a
passageway is formed in situ, US patent 5,736,159, April 7, 1998.
[59] A.D. Ayer, H.H. Balkie, Method and apparatus for forming a hole in a drug dispensing
device, US patent 5,071,607, Dec.10, 1991.
[60] J.G. Luschen, Process for forming a passageway in an osmotic device, US patent 4,271,113,
June 2, 1981.
[61] J.L. Haslam, G.S. Rork, Controlled porosity osmotic pump, US patent 4,880,631, Nov. 14,
1989.
[62] L.E. Appel, G.M. Zentner, Use of modified ethyl cellulose lattices for microporous coating
of osmotic tablets, Pharm.Res. 8 (1991) 600–604.
[63] M. Kelbert, S.R. Bechard, Evaluation of cellulose acetate (CA) latex as coating material for
controlled release products, Drug Dev. Ind. Pharm. 18 (1992) 519–538.
[64] F. Theeuwes, A.D. Ayer, Osmotic devices having composite walls, US patent 4,077,407,
March 7, 1978.
[65] F. Theeuwes, A.D. Ayer, Osmotic system having laminar arrangement for programming
delivery of active agent, US patent 4,008,719, Feb. 22, 1977.
[66] G.V. Guittard, J.C. Deters, F. Theeuwes, R. Cortese, Osmotic system with instant drug
availability, US patent 4,673, 405, June 16, 1987.
[67] L.A. Seminoff, G.M. Zentner, Cellulosic coating, US patent 5,126,146, June 30, 1992.

Chapter 12 References
Osmotic Drug Delivery System Page 209
[68] J.L. Jensen, L.E. Appel, J.H. Clair, G.M. Zentner, Variables that affect the mechanism of
drug release from osmotic pumps coated with acrylate /methacrylate copolymer latexes, J.
Pharm. Sci. 84 (1995) 530–533.
[69] J. Yuan, S.H. Wu, Sustained-release tablets via direct compression: A feasibility study using
cellulose acetate and cellulose acetate butyrate, Pharm. Tech. 24 (2000) 92–106.
[70] B. Lindstedt, G. Ragnarsson, J. Hjartstam, Osmotic pumping as a release mechanism for
membrane-coated drug formulations, Int. J. Pharm. 56 (1989) 261–268.
[71] B. Lindstedt, M. Sjorberg, J. Hjartstam, Osmotic pumping release from KCl tablets coated
with porous and non porous ethyl cellulose, Int. J. Pharm. 67 (1991) 21–27.
[72] A.G. Ozturk, S.S. Ozturk, B.O. Palsson, T.A.Wheatley, J.B.Dressman, Mechanism of
release from pellets coated with an ethylcellulose-based film, J. Control. Release 14 (1990) 203–
213.
[73] J. Guo, Effects of plasticizers on water permeation and mechanical properties of cellulose
acetate: Antiplasticization in slightly plasticized polymer film, Drug Dev. Ind. Pharm. 19 (1993)
1541–1555.
[74] J. Guo, An investigation into the formation of plasticizer channels in plasticized polymer
films, Drug Dev. Ind. Pharm. 20 (1994) 1883–1893.
[75] L. Liu, G. Khang, J.M. Rhee, H.B. Lee, Preparation and characterization of cellulose acetate
membrane for monolithic tablet, Korea Polym. J. 7 (1999) 289–296.
[76] K. Okimoto, A. Ohike, R. Ibuki, O. Aoki, N. Ohnishi, R.A. Rajewski, V.J. Stella, T. Irie, K.
Uekama, Factors affecting membrane-controlled drug release for an osmotic pump tablet (OPT)
utilizing (SBE)- -b-CD as both a solubilizer and osmotic agent, J. Control. Release 60 (1999)
311–319.
[77] C. Bindschaedler, R. Gurny, E. Doelker, Mechanically strong films produced from cellulose
acetate latexes, J. Pharm.Pharmacol. 39 (1987) 335–338.
[78] C. Bindschaedler, R. Gurny, E. Doelker, Osmotic water transport through cellulose acetate

Chapter 12 References
Osmotic Drug Delivery System Page 210
membranes produced from a latex system, J. Pharm. Sci. 76 (1987) 455–460.
[79] B. Eckenhoff, F. Theeuwes, J. Urquhart, Osmotically actuated dosage forms for rate-
controlled drug delivery, Pharm.Tech. 5 (1981) 35–44.
[80] A. Amkraut, J.B. Eckenhoff, K. Nichols, Osmotic delivery of peptides and macromolecules,
Adv. Drug Deliv. Rev. 4 (1990) 255–276.
[81] L. Perkins, C. Peer, V. Fleming, Pumps /osmotic-alzet system, in: E. Mathiowitz (Ed.),
Encyclopedia of Controlled Drug Delivery,Vol. 2,Wiley, New York, 1999, pp. 900–906.
[82] J. Magruder, Pumps /osmotic-VITS veterinary implant, in: E. Mathiowitz (Ed.),
Encyclopedia of Controlled Drug Delivery, Vol. 2, Wiley, New York, 1999, pp. 906–909.
[83] J.C. Wright, C.L. Stevenson, G.R. Stewart, Pumps /osmotic- DUROS osmotic implant for
humans, in: E. Mathiowitz (Ed.), Encyclopedia of Controlled Drug Delivery, Vol. 2, Wiley, New
York, 1999, pp. 909–915.
[84] J. Wright, Pumps /osmotic-ruminal osmotic bolus, in: E.Mathiowitz (Ed.), Encyclopedia of
Controlled Drug Delivery, Vol. 2, Wiley, New York, 1999, pp. 915–920.
[85] Theeuwees F., Swanson D., Wong P., et al. Elementary osmotic pump for indomethacin. J.
Pharma Sci. 1983; 72(3): 253-258
[86] Theeuwes, F., Swanson, D. R., Guittard, G., Ayer, A. & Khanna, S. (1985). Osmotic
delivery systemfor the P-adrenoceptor antagonists, metoprolol and oxprenolol: design and
evaluation of systems
for once-daily administration. Br. J. clin. Pharmac., 19, 69S-76S
[87] Theeuwes F., et al. U.S.Patent 4455143 (1984).
[88] Gaylen Zentner M., Gerald S. Rork and Kenneth J. Himmerstein. THE CONTROLLED
POROSITY OSMOTIC PUMP. J. Control. Rel. 1985; 1: 269-282.
[89] C. Bindschaedler*, R. Gurny and E. Doelker; OSMOTICALLY CONTROLLED DRUG
DELIVERY SYSTEMS PRODUCED FROM ORGANIC SOLUTIONS AND AQUEOUS
DISPERSIONS OF CELLULOSE ACETATE; Journal of Controlled Release, 4 (1986) 203-212

Chapter 12 References
Osmotic Drug Delivery System Page 211
[90] Haslem J, Rork GS. Controlled porosity osmotic pump. US Patent 488063, 1989
[91] Edgren F., et al. U.S.Patent 4693886 (1990)
[92] R. Sutinen ,A. Urtti, R. Miettunen, P. Paronen; Water-activated and pH-controlled release of
weak bases from silicone reservoir devices; International journal of Pharmaceutics, Volume 62,
Issues 2-3, 31 July 1990, Pages 113-118.
[93] Deters JC. US pat. Appl, 1994
[94] Lindstedt B. Int. J. Pharm. 1994, 18(3), 227.
[95] Brian G Amsden; Review of osmotic pressure driven release of proteins
frommonolithic devices.
J Pharm Pharm Sci 10(2):129-43 (2007) PMID 17706172
[96] Rafi Chapanian, Man Y Tse and Brian G Amsden; Osmotic release of bioactive VEGF from
biodegradable elastomer monoliths is the same in vivo as in vitro; J Pharm Sci; PMID 21976136
[97] A.D. Koparkar and S. B. Shah. Oral osmotic system for slightly soluble active agents. US
Patent 5284662; 1994
[98] PSL Wong, F. Theeuwes, S.D. Larsen and LC Dong. Osmotic device for delayed delivery
of
agent. US Patent 5531736; 1996
[99] S.P. Vyas, R. Guleria, R. Singh; Design and development of an elementary osmotic pump
bearing Ciprofloxacin HCl; East Pharm,1995; vol. 38, pp. 133-135
[100] P. Schultz and P. Kleinebudde. A new multiparticulate delayed release system. Part I:
Dissolution properties and release mechanism, J. Control. Release, 47, 181-189; 1997
[101] Wright JC, Leonard ST, Stevenson CL, Beck JC, Chen G, Jao RM, Johnson PA, Leonard
J, Skowronski RJ. An in vivo/in vitro comparison with a leuprolide osmotic implant for the
treatment of prostate cancer; J Control Rel. 2001; 75:1-10.

Chapter 12 References
Osmotic Drug Delivery System Page 212
[102] S.M. Herbig, J.R. Cardinal, R.W. Korsmeyer and K.L. Smith. Asymmetric -membrane
tablet coatings for osmotic drug delivery, J. Control. Release, 35, 127-136; 1995
[103] Lee Y.B, Choi K.V; Formulation and evaluation of orodispersible tablet of metoprolol
tartarate using osmosis; International Journal of Pharmaceutical Sciences; 1998; 24; 175-177.
[104] Paul R. Magruder, Brian Barclay, Patrick S. L. Wong, Felix Theeuwes; US Patents no.
4,751,071, June 14, 1988.
[105] S.M. Herbig ,A.G. Thombre, J.R. Cardinal, A.R. DeNoto, and K.L. Smith. Asymmetric
membrane capsules for osmotic drug delivery I. Development of a manufacturing process, J.
Control. Release, 57, 55-64; 1999.
[106] L. Liu, J. Ku, G. Khang, B. Lee and J.M. Rhee. Nifedipine controlled delivery by
sandwiched
osmotic tablet system, J. Control. Release, 68, 145-156; 2000
[107] En-Xian Lu, Zhi-Qiang Jiang, Qi-Zhi Zhang, Xin-Guo Jiang; A water-insoluble drug
monolithic osmotic tablet system utilizing gum arabic as an osmotic, suspending and expanding
agent; Journal of Controlled Release 92; (2003); 375– 382.
[108] D. Prabakaran, Paramjit Singh, Parijat Kanaujia, Suresh P. Vyas; Effect of hydrophilic
polymers on the release of diltiazem hydrochloride from elementary osmotic pumps;
International Journal of Pharmaceutics; 259 (2003); 173–179
[109] MEENA RANI, RAHUL SURANA; Development and biopharmaceutical evaluation of
osmotic pump tablets for controlled delivery of diclofenac sodium; Acta Pharm.;53 (2003); 263–
273
[110] D. Prabakaran, Paramjit Singh, Parijat Kanaujia, Suresh P. Vyas; Effect of hydrophilic
polymers on the release of diltiazem hydrochloride from elementary osmotic pumps;
International Journal of Pharmaceutics; 259 (2003); 173–179
[111] Longxiao Liu, Binjie Che; Preparation of monolithic osmotic pump system by coating
the indented core tablet; European Journal of Pharmaceutics and Biopharmaceutics; 64 (2006);
180–184.
[112] Teunissen M.W.E, Effect of cimetidine on steady state concentration and metabolite
formation from antipyrine infused with a rectal osmotic pump; European Journal of Clinical
Pharmacology; 1985; 28; 681-684.
Chapter 12 References
Osmotic Drug Delivery System Page 213
[113] G. van den Berg, F. van Steveninck, J. M. Gubbens-Stibbe, H. C. Schoemaker, A. G. de
Boer, and A. F. Cohen; Influence of food on the bioavailability of metoprolol from an OROS
system; a study in healthy volunteers; Eur J Clin Pharmacol (1990) ; 39:315-316.
[114] Sapna N. Makhija, Pradeep R. Vavia; Controlled porosity osmotic pump-based controlled
release systems of pseudoephedrine I. Cellulose acetate as a semipermeable membrane; Journal
of Controlled Release 89 (2003) 5–18.
[115] Xing Liu,Dawei Chen and Ruhua Zhang; Evaluation of Monolithic Osmotic Tablet System
for
Nifedipine Delivery In Vitro and In Vivo; DRUG DEVELOPMENT AND INDUSTRIAL
PHARMACY; Vol. 29, No. 7, pp. 813–819, 2003
[116] Nurten Ozdemir, Jfilide Sahin; Design of a controlled release osmotic pump system of
ibuprofen; International Journal of Pharmaceutics; 158 (1997); 91- 97.
[117] N. Ramakrishna and B. Mishra; Plasticizer Effect and Comparative Evaluation of
Cellulose Acetate and Ethylcellulose–HPMC Combination Coatings as Semipermeable
Membranes for Oral Osmotic Pumps of Naproxen Sodium; Drug Development and Industrial
Pharmacy, 28(4), 403–412 (2002).
[118] S. Mohammadi-Samani; An Approach to Controlled-Release Dosage Form of Propranolol
Hydrochloride; Drug Development and Industrial Pharmacy, 26(1), 91–94 (2000)
[119] Yong Gan, Weisan Pan, Mingchun Wei, and Ruhua Zhang; Cyclodextrin Complex
Osmotic Tablet for Glipizide Delivery; DRUG DEVELOPMENT AND INDUSTRIAL
PHARMACY
Vol. 28, No. 8, pp. 1015–1021, 2002.
[120] Amir M. Razaghi; Release of Cyclobenzaprine Hydrochloride from Osmotically
Rupturable Tablets; Drug Development and Industrial Pharmacy, 28(6), 695–701 (2002).
[121] Amir M. Razaghi; Investigation of Cyclobenzaprine Hydrochloride Release from Oral
Osmotic
Delivery Systems Containing a Water-Swellable Polymer; Drug Development and Industrial
Pharmacy, 28(6), 631–639 (2002)

Chapter 12 References
Osmotic Drug Delivery System Page 214
[122] Herbert A. Liberman and Leon Lachman, “The Theory and Practice of Industrial
Pharmacy”, IIInd
Edition, Verghese Publication House,171,293
[123] ICH topic 8 Pharmaceutical guidelines, Note for Guidence on Pharmaceutical
Developments, (EMEA/CHMP167068/2004)
[124] ICH Q1A (R2), Stability Testing Guidelines, Stability testing of a new drug product and
new drug substance.
[125] Indian Pharmacopoeia, Vol. 2, Controlled of Publication, Delhi, 1996, 625
[126] McClellan KJ, Plosker GL. Trimetazidine. A review of its use in stable angina pectoris and
other coronary conditions. Drugs. 1999; 58(1):143–57.
[127] Raymond C. Rowe, Paul J. Sheskey and Sian C. Owen; “Handbook of Pharmaceutical
Excipients” 5th
edition, Pharmaceutical Press.
[128] ICH guide lines for Validation of analytical method, “note for guidance on validation of
analytical procedures: text and methodology (CPMP/ICH/381/95)” Eropience Medicines
Agency.
[129] United State Pharmacopoeias U.S.P. 2004, “The official Compendia of Standard” Asian
edition
[130] INTERNATIONAL CONFERENCE ON HARMONISATION OF TECHNICAL
REQUIREMENTS FOR REGISTRATION OF PHARMACEUTICALS FOR HUMAN USE;
ICH HARMONISED TRIPARTITE GUIDELINE; Current Step 4 version dated 10 November
2000
[131] Arthur Owen Bentley and E. Rawlins, Bentley’s Textbook of Pharmaceutics, 8th edition,
Baillidere Tindall (1987); 376.

Errata
Osmotic Drug Delivery System Page 215

Errata
Osmotic Drug Delivery System Page 216