savills world /2014 p10 p12 p14...
TRANSCRIPT

STREETS OF GOLDThe winners and losers in our exclusive world cities index
SAVILLS WORLD RESEARCHh1/2014
Real estate costs of living and working around the world
Cities12
Value judgementWhich world property markets have become overheated? p12
The big pictureThe challenges and opportunities for global real estate investors. p14
Character buildingWhy a city’s success relies on its unique layout and urban fabric. p10
01 Cover V2 Savills World Cities14.indd 1 24/03/2014 20:55

2
Welcome to the new-look issue of this, our sixth survey of real estate in world cities. Welcome as well to Rio de Janeiro and Dubai, which have joined the 10 original cities this year to represent
a growing interest by real estate investors in Latin America and the Middle East. � e increasing importance of these property markets within their global region and their prominence on the world stage have earned them closer scrutiny in these pages.
Our defi nition of a world city is not only based on size or economic prosperity, but also other less tangible factors, such as fame, prominence, international reach and ‘investability’, which are not revealed by population and GDP fi gures alone. (By those measures, our index would be dominated by second-tier Chinese cities and sprawling US conurbations). We are interested in centres of human endeavour and innovation that attract international investors, particularly in real estate, over and above what might otherwise be expected due to socio-economic and geo-demographic factors alone.
� is search for city ‘je ne sais quoi’ is illustrated in ‘� e Big Picture’ feature (page 14) by the reference we have made to city prominence and international visitors, as well as global competitiveness and connectivity rankings. Other organisations also search for this city ‘X factor’. For example, six of our world cities have been, or will be, host to the Olympic games.
It is interesting that 10 of our 12 cities have origins, sometimes ancient, as trading ports and harbours. While Moscow and Paris started life as more inward-looking river crossings and defensive sites, it is notable that they too lay on major trade routes.
All this leads us to conclude that it is often a cosmopolitan nature and an international outlook that makes cities globally investable and prosperous. Real estate purchase is an important element of inward investment as individuals and entities seek to own a piece of the world rather than just a piece of a particular country. Successful cities will continue to recognise this, while the imposition of long-term restrictions on international participation will risk damaging a city’s world status.
WELCOME
‘We are interested in centres of innovation that attract investors’
YOLANDE BARNES Director, Savills World Research [email protected]: @Yolande_Barnes
Spring 2014 savills.com
The city X factor
02 Welcome V2 Savills World Cities14.indd 2 24/03/2014 20:57

Spring 2014 savills.com
3
CONTENTS
TOPLINEFrom residential to commercial, we highlight the key trends that are impacting property markets
TAKING THE TEMPERATURE Have global property markets become overheated? We look at what’s hot and what’s not
URBAN IDENTITY How street patterns, architecture and urban fabric can have a direct impact on the success of a city
SAVILLS CONTACTS With over 500 of� ces and associates around the world, Savills is perfectly located for all your real estate needs
WORLD CITIES INDEXAn exclusive insight into the property markets of the world’s most dynamic and in� uential cities
4-5 6-9 10-11
12-13 16-25
27
12 CITIES ONLINE For additional content, including a video presentation, please visit: www.savills.com/twelvecities
In order truly to compare the cost of residential and commercial real estate across different global cities, we use the Savills Executive Unit (SEU), which measures the cost of housing an identical group of people living and working in different countries.
The people who make up our SEU include one middle-aged expat CEO, one senior expat director, a locally employed director and four locally employed
administrative staff. They each live in different types of household and each member of the group chooses different types of locations and different types of property in which to live.
To measure of� ce costs, we place the same seven people in an of� ce of a small � nancial services � rm and again in a creative start-up – each located in the most appropriate district for their industry type.
RESEARCH METHODOLOGY
26
OUTLOOK What does the future hold for property? We predict how the global market will shape up
CO
VE
R: JA
SO
N H
AW
KE
S
THE BIG PICTUREFocusing on the challenges and opportunities faced by real estate investors around the globe
COUNTING THE COSTCombined live/work real estate costs reveal the true price of relocating an employee to 12 world cities
14-15
03 Contents Savills World Cities14.indd 3 21/03/2014 06:35

4
Spring 2014 savills.com
COMMERCIAL
Urban impulseCreative companies are moving out of the suburbs and into city centres
Across the globe young, footloose, creative people are escaping the suburbs and moving to urban centres. � e tech industry is no
exception. Silicon Valley may be the world’s premier tech centre, but in recent years Valley fi rms have sought increasing amounts of space in downtown San Francisco. Wireless systems, the cloud and fl exible working practices mean that major conglomerates no longer need huge offi ces for servers and staff – smaller units are just as viable.
Vibrant, mixed-use communities are at the heart of the new tech industry zeitgeist (see fi g.1). � e exchange of information and ideas is central to any creative industry, and tech is no exception. Creative clusters allow innovation to thrive. But it is not just innovation within a single company that is productive, the innovation of whole industries and the wider creative community makes a diff erence. � is means the human interaction allowed by cities has become a key attraction in the search for workspaces by tech companies. Cafés, bars, shops, a variety of housing and low-cost offi ce space provide the real estate foundation they seek.
While the city trend is shaping tech companies, the tech trend is also shaping cities. In New York, the tech industry is the second biggest employer behind fi nance and real estate, accounting for a third of private sector job growth since 2007. � e growth in the tech industry has gone hand in hand with the city’s urban renaissance (see page 19).
Major global players, such as Google or Amazon, sit alongside small start-ups and more established medium-sized fi rms in newly regenerated locations. � ese companies are fast growing and seek fl exible, non-traditional offi ce space, pushing up rents in
creative clusters faster than in more traditional offi ce districts in some locations
In New York, rents for the space favoured by tech and creative fi rms are up 33% from a December 2010 low, compared to 20% for fi nancial offi ce space. In London, the city’s major landlords are actively profi ling their stock to appeal to this growth sector, while Singapore’s ‘shophouses’ are proving attractive to tech start-ups looking for cheaper alternative space and have shown very high rental and capital growth.
Growing tech cities that off er a vibrant, creative urban scene will have a signifi cant advantage in the world city race and should show superior real estate growth.
INVESTMENT
New money
Ultra-wealthy individuals are transforming investment behaviour
Over half of global big ticket real estate deals are now led by private wealth, such as sovereign wealth funds, private banks,
family offi ces, wealth managers and private offi ces, rather than public companies and investing institutions.
Real estate currently accounts for around a fi fth of the invested wealth of ultra high net worth individuals (UHNWIs) and the use of private equity in major property deals worth at least US$10 million has nearly trebled since 2009. Around 3%, or US$5.3 trillion, of the world’s total real estate value is owned directly by 200,000 of the wealthiest individuals (0.003% of the global population).
� ese private owners are also very active in real estate that is held indirectly, through private companies and other entities, making them increasingly central to traded investable property. Since the debt crisis they have stepped into the property deals that corporate bankers have deserted.
Key trends that are impacting on world city property markets
CITY
Dubai Silicon Oasis
Hong Kong Cyberport/ HK Science Park
London Silicon Roundabout
Moscow Silicon Sloboda
Mumbai The Knowledge Corridor
New York Silicon Alley
Paris La Halle Freyssinet
Rio de Janeiro Silicon Beach
Shanghai KIC (Knowledge and Innovation Community)
Singapore Singapore Science Park
Sydney SUPER Digital Precinct
Tokyo Bit Valley
FIG. 1: Location of tech hubs
in world cities
TECH HUB
To Buy To Occupy To Sell
0%
20%
10%
5%
15%
25%
30%
FIG. 2: Cost of buying,
occupying and selling
a £2m residential property
Percentage of total property value.Overseas buyer holding for fi ve years as an individual.
Source: Savills World Research
Sin
gap
ore
Ho
ng
Ko
ng
New
Yo
rk
Lo
nd
on
TOPLINE
04-05 Topline V2 Savills World Cities14.indd 4 24/03/2014 20:58

5
Spring 2014 savills.com
Identifying the wealth factorValue of real estate held by the world’s richest buyers
$180trnThe total value of the world’s real estate
$5.3trnValue of real estate that is held by UHNWIs
199,235Total number of UHNWIs
$26.5mAverage value of real estate held by UHNWIs
Source: Savills World Research
and Wealth-X
� e willingness of private wealth to take the place of debt fi nance, or to take a higher-risk development position, is now making the diff erence between deals done or schemes mothballed. Around 35% of global big ticket deals (US$10 million-plus) in 2012 were only possible because of private funding.
� e behaviour of private wealth has the power to transform cities. Diff erent investment criteria mean real estate projects that would not otherwise have been funded by corporate investors may now be possible. Convincing a private individual of a new development or regeneration story may be easier than persuading a corporate investment committee to do something new. At present, the big private investors favour urban real estate. � eir preferences and behaviour will shape our global cities and increasingly determine which ones will be called ‘world cities’ in the future.
RESIDENTIAL
Cooling medicineMeasures to restrict property speculation have had mixed results
Residential property, an investible asset class in world cities, has attracted huge volumes of domestic and overseas investment.
In some cities, the weight of money pressing on these markets means demand outstrips supply, pushing prices out of the reach of many local residents. � e response has varied, but some governments have introduced taxes and duties to cool the market.
In Hong Kong and Singapore, the eff ects of new wealth generated in mainland China have led to the most penal charges – which appear to be working. Non-resident buyers in Hong Kong pay an additional 15% stamp duty. Coupled with the doubling of standard stamp duty in 2013 (8.5% on property over HK$2 million) and duties of between 10%
and 20% of purchase price if the property is sold within three years of purchase, Hong Kong property now appears a less enticing investment. A side eff ect has been to push investors towards cheaper properties, putting pressure on the homes the majority of Hong Kong citizens aspire to own. � e biggest eff ect of the measures has been on transaction volumes in the city’s prime markets, with prices beginning to soften (see page 17).
In Singapore, a 15% duty on overseas buyers also applies. Duties ranging from 4% to 16% of the sale price apply if the property is sold within four years, pushing costs higher still. � e city-state has also introduced rules to ensure that a buyer’s monthly payments do not exceed 60% of their income. As in Hong Kong, the impact on transactions has been signifi cant (see page 21).
� ese ‘new world’ taxes are under constant scrutiny and can be changed quickly in response to market conditions. In the cities of the West, when introduced, they tend to be more permanent. Sydney has long placed some restrictions on overseas home ownership. In London, the threat of a mansion tax would put the city further up the world cost rankings, but such a tax would have to be penal to rival the costs associated with real estate in Singapore and Hong Kong (current costs are set out in fi g. 2).
Cooling measures are not always eff ective. Shanghai has seen several rounds of market-cooling taxes, along with restrictions on multiple-home ownership. In spite of slowing price growth, appetite for real estate remains unsatisfi ed and new development continues apace. � e introduction of mortgage caps in Dubai is likely to do little in a market fuelled by cash buyers.
Overall, it appears that property taxation does have a suppressing eff ect. � ere is strong evidence from Hong Kong and Singapore that transaction numbers are suppressed by the introduction of stamp duty. But it seems likely that the price impact of this is relatively temporary, cooling values while the adjustment to the new tax is being made, but not altering the subsequent long-term trajectory of prices.
Above: Transaction rates have slowed in Hong Kong. Top right: Dubai has introduced mortgage caps.G
ETTY
IM
AG
ES
, R
ICH
AR
D S
EY
MO
UR
04-05 Topline V2 Savills World Cities14.indd 5 24/03/2014 20:58
6
Spring 2014 savills.com
Most international comparisons of corporate real estate focus on a very narrow measure of cost, often just comparing the
price per square metre or square foot of prime Grade A offi ce space. � is headline measure is inadequate because the reality of business premise occupation is that it varies greatly from city to city and from sector to sector. By no means will all businesses occupy the same types of space in the same locations within a city. In addition, the amount of space taken up by the same people will vary enormously from country to country. Offi ce workers are more likely to be densely packed in Tokyo, for example, but use far greater space in Dubai.
In addition to commercial property costs, employers are also very interested in the cost of living accommodation for their workers. � ey will bear in mind that it may be easier to attract top talent to the best, most vibrant and exciting cities but that those cities also need to be liveable. Upward pressure on wages may be particularly strong in locations where the cost of residential accommodation is high.
� e total Savills Executive Unit (SEU) measure of accommodation costs takes all of this into account, as well as the additional costs of occupying property, such as local taxes and rates.
TAKING THE LEADHong Kong is the world’s most expensive city in which to locate employees, ranking ahead of London, which is virtually on a par with New York. � ese cities have spent the past two years vying for second place – some way below Hong Kong. Paris completes the
Counting the cost
list of the top four cities, where it costs more than US$100,000 a year per employee to rent living and working space.
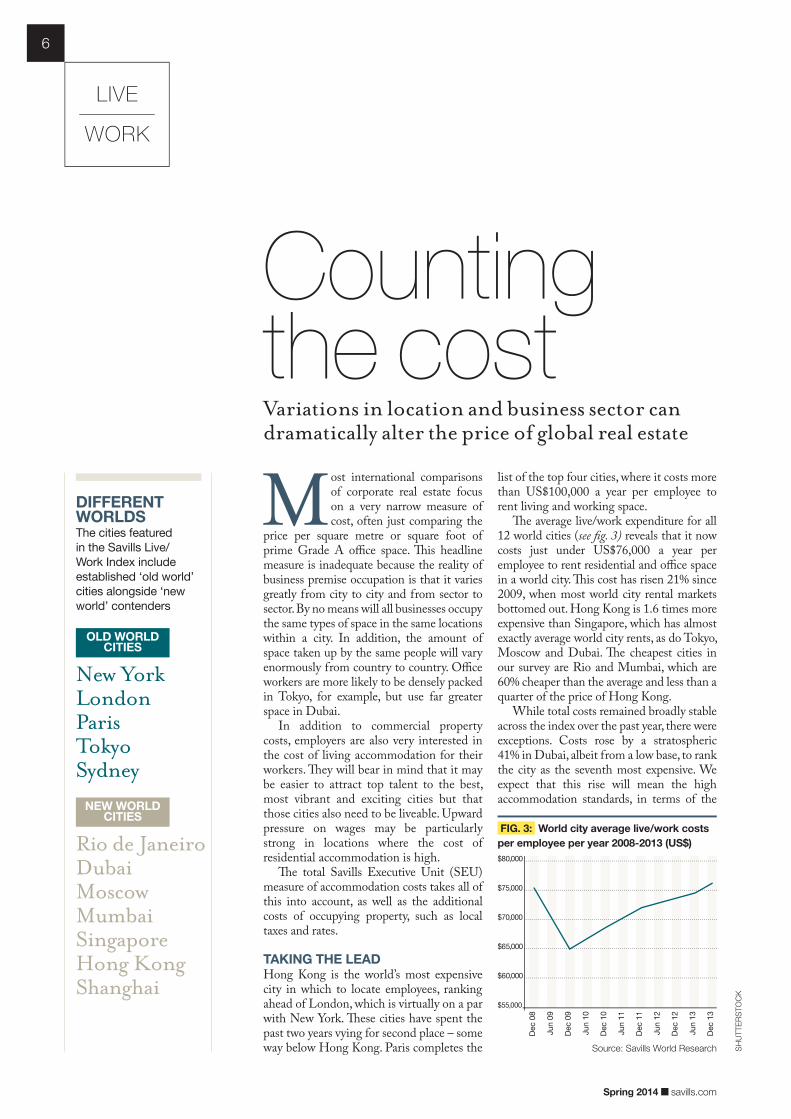
� e average live/work expenditure for all 12 world cities (see fi g. 3) reveals that it now costs just under US$76,000 a year per employee to rent residential and offi ce space in a world city. � is cost has risen 21% since 2009, when most world city rental markets bottomed out. Hong Kong is 1.6 times more expensive than Singapore, which has almost exactly average world city rents, as do Tokyo, Moscow and Dubai. � e cheapest cities in our survey are Rio and Mumbai, which are 60% cheaper than the average and less than a quarter of the price of Hong Kong.
While total costs remained broadly stable across the index over the past year, there were exceptions. Costs rose by a stratospheric 41% in Dubai, albeit from a low base, to rank the city as the seventh most expensive. We expect that this rise will mean the high accommodation standards, in terms of the
DIFFERENT WORLDSThe cities featured
in the Savills Live/
Work Index include
established ‘old world’
cities alongside ‘new
world’ contenders
Variations in location and business sector can dramatically alter the price of global real estate
New YorkLondonParisTokyoSydney
Rio de JaneiroDubaiMoscowMumbaiSingaporeHong KongShanghai
OLD WORLDCITIES
NEW WORLDCITIES
$55,000
$65,000
$60,000
$70,000
$75,000
$80,000
FIG. 3: World city average live/work costs
per employee per year 2008-2013 (US$)
Jun 1
1
Dec 0
8
Dec 1
1
Jun 0
9
Jun 1
2
Dec 0
9
Dec 1
2
Jun 1
0
Jun 1
3
Dec 1
0
Dec 1
3
Source: Savills World Research
LIVE
WORK
SH
UTTE
RS
TO
CK
06-09 Counting Cost Savills World Cities14.indd 6 21/03/2014 06:30

7
Spring 2014 savills.com
Source: Savills World Research
HONG KONG$123,0001 -1%
NEW YORK$112,0003 2%
SINGAPORE$76,0005 0%
LONDON$115,0002 2%
PARIS$107,0004 2%
TOKYO$74,0006 1%
DUBAI$72,0007 41%
SYDNEY$60,0009 2%
RIO DE JANEIRO$30,00011 2%
MOSCOW$70,0008 4%
SHANGHAI$44,00010 0%
MUMBAI$28,00012 -12%
Live/work cost
per employee
per year
Live/work
cost change
in 2013
Rank
SAVILLS LIVE/WORKINDEXRanking the cost of renting residential and commercial space in 12 global cities
06-09 Counting Cost V2 Savills World Cities14.indd 7 26/03/2014 14:15
8
Spring 2014 savills.com
offi ce space occupied, may start to reduce in response. By contrast, total live/work accommodation costs fell by 12% in Mumbai during 2013, which ranks as the cheapest location. Hong Kong costs also fell modestly in 2013, by 1%, although not nearly enough to knock it off its number one perch.
� ese fi ndings go some way to demonstrate the rebalancing of the world’s economies as the more mature ‘old world’ cities show stable growth in this recovery cycle. ‘New world’ city growth has slowed markedly, although this has been slightly counterbalanced by the emergence of the new entrants – Rio and Dubai.
In the second half of 2013, ‘new world’ offi ce costs rose by 7.6%, while ‘old world’ residential costs grew by 4%. Rents in the offi ce markets of ‘new world’ cities have been, on average, below their 2005 levels but are now picking up momentum. In contrast, ‘old world’ rents did not fall as far and have since recovered, albeit more slowly than the ‘new world’, to above 2005 values.
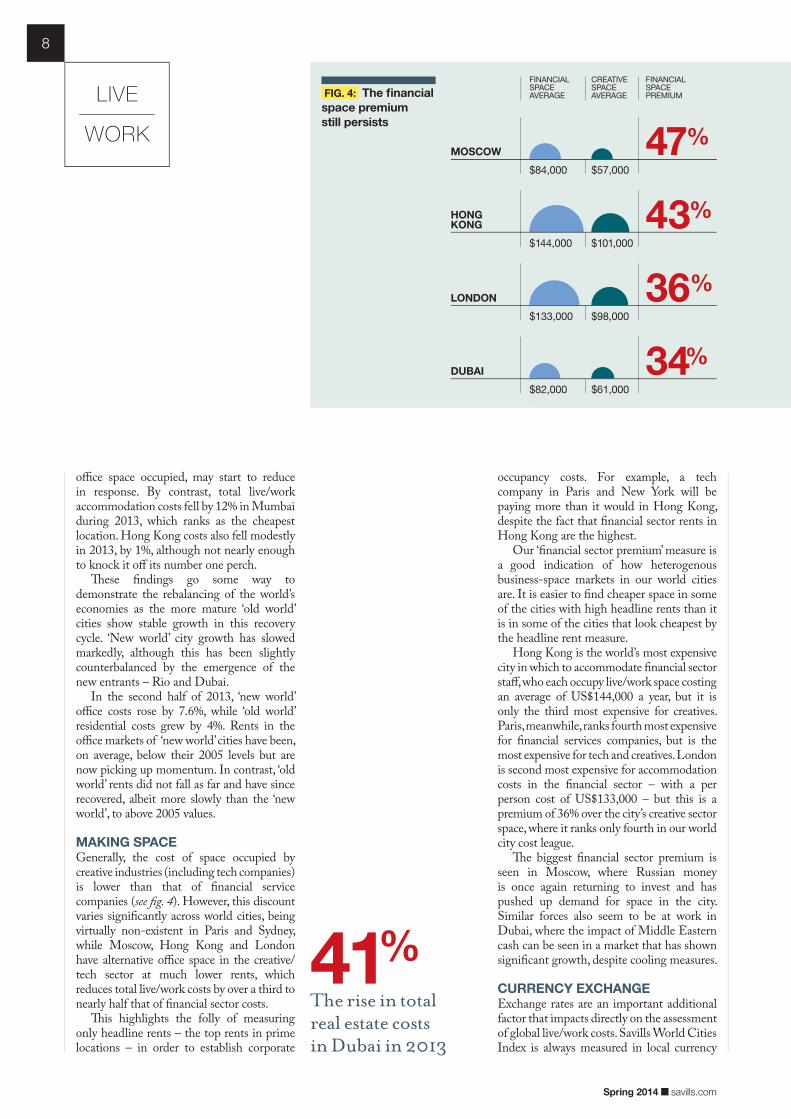
MAKING SPACEGenerally, the cost of space occupied by creative industries (including tech companies) is lower than that of fi nancial service companies (see fi g. 4). However, this discount varies signifi cantly across world cities, being virtually non-existent in Paris and Sydney, while Moscow, Hong Kong and London have alternative offi ce space in the creative/tech sector at much lower rents, which reduces total live/work costs by over a third to nearly half that of fi nancial sector costs.
� is highlights the folly of measuring only headline rents – the top rents in prime locations – in order to establish corporate
occupancy costs. For example, a tech company in Paris and New York will be paying more than it would in Hong Kong, despite the fact that fi nancial sector rents in Hong Kong are the highest.
Our ‘fi nancial sector premium’ measure is a good indication of how heterogenous business-space markets in our world cities are. It is easier to fi nd cheaper space in some of the cities with high headline rents than it is in some of the cities that look cheapest by the headline rent measure.
Hong Kong is the world’s most expensive city in which to accommodate fi nancial sector staff , who each occupy live/work space costing an average of US$144,000 a year, but it is only the third most expensive for creatives. Paris, meanwhile, ranks fourth most expensive for fi nancial services companies, but is the most expensive for tech and creatives. London is second most expensive for accommodation costs in the fi nancial sector – with a per person cost of US$133,000 – but this is a premium of 36% over the city’s creative sector space, where it ranks only fourth in our world city cost league.
� e biggest fi nancial sector premium is seen in Moscow, where Russian money is once again returning to invest and has pushed up demand for space in the city. Similar forces also seem to be at work in Dubai, where the impact of Middle Eastern cash can be seen in a market that has shown signifi cant growth, despite cooling measures.
CURRENCY EXCHANGE Exchange rates are an important additional factor that impacts directly on the assessment of global live/work costs. Savills World Cities Index is always measured in local currency
$57,000
MOSCOW
36%LONDON
34%DUBAI
$84,000
$82,000 $61,000
$133,000 $98,000
FIG. 4: The fi nancial
space premium
still persists
FINANCIAL SPACE AVERAGE
CREATIVE SPACE AVERAGE
FINANCIAL SPACE PREMIUM
41%The rise in total real estate costs in Dubai in 2013
47%
HONG KONG 43%
$101,000$144,000
LIVE
WORK
06-09 Counting Cost Savills World Cities14.indd 8 21/03/2014 06:30

9
Spring 2014 savills.com
and then converted into US dollars at current prices so that the impact of exchange rate fl uctuations are eliminated. However, for both investors and occupiers who operate and/or remunerate expatriates and other employees in a non-local currency, the impacts of these fl uctuations are important.
� e eff ect of currency movements has exaggerated the cost changes in diff erent world cities over the past fi ve years (see fi g. 5). � e strength of the Chinese renminbi and the Singapore dollar mean that cost increases have been amplifi ed – in fact they have nearly doubled.
Meanwhile, cost falls in US dollar terms have been much greater in Tokyo and Mumbai than in their local currencies. � e huge nominal increases in Rio have also been signifi cantly ameliorated by the weakness of the Brazilian real.
It is not just currency fl uctuations that cause uncertainty for corporate occupiers in world cities. Market variations also make a diff erence (see fi g. 6). Here, we have measured how cost growth, together with its variability, has diff ered between the world cities since 2009. It shows that the more predictable and low growth markets have been those of Tokyo, Sydney and Paris, while high growth and unpredictability have been amply demonstrated in Dubai and, to some extent, Hong Kong.
From an investor’s point of view, given that rental income across residential and commercial properties makes up a high proportion of the live/work index, the best markets with high, stable growth have been Rio, New York and Moscow, while the worst has been Mumbai, with low overall growth masked by a great deal of volatility.
SHANGHAI 31%
$65,000
$38,000
26%TOKYO
16%NEW YORK
16%MUMBAI
$82,000
$50,000
$30,000 $26,000
$120,000 $104,000
15%SINGAPORE
$71,000
0%PARIS
0%SYDNEY
$81,000
$60,000 $60,000
$107,000 $107,000
5%RIO DE JANEIRO
$31,000 $29,000
FINANCIAL SPACE AVERAGE
CREATIVE SPACE AVERAGE
FINANCIAL SPACE PREMIUM
FINANCIAL SPACE AVERAGE
CREATIVE SPACE AVERAGE
FINANCIAL SPACE PREMIUM
USD Local
-40%
40%
0%
-20%
20%
60%
FIG. 5: Live/work cost change by currency 2009-2013
Source: Savills World Research
Shang
hai
Sin
gap
ore
Lo
nd
on
Dub
ai
Ho
ng
Ko
ng
New
Yo
rk
Mo
sco
w
Syd
ney
Paris
Tokyo
Rio
de J
aneiro
FIG. 6: Live/work cost increases and stability 2009-2013
Source: Savills World Research
STABLEHigh growth since 2009
VOLATILELow growth since 2009
VOLATILEHigh growth since 2009
STABLELow growth since 2009
Siz
e o
f co
st incre
ase
Stability of change
HIGH
LOW
HIG
H
LO
W
Mumbai
Singapore
Dubai
Rio de Janeiro
New York
Shanghai
Global
Paris
Sydney
Tokyo
Moscow
Hong KongLondon
New World
Old World
Source: Savills
World Research
Mum
bai
Positive currency impact Negative currency impact
06-09 Counting Cost V2 Savills World Cities14.indd 9 24/03/2014 21:01

Spring 2014 savills.com
LONDON8,308,369
1253
Mid/Mid
NEW YORK8,336,697
230106
High/High
1
SYDNEY3,908,642
2819
Low/Mid
Population (urban area) Persons per ha
No. of buildings over 150m Density/building height
Population (urban area) Persons per ha
No. of buildings over 150m Density/building height
Urban identityA city’s character is closely related to its real estate valuesURBAN FORM is at the heart of a city’s identity. Street layout and building densities, coupled with the amount and arrangement of open space, has a direct impact on residents’ quality of life, a city’s economic prosperity, and the ability to conduct social, political and cultural activity. It is a particularly important factor in real estate value as occupiers are attracted by – and will pay for – these attributes.
Our 12 cities have distinctive qualities. Dubai has developed rapidly but is, surprisingly, characterised as among the least dense urban forms. Tall buildings in this city are as much about making a statement as
making the best use of land: Dubai has 203 buildings over 150m in height (35-40 storeys) but a population density of only 16 people per hectare. High rise does not necessarily mean high density.
New York’s distinctive grid pattern is both high density (106 people per hectare) and high rise (230 buildings over 150m). Hong Kong boasts the most tall buildings of our 12 cities (293 over 150m), which is a necessity given its mountainous terrain and lack of developable land. London’s relatively dense network of streets, squares and parks achieves 53 people per hectare, while Haussmann’s Paris manages 37.
32
7 98DUBAI2,106,177
20316
Low/High
MOSCOW11,977,988
24108
High/Mid
HONG KONG7,200,302
29365
Mid/High
CITY STYLE
JAS
ON
PIC
KER
SG
ILL
10
10-11 Urban Identity V2 Savills World Cities14.indd 10 27/03/2014 15:48

Spring 2014 savills.com
11
PARIS10,413,386
16
37
Low/Mid
TOKYO8,967,665
113
145
High/Mid-High
SHANGHAI17,836,133
116
68
Mid/High
4 SINGAPORE5,233,927
69
73
Mid/Mid-High
RIO DE JANEIRO6,323,037
5
50
Mid/Mid
MUMBAI12,478,447
44
207
High/Mid
65
10 1211
3
12
9
5
24
6
8
710
1
EXPERT VIEW
‘The look and feel of each city has a direct impact on property prices’
YOLANDE BARNES Savills World Research [email protected]
WORLD CITIES THAT ARE SETTING NEW RECORDS
40%Of Greater London
is green space, making it Europe’s
greenest city
RIO DE JANEIRO
The only city to be recognised as a
World Heritage Site for its ‘Cultural
Landscape’
830mThe height of Dubai’s
Burj Khalifa, the world’s tallest building
538kmLength of Shanghai’s
metro system, the world’s longest
11
10-11 Urban Identity V2 Savills World Cities14.indd 11 26/03/2014 14:16

Spring 2014 savills.com
Taking the
temperatureAs concerns grow about affordability, we reveal which cities are overheated
12
MARKET VALUES
The weight of money that has pressed on many of the 12 world cities since quantitative
easing took hold in 2009 has led economists and politicians to ask whether real estate bubbles have been created. Large numbers of residents in these cities have also become concerned, so political pressure is growing to curb what is seen by many to be a problem. But are the markets really as overheated as some commentators suggest?
Our analysis indicates that many concerns for the mainstream residential markets, in particular, are overdone and, although some of our world cities may look very expensive in relation to the countries in which they sit, this is not indicative that all of the markets are overheated.
DO RENTS REVEAL VALUE?In our last world city analysis, we started to look at this issue by examining the cities where residential rental growth was not keeping pace with capital growth.
We assessed whether the resulting low yields looked sustainable by reference to the prevailing rate on government bonds.
We have updated this analysis again as we think it is a revealing measure of fundamental value (see fi g. 7). But this time we have looked across the board at rents paid in commercial markets as well as residential (see fi g. 8).
By this measure, which takes the Savills Executive Unit (SEU) as its basis, Tokyo, New York and Paris look ‘safe’ or even good value to investors. Sydney, London and Singapore show little scope for further capital growth without further rental growth, but are not yet overheated. Meanwhile, Rio, Mumbai and Shanghai all look particularly vulnerable and may now be overheated.
While this evidence might be viewed with concern, especially in those ‘new world’ cities that are most aff ected, it is worth considering that it may be reasonable to see real estate as a safer, lower risk investment than 10-year government bonds in certain jurisdictions. In those locations where tenants might be viewed as less likely to default on their debt than governments, it would be perfectly reasonable to accept a lower yield on property than on bonds.
� is is where ‘old world’ real estate, particularly prime markets
FIG. 7 Gross residential yields net of
10-year government bond yields
-2%
-4%
-6%
-10%
-8%
2%
4%
6%
Source: Savills World Research
Source: Savills World Research
Ho
ng
Ko
ng
Tokyo
Syd
ney
New
Yo
rk
Dub
ai
Paris
Mo
sco
w
Lo
nd
on
Shang
hai
Sin
gap
ore
Rio
de J
aneiro
Mum
bai
0%
8%
-2%
-4%
-6%
10%
-8%
2%
4%
6%
0%
Savills SEU residential yield (gross)
Savills SEU residential yield (gross) net 10-year government bond yield*
Savills SEU commercial yield (gross)
Savills SEU commercial yield (gross) net 10-year government bond yield*
Mo
sco
w
Tokyo
Lo
nd
on
Syd
ney
Ho
ng
Ko
ng
Paris
Shang
hai
New
Yo
rk
Mum
bai
Sin
gap
ore
Rio
de J
aneiro
Dub
ai6.1%
The gross yield on New York residential real estate in 2013
FIG. 8 Gross commercial yields net of 10-year
government bond yields
Yie
ldY
ield
12-13 Temperature V2 Savills World Cities14.indd 12 24/03/2014 21:03

13
Spring 2014 savills.com
higher side of average but are still some way off the hottest cities.
� is analysis becomes further nuanced when we consider that the pressure of global money on world city real estate markets emanates from the wealthiest in society rather than across the board. It would appear that the hottest markets are the prime, luxury ones
FIG. 9 Ratio of average GDP per capita
to all residential property capital values
40
20
0
80
100
120
140
Tokyo
New
Yo
rk
Rio
de J
aneiro
Syd
ney
Lo
nd
on
Mo
sco
w
Dub
ai
Paris
Shang
hai
Sin
gap
ore
Mum
bai
Ho
ng
Ko
ng
60
0
25
20
15
5
10
35
40
45
30
Source: Savills World Research and World Bank
Singapore remains one of the more
affordable world cities.
in Anglophone countries with good legal title and transparent markets, have taken on a ‘safe haven, store of wealth’ status with many private buyers.
CAPITAL AFFORDABILITYOne of the key metrics that is used by economists to measure the aff ordability of housing markets is the ratio of house prices to average incomes. We have increasing concerns as to the effi cacy of this measure as average incomes are of decreasingly low relevance to capital values in cities where the majority of the population rent, only the wealthiest buy, mortgage lending (especially at high multiples) is rare and where aff ordability is determined by the amount of equity that is available to those buyers.
We have used city GDP per capita as a measure to proxy the amounts of equity (through stock investments, bonuses and IPO payouts, etc.) that are more likely to be available to buyers in each city. Together with the average house price value of our SEU in each location, we have identifi ed how ‘hot’ each city market looks (see fi g. 9).
Once again, Mumbai and Shanghai look vulnerable and Hong Kong more so than it did by the yield measure, but Rio looks far safer. London and Dubai residential prices look on the
2.3%The gross yield on Shanghai residential real estate in 2013
most associated with ultra high net worth global investors.
We have conducted the same GDP per capita analysis for non-prime, or mainstream, residential property in each of our world cities and this shows a very diff erent story (see fi g. 10). Only Mumbai looks distinctly overheated, while Shanghai looks hot.
When it comes to the ordinary non-prime residential markets, London and Rio appear to be cool, while Dubai and Hong Kong look merely fully valued.
For investors in particular, there may be huge advantages in shifting focus from prime to secondary markets worldwide.
Lo
nd
on
Mo
sco
w
Syd
ney
Paris
Tokyo
New
Yo
rk
Ho
ng
Ko
ng
Rio
de J
aneiro
Dub
ai
Sin
gap
ore
Mum
bai
Shang
hai
FIG. 10 Ratio of average GDP per capita
to mainstream house price values
Source: Savills World Research and World Bank
Ratio
Ratio
GE
TTY
IM
AG
ES
12-13 Temperature V2 Savills World Cities14.indd 13 24/03/2014 21:03

Spring 2014 savills.com
14
The real estate markets in our 12 world cities are directly shaped by larger economic, political and business factors.
� e continued rebalancing of the fi nancial system, the global concentration of wealth and the ongoing activities of central banks have all played a signifi cant role in the performance of real estate in the world cities.
Here, we set out the three key themes that are creating challenges – as well as opportunities – for property investors.
GROWTH FACTOR� e redrawing of the global economic map is having a signifi cant impact on real estate markets. ‘New world’ economies, notably China and India, continue to see weakened growth, while older industrialised economies, including the US, UK and Japan, are recovering more strongly than many commentators anticipated. As a result, the runaway real estate growth of ‘new world’ cities has abated and in some cases, such as Mumbai and prime Hong Kong, has now reversed.
Meanwhile, the emergence of new economies, as personifi ed by Dubai’s revival as a high-growth real estate centre, is indicative of a market that is recovering following very full corrections after 2008.
� e picture is made more complex by the economic performance of world cities, which make a substantial contribution to a country’s GDP (see fi g. 11). In some cases, city growth has been much greater than country GDP growth, with London and New York being good examples in recent years.
So perhaps it is not surprising that many of our world cities have seen much higher growth in their real estate values than their surrounding nations and, in a signifi cant number of cases, there are active concerns that real estate markets have become overheated.
THINKING BIGIt is notable that the biggest real estate deals of the past year were concentrated in just a handful of cities. Seven of our 12 world cities were in the top 20 most active investment markets (see fi g. 12). What’s more, it would appear that the higher up the world rankings a city is, and the higher the level of international
investment in a city, the more likely this is to be the case (see fi g. 14). � is is particularly true where large quantities of private wealth are focused on property – and infl ating markets in particular.
When it comes to the biggest buyers and sellers, the US tops the sellers’ league, while Chinese developers and property companies dominate the buyers’ league (see fi g. 13). Generally speaking, West is selling to East, and private wealth and sovereign wealth funds are buying from banks and institutions.
BANK ON ITQuantitative easing has had a big impact on asset prices worldwide, and real estate has been no exception. Its infl uence has been felt in three ways.
First, liquidity has been injected into the investing sector of the economy. By creating an active demand for bond investments, money has been put in the hands of investors. � ese investors have then searched for further asset classes in which to put their money. Real estate has been a recipient of this.
Second, by removing a signifi cant supply of bonds from the investment markets (by buying and keeping them) central banks have decreased the supply of lower-risk investment vehicles available for purchase and thereby encouraged investors to seek alternative asset classes. Real estate has often been seen as a viable alternative. Activity tends to have been concentrated in well-known, prominent world cities.
� ird, by increasing the scarcity of bonds, yields have been driven down (an intended consequence to keep interest rates low) and this has had a knock-on eff ect on asset prices as lower yields mean infl ated asset prices. � is applies to a wide variety of assets, including real estate.
However, the capital value growth of real estate has been confi ned to particular places and types of property. � e most well known and internationally welcoming cities have been the main recipients of this inward investment, especially if they have transparent markets, good legal title and represent safe havens for those seeking to preserve wealth.
The big pictureThe most significant economic and financial factors currently shaping world city real estate markets
45%Of global big ticket real estate buyers now originate in China
THE BRIEFING
14-15 Briefing Savills World Cities14.indd 14 21/03/2014 06:36

Spring 2014 savills.com
$60.5bn Volume of investment in the New York City metro area, year to February 2014
New York Metro
London Metro
Shanghai
Tokyo
Hong Kong
Paris
Singapore
FIG. 12: World Cities ranking in the top 20
most active real estate investment markets
Source: Real Capital Analytics, year to February 2014
Ranking Market Volume (billions)
13
11
1
2
4
3
9
$60.5
$48.2
$46.8
$39.6
$21.8
$20.0
$17.4
15
FIG. 13: Top real estate buyers and sellers by country of origin
TOP FIVE BUYERS
TOP FIVE SELLERS
US$117.4bn
79%
US$55.3bn
37%
GERMANY$4.5bn
3%
GERMANY$16.3bn
11%
MIDDLE EAST$5.2bn
3%
SINGAPORE$6.4bn
4%
CHINA$8.4bn
6%
CHINA$67.6bn
45%
UK$4.8bn
3%
CANADA$13.8bn
9%
FIG. 14: Key elements that make a world city
Source: Economics Intelligence Unit 2012, Globalization and World Cities Research Network 2012,
www.google.co.uk at February 2014, MasterCard Global Destinations Index 2013. *Tourism New South Wales International Visitor Survey, year to June 2013, foreign overnight visitors. **India tourism
Development Corporation, 2011, foreign tourist arrivals. ***Moscow Tourism Committee, 2011, foreign tourist arrivals.
City
Savills
overall
ranking
11
10
12
1=
1=
3=
3=
7
5
8
6
9
Global
competitiveness (Economist Intelligence Unit rank)
Global
connectivity (GaWC category)
Prominence
(Google hits, millions)
International
visitors
(overnight stays, millions)
New York
London
Paris
Singapore
Hong Kong
Tokyo
Shanghai
Dubai
Sydney
Mumbai
Moscow
Rio de Janeiro
1
2
4
3
4
6
43
40
15
70
58
76
Alpha++
Alpha++
Alpha+
Alpha+
Alpha+
Alpha+
Alpha+
Alpha+
Alpha+
Alpha
Alpha
Beta-
2,740
441
415
273
656
192
152
83
129
96
76
98
11.52
15.96
13.92
11.75
8.72
5.80
6.50
9.89
2.80*
4.80**
4.50***
1.40
FIG. 11: Country and world city GDP (metro area)
Country GDP growth 2010 2013 City GDP as a percentage of country GDP
6%Shanghai
7.7%
10.4%
CHINA
Source: World Bank, IMF, Brookings Institute Source: Real Capital Analytics, year to February 2014
13%Sydney
2.4%
2.1%
AUSTRALIA
19%Dubai
4.0%
-1.8%
UAE
7%Mumbai
4.8%
10.5%
INDIA
100%Singapore
3.5%
14.8%
SINGAPORE
100%Hong Kong
3.0%
6.8%
HONG KONG
30%London
2.8%
1.7%
UK
9%Rio de Janeiro
2.2%
7.5%
BRAZIL
26%Tokyo
1.7%
4.7%
JAPAN
8%New York
1.8%
2.5%
US
26%Moscow
1.5%
4.5%
RUSSIA
26%Paris
0.2%
1.7%
FRANCE
14-15 Briefing Savills World Cities14.indd 15 21/03/2014 06:36

From the most expensive real estate to the best value locations, we take an in-depth look at the world’s leading property markets
16
Spring 2014 savills.com
16-25 Index Savills World Cities14.indd 16 21/03/2014 06:59
17
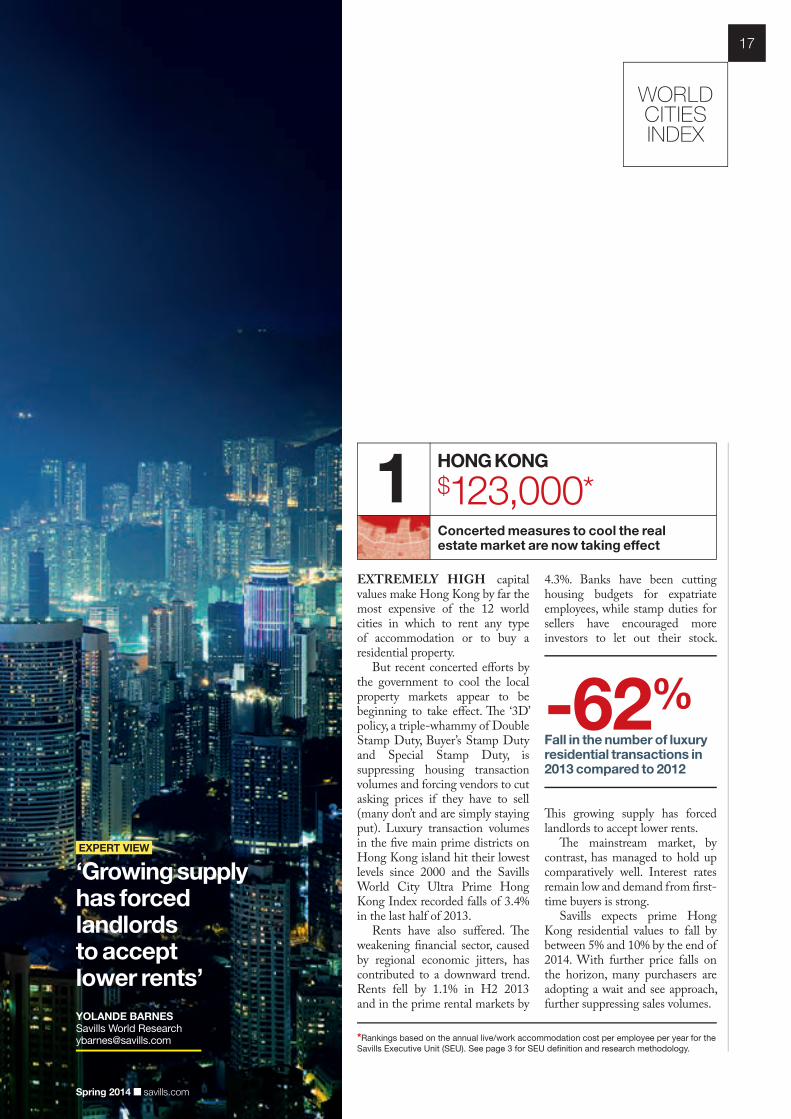
EXTREMELY HIGH capital values make Hong Kong by far the most expensive of the 12 world cities in which to rent any type of accommodation or to buy a residential property.
But recent concerted eff orts by the government to cool the local property markets appear to be beginning to take eff ect. � e ‘3D’ policy, a triple-whammy of Double Stamp Duty, Buyer’s Stamp Duty and Special Stamp Duty, is suppressing housing transaction volumes and forcing vendors to cut asking prices if they have to sell (many don’t and are simply staying put). Luxury transaction volumes in the fi ve main prime districts on Hong Kong island hit their lowest levels since 2000 and the Savills World City Ultra Prime Hong Kong Index recorded falls of 3.4% in the last half of 2013.
Rents have also suff ered. � e weakening fi nancial sector, caused by regional economic jitters, has contributed to a downward trend. Rents fell by 1.1% in H2 2013 and in the prime rental markets by
4.3%. Banks have been cutting housing budgets for expatriate employees, while stamp duties for sellers have encouraged more investors to let out their stock.
EXPERT VIEW
‘Growing supply has forced landlords to accept lower rents’
YOLANDE BARNES Savills World Research [email protected]
-62%Fall in the number of luxury residential transactions in 2013 compared to 2012
WORLD CITIES INDEX
Spring 2014 savills.com
� is growing supply has forced landlords to accept lower rents.
� e mainstream market, by contrast, has managed to hold up comparatively well. Interest rates remain low and demand from fi rst-time buyers is strong.
Savills expects prime Hong Kong residential values to fall by between 5% and 10% by the end of 2014. With further price falls on the horizon, many purchasers are adopting a wait and see approach, further suppressing sales volumes.
Concerted measures to cool the real estate market are now taking effect
1HONG KONG
$123,000*
*Rankings based on the annual live/work accommodation cost per employee per year for the
Savills Executive Unit (SEU). See page 3 for SEU de� nition and research methodology.
16-25 Index Savills World Cities14.indd 17 21/03/2014 06:59
18
Spring 2014 savills.com
EXPERT VIEW
‘We anticipate more interest in secondary, high-yielding assets’
PAUL TOSTEVIN Savills World Research [email protected]
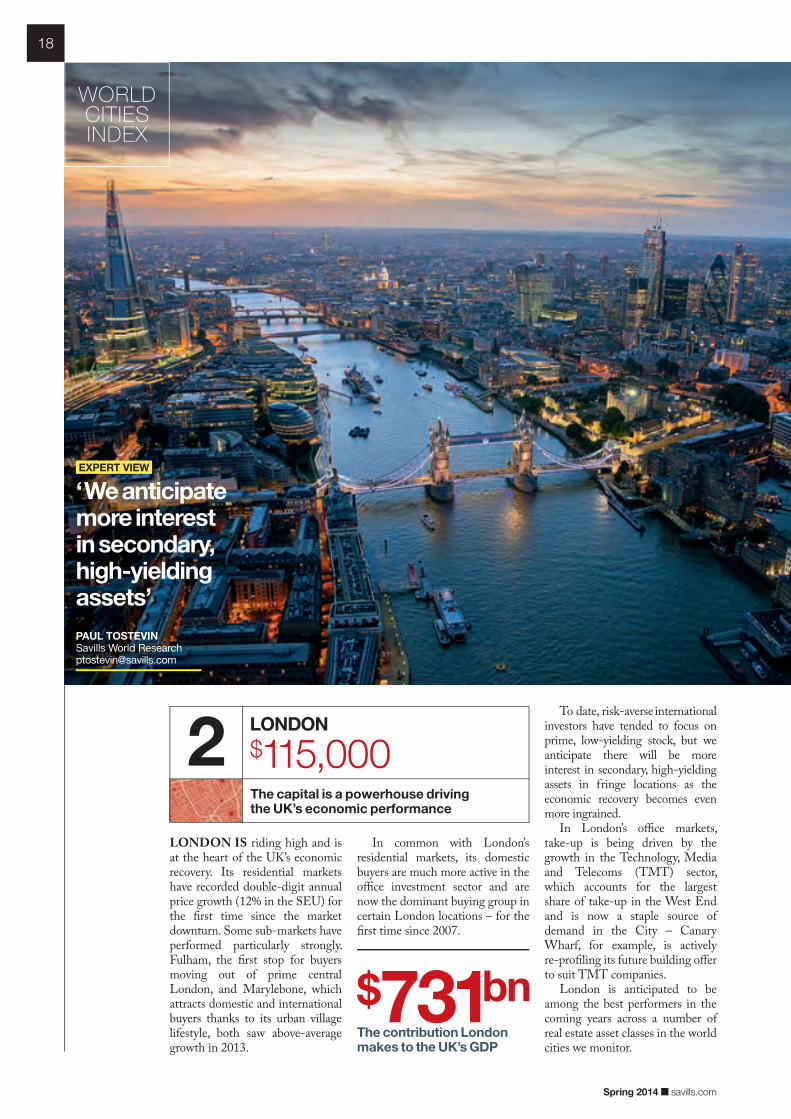
LONDON IS riding high and is at the heart of the UK’s economic recovery. Its residential markets have recorded double-digit annual price growth (12% in the SEU) for the fi rst time since the market downturn. Some sub-markets have performed particularly strongly. Fulham, the fi rst stop for buyers moving out of prime central London, and Marylebone, which attracts domestic and international buyers thanks to its urban village lifestyle, both saw above-average growth in 2013.
$731bnThe contribution London makes to the UK’s GDP
In common with London’s residential markets, its domestic buyers are much more active in the offi ce investment sector and are now the dominant buying group in certain London locations – for the fi rst time since 2007.
To date, risk-averse international investors have tended to focus on prime, low-yielding stock, but we anticipate there will be more interest in secondary, high-yielding assets in fringe locations as the economic recovery becomes even more ingrained.
In London’s offi ce markets, take-up is being driven by the growth in the Technology, Media and Telecoms (TMT) sector, which accounts for the largest share of take-up in the West End and is now a staple source of demand in the City – Canary Wharf, for example, is actively re-profi ling its future building off er to suit TMT companies.
London is anticipated to be among the best performers in the coming years across a number of real estate asset classes in the world cities we monitor.
WORLD CITIES INDEX
The capital is a powerhouse driving the UK’s economic performance
2LONDON
$115,000
16-25 Index Savills World Cities14.indd 18 21/03/2014 06:59

19
Spring 2014 savills.com
NEW YORK constantly jostles with London at the top of global city rankings. � e same is true of our live/work index, with London recapturing the second place from New York by the thinnest of margins. � e cost of renting housing and offi ce space for the same group of people in each city is almost identical, leaving little scope for one to out-compete the other.
� e Big Apple has seen residential rents grow by 36% since 2009 and capital values by 31%. In the past two years, however, capital values have grown at a faster rate than rents, driven by record low levels of inventory. While yields have moved from 6.9% to 6.1%, New York remains attractive from an income-return point of view.
New York City has been at the centre of America’s urban renaissance in recent decades. � e city’s crime rate is low, new and innovative public spaces are being created, such as the Highline, and the waterfront is being opened up. � e city is now even considered a desirable place to bring up children, out-competing the suburbs and attracting returning empty-nesters.
New York’s renaissance has gone hand in hand with its dominance of the global tech
industry. A fi ve-hour fl ight from the West Coast, or seven hours from Europe, the city off ers a vibrant urban environment and the kind of alternative space so desired by tech start-up companies.
‘Silicon Alley’, clustered around the Flatiron District, SoHo and Tribeca, and Dumbo in Brooklyn, are all areas experiencing surging demand for small and medium-sized offi ce space. Offi ce rents for the creative/tech company are up 33% from a December 2010 low. � is is a higher rent increase than the 20% for fi nancial offi ce space. � e costs of offi ces of a type and in locations favoured by creative industries are the highest of our
Previous page: The market in Hong Kong is cooling. Above left: London has seen a strong performance. Right: New York is attracting tech industries.
33%Increase in creative/tech industry office rents between 2010 and 2013
12 cities on a $ per square foot basis (see chart below).
� e downside risks for New York are a shortage of suitable accommodation, both residential and commercial. Many large banks are splintering and downsizing, demanding smaller, bespoke spaces. As a consequence, the midtown offi ce market, dominated by large, corporate headquarters, has remained relatively fl at. A dearth
Cost per square foot of creative offi ce space (US$)
An urban renaissance is attracting the global tech industry to the Big Apple
3NEW YORK
$112,000
$0 $40$30$20$10 $60$50 $70 $90$80
New York
Dubai
Shanghai
Rio de Janeiro
Tokyo
London
Moscow
Hong Kong
Sydney
Mumbai
Singapore
Paris
of new supply in the residential markets is a legacy of the wider downturn, with younger New Yorkers particularly squeezed by high rents.
Source: Savills World Research
16-25 Index V2 Savills World Cities14.indd 19 24/03/2014 21:05

EXPERT VIEW
‘Concerns about future taxation are restricting inward investment’YOLANDE BARNES Savills World Research [email protected]
FRANCE JUST avoided another recession in 2013, its economy growing by 0.3%. Tax increases and weak household spending, coupled with volatility in the Eurozone, have impacted negatively on Paris’s real estate markets.
Apprehension dogs property markets as discussions about taxing high incomes continue. � is has particular impact at the top end of the residential market, but also has knock-on eff ects on relocation decisions in the private corporate sector. While residential values are down 2.1% across the SEU overall in 2013, they fell 5.7% in its super-prime residential market over the same period.
75%Proposed tax on salaries exceeding €1 million
In spite of this, Paris continues to see a fl ow of buyers from the Middle East seeking a safe haven in light of continued unrest in their home region. Paris boasts the kind of large, lateral apartments favoured by such buyers, at cheaper prices than London. If it weren’t for perceived tax threats, euro jitters and a less transparent market, Paris would be competing much more strongly with London for inward investment in prime real estate.
Property for fi rst-time buyers in Paris is expensive and in low supply. Residential sales volumes are still low but are anticipated to recover somewhat when vendors accept lower prices.
In the offi ce sector, rents are rising in central locations as companies start to return, having experimented with cheaper but less productive peripheral and out of town locations. Offi ce costs among our SEU increased by 8.5% in the last six months of 2013 alone.
20
WORLD CITIES INDEX
Political and economic uncertainty continue to affect the market
4PARIS
$107,000
16-25 Index V2 Savills World Cities14.indd 20 24/03/2014 21:09
21
Spring 2014 savills.com
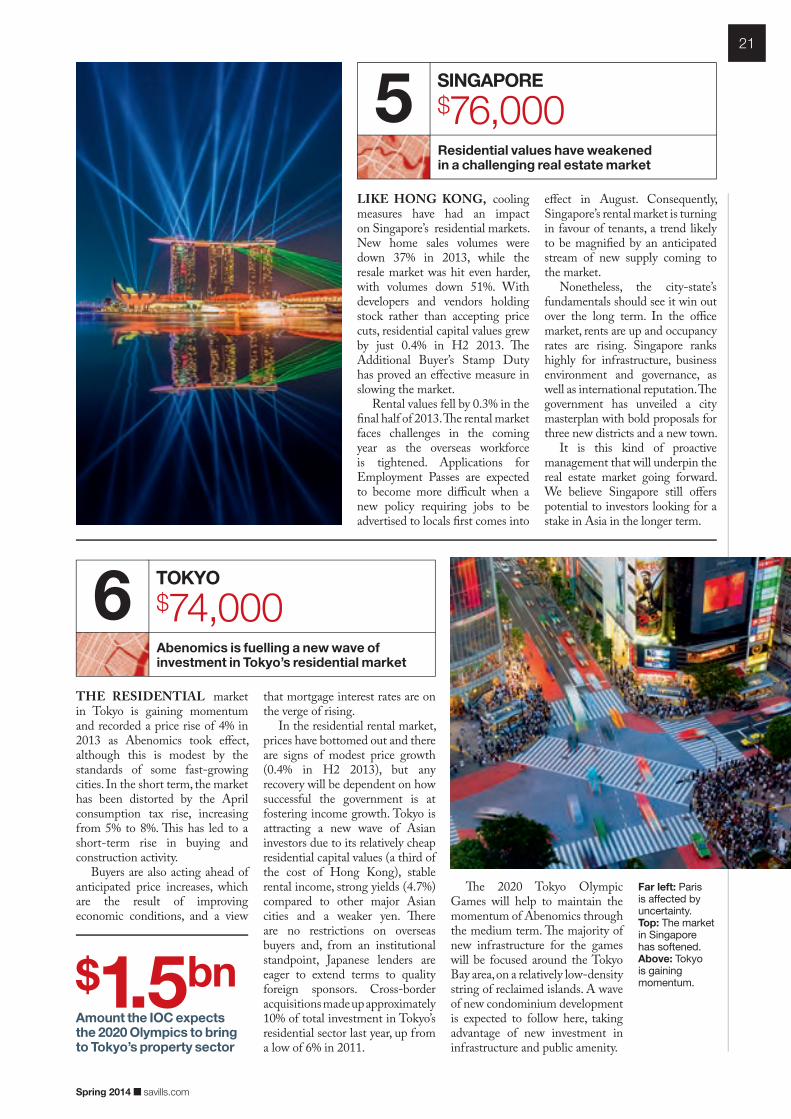
Far left: Paris is affected by uncertainty.Top: The market in Singapore has softened.Above: Tokyo is gaining momentum.
THE RESIDENTIAL market in Tokyo is gaining momentum and recorded a price rise of 4% in 2013 as Abenomics took eff ect, although this is modest by the standards of some fast-growing cities. In the short term, the market has been distorted by the April consumption tax rise, increasing from 5% to 8%. � is has led to a short-term rise in buying and construction activity.
Buyers are also acting ahead of anticipated price increases, which are the result of improving economic conditions, and a view
that mortgage interest rates are on the verge of rising.
In the residential rental market, prices have bottomed out and there are signs of modest price growth (0.4% in H2 2013), but any recovery will be dependent on how successful the government is at fostering income growth. Tokyo is attracting a new wave of Asian investors due to its relatively cheap residential capital values (a third of the cost of Hong Kong), stable rental income, strong yields (4.7%) compared to other major Asian cities and a weaker yen. � ere are no restrictions on overseas buyers and, from an institutional standpoint, Japanese lenders are eager to extend terms to quality foreign sponsors. Cross-border acquisitions made up approximately 10% of total investment in Tokyo’s residential sector last year, up from a low of 6% in 2011.
$1.5bnAmount the IOC expects the 2020 Olympics to bring to Tokyo’s property sector
Residential values have weakened in a challenging real estate market
5SINGAPORE
$76,000
Abenomics is fuelling a new wave of investment in Tokyo’s residential market
6TOKYO
$74,000
LIKE HONG KONG, cooling measures have had an impact on Singapore’s residential markets. New home sales volumes were down 37% in 2013, while the resale market was hit even harder, with volumes down 51%. With developers and vendors holding stock rather than accepting price cuts, residential capital values grew by just 0.4% in H2 2013. � e Additional Buyer’s Stamp Duty has proved an eff ective measure in slowing the market.
Rental values fell by 0.3% in the fi nal half of 2013. � e rental market faces challenges in the coming year as the overseas workforce is tightened. Applications for Employment Passes are expected to become more diffi cult when a new policy requiring jobs to be advertised to locals fi rst comes into
eff ect in August. Consequently, Singapore’s rental market is turning in favour of tenants, a trend likely to be magnifi ed by an anticipated stream of new supply coming to the market.
Nonetheless, the city-state’s fundamentals should see it win out over the long term. In the offi ce market, rents are up and occupancy rates are rising. Singapore ranks highly for infrastructure, business environment and governance, as well as international reputation. � e government has unveiled a city masterplan with bold proposals for three new districts and a new town.
It is this kind of proactive management that will underpin the real estate market going forward. We believe Singapore still off ers potential to investors looking for a stake in Asia in the longer term.
� e 2020 Tokyo Olympic Games will help to maintain the momentum of Abenomics through the medium term. � e majority of new infrastructure for the games will be focused around the Tokyo Bay area, on a relatively low-density string of reclaimed islands. A wave of new condominium development is expected to follow here, taking advantage of new investment in infrastructure and public amenity.
16-25 Index V2 Savills World Cities14.indd 21 24/03/2014 21:10

22
DUBAI ENJOYS a strategic position in the Middle East and is a city of superlatives: it boasts the world’s tallest building (Burj Khalifa); the largest mall (� e Dubai Mall); man-made islands and huge logistics hubs. Its population has more than tripled since 1995 as the city has pursued a strategy of reducing reliance on oil and energy to position itself as an international centre of trade and business, as well as tourism.
Dubai’s property boom and bust has been well documented. � e emirate was opened up to foreign property ownership in 2006. Fuelled by cheap credit and speculation, prices more than doubled. But the market was hit hard by the credit crunch. Residential values fell by 60% between 2008 and 2011, offi ce
rents declined by 62% over the same period and almost half the construction projects in the UAE were put on hold or cancelled.
� e city’s rapid rebound has surprised many, leading to talk of another bubble. With political turbulence intensifying elsewhere in the Middle East, Dubai has cemented its position as one of the few safe haven destinations in the region.
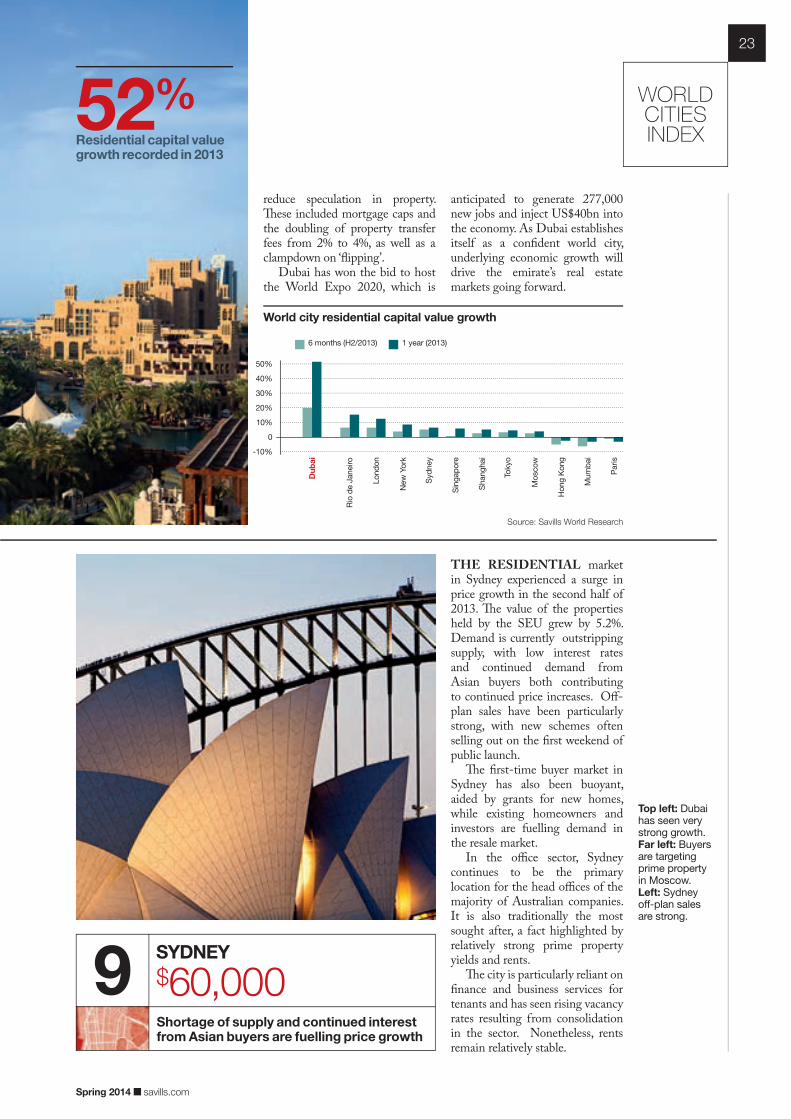
Prices have already appreciated 67% since their 2011 low, with annual growth of 52% in 2013 – by far the highest of any of our 12 cities (see chart opposite).
Following its extreme real estate boom and bust, there are a number of things Dubai is doing diff erently this time round. � e government introduced cooling measures in the second half of 2013 in a bid to
Learning from dramatic boom and bust to become a confident world city
7DUBAI
$72,000
Real estate markets have globalised, but will recent events curb growth?
8MOSCOW
$70,000
THE MOSCOW residential market recorded modest price growth of 2.2% in 2013, as transactions rose a quarter over 2012 levels. Interest in domestic real estate among wealthy Russians had been increasing prior to the crisis in Ukraine. For Russians, Moscow prime residential property was seen as a comparatively safe investment. It remains to be seen how it will be viewed following recent events.
Multiple home ownership among the world’s wealthy means that buyers have come to expect the same level of service and comfort from a new home in Moscow as they might do in London or Monaco, for example.
� is even extends to architecture and design: a substantial new development on the edge of Razdory, just outside Moscow, off ers wealthy Russians English-style mansions and landscaping modelled on Regent’s Park.
� e legacy of industrial areas in central parts of Moscow presents a signifi cant opportunity for redevelopment to both residential and offi ce use. � is will help to support the general expansion of the city’s prime markets as a number of high-profi le schemes become available for sale in the coming year.
EXPERT VIEW
‘Global property ownership is raising standards for Moscow’s prime residences’
PAUL TOSTEVIN Savills World Research [email protected]
Spring 2014 savills.com
16-25 Index V2 Savills World Cities14.indd 22 24/03/2014 21:14
23
Spring 2014 savills.com
reduce speculation in property. � ese included mortgage caps and the doubling of property transfer fees from 2% to 4%, as well as a clampdown on ‘fl ipping’.
Dubai has won the bid to host the World Expo 2020, which is
Shortage of supply and continued interest from Asian buyers are fuelling price growth
9SYDNEY
$60,000
WORLD CITIES INDEX
World city residential capital value growth
6 months (H2/2013)
Du
ba
i
Shang
hai
Rio
de J
aneiro
Tokyo
Lo
nd
on
Mo
sco
w
New
Yo
rk
Ho
ng
Ko
ng
Syd
ney
Mum
bai
Sin
gap
ore
Paris
0
20%
40%
10%
30%
50%
-10%
1 year (2013)
anticipated to generate 277,000 new jobs and inject US$40bn into the economy. As Dubai establishes itself as a confi dent world city, underlying economic growth will drive the emirate’s real estate markets going forward.
52%Residential capital value growth recorded in 2013
THE RESIDENTIAL market in Sydney experienced a surge in price growth in the second half of 2013. � e value of the properties held by the SEU grew by 5.2%. Demand is currently outstripping supply, with low interest rates and continued demand from Asian buyers both contributing to continued price increases. Off -plan sales have been particularly strong, with new schemes often selling out on the fi rst weekend of public launch.
� e fi rst-time buyer market in Sydney has also been buoyant, aided by grants for new homes, while existing homeowners and investors are fuelling demand in the resale market.
In the offi ce sector, Sydney continues to be the primary location for the head offi ces of the majority of Australian companies. It is also traditionally the most sought after, a fact highlighted by relatively strong prime property yields and rents.
� e city is particularly reliant on fi nance and business services for tenants and has seen rising vacancy rates resulting from consolidation in the sector. Nonetheless, rents remain relatively stable.
Top left: Dubai has seen very strong growth.Far left: Buyers are targeting prime property in Moscow. Left: Sydney off-plan sales are strong.
Source: Savills World Research
16-25 Index V2 Savills World Cities14.indd 23 24/03/2014 21:14
New development continues apace, despite general market cooling measures
10SHANGHAI
$44,000
24
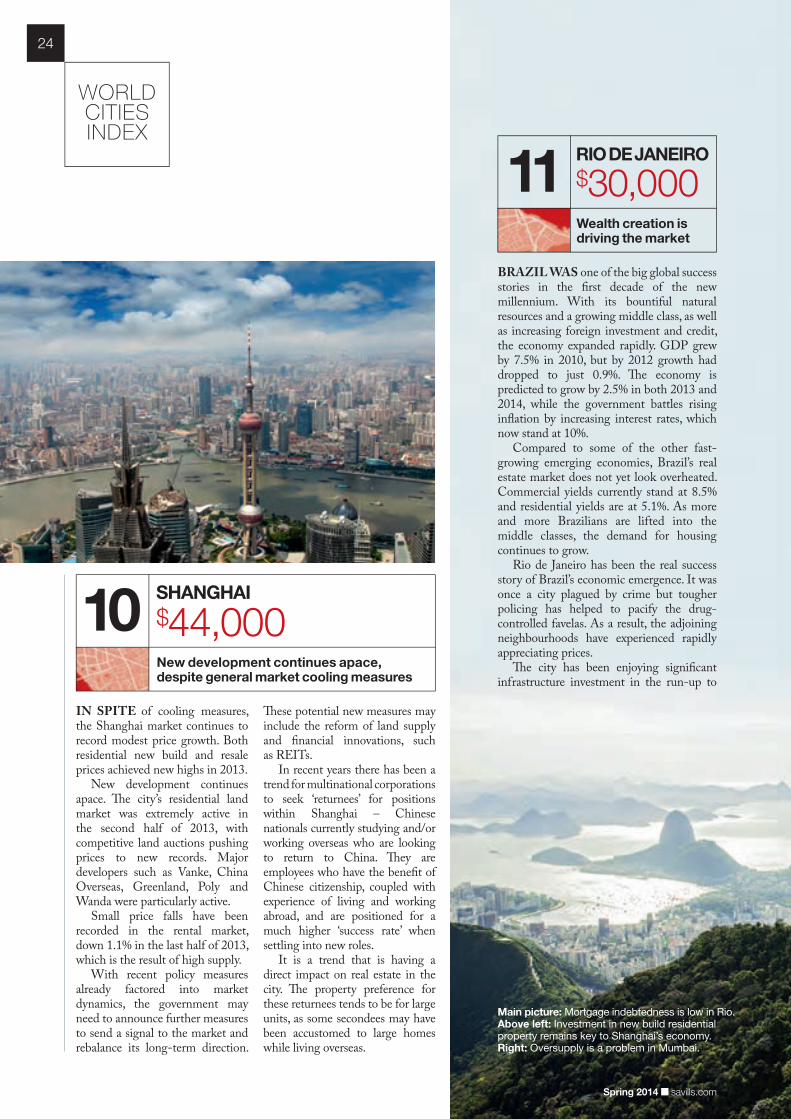
IN SPITE of cooling measures, the Shanghai market continues to record modest price growth. Both residential new build and resale prices achieved new highs in 2013.
New development continues apace. � e city’s residential land market was extremely active in the second half of 2013, with competitive land auctions pushing prices to new records. Major developers such as Vanke, China Overseas, Greenland, Poly and Wanda were particularly active.
Small price falls have been recorded in the rental market, down 1.1% in the last half of 2013, which is the result of high supply.
With recent policy measures already factored into market dynamics, the government may need to announce further measures to send a signal to the market and rebalance its long-term direction.
� ese potential new measures may include the reform of land supply and fi nancial innovations, such as REITs.
In recent years there has been a trend for multinational corporations to seek ‘returnees’ for positions within Shanghai – Chinese nationals currently studying and/or working overseas who are looking to return to China. � ey are employees who have the benefi t of Chinese citizenship, coupled with experience of living and working abroad, and are positioned for a much higher ‘success rate’ when settling into new roles.
It is a trend that is having a direct impact on real estate in the city. � e property preference for these returnees tends to be for large units, as some secondees may have been accustomed to large homes while living overseas.
BRAZIL WAS one of the big global success stories in the fi rst decade of the new millennium. With its bountiful natural resources and a growing middle class, as well as increasing foreign investment and credit, the economy expanded rapidly. GDP grew by 7.5% in 2010, but by 2012 growth had dropped to just 0.9%. � e economy is predicted to grow by 2.5% in both 2013 and 2014, while the government battles rising infl ation by increasing interest rates, which now stand at 10%.
Compared to some of the other fast-growing emerging economies, Brazil’s real estate market does not yet look overheated. Commercial yields currently stand at 8.5% and residential yields are at 5.1%. As more and more Brazilians are lifted into the middle classes, the demand for housing continues to grow.
Rio de Janeiro has been the real success story of Brazil’s economic emergence. It was once a city plagued by crime but tougher policing has helped to pacify the drug-controlled favelas. As a result, the adjoining neighbourhoods have experienced rapidly appreciating prices.
� e city has been enjoying signifi cant infrastructure investment in the run-up to
Main picture: Mortgage indebtedness is low in Rio.Above left: Investment in new build residential property remains key to Shanghai’s economy. Right: Oversupply is a problem in Mumbai.
Wealth creation is driving the market
11RIO DE JANEIRO
$30,000
WORLD CITIES INDEX
Spring 2014 savills.com
16-25 Index V2 Savills World Cities14.indd 24 24/03/2014 21:55

25
Further significant price corrections are likely as investors withdraw
12MUMBAI
$28,000
corporations. Offi ce costs fell by 3.6%, bringing annual falls to 8.2%.
India’s economic growth has slowed drastically in the past few years. GDP growth of 4.5% was recorded in 2012/13, down from a peak of 10.5% in 2010.
General elections, due in May, are another factor contributing to uncertainty in the market. With GDP growth expected to improve modestly to 4.9% in 2013/14, medium to long-term prospects for Mumbai real estate may be positive, but not before a more signifi cant price correction has occurred.
-8.2%The fall in Mumbai office costs during 2013
MUMBAI IS facing a huge oversupply of residential stock and the market has failed to absorb new projects launched in the city. Wider political and economic uncertainty has seen investors withdraw from the sector.
Developers have attempted to protect themselves by limiting new project launches and off ering sales incentives, but the market is fundamentally swinging in the buyer’s favour. Aff ordability is poor, while yields are low in relation to government bonds, both indications of the potential for more downward price correction – particularly if rental growth fails to increase substantially.
� e value of residential property in the SEU fell by 5% in H2 2013. � e commercial markets have been impacted by the scaling back or withdrawal of some multi-national
two global sporting events – the World Cup this year and the Olympics in 2016. Both of these will undoubtedly help to raise the city’s international profi le. It is no surprise that Brazilians are returning to Rio in large numbers. � e city is now growing at a faster rate than São Paulo.
� e rate of annual house price growth in Rio de Janeiro peaked at 40% in 2010, slowing to 15% in 2013. � is is much more in line with underlying occupier demand, matching rates of growth in rents. However, mortgaged indebtedness is low and credit control is strong, so the prospects for a substantial downward price correction seem relatively remote in the current climate of growing wealth creation.
While São Paulo is now Brazil’s fi nancial capital, Rio de Janeiro still boasts a major fi nancial district. Several multi-national corporations are based here – a legacy of the city’s days as the country’s capital.
Rio is also home to a signifi cant number of oil and gas companies, as well as telecommunications, entertainment and media organisations. Offi ce rents appreciated rapidly between 2010 and 2011, growing by 37% in a single year, although they have since fallen by 14%.
40millionThe number of Brazilians who joined the middle class between 2005 and 2011
Spring 2014 savills.com
GA
LLE
RY
STO
CK
, G
ETTY
IM
AG
ES
, JA
SO
N H
AW
KE
S, JA
SO
N P
ICK
ER
SG
ILL, S
HU
TTE
RS
TO
CK
16-25 Index V2 Savills World Cities14.indd 25 24/03/2014 21:18

Spring 2014 savills.com
OUTLOOK
On the horizonSeven predictions about the future of global real estate
We predict that secondary and even tertiary markets in our world cities could offer superior growth prospects compared to prime markets over the next five years.
TIME FOR GROWTH
We expect more even growth between our ‘old world’ and ‘new world’ cities in the medium term as emerging and recently emerged economies slow and old industrialised economies undergo repair.
BACK IN BALANCE
Some of the second-tier cities – seen as good alternatives to the premier league world cities in those countries with strengthening economic growth – could start to rise in popularity with both investors and occupiers as they are seen to represent better value.
GOOD VALUE
As the tapering and eventual demise of quantitative easing takes effect, the global growth in asset prices will inevitably slow. In particular, less money will flow into prime markets. We expect to see rental growth and capital growth realign.
CAPITAL FLOWS
Rental growth and softening, or even falling, capital values in some cities, such as Hong Kong, will make markets appear less overheated over the next few years.
A SOFT TOUCH
With bond yields and interest rates likely to rise soonest in Asia, rather than the industrialised West, it is in this region that we expect to see the most stress in overstretched markets in the short term.
SIGNS OF STRESS
It seems likely that the cities exhibiting the highest capital and rental growth over the next five years will lie outside this study. By 2018, we could be looking at 15 or 20 world cities. The ones to watch include major metropolises in up and coming economies, which include Istanbul, Hanoi,Kuala Lumpur, Jakarta and Bangkok, plus many large, second-tier cities in the same countries that few in the West have ever heard of.
NEW ARRIVALS
26
26 Outlook Savills World Cities14.indd 26 27/03/2014 15:48
Spring 2014 savills.com
27
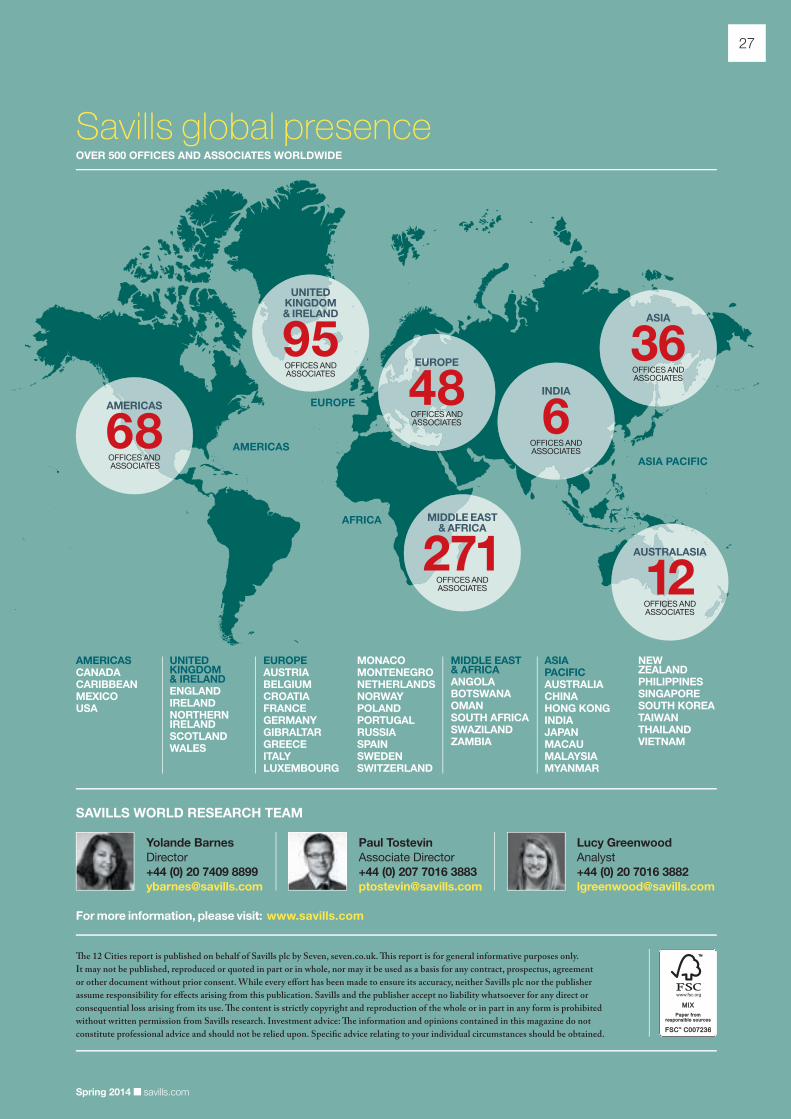
OVER 500 OFFICES AND ASSOCIATES WORLDWIDE
AMERICASCANADACARIBBEANMEXICOUSA
UNITED KINGDOM & IRELANDENGLANDIRELANDNORTHERN IRELAND SCOTLANDWALES
EUROPEAUSTRIABELGIUMCROATIAFRANCEGERMANYGIBRALTARGREECEITALYLUXEMBOURG
MONACOMONTENEGRONETHERLANDSNORWAYPOLANDPORTUGALRUSSIASPAINSWEDENSWITZERLAND
MIDDLE EAST & AFRICAANGOLABOTSWANAOMANSOUTH AFRICASWAZILANDZAMBIA
ASIA PACIFICAUSTRALIACHINAHONG KONGINDIAJAPANMACAUMALAYSIAMYANMAR
NEW ZEALANDPHILIPPINESSINGAPORESOUTH KOREATAIWANTHAILANDVIETNAM
AMERICAS
EUROPE
ASIA PACIFIC
AFRICA
AMERICAS
68OFFICES AND ASSOCIATES
Savills global presence
MIDDLE EAST & AFRICA
271OFFICES AND ASSOCIATES
UNITED KINGDOM & IRELAND
95OFFICES AND ASSOCIATES
ASIA
36OFFICES AND ASSOCIATES
EUROPE
48OFFICES AND ASSOCIATES
INDIA
6OFFICES AND ASSOCIATES
AUSTRALASIA
12OFFICES AND ASSOCIATES
� e 12 Cities report is published on behalf of Savills plc by Seven, seven.co.uk. � is report is for general informative purposes only.
It may not be published, reproduced or quoted in part or in whole, nor may it be used as a basis for any contract, prospectus, agreement
or other document without prior consent. While every e� ort has been made to ensure its accuracy, neither Savills plc nor the publisher
assume responsibility for e� ects arising from this publication. Savills and the publisher accept no liability whatsoever for any direct or
consequential loss arising from its use. � e content is strictly copyright and reproduction of the whole or in part in any form is prohibited
without written permission from Savills research. Investment advice: � e information and opinions contained in this magazine do not
constitute professional advice and should not be relied upon. Speci� c advice relating to your individual circumstances should be obtained.
For more information, please visit: www.savills.com
Yolande Barnes
Director
+44 (0) 20 7409 8899
SAVILLS WORLD RESEARCH TEAM
Paul Tostevin
Associate Director
+44 (0) 207 7016 3883
Lucy Greenwood
Analyst
+44 (0) 20 7016 3882
27 Contacts V2 Savills World Cities14.indd 27 24/03/2014 21:23

28 OBC V2 Savills World Cities14.indd 2828 OBC V2 Savills World Cities14.indd 28 24/03/2014 21:2524/03/2014 21:25