saving and borrowing in finland spring 2009. survey coverage: 2,400 persons (aged 15 to 74) time of...
Post on 22-Dec-2015
213 views
TRANSCRIPT

Saving and borrowing in Finland
Spring 2009

Survey
• Coverage: 2,400 persons (aged 15 to 74)
• Time of interviews:January 2009
• Interviewed by:IRO Research Oy

Savings and investments
37
46
51
52
52
55
58
0 10 20 30 40 50 60
2003
2004
2005
2006
2007
2008
2009
Q: Do you hold savings or investments at the moment?
% of respondents
Yes

Saving and investment vehicles
25
19
10
9
4
6
26
15
14
6
11
27
27
19
13
6
9
22
25
17
12
6
9
27
31
19
12
6
10
26
34
17
13
6
9
26
0 10 20 30 40
Current account
Savings, deposit orother bank account
Mutual fund units
Listed shares
Endowment policies
Voluntary personalpension policies
2003 2004 2006 2007 2008 2009
% of respondents (n=2,393 in 2009)
Which of the following vehicles do you hold?

Holders of savings, investment, or other bank accounts broken down by age
27 2832
2521
34 3436
29
36 3735
2527
32 33 3431
3335
40
46
3935
0
5
10
15
20
25
30
35
40
45
50
15-19 20-24 25-28 29-34 35-39 40-44 45-49 50-54 55-59 60-64 65-69 70-74
2008 2009
Do you hold savings or other assets at the moment?
% of respondents (n=2,393 in 2009)

Saving and investment intentions
39
43
44
48
0 20 40 60
2006
2007
2008
2009
% of respondentsYes
Q: Do you intend to save or invest during the next 12 months?

Saving and investment intentions
7
4
6
2
16
12
4
4
2
10
16
13
5
5
1
10
22
10
4
5
2
12
26
8
5
5
2
9
0 10 20 30
Current account
Savings, investment orother account
Mutual fund units
Listed shares
Personal pensioninsurance
Endowment insurance
2004 2006 2007 2008 2009
Q: In which of the following vehicles do you plan to save or invest?
% of respondents

For what purpose are you saving or investing money
% of present or potential savers/investors (n=1,645 in 2009)
Q: For what purpose are you going to use the money saved or invested?
2
3
4
6
15
19
23
54
0 10 20 30 40 50 60
Studies
Renovation
Holiday trip
Inheritance
Home purchase
Retirement
Consumer goods
For a rainy day

Saving and investment criteria
73 74 76 74 76 7262 60
47 47 52 51 51 44
24 28 28 29
19 21 18 21 20 2231 30
38 39 36 38 3943
3838 40 37
5 2 4 4 3 4 5 8 13 12 9 8 8 11
34 31 29 31
0 %
10 %
20 %
30 %
40 %
50 %
60 %
70 %
80 %
90 %
100 %
04 05 06 07 08 09 08 09 04 05 06 07 08 09 06 07 08 09
Very much Somewhat Not at all Cannot say
Security Return
How much was your choice of savings or investment vehicle impacted by the following factors?% of respondents
Provision for retirement
Free of risk
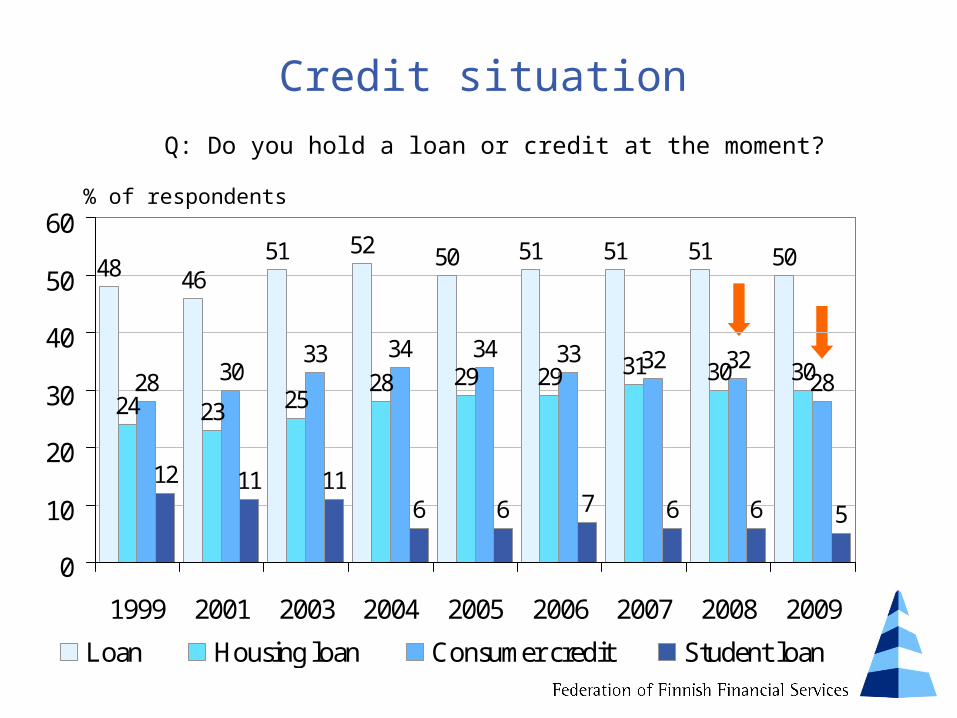
Credit situation
48 4651 52 50 51 51 51 50
24 23 2528 29 29 31 30 3028 30
33 34 34 33 32 3228
12 11 116 6 7 6 6 5
0
10
20
30
40
50
60
1999 2001 2003 2004 2005 2006 2007 2008 2009
Loan Housing loan Consumer credit Student loan
Q: Do you hold a loan or credit at the moment?
% of respondents

18
11
6
7
5
18
11
6
6
4
16
10
4
6
4
17
11
5
5
3
2
17
9
2
3
2
2
0 5 10 15 20
Consumer loan from bank
Overdraft account
Loyal customer card credit from store
Other card credit with grace up to 2 mos
Store hire-purchase credit
Raised fast cash in past 12 months
2005 2006 2007 2008 2009
Consumer credit types
% of respondents (n=2,393 in 2009)
Do you currently hold loans other than home loan?Have you borrowed fast cash in the past 12 months?
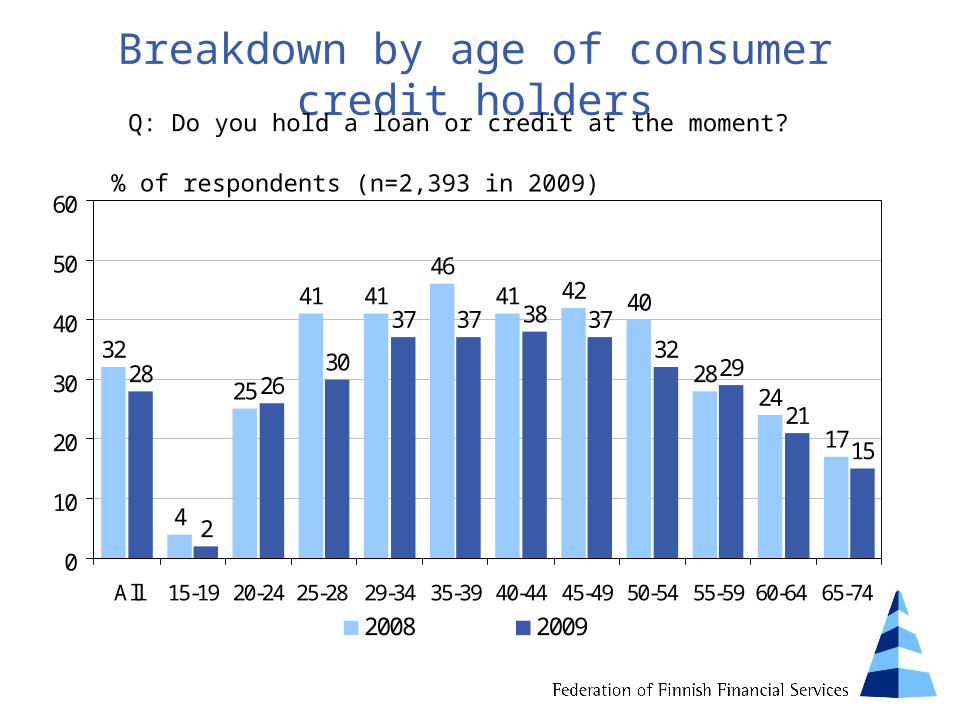
Breakdown by age of consumer credit holders
32
4
25
41 4146
41 42 40
2824
17
28
2
2630
37 37 38 3732
29
21
15
0
10
20
30
40
50
60
All 15-19 20-24 25-28 29-34 35-39 40-44 45-49 50-54 55-59 60-64 65-74
2008 2009
Q: Do you hold a loan or credit at the moment?
% of respondents (n=2,393 in 2009)

2,1 2,1
5,1
1,02,2
1,4
0
2
4
6
8
All Under 20 20-28 29-39 40-49 Over 50
age of respondent, yrs
Fast cash borrowed in past 12 monthsQ: Have you borrowed fast cash in the past 12 months, ie small cash loan raised for
a short time by eg text message?
% of respondents (n=2,393 in 2009), yes replies

Borrowing plans
13
12
12
11
10
9
0 5 10 15 20
2004
2005
2006
2007
2008
2009
% of respondentsYes
Q: Are you planning to take a new loan or credit during the next 12 months?

Borrowing plans broken down by type of credit
4
1
5
5
1
1
6
3
1
1
4
4
1
1
5
3
1
1
6
0 5 10 15 20
Housing loan
Consumer creditfrom a bank
Other consumercredit *)
Student loan
2004 2005 2007 2008 2009
Q: Which of the following credits are you planning to take?
% of respondents
*) Other consumer credit = Bank account with credit facility, loyal customer card credit of a store, other card credit (term of payment over 2 months) or hire purchase credits

Housing loan repayment period, 2009
63
153
94
233
223
61
0 5 10 15 20 25
1 - 5 years6 - 9 years
10 years11 - 14 years
15 years16 - 19 years
20 years21 - 24 years
25 years26-29 years
30 years40 years
% of housing loans taken during the last two years (n=239)
Q: What was the original repayment period of your housing loan?
Average repayment period in: 1998, 11 years 2005, 16 years 2006, 17 years 2007, 18 years 2008, 19 years 2009, 19 years
(17 in 2008)
(25 in 2008)
10 (10 in 2008)

Average home loansQ: How big is your home loan at the moment?
20,300
30,20035,800
42,00044,900
58,30065,300
71,50076,500
0
10,000
20,000
30,000
40,000
50,000
60,000
70,000
80,000
90,000
1999 2001 2003 2004 2005 2006 2007 2008 2009
(% of respondents who hold a home loan, n=717 in 2009)€
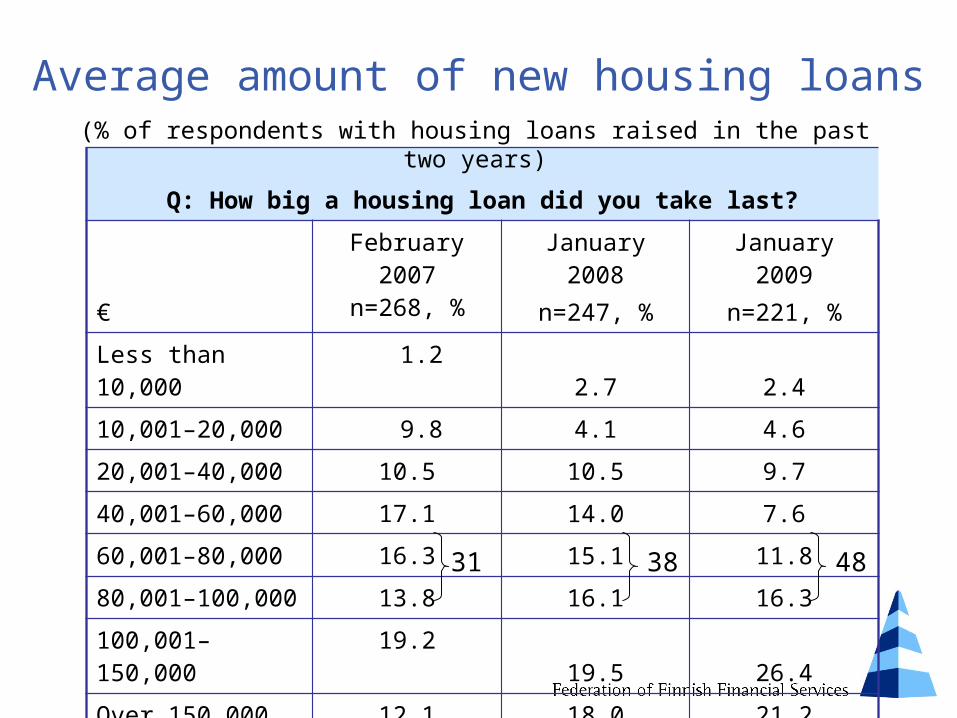
Average amount of new housing loans
Q: How big a housing loan did you take last?
€
February 2007n=268, %
January 2008n=247, %
January 2009n=221, %
Less than 10,000 1.2 2.7 2.4
10,001–20,000 9.8 4.1 4.6
20,001–40,000 10.5 10.5 9.7
40,001–60,000 17.1 14.0 7.6
60,001–80,000 16.3 15.1 11.8
80,001–100,000 13.8 16.1 16.3
100,001–150,000 19.2 19.5 26.4
Over 150,000 12.1 18.0 21.2
On average, € 85,300 96,200 107,500
(% of respondents with housing loans raised in the past two years)
31 38 48
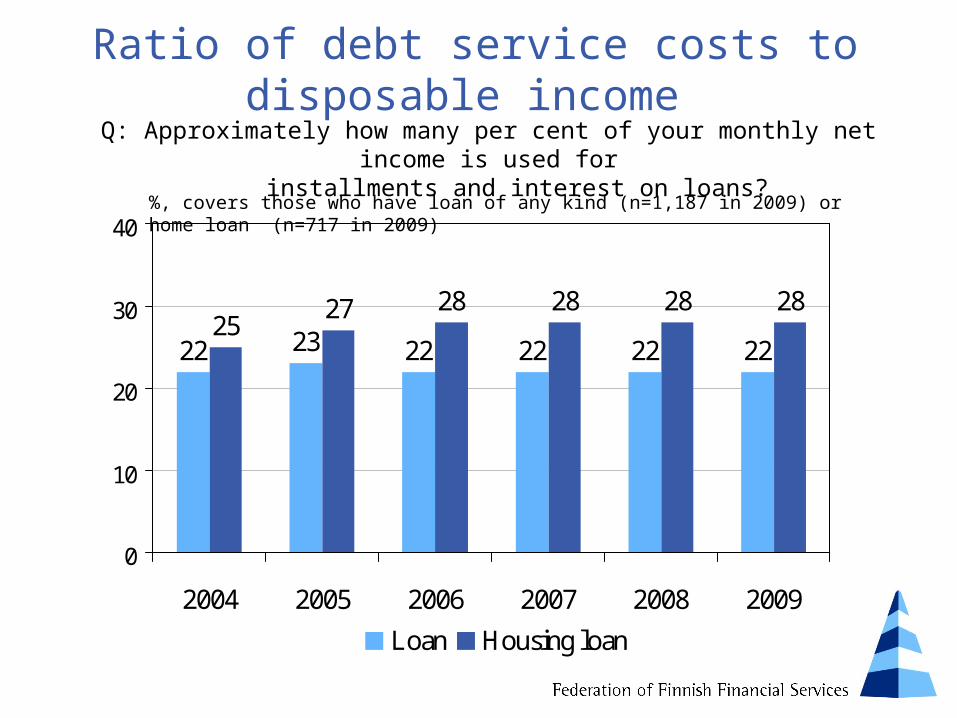
Ratio of debt service costs to disposable income
22 23 22 22 22 2225
27 28 28 28 28
0
10
20
30
40
2004 2005 2006 2007 2008 2009
Loan Housing loan
%, covers those who have loan of any kind (n=1,187 in 2009) or home loan (n=717 in 2009)
Q: Approximately how many per cent of your monthly net income is used for installments and interest on loans?

Ratio of debt service costs to disposable income
3
6
10
22
18
31
2
6
10
20
20
28
0 10 20 30 40
Over 50 %
41 - 50 %
31 - 40 %
21 - 30 %
11 - 20 %
Less than 10 %
2009 2008
% of all borrowers (n=1,187 in 2009)
Q: How many per cent of your take-home pay is spent on interest and loan repayments?

Changes in repayment plans
76
7
10
74
11
10
77
10
9
76
10
7
0 20 40 60 80 100
Repaid according to plan
Repaid sooner
Repaid later
2006 2007 2008 2009
Q: Have you repaid the loans according to the original plan or have you made changes to the original repayment plan?
% of respondents who hold a loan or credit (n=1,187 in 2009)

Risk factors in personal finances
% of respondents (n=2,393 in 2009)
Q: Which of the following risk factors do you see as a threat to your financial situation?
10
13
16
23
32
57
42
0 10 20 30 40 50 60
Value of home falls
Savings or investments lose value
Temporary layoff
Unemployment
Loss of personal or household income (eg illness, disabilityfor work, divorce, death of family member)
Breakdown of individual risks (n=1,364):
Some risks seen as threat
No risks seen as threat

Preparing for risks in personal finances
% of those who felt risks are looming and were prepared for the risks (n=742 in 2009)
Q: What is your way to prepare for risk factors in your personal finances?
2
2
2
3
4
4
8
9
10
57
0 10 20 30 40 50 60
Rescheduling loan payments
Selling assets
Taking care of own health
Just watching developments
Working harder
Relying on trade union/Unemployment fund
Investments
Frugal living
Insurance
Savings

Risks affecting home loans
% of those who see risks that may affect their home loan (n=119 in 2009)
Q: What risks do you think may affect your home loan?
4
6
7
12
12
25
40
0 10 20 30 40 50
Loss of income
Loss in value of home/ Changes in property prices
Financial problems in household
Global situation, recession
Health factors, illness, death
Interest rate rises
Work-related factors
17% of mortgage holders see risks, 83% do not

Interest rate cap
23
30
40
21
30
43
0 20 40 60
Loan protected by interest ratecap
Home loans raised less than ayear ago
Planning to cap interest rate
2008 2009
Q: Do you have an interest rate cap on your loan to ensure interest payments stay within agreed limit?Are you going to have your interest rate capped to protect against rate
rises above agreed?
% of holders of home loan or consumer credit from bank (n=962 in 2009)% of those who are planning to raise a home loan or consumer loan from bank (n=185 in 2009)

Loans covered by loan insurance
20 2226 26 27 28 28 28
34 36 37 37 37 37
05
1015202530354045
2001 2003 2004 2005 2006 2007 2008 2009
Loan Housing loan
Q: Are any of your loans covered by payment protection insurance which secures repayment of the loan?
% of respondents who have a loan (n=1,187 in 2009) or housing loan (n=717 in 2009)
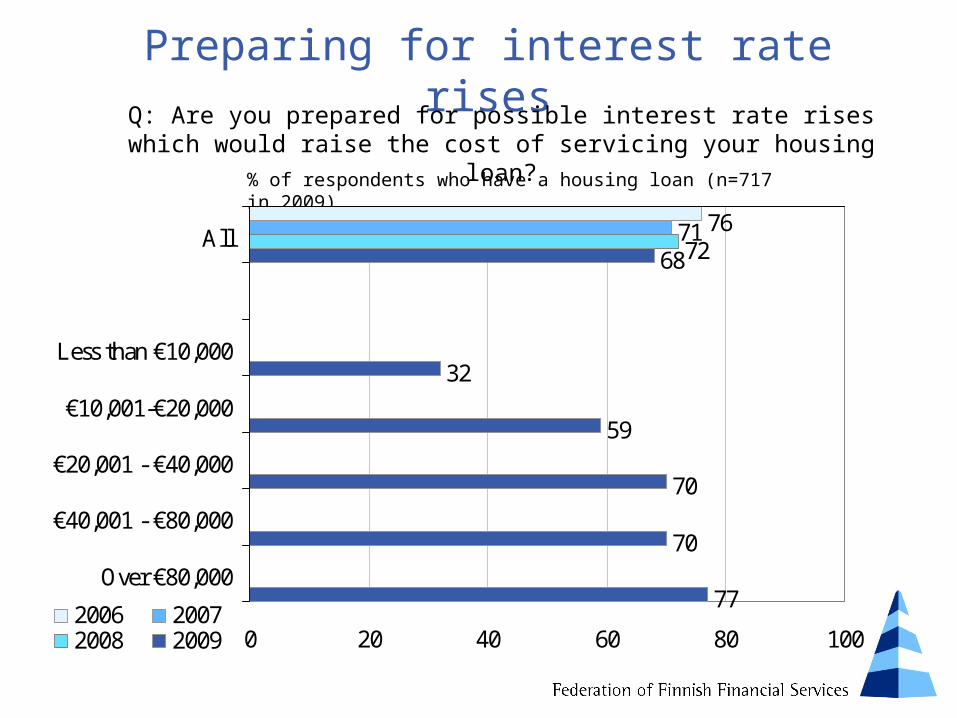
Preparing for interest rate rises
% of respondents who have a housing loan (n=717 in 2009)
Q: Are you prepared for possible interest rate rises which would raise the cost of servicing your housing loan?
767168
32
59
70
70
77
72
0 20 40 60 80 100
All
Less than €10,000
€10,001-€20,000
€20,001 - €40,000
€40,001 - €80,000
Over €80,000
2006 20072008 2009

Why are you not prepared for interest rate rises
20
8
10
11
4
4
23
15
8
7
5
2
14
11
8
14
4
6
0 5 10 15 20 25
Small loan / Much of the loan already repaid
No need
No problem, believes is able to repay, earns agood income
Does not believe rate will rise much / Considersrate is steady
Fixed interest rate
Constant payment loan, paymentshave remained unchanged
2007 2008 2009
% of respondents who are not prepared for interest rate rises (n=230 in 2009)
Q: Are you prepared for interest rate rises and resulting rise in debt service costs? If you are not prepared, why not?

15
8
7
7
15
7
5
3
0 5 10 15 20
By saving in advance
Rises taken into account on application / Monthly repayment moderate
Extending repayment
Choosing fixed interest rate
Negotiating interest rate with bank
2008 2009
Preparing for interest rate rises
% of mortgage holders who are prepared for interest rate rises (n=487 in 2009)
Q: How are you prepared for interest rate rises

Typical ways of paying bills
4
16
9
30
39
40
16
23
14
34
17
66
13
11
3
12
6
3
75
7
10
4
3
20
29
10
13
16
39
10
12
34
5
9
68
0 10 20 30 40 50 60 70 80
1994 1999 2001 2003 2006 2008 2009
Q: What is the most typical way you pay your bills?
% of respondents
Internet (via PC)
ATM
Direct debit
Payment service with service envelope
At branch

Most common ways of paying bills in different age groups in 2009
" Q: What is the most typical way you pay your bills?
% of respondents
56
09
92
0 1
96
2 1
88
4 1
77
93
59
18
5
37 33
5
0
20
40
60
80
100
Internet (via PC) Direct debit At branch
15-17 (n=121) 18-24 (n=275) 25-34 (n=404) 35-44 (n=401)45-54 (n=461) 55-64 (n=452) 65-74 (n=279)

Paying for daily shopping
% of respondents
Q: How do you pay for your daily shopping normally?
71
17
3
2
21
3
30
2
3
43
45
7
2
1
5
2
35
45
10
8
1
2
6558
1
8
49
37
0 10 20 30 40 50 60 70 80
Cash
Bank card
Visa Electron card
Credit card
Retailer'spayment/credit card
1999 2001 2003 2006 2008 2009