sb 14-29 revenue-financed investment:the size of … · revenue-financed investment:the size of...
TRANSCRIPT

The Scottish Parliament and Scottish Parliament Infor mation C entre l ogos .
Financial Scrutiny Unit Briefing
Revenue-financed investment:the size of Scotland’s PFI and NPD liability
24 April 2014
14/29
Allan Campbell and Andrew Aiton
This briefing sets out a range of information on the level of revenue-financed investment in Scotland, including how much individual public authorities have paid for PFI and NPD schemes, and how much they still owe.
£851m
£1,365m
£1,437m
£2,735m
£12,562m
£6,563m
£3,016m
£2,407m
£24,548m£6,388m
Local Authorities
Health Boards
Scottish WaterOther
Payments
madeEstimated future
payments

2
CONTENTS
EXECUTIVE SUMMARY .............................................................................................................................................. 3
INTRODUCTION .......................................................................................................................................................... 4
PFI AND NPD PROJECTS IN OPERATION ............................................................................................................... 5
OVERALL REVENUE-FINANCED INVESTMENT LIABILITY ................................................................................. 5 RATIOS OF UNITARY CHARGES: CAPITAL VALUE ............................................................................................ 6 LOCAL AUTHORITIES ............................................................................................................................................ 7 HEALTH BOARDS ................................................................................................................................................. 11 OTHER BODIES .................................................................................................................................................... 12 SECTORAL SPLIT ................................................................................................................................................. 12
FUTURE PROJECTS ................................................................................................................................................. 14
ANNEX – DEFINITIONS OF PFI AND NPD .............................................................................................................. 16
SOURCES .................................................................................................................................................................. 17

3
EXECUTIVE SUMMARY
This briefing provides analysis of a range of statistics on the scale of unitary charge payments that Scottish public bodies are liable to pay for Private Finance Initiative (PFI) and Non-Profit Distributing Model (NPD) projects. PFI and NPD are both forms of public private partnership (PPP) capital funding. However, the briefing does not discuss any perceived advantages and disadvantages of either method, or any other method of funding capital investment projects, and is solely intended to present the large amount of related data in an accessible and easy to understand format.
Based on currently operational projects across the Scottish public sector, both PFI and NPD unitary charges total £35,302.6 million, of which £6,509 million (18%) has so far been paid.
Based on currently signed projects, the annual payments will peak around 2025-26. However, with the large number of NPD projects still to come on stream, these numbers will increase.
The briefing provides a detailed breakdown of the liability due for these projects, both by procuring authority and by sector, before looking at the future pipeline of projects.

4
INTRODUCTION
The purpose of this briefing is to provide analysis of a range of statistics on the scale of unitary charge payments that Scottish public bodies are liable to pay for Private Finance Initiative (PFI) and Non-Profit Distributing Model (NPD) projects.
All statistics in this briefing are taken from the following publications—
Private Finance Initiative Projects: current projects as at 31 March 2013 (HM Treasury);
NPD Projects (operational) – as of March 2013 (Scottish Government); and
£2.5bn Pipeline of Revenue Funded Signed and hub projects (operational/in construction – as at 1

5
4 March 2014 (Scottish Government)
Revenue Funded Infrastructure Investment in Scotland, as at November 2013 (Scottish Futures Trust)
Please note that this briefing does not discuss any perceived advantages and disadvantages of either method, or any other method of funding capital investment projects. This briefing is solely intended to present the large amount of related data in an accessible and easy to understand format.
The annex to this briefing provides a brief explanation of the two funding models.
PFI AND NPD PROJECTS IN OPERATION
All information in this section is based on currently operational/ in construction projects, which appear on the Treasury and Scottish Government spreadsheets referred to above. Later on the briefing examines those projects still to become operational and therefore those that have yet to have their unitary charge payment information published. It should be noted that all figures for ‗payments made‘ include one year, 2012-13, of estimated unitary charges for NPD.
OVERALL REVENUE-FINANCED INVESTMENT LIABILITY
Table 1 below shows that, based on currently operational projects across the Scottish public sector, both PFI and NPD unitary charges total £35,302.6 billion, of which £6,509 million (18%) has so far been paid.
Table 1: Overall unitary charge payments – PFI and NPD
Number of projects
Payments made by 2012-13 (£m)
Estimated future payments (£m)
Total (£m)
PFI 83 6,388.4 24,547.8 30,936.1
NPD 12 173.3 4,193.1 4,366.4
Total 95 6,509.3 28,793.2 35,302.6
Figure 1 below focuses on PFI, and divides the PFI payments into major groups of public bodies. This shows that local authorities have the highest level of liability, more than double that of the next largest group, health boards. Both of these groups are further broken down below.
Figure 1: Overall PFI payments – by group of public bodies

6
Figure 2 below shows the level of payments for all PFI and NPD projects over time. Based on currently signed projects, the annual payments will peak around 2025-26. However, as mentioned elsewhere, with the large number of NPD projects still to come on stream, these numbers will increase.
In 2011, the Scottish Government stated that it will ensure that the payments resulting from revenue-financed investment (including PFI and NPD) will not exceed 5% of its total budget. This ―5% cap‖ is discussed in detail in Monitoring long-term investment commitments: the 5% cap (Hudson 2013).
Figure 2: Overall unitary charge payments by financial year (£m)
RATIOS OF UNITARY CHARGES: CAPITAL VALUE
£851m
£1,365m
£1,437m
£2,735m
£12,562m
£6,563m
£3,016m
£2,407m
£24,548m£6,388m
Local Authorities
Health Boards
Scottish WaterOther
Payments
madeEstimated future
payments
0
200
400
600
800
1,000
1,200
1,400
1997-98 2002-03 2007-08 2012-13 2017-18 2022-23 2027-28 2032-33 2037-38 2042-43
NPD
PFI

7
Table 2 and figure 3 show, in terms of total projects for each funding model, the ratio of total unitary charge payments to capital value, as shown on the HM Treasury and Scottish Government spreadsheets. Again, many more, sometimes very large, NPD projects are due to come on stream in the coming years, which will alter the NPD figures. Details on planned NPD projects are given later in this briefing (see Table 7).
Based on the data available, PFI projects on average result in unitary charges of around 5.4 times the total capital value of the projects, the figure for NPD projects is 3.9 times the capital value.
But, there are some caveats to note around these figures which mean that they are not wholly comparable.
The unitary payment charge is paid by the public sector procuring body to the private sector consortium for the services agreed and provided over length of the PFI, NPD or hub contract. The services provided are dependent on type of project but can include capital construction, lifecycle maintenance and facilities management where relevant.
Unlike the majority of previous PFI projects, most of the contracts for those projects within the £2.5 billion NPD/hub Pipeline will not have ‗soft‘ facilities maintenance included (e.g. cleaning etc.). However ‗hard‘ facilities maintenance is included (e.g. building maintenance). Likewise, the majority of the unitary charge payments relating to the construction costs and the financing of that construction are not indexed linked (i.e. they do not automatically increase with inflation each year).
In addition, some contracts are generally not comparable (i.e. a road against a hospital) given that the make-up of contract provisions and services provided will vary significantly.
Table 2: Ratios of unitary charges: capital value
Total Capital value
(£m) Total Unitary Charge
(£m) Ratio
PFI 5,690 30,936 5.4
NPD 1,114.9 4,366.4 3.9
Figure 3: Ratios of unitary charge: capital value
Note:
For the purposes of figure 3 the PFI projects for Road and Highway Maintenance and Hospital and Acute Health have been classified as
Transport and Heath respectively. IT Infrastructure and communications has been shortened to IT
LOCAL AUTHORITIES
Further
EducationHealth IT Offices OtherPrisons Schools Transport Waste Overall
3.0
3.1
6.5
3.5
8.5 5.0 6.111.7 4.6
4.1
4.0
4.5
7.8 5.4
3.9
PFI
Energy
NPD

8
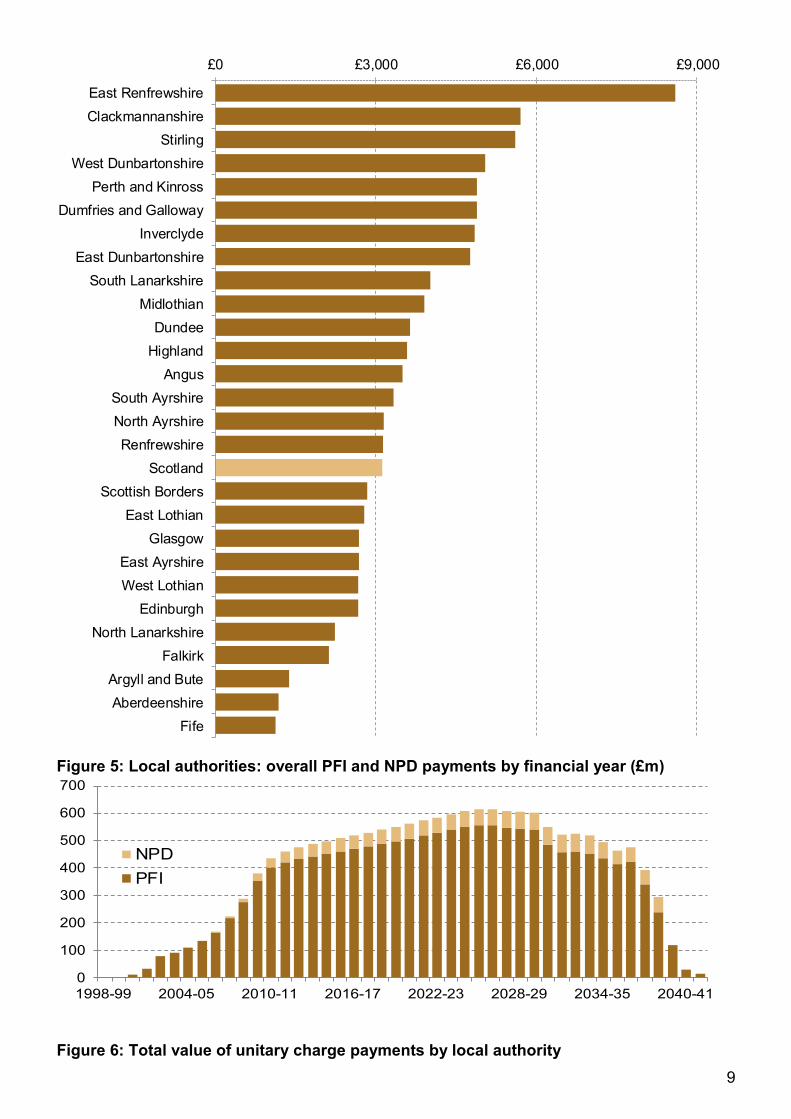
Table 3 and the following figures 4, 5 and 6 set out the position for each individual local authority that has a PFI or NPD project, again based on the currently operational projects data. All mainland authorities have at least one such project, the three island authorities do not.
Table 3: Overall unitary charge payments per local authority
Local Authority Number of projects
Payments made by 2012-
13 (£m)
Charges (£m)
Total (£m)
PFI
Aberdeenshire 2 83.2 216.1 299.3
Angus 2 67.1 340.4 407.4
Argyll and Bute 1 51.4 71.3 122.7
Edinburgh 2 218.0 1,055.9 1,273.9
Glasgow 1 519.4 1,074.7 1,594.1
Clackmannanshire 1 27.5 266.0 293.5
Dumfries and Galloway 2 116.1 623.9 740.0
Dundee 2 85.3 450.6 535.9
East Ayrshire 1 50.3 278.5 328.8
East Dunbartonshire 1 48.9 451.0 499.9
East Lothian 1 68.5 209.2 277.7
East Renfrewshire 3 179.5 601.5 781.0
Falkirk 1 150.6 180.7 331.3
Fife 2 108.8 303.3 412.0
Highland 2 126.5 706.4 832.9
Inverclyde 1 20.6 373.4 394.0
Midlothian 2 68.9 257.5 326.4
North Ayrshire 1 58.6 376.7 435.4
North Lanarkshire 1 106.4 646.5 752.9
Perth and Kinross 2 75.6 642.4 718.1
Renfrewshire 1 87.9 459.7 547.6
Scottish Borders 1 28.1 295.4 323.5
South Ayrshire 1 43.1 333.4 376.5
South Lanarkshire 1 126.9 1,134.5 1,261.4
Stirling 2 90.8 415.0 505.9
West Dunbartonshire 1 39.9 417.5 457.4
West Lothian 2 87.3 380.2 467.4 Total 40 2,735.1 12,561.7 15,296.8
NPD
Aberdeen City 1 46.1 456.0 502.1
Argyll and Bute 1 69.8 335.2 405.0
Edinburgh (South East hub) 1 0.0 102.8 102.8
Falkirk 1 43.1 437.8 481.0
Moray 1 4.8 167.3 172.1
Total 5 163.9 1,499.1 1,662.9
PFI & NPD
Total 45 2,899.0 14,060.7 16,959.8
Figure 4: PFI spend per head by Local Authority
9
Figure 5: Local authorities: overall PFI and NPD payments by financial year (£m)
Figure 6: Total value of unitary charge payments by local authority
£0 £3,000 £6,000 £9,000
East Renfrewshire
Clackmannanshire
Stirling
West Dunbartonshire
Perth and Kinross
Dumfries and Galloway
Inverclyde
East Dunbartonshire
South Lanarkshire
Midlothian
Dundee
Highland
Angus
South Ayrshire
North Ayrshire
Renfrewshire
Scotland
Scottish Borders
East Lothian
Glasgow
East Ayrshire
West Lothian
Edinburgh
North Lanarkshire
Falkirk
Argyll and Bute
Aberdeenshire
Fife
0
100
200
300
400
500
600
700
1998-99 2004-05 2010-11 2016-17 2022-23 2028-29 2034-35 2040-41
NPD
PFI
10
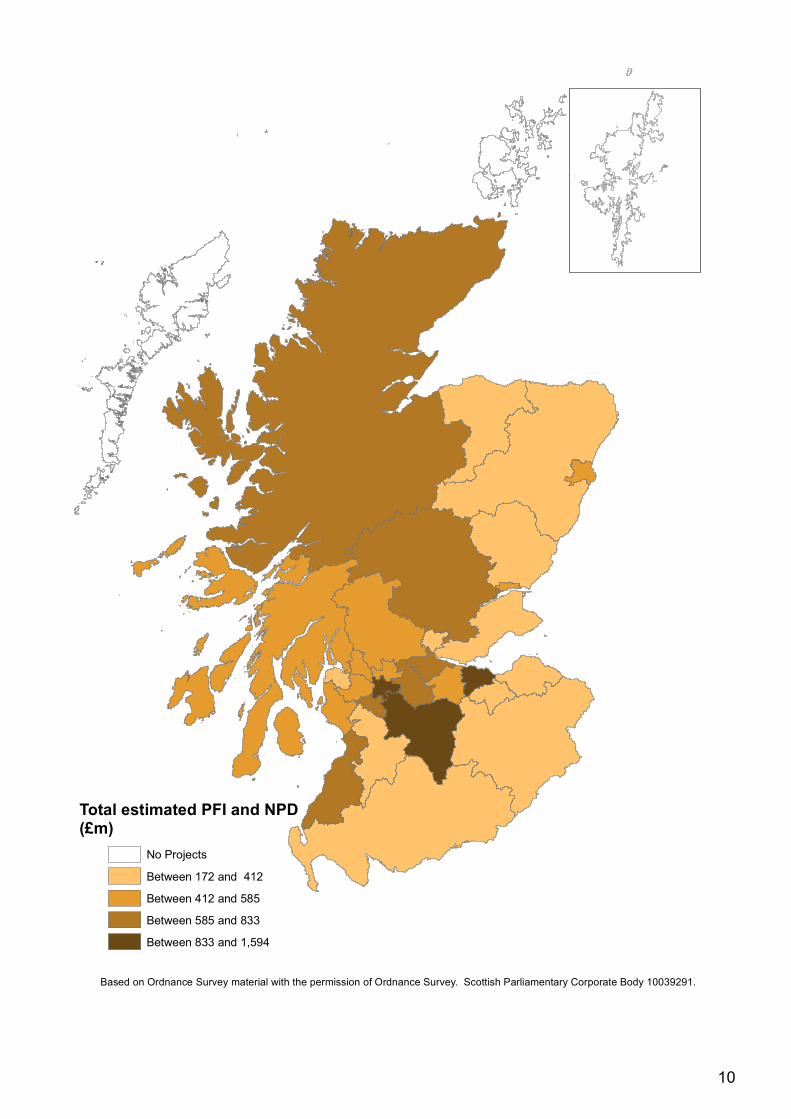
Based on Ordnance Survey material with the permission of Ordnance Survey. Scottish Parliamentary Corporate Body 10039291.
Total estimated PFI and NPD(£m)
No Projects
Between 172 and 412
Between 412 and 585
Between 585 and 833
Between 833 and 1,594

11
HEALTH BOARDS
Table 4 and Figure 7 below set out the data as they apply to those health boards that have PFI/NPD projects.
Table 4: Overall unitary charge payments per health board
Health Board Number
of projects
Payments made by 2012-
13 (£m)
Charges (£m)
Total (£m)
PFI
NHS Ayrshire and Arran 2 32.6 94.6 127.2
NHS Dumfries and Galloway 1 17.1 51.2 68.3
NHS Fife 2 38.6 976.5 1,015.1
NHS Forth Valley 2 114.0 1,758.8 1,872.8
NHS Greater Glasgow and Clyde 6 143.7 1,276.3 1,420.0
NHS Highland 3 69.2 164.2 233.4
NHS Lanarkshire 3 508.8 1,012.9 1,521.7
NHS Lothian 6 478.3 1,153.4 1,631.8
NHS Tayside 2 34.5 75.0 109.5
Total 27 1,436.9 6,562.9 7,999.8
NPD
NHS Grampian (North hub) 1 0.0 48.9 48.9
NHS Grampian & NHS Highland (North hub)
1 0.0 43.9
43.9
NHS Lanarkshire (South West hub) 1 0.0 114.7 114.7
NHS Tayside 1 9.5 354.3 363.7
Total 4 9.5 561.8 571.3
PFI & NPD
Total 31 1,446.4 7,124.7 8,571.1
Figure 7: Total unitary charge payment per health board (£m)
44
49
68
127
233
473
1,015
1,420
1,632
1,636
1,873
NHS Grampian & NHS Highland
NHS Grampian
NHS Dumfries and Galloway
NHS Ayrshire and Arran
NHS Highland
NHS Tayside
NHS Fife
NHS Greater Glasgow and Clyde
NHS Lothian
NHS Lanarkshire
NHS Forth Valley
PFI
NPD

12
OTHER BODIES
Table 5 below sets out those other organisations with PFI/NPD projects. Scottish Water has the largest number of projects, with associated payments totalling £4.4bn.
Table 5: Overall unitary charge payments: other public bodies
Number of projects
Payments made by 2012-
13 (£m)
Charges (£m)
Total (£m)
PFI
Scottish Children's Reporter Administration
1 19.8 29.5 49.3
Scottish Further and Higher Education Funding Council
1 25.6 0.0 25.6
Scottish Government 1 390.7 456.8 847.5
Scottish Prison Service 2 319.0 993.0 1,312.0
Scottish Water 9 1,365.2 3,016.0 4,381.2
Strathclyde Police1 1 48.9 57.4 106.4
Transport Scotland 1 47.1 870.5 917.6
Total 16 2,216.3 5,423.2 7,639.6
NPD
City of Glasgow College 1 0.0 603.9 603.9
Inverness College 1 0.0 137.2 137.2
Transport Scotland 1,391.1 1,391.1 4.5 1 0.0 1,391.1 1,391.1
Total 3 0.0 2132.2 2132.2
PFI & NPD
Total 19 2,216.3 7,555.4 9,771.8
Figure 8: Overall unitary charge payments: other public bodies
1 Following all of Scotland's regional police forces being replaced by just one, the liability has transferred from local
to central government and Strathclyde Police has been replaced by the Scottish Police Authority.
26
49
106
137
604
848
1,312
2,309
4,381
Scottish Further and Higher EducationFunding Council
Scottish Children's ReporterAdministration
Strathclyde Police
Inverness College
City of Glasgow College
Scottish Government
Scottish Prison Service
Transport Scotland
Scottish Water
PFI
NPD

13
SECTORAL SPLIT
Table 6 and figure 8 below set out the overall unitary charge payments, divided by different sectors, as set out in the HM Treasury and Scottish Government spreadsheets.
Table 6: Overall unitary charge payments: sectoral split
Sector Number of projects
Payments made by 2012-
13 (£m)
Charges (£m)
Total (£m)
PFI
Energy 1 43.0 86.9 129.8
Hospitals and Acute Health 27 1,436.9 6,562.9 7,999.8
IT Infrastructure and communications
1 25.6 0.0 25.6
Offices 1 34.0 40.5 74.6
Prisons 2 319.0 993.0 1,312.0
Roads and Highway Maintenance
4 576.6 1,874.7 2,451.4
Schools 34 2,394.1 11,632.4 14,026.5
Waste 11 1,490.5 3,270.4 4,760.9
Other 2 68.7 87.0 155.6
Total 83 6,388.4 24,547.8 30,936.1
NPD
Further Education 2 0.0 741.0 741.0
Health 4 9.5 561.8 571.3
Schools 5 163.9 1,499.1 1,662.9
Transport 1 0.0 1,391.1 1,391.1
Total 12 173.3 4,193.1 4,366.4
PFI & NPD
Total 95 6,561.7 28,740.9 35,302.5
Figure 9: Overall unitary charge payments: sectoral split2
2 For the purposes of figure 9 the PFI projects for Road and Highway Maintenance and Hospital and Acute Health
have been classified as Transport and Health respectively. IT Infrastructure and communications has been
shortened to IT
26
75
130
156
741
1,312
3,843
4,761
8,571
15,689
IT
Offices
Energy
Other
Further Education
Prisons
Transport
Waste
Health
Schools
PFI
NPD
14
FUTURE PROJECTS
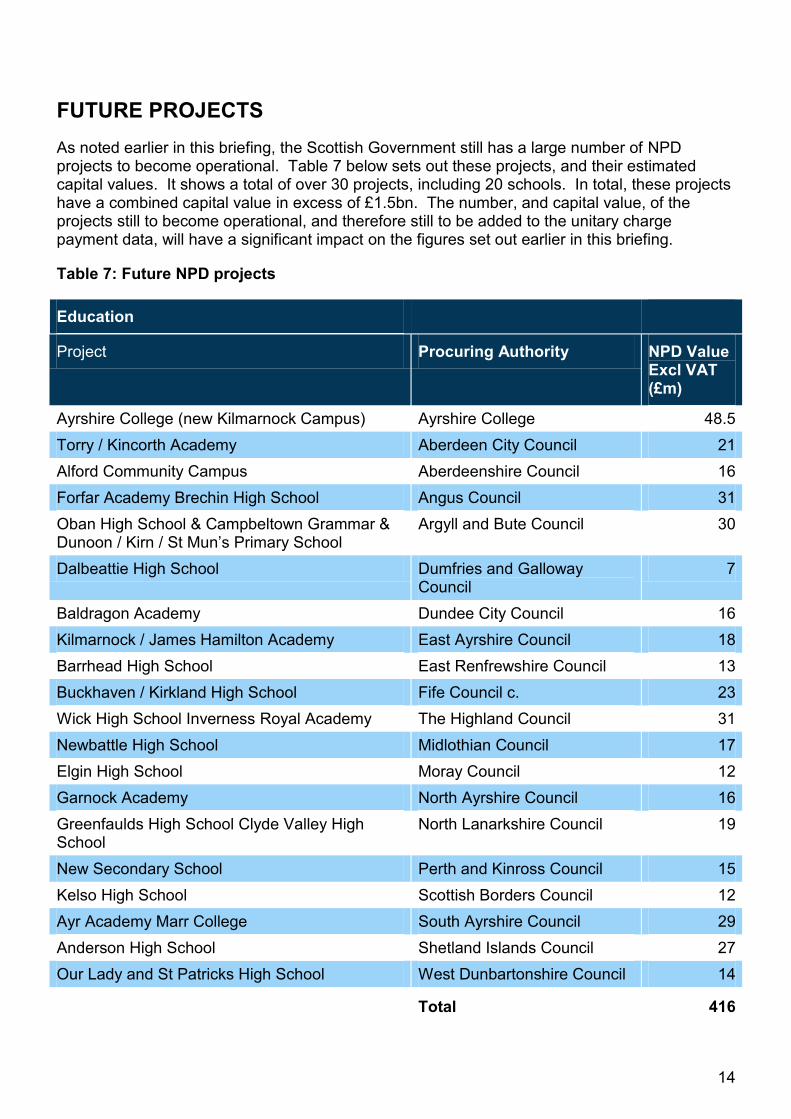
As noted earlier in this briefing, the Scottish Government still has a large number of NPD projects to become operational. Table 7 below sets out these projects, and their estimated capital values. It shows a total of over 30 projects, including 20 schools. In total, these projects have a combined capital value in excess of £1.5bn. The number, and capital value, of the projects still to become operational, and therefore still to be added to the unitary charge payment data, will have a significant impact on the figures set out earlier in this briefing.
Table 7: Future NPD projects
Education
Project Procuring Authority NPD Value Excl VAT (£m)
Ayrshire College (new Kilmarnock Campus) Ayrshire College 48.5
Torry / Kincorth Academy Aberdeen City Council 21
Alford Community Campus Aberdeenshire Council 16
Forfar Academy Brechin High School Angus Council 31
Oban High School & Campbeltown Grammar & Dunoon / Kirn / St Mun‘s Primary School
Argyll and Bute Council 30
Dalbeattie High School Dumfries and Galloway Council
7
Baldragon Academy Dundee City Council 16
Kilmarnock / James Hamilton Academy East Ayrshire Council 18
Barrhead High School East Renfrewshire Council 13
Buckhaven / Kirkland High School Fife Council c. 23
Wick High School Inverness Royal Academy The Highland Council 31
Newbattle High School Midlothian Council 17
Elgin High School Moray Council 12
Garnock Academy North Ayrshire Council 16
Greenfaulds High School Clyde Valley High School
North Lanarkshire Council 19
New Secondary School Perth and Kinross Council 15
Kelso High School Scottish Borders Council 12
Ayr Academy Marr College South Ayrshire Council 29
Anderson High School Shetland Islands Council 27
Our Lady and St Patricks High School West Dunbartonshire Council 14
Total 416

15
Health
Project Procuring Authority NPD Value Excl VAT
(£m)
Royal Hospital for Sick Children /Dept. of Clinical Neurosciences
NHS Lothian 155
NHS Ayrshire & Arran Acute Mental Health & North Ayrshire Community Hospital
NHS Ayrshire 48
Scottish National Blood Transfusion Service National Centre Project
NHS National Services Scotland
36
NHS Dumfries & Galloway Royal Acute Services Redevelopment Project
NHS Dumfries & Galloway 203
Balfour Hospital, Orkney NHS Orkney 60
Redesign of Mental Health Facilities Argyll & Bute/ Inverurie Health Centre
North hub 19
Royal Edinburgh Hospital South East 33
NHS Lothian Partnership Centre Bundle South East 26
Pharmaceutical Specials Service East Central 19
Stirling Care Village East Central 20
Maryhill & Eastwood Health Centre Bundle West 22
Gorbals, Woodside Health Centres and Inverclyde Adult and Older Peoples Continuing Care Bundle
West 32
Total 673
Transport
Project Procuring Authority NPD Value Excl VAT
(£m)
Aberdeen Western Peripheral Route (AWPR)/ Balmedie to Tipperty bundle
Transport Scotland/ Aberdeen City Council
472
Total 472

16
ANNEX – DEFINITIONS OF PFI AND NPD
PFI and NPD are both forms of public private partnership (PPP) capital funding.
In a 2011 report, the House of Commons Treasury Committee (Treasury Committee 2011) described the history and basic structure of PFI projects:
―In November 1992 the then Chancellor of the Exchequer Norman Lamont made an announcement in the Autumn Statement about ―ways to increase the scope for private financing of capital projects.‖ This was the beginning of what was to become known as the Private Finance Initiative (PFI), under which groups of private investors manage the design, build, finance and operation (DBFO) of public infrastructure. PFI was expanded under the Labour government, which came to power in 1997. The current coalition government, formed in May 2010, has confirmed that it remains committed to the Private Finance Initiative as a way of delivering investment in infrastructure.
In a typical PFI project, the private sector party is constituted as a Special Purpose Vehicle (SPV), which manages and finances the design, build and operation of a new facility. The financing of the initial capital investment (i.e. the capital required to pay transaction costs, buy land and build the infrastructure) is provided by a combination of share capital and loan stock from the owners of the SPV, together with senior debt from banks or bond-holders. The return on both equity and debt capital is sourced from the periodic ―unitary charge‖, which is paid by the public authority from the point at which the contracted facility is available for use. The unitary charge may be reduced (to a limited degree) in certain circumstances: e.g. if there is a delay in construction, if the contracted facility is not fully operational, or if services fail to meet contracted standards. Thus, the PFI structure is designed to transfer project risks from the public to the private sector.‖
In the 2011 Infrastructure Investment Plan (Scottish Government 2011), the Scottish Government described the NPD model:
―In the NPD model, there is a partnership with a private sector provider, who finances, constructs and maintains an asset. The public sector then pays an annual charge over a 25-30 year period to the private sector provider from the revenue budget once the asset has been built. The Scottish Government supports the use of NPD to deliver revenue funded investment. The NPD model seeks to transfer risk and exert private sector discipline during the construction phase of a project and throughout its lifetime, but without the excessive profits associated with past Private Finance Initiative projects (PFI). Key features of the NPD model are that:
returns to the private sector are capped;
there is no dividend-bearing equity; and
instead surpluses from NPD projects can be directed in favour of the public sector.
The NPD model is employed in circumstances where:
there is a long term stable demand for a public sector asset; and
there is not expected to be substantial technology change associated with the delivery of the service.‖

17
SOURCES
HM Treasury. (2013) Private Finance Initiative Projects: current projects as at 31 March 2013. Available at: https://www.gov.uk/government/publications/private-finance-initiative-projects-2013-summary-data [Accessed 23 April 2014]
House of Commons Treasury Committee. (2011) Private Finance Initiative. Available at: http://www.publications.parliament.uk/pa/cm201012/cmselect/cmtreasy/1146/1146.pdf [Accessed 23 April 2014]
Hudson, N. (2013) Monitoring long-term investment commitments: the 5% cap. SPICe Briefing 13/64. Available at: http://www.scottish.parliament.uk/ResearchBriefingsAndFactsheets/SB_13-64.pdf [Accessed 23 April 2014]
Scottish Futures Trust. (2014) Revenue Funded Infrastructure Investment in Scotland. Available at: http://www.scottishfuturestrust.org.uk/files/publications/Pipeline_of_Revenue_Funded_Projects_NPD_and_hub_November_2013.pdf [Accessed 23 April 2014]
Scottish Government. (2011) Infrastructure Investment Plan 2011. Available at: http://www.scotland.gov.uk/Publications/2011/12/05141922/0 [Accessed 23 April 2014]
Scottish Government. (2013a) NPD signed projects - unitary payment charges - March 2013. Available at: http://www.scotland.gov.uk/Topics/Government/Finance/18232/12308/NPDpaymentfigures [Accessed 23 April 2014]
Scottish Government (2013b) 2.5bn Pipeline of Revenue Funded Signed Projects (NPD and hub) – 14 March 2014. Available at: http://www.scotland.gov.uk/Topics/Government/Finance/18232/12308/RevenueFundedPipelineNPDhub [Accessed 23 April 2014]

18
THIS PAGE IS INTENTIONALLY BLANK

19
Scottish Parliament Information Centre (SPICe) Briefings are compiled for the benefit of the Members of the Parliament and their personal staff. Authors are available to discuss the contents of these papers with MSPs and their staff who should contact Allan Campbell on extension 85459 or email [email protected]. Members of the public or external organisations may comment on this briefing by emailing us at [email protected]. However, researchers are unable to enter into personal discussion in relation to SPICe Briefing Papers. If you have any general questions about the work of the Parliament you can email the Parliament‘s Public Information Service at [email protected].
Every effort is made to ensure that the information contained in SPICe briefings is correct at the time of publication. Readers should be aware however that briefings are not necessarily updated or otherwise amended to reflect subsequent changes.
www.scottish.parliament.uk