sbp working paper series - state bank of pakistan
TRANSCRIPT

STATE BANK OF PAKISTAN
November, 2017 No. 94
Muhammad Farooq Arby
Amjad Ali
Threshold inflation in Pakistan
SBP Working Paper Series

2
SBP Working Paper Series
Editor: Sajawal Khan
The objective of the SBP Working Paper Series is to stimulate and generate discussions on
different aspects of macroeconomic issues among the staff members of the State Bank of
Pakistan. Papers published in this series are subject to intense internal review process. The views
expressed in these papers are those of the author(s) not State Bank of Pakistan.
© State Bank of Pakistan.
Price per Working Paper (print form)
Pakistan: Rs 50 (inclusive of postage)
Foreign: US$ 20 (inclusive of postage)
Purchase orders, accompanied with cheques/drafts drawn in favor of State Bank of Pakistan,
should be sent to:
Chief Spokesperson,
External Relations Department,
State Bank of Pakistan,
I.I. Chundrigar Road, P.O. Box No. 4456,
Karachi 74000. Pakistan.
Soft copy is downloadable for free from SBP website: http://www.sbp.org.pk
For all other correspondence:
Postal: Editor,
SBP Working Paper Series,
Research Department,
State Bank of Pakistan,
I.I. Chundrigar Road, P.O. Box No. 4456,
Karachi 74000. Pakistan.
Email: [email protected]
ISSN 1997-3802 (Print)
ISSN 1997-3810 (Online)
Published by State Bank of Pakistan, Karachi, Pakistan.
Printed at the SBP BSC (Bank) – Printing Press, Karachi, Pakistan.
3
THRESHOLD INFLATION IN PAKISTAN
Muhammad Farooq Arby
Amjad Ali
Abstract
Inflation is usually considered to have a non-linear relationship with economic growth: a positive
relationship when it is low and stable, and negative when it is high and volatile. It is therefore an
important research question: what is that threshold level of inflation beyond which it affects growth
negatively?
This paper addresses this question in case of Pakistan. We have used two models: one a quadratic model
and the other a regression kink model, with unknown threshold. We find the threshold inflation at 6.05
percent and 5.67 percent respectively (on the basis of annual data from 1976 to 2017).
JEL Classification Codes: E31, E22, O40, O47.
Key Words: Inflation, threshold effects, Economic growth.
Acknowledgments
We are thankful to Riaz Riazuddin and two anonymous reviewers for their valuable comments and
suggestions on the earlier draft.
Director, Research Department, State Bank of Pakistan, Karachi ([email protected]) # Deputy Director, Economic Policy Review Department, State Bank of Pakistan, Karachi ([email protected])

4
1. Introduction
Nature of a relationship between economic growth and inflation has been widely examined in the
economic literature. It is generally believed that a low and stable inflation rate helps economic activities,
while high inflation hurts growth. A high inflationary environment affects decision making of almost all
players of the economy, like investors, savers, consumers and producers through uncertainty about the
expected payoffs from their decisions.1 Moreover, a persistently high inflation also causes erosion of the
value of the local currency in terms of foreign currencies. Such uncertainties, in turn have adverse
implications for economic activities.
On the other hand, low and stable inflation helps economic agents to predict outcome of their economic
decisions with fair level of certainty. Especially, existing producers follow their plans for business
expansion with more confidence; and new investment is also undertaken in the expectation of certain
returns. This is precisely the reason that policy makers, particularly central banks, strive for low inflation.
However, the empirical question is what is the limit for a desirable inflation, beyond which it affects
growth adversely? A number of studies have addressed this question and estimated a threshold inflation
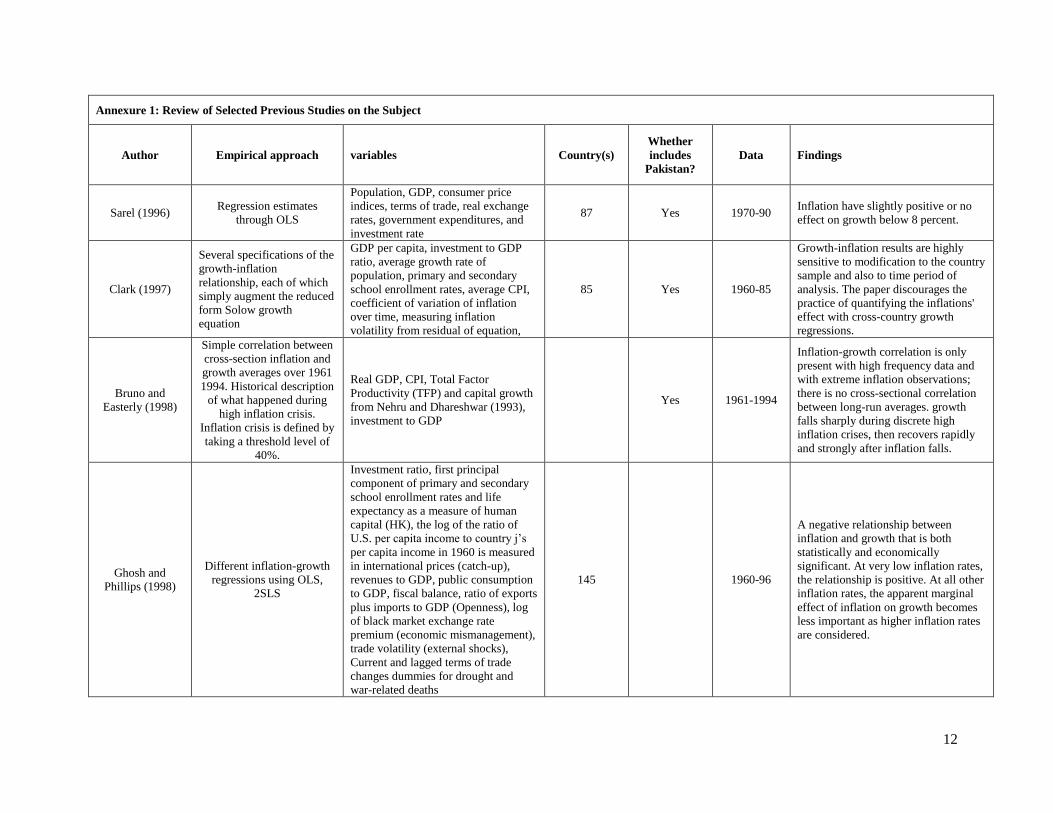
rate for different countries. A description of some selected studies is given in a matrix given in the
Annexure 1. In case of Pakistan, this question has recently become more important as its central bank is
about to adopt a flexible inflation targeting. This paper explores the nature of inflation and growth nexus
in Pakistan, and attempts to estimate threshold inflation. In fact, a visual look at the growth and inflation
trend shows that there do have been some episodes when very high inflation had adversely affected
growth (Figure 1).
However, we also find a number of years of co-existence of high inflation and high growth as well as low
inflation and low growth (Table 1). Therefore, finding threshold inflation for Pakistan appears not a
straightforward task. The earlier studies like Mubarak (2005), Hussain (2005) and Iqbal and Nawaz
(2009) have a number of methodological issues. For example, the growth line estimated in Mubarik
(2005) does not have a positively sloped line segment before a kink and a negatively sloped one after it.
Instead, the growth line estimated in this study has negative slope everywhere – with a slight difference
around 9 percent inflation. As the parameters estimated in this study are negative both in case of below 9
1 High inflation is usually associated with higher price volatility and it also brings about general economic uncertainty.
-5
0
5
10
15
20
25
30
35
19
51
19
53
19
55
19
57
19
59
19
61
19
63
19
65
19
67
19
69
19
71
19
73
19
75
19
77
19
79
19
81
19
83
19
85
19
87
19
89
19
91
19
93
19
95
19
97
19
99
20
01
20
03
20
05
20
07
20
09
20
11
20
13
20
15
20
17
Real GDP growth
CPI inflation
Figure 1: Inflation and Real GDP Growth
Per
cen
t
5
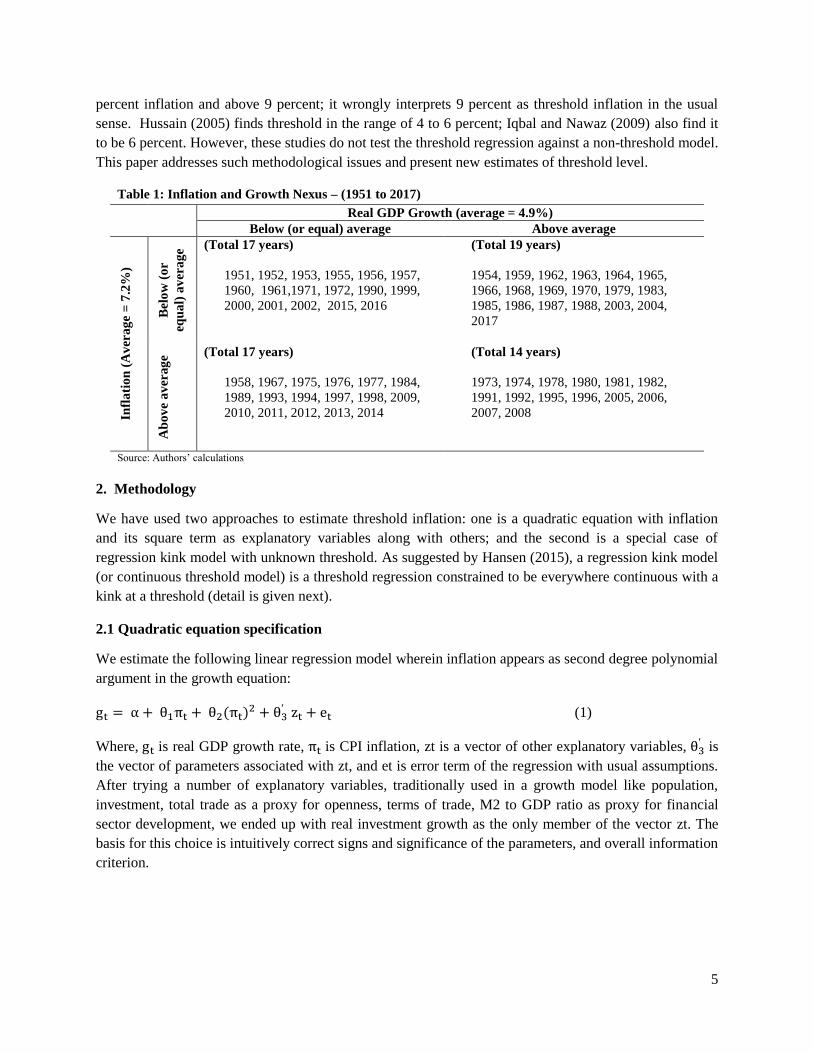
percent inflation and above 9 percent; it wrongly interprets 9 percent as threshold inflation in the usual
sense. Hussain (2005) finds threshold in the range of 4 to 6 percent; Iqbal and Nawaz (2009) also find it
to be 6 percent. However, these studies do not test the threshold regression against a non-threshold model.
This paper addresses such methodological issues and present new estimates of threshold level.
Table 1: Inflation and Growth Nexus – (1951 to 2017)
Real GDP Growth (average = 4.9%)
Below (or equal) average Above average
Infl
ati
on
(A
ver
ag
e =
7.2
%)
Bel
ow
(o
r
equ
al)
av
era
ge (Total 17 years)
1951, 1952, 1953, 1955, 1956, 1957,
1960, 1961,1971, 1972, 1990, 1999,
2000, 2001, 2002, 2015, 2016
(Total 19 years)
1954, 1959, 1962, 1963, 1964, 1965,
1966, 1968, 1969, 1970, 1979, 1983,
1985, 1986, 1987, 1988, 2003, 2004,
2017
Ab
ov
e a
ver
ag
e (Total 17 years)
1958, 1967, 1975, 1976, 1977, 1984,
1989, 1993, 1994, 1997, 1998, 2009,
2010, 2011, 2012, 2013, 2014
(Total 14 years)
1973, 1974, 1978, 1980, 1981, 1982,
1991, 1992, 1995, 1996, 2005, 2006,
2007, 2008
Source: Authors’ calculations
2. Methodology
We have used two approaches to estimate threshold inflation: one is a quadratic equation with inflation
and its square term as explanatory variables along with others; and the second is a special case of
regression kink model with unknown threshold. As suggested by Hansen (2015), a regression kink model
(or continuous threshold model) is a threshold regression constrained to be everywhere continuous with a
kink at a threshold (detail is given next).
2.1 Quadratic equation specification
We estimate the following linear regression model wherein inflation appears as second degree polynomial
argument in the growth equation:
(1)
Where, is real GDP growth rate, is CPI inflation, zt is a vector of other explanatory variables, is
the vector of parameters associated with zt, and et is error term of the regression with usual assumptions.
After trying a number of explanatory variables, traditionally used in a growth model like population,
investment, total trade as a proxy for openness, terms of trade, M2 to GDP ratio as proxy for financial
sector development, we ended up with real investment growth as the only member of the vector zt. The
basis for this choice is intuitively correct signs and significance of the parameters, and overall information
criterion.
6
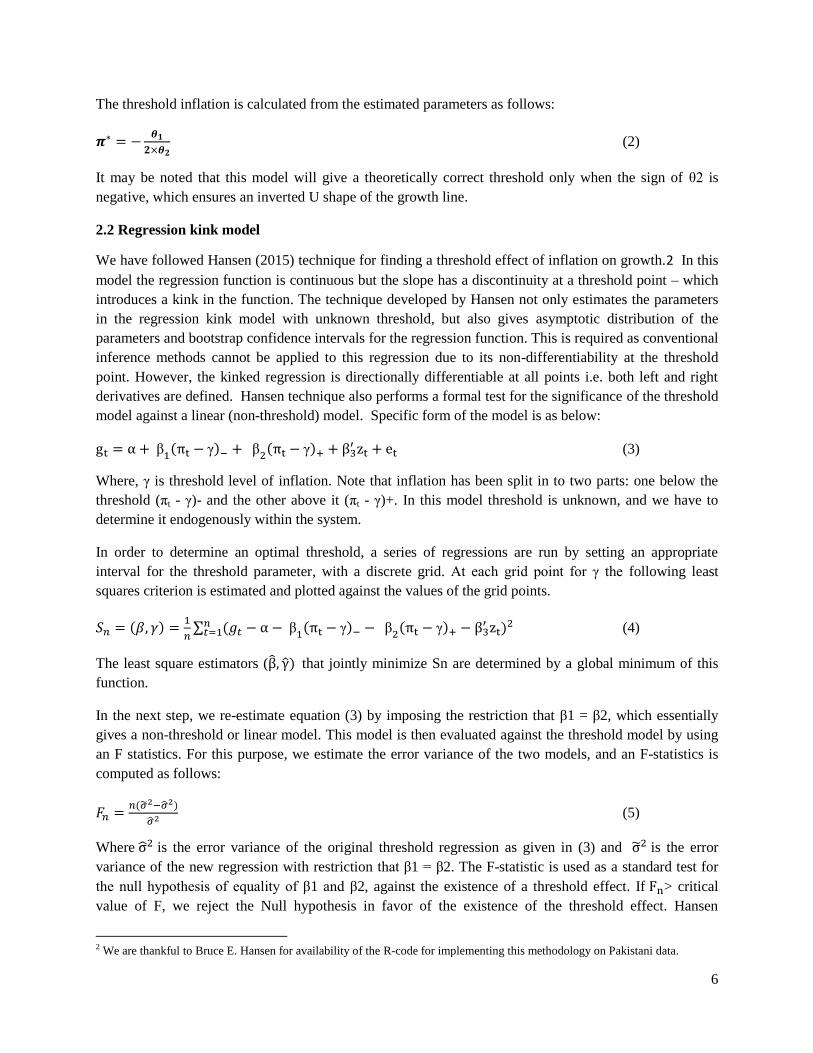
The threshold inflation is calculated from the estimated parameters as follows:
(2)
It may be noted that this model will give a theoretically correct threshold only when the sign of θ2 is
negative, which ensures an inverted U shape of the growth line.
2.2 Regression kink model
We have followed Hansen (2015) technique for finding a threshold effect of inflation on growth.2 In this
model the regression function is continuous but the slope has a discontinuity at a threshold point – which
introduces a kink in the function. The technique developed by Hansen not only estimates the parameters
in the regression kink model with unknown threshold, but also gives asymptotic distribution of the
parameters and bootstrap confidence intervals for the regression function. This is required as conventional
inference methods cannot be applied to this regression due to its non-differentiability at the threshold
point. However, the kinked regression is directionally differentiable at all points i.e. both left and right
derivatives are defined. Hansen technique also performs a formal test for the significance of the threshold
model against a linear (non-threshold) model. Specific form of the model is as below:
(3)
Where, is threshold level of inflation. Note that inflation has been split in to two parts: one below the
threshold (πt - )- and the other above it (πt - )+. In this model threshold is unknown, and we have to
determine it endogenously within the system.
In order to determine an optimal threshold, a series of regressions are run by setting an appropriate
interval for the threshold parameter, with a discrete grid. At each grid point for the following least
squares criterion is estimated and plotted against the values of the grid points.
(4)
The least square estimators ( that jointly minimize Sn are determined by a global minimum of this
function.
In the next step, we re-estimate equation (3) by imposing the restriction that 1 = 2, which essentially
gives a non-threshold or linear model. This model is then evaluated against the threshold model by using
an F statistics. For this purpose, we estimate the error variance of the two models, and an F-statistics is
computed as follows:
(5)
Where is the error variance of the original threshold regression as given in (3) and is the error
variance of the new regression with restriction that 1 = 2. The F-statistic is used as a standard test for
the null hypothesis of equality of 1 and 2, against the existence of a threshold effect. If > critical
value of F, we reject the Null hypothesis in favor of the existence of the threshold effect. Hansen
2 We are thankful to Bruce E. Hansen for availability of the R-code for implementing this methodology on Pakistani data.
7
computes the distribution of this test through bootstrap simulations, codes of which are the part of the
program in R, used by this study.
2.3 Data description
In order to estimate these models, we have used growth rates of annual series of real GDP, CPI, and real
investment for the period from 1976 to 2017. The selection of variables is according to the existing
empirical literature and the source of data is Pakistan Bureau of Statistics. While the data for all the three
variables is available for the years as back as 1960, we have excluded years prior to 1976 in estimations
because we could not adequately model the relationship between inflation and growth for the full sample.
In fact, the period 1960 to 1975 consists of years when the Pakistan’s economy witnessed successive
shocks and structural changes of varying nature, like green revolution of early 1960s, war 1965, political
turbulence of late 1960s (after war), breakup of East Pakistan in 1972, severe floods of early 1970s,
nationalization of a wide range of businesses, global oil price shock of 70s, exchange rate depreciation,
etc. On the basis of this, we feel that a well behaved relationship between growth and inflation had hardly
maintained during this period. Therefore, including this period in the sample distorts the model; and there
is a risk of drawing misleading conclusions. Therefore, it is considered more appropriate to focus on the
later period i.e. 1976 to 2017.
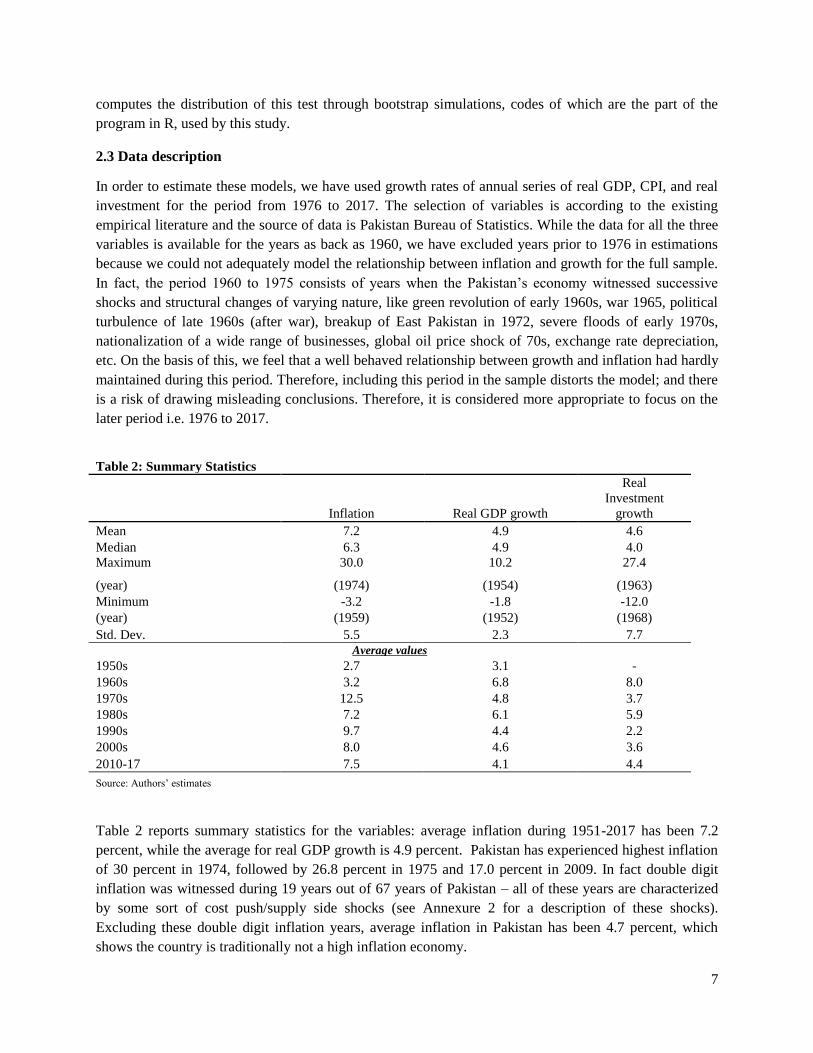
Table 2 reports summary statistics for the variables: average inflation during 1951-2017 has been 7.2
percent, while the average for real GDP growth is 4.9 percent. Pakistan has experienced highest inflation
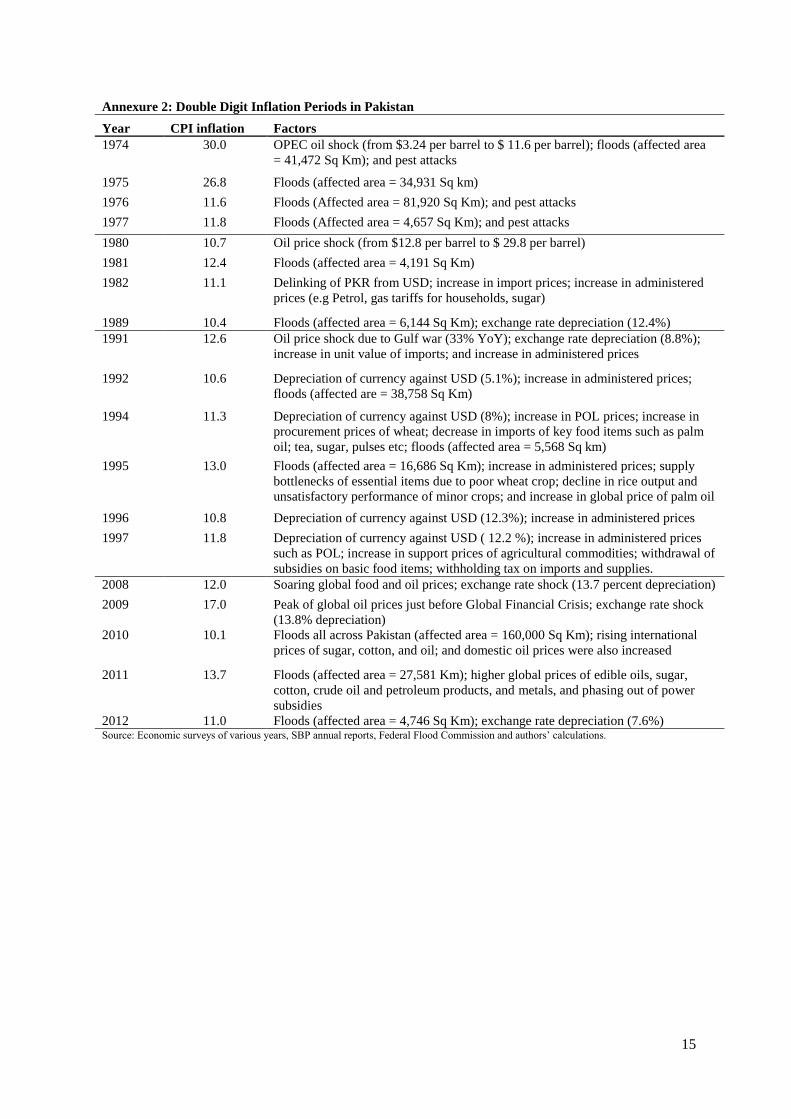
of 30 percent in 1974, followed by 26.8 percent in 1975 and 17.0 percent in 2009. In fact double digit
inflation was witnessed during 19 years out of 67 years of Pakistan – all of these years are characterized
by some sort of cost push/supply side shocks (see Annexure 2 for a description of these shocks).
Excluding these double digit inflation years, average inflation in Pakistan has been 4.7 percent, which
shows the country is traditionally not a high inflation economy.
Table 2: Summary Statistics
Inflation Real GDP growth
Real
Investment
growth
Mean 7.2 4.9 4.6
Median 6.3 4.9 4.0
Maximum 30.0 10.2 27.4
(year) (1974) (1954) (1963)
Minimum -3.2 -1.8 -12.0
(year) (1959) (1952) (1968)
Std. Dev. 5.5 2.3 7.7
Average values
1950s 2.7 3.1 -
1960s 3.2 6.8 8.0
1970s 12.5 4.8 3.7
1980s 7.2 6.1 5.9
1990s 9.7 4.4 2.2
2000s 8.0 4.6 3.6
2010-17 7.5 4.1 4.4
Source: Authors’ estimates
8
Coming towards growth, there was only one year when real GDP growth was negative, i.e., 1952.
However, in recent past the country experienced a growth rate as low as 0.4 percent in 2009 (in the
aftermath of global financial crisis). The decade of 1960s features a high growth period, followed by
1980s. The supported economic policies mainly get the credit for these high growth rates.
3. Results
Before using the variables in the estimation, we have checked them for the problem of non-stationarity by
using Augmented Dickey-Fuller and Phillips-Perron tests. The results are reported in Annexure 3, which
show that all the variables are stationary in growth forms, which can be used in ordinary least square
estimations. The estimated equations of the two approaches are given and discussed below.
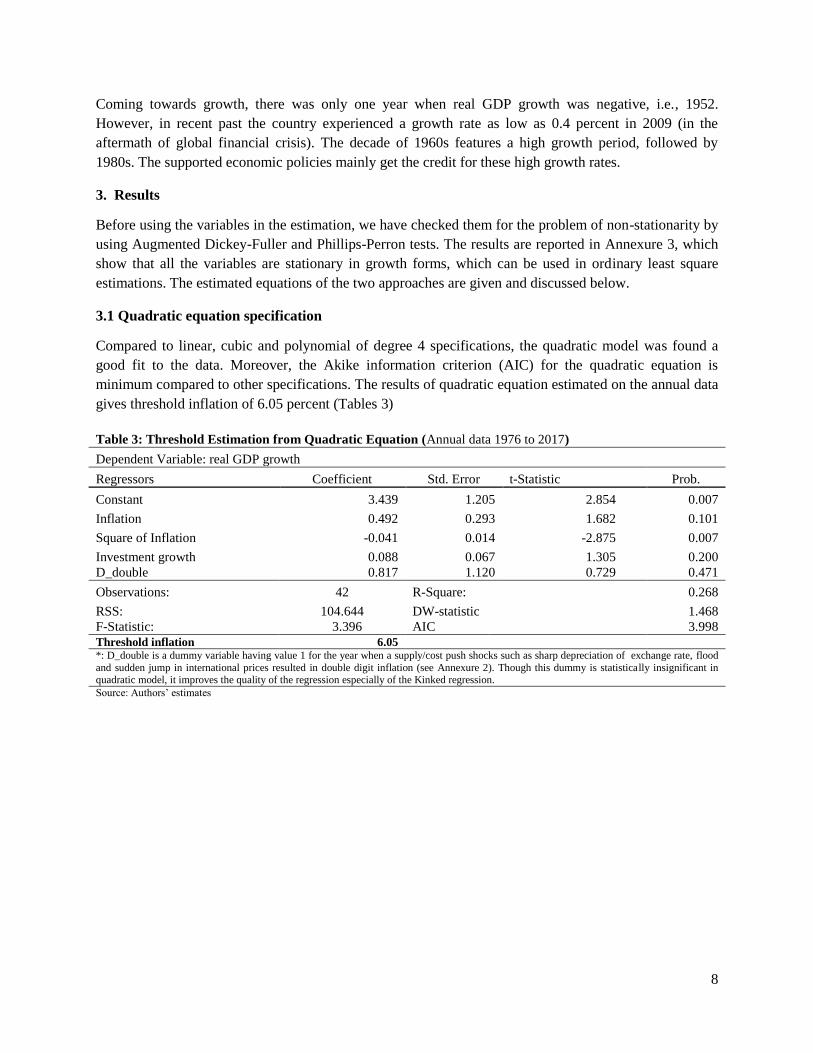
3.1 Quadratic equation specification
Compared to linear, cubic and polynomial of degree 4 specifications, the quadratic model was found a
good fit to the data. Moreover, the Akike information criterion (AIC) for the quadratic equation is
minimum compared to other specifications. The results of quadratic equation estimated on the annual data
gives threshold inflation of 6.05 percent (Tables 3)
Table 3: Threshold Estimation from Quadratic Equation (Annual data 1976 to 2017)
Dependent Variable: real GDP growth
Regressors Coefficient Std. Error t-Statistic Prob.
Constant 3.439 1.205 2.854 0.007
Inflation 0.492 0.293 1.682 0.101
Square of Inflation -0.041 0.014 -2.875 0.007
Investment growth 0.088 0.067 1.305 0.200
D_double 0.817 1.120 0.729 0.471
Observations: 42 R-Square: 0.268
RSS: 104.644 DW-statistic 1.468
F-Statistic: 3.396 AIC 3.998
Threshold inflation 6.05 *: D_double is a dummy variable having value 1 for the year when a supply/cost push shocks such as sharp depreciation of exchange rate, flood
and sudden jump in international prices resulted in double digit inflation (see Annexure 2). Though this dummy is statistically insignificant in quadratic model, it improves the quality of the regression especially of the Kinked regression. Source: Authors’ estimates

9
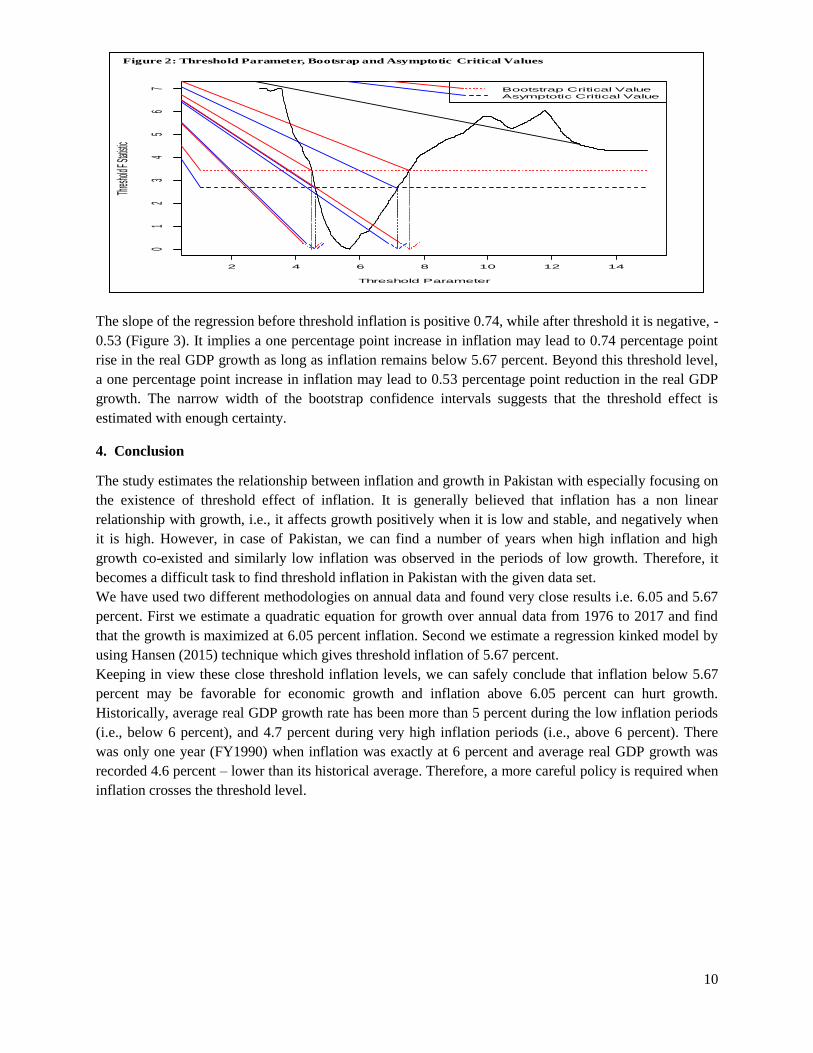
3.2 Regression kink model
We also employed a kinked regression model to estimate the threshold inflation and also test this model
against a linear model using a WALD F-test. Furthermore, the kinked model searches for an unknown
threshold within a defined range and selects the threshold level which is smallest globally against a pre-
defined criterion (such as the least square criterion of minimizing the sum of square residuals). Local
minima are not relevant in our case. In estimating equation (3), we have set a closed interval [1, 15] for
the threshold parameter, with discrete grid increments of 0.01. Keeping in view the history of inflation in
Pakistan we expect the threshold to lie in this range. At each grid point for the least squares criterion
was computed and plotted in Figure 2. This function has a global minimum at = 5.67, which is the
estimated threshold level of inflation. The estimated parameters of the regression kink model are reported
in Table 4.
Table 4: Threshold Model Results – Regression Kink model (Annual data; 1976 to 2017)
Standard Errors
Bootstrap 90% confidence intervals
Estimates Lower Upper
1 0.74 0.545 -0.13 1.61
2 -0.53 0.164 -0.83 -0.23
Investment growth 0.14 0.047 0.07 0.22
D_double 2.00 1.008 0.13 3.88
Constant 5.60 0.615 4.71 6.49
Threshold level 5.67 1.023 4.44 7.69
Number of observations
42
Error Variance of kinked regression
2.083
Error Variance of linear regression (with no threshold)
2.497
Wald-F test Value for existence of threshold effect
8.15
Critical Value of F-statistics at 90%
6.12 Source: Authors’ estimates
4 6 8 10 12 14 16
24
68
Inflation
GDP G
rowth R
ate
Figure 3: Estimated Kinked Growth Line and Confidence Intervals
10
The slope of the regression before threshold inflation is positive 0.74, while after threshold it is negative, -
0.53 (Figure 3). It implies a one percentage point increase in inflation may lead to 0.74 percentage point
rise in the real GDP growth as long as inflation remains below 5.67 percent. Beyond this threshold level,
a one percentage point increase in inflation may lead to 0.53 percentage point reduction in the real GDP
growth. The narrow width of the bootstrap confidence intervals suggests that the threshold effect is
estimated with enough certainty.
4. Conclusion
The study estimates the relationship between inflation and growth in Pakistan with especially focusing on
the existence of threshold effect of inflation. It is generally believed that inflation has a non linear
relationship with growth, i.e., it affects growth positively when it is low and stable, and negatively when
it is high. However, in case of Pakistan, we can find a number of years when high inflation and high
growth co-existed and similarly low inflation was observed in the periods of low growth. Therefore, it
becomes a difficult task to find threshold inflation in Pakistan with the given data set.
We have used two different methodologies on annual data and found very close results i.e. 6.05 and 5.67
percent. First we estimate a quadratic equation for growth over annual data from 1976 to 2017 and find
that the growth is maximized at 6.05 percent inflation. Second we estimate a regression kinked model by
using Hansen (2015) technique which gives threshold inflation of 5.67 percent.
Keeping in view these close threshold inflation levels, we can safely conclude that inflation below 5.67
percent may be favorable for economic growth and inflation above 6.05 percent can hurt growth.
Historically, average real GDP growth rate has been more than 5 percent during the low inflation periods
(i.e., below 6 percent), and 4.7 percent during very high inflation periods (i.e., above 6 percent). There
was only one year (FY1990) when inflation was exactly at 6 percent and average real GDP growth was
recorded 4.6 percent – lower than its historical average. Therefore, a more careful policy is required when
inflation crosses the threshold level.
2 4 6 8 10 12 14
01
23
45
67
Threshold Parameter
Thres
hold F
Statis
tic
Bootstrap Critical Value
Asymptotic Critical Value
Figure 2: Threshold Parameter, Bootsrap and Asymptotic Critical Values
11
References
Barro, R. J. (2013); Inflation and Economic Growth; Annals of Economics and Finance, 14-1, 85-109.
Bittencourt, Manoel (2012); Inflation and economic growth in Latin America: Some panel time-series
evidence; Economic Modelling, Volume 29, Issue 2, March 2012, Pages 333-340,
http://dx.doi.org/10.1016/j.econmod.2011.10.018.
Bruno, M and W. Easterly, (1996); Inflation Crises and long-run growth; Journal of Monetary
Economics, 41, 3-26.
Bollen, K., A. (1990); Political Democracy: Conceptual and Measurement Traps; Studies in Comparative
International Development Spring, 7-24.
Burdekin, R.C.K., Denzau. A.T., Keil, M.W., Sitthiyot, T., and Willett, T., D. (2004); When does
inflation hurt economic growth? Different nonlinearities for different economies; Journal of
Macroeconomics, Volume 26, Issue 3, September 2004, Pages 519-532,
http://dx.doi.org/10.1016/j.jmacro.2003.03.005.
Clark, T. E. (1997); Cross-country evidence on long-run growth and inflation; Economic Inquiry, 35, 70-
81.
Eggoh, J.C. and Khan, M. (2014); On the nonlinear relationship between inflation and economic growth;
Research in Economics, Volume 68, Issue 2, June 2014, Pages 133-143.
Gastil, Raymond D. (1982); Freedom in the World; Westport CT, Greenwood Press.
Ghosh, A. R. and Phillips, S. (1998); Warning: Inflation may be harmful to your growth; IMF Staff
Papers, 45, 672-710.
Hansen, B. E. (2015); Regression kink with an unknown threshold; Journal of Business & Economic
Statistics.
Hussain, M. (2005); Inflation and Growth: Estimation of Threshold point for Pakistan; Pakistan Business
Review October 2005.
Iqbal, N., & Nawaz, S. (2009); Investment, inflation and economic growth nexus; The Pakistan
Development Review, 863-874. Khan, M.S. and Senhadji, A.S (2001); Threshold Effects in the Relationship between Inflation and
Growth; IMF Staff Papers 48, 1, International Monetary Fund.
Knack, S and Keefer, P, (1995); Institutions and Economic Performance: Cross-Country Tests Using
Alternative Institutional Measures; Economics and Politics, 7, issue 3, p. 207-227.
Mubarik, Y. A. (2005); Inflation and Growth: An Estimate of the Threshold Level of Inflation in
Pakistan; SBP Research Bulletin Volume 1, Number 1, 2005.
Mundell, R. A.(1963); Inflation and Real Interest; Journal of Political Economy, , pp.280-283.
Sarel, M. (1996); Non linear effects of inflation on economic growth; IMF Staff Paper, 43, 199-215.
Thanh, Su Dinh (2015); Threshold effects of inflation on growth in the ASEAN-5 countries: A Panel
Smooth Transition Regression approach; Journal of Economics, Finance and Administrative Science,
Volume 20, Issue 38, June 2015, Pages 41-48, http://dx.doi.org/10.1016/j.jefas.2015.01.003.
Tobin, J. (1965); Money and Economic Growth; Econometrica, 1965, Vol.33 (4), pp. 671-684.
Vinayagathasan, T (2013); Inflation and economic growth: A dynamic panel threshold analysis for Asian
economies, Journal of Asian Economics, Volume 26, June 2013, Pages 31-41,
http://dx.doi.org/10.1016/j.asieco.2013.04.001.
12
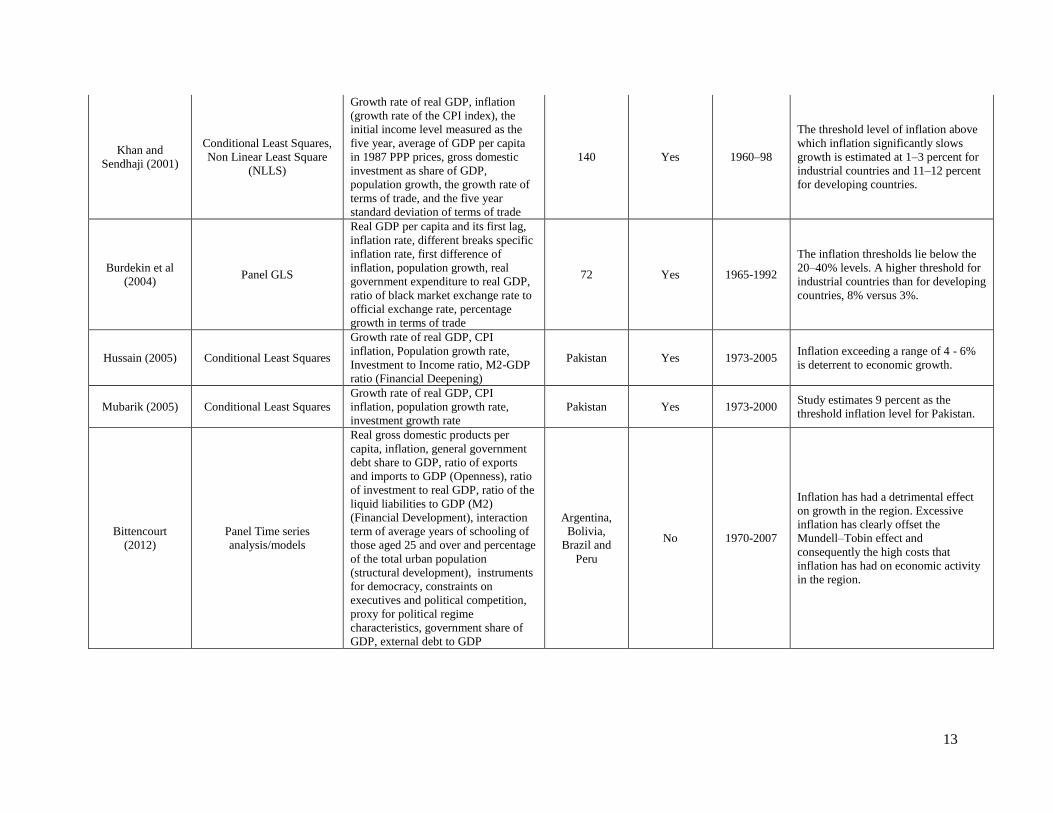
Annexure 1: Review of Selected Previous Studies on the Subject
Author Empirical approach variables Country(s)
Whether
includes
Pakistan?
Data Findings
Sarel (1996) Regression estimates
through OLS
Population, GDP, consumer price
indices, terms of trade, real exchange
rates, government expenditures, and
investment rate
87 Yes 1970-90 Inflation have slightly positive or no
effect on growth below 8 percent.
Clark (1997)
Several specifications of the
growth-inflation
relationship, each of which
simply augment the reduced
form Solow growth
equation
GDP per capita, investment to GDP
ratio, average growth rate of
population, primary and secondary
school enrollment rates, average CPI,
coefficient of variation of inflation
over time, measuring inflation
volatility from residual of equation,
85 Yes 1960-85
Growth-inflation results are highly
sensitive to modification to the country
sample and also to time period of
analysis. The paper discourages the
practice of quantifying the inflations'
effect with cross-country growth
regressions.
Bruno and
Easterly (1998)
Simple correlation between
cross-section inflation and
growth averages over 1961
1994. Historical description
of what happened during
high inflation crisis.
Inflation crisis is defined by
taking a threshold level of
40%.
Real GDP, CPI, Total Factor
Productivity (TFP) and capital growth
from Nehru and Dhareshwar (1993),
investment to GDP
Yes 1961-1994
Inflation-growth correlation is only
present with high frequency data and
with extreme inflation observations;
there is no cross-sectional correlation
between long-run averages. growth
falls sharply during discrete high
inflation crises, then recovers rapidly
and strongly after inflation falls.
Ghosh and
Phillips (1998)
Different inflation-growth
regressions using OLS,
2SLS
Investment ratio, first principal
component of primary and secondary
school enrollment rates and life
expectancy as a measure of human
capital (HK), the log of the ratio of
U.S. per capita income to country j’s
per capita income in 1960 is measured
in international prices (catch-up),
revenues to GDP, public consumption
to GDP, fiscal balance, ratio of exports
plus imports to GDP (Openness), log
of black market exchange rate
premium (economic mismanagement),
trade volatility (external shocks),
Current and lagged terms of trade
changes dummies for drought and
war-related deaths
145 1960-96
A negative relationship between
inflation and growth that is both
statistically and economically
significant. At very low inflation rates,
the relationship is positive. At all other
inflation rates, the apparent marginal
effect of inflation on growth becomes
less important as higher inflation rates
are considered.
13
Khan and
Sendhaji (2001)
Conditional Least Squares,
Non Linear Least Square
(NLLS)
Growth rate of real GDP, inflation
(growth rate of the CPI index), the
initial income level measured as the
five year, average of GDP per capita
in 1987 PPP prices, gross domestic
investment as share of GDP,
population growth, the growth rate of
terms of trade, and the five year
standard deviation of terms of trade
140 Yes 1960–98
The threshold level of inflation above
which inflation significantly slows
growth is estimated at 1–3 percent for
industrial countries and 11–12 percent
for developing countries.
Burdekin et al
(2004) Panel GLS
Real GDP per capita and its first lag,
inflation rate, different breaks specific
inflation rate, first difference of
inflation, population growth, real
government expenditure to real GDP,
ratio of black market exchange rate to
official exchange rate, percentage
growth in terms of trade
72 Yes 1965-1992
The inflation thresholds lie below the
20–40% levels. A higher threshold for
industrial countries than for developing
countries, 8% versus 3%.
Hussain (2005) Conditional Least Squares
Growth rate of real GDP, CPI
inflation, Population growth rate,
Investment to Income ratio, M2-GDP
ratio (Financial Deepening)
Pakistan Yes 1973-2005 Inflation exceeding a range of 4 - 6%
is deterrent to economic growth.
Mubarik (2005) Conditional Least Squares
Growth rate of real GDP, CPI
inflation, population growth rate,
investment growth rate
Pakistan Yes 1973-2000 Study estimates 9 percent as the
threshold inflation level for Pakistan.
Bittencourt
(2012)
Panel Time series
analysis/models
Real gross domestic products per
capita, inflation, general government
debt share to GDP, ratio of exports
and imports to GDP (Openness), ratio
of investment to real GDP, ratio of the
liquid liabilities to GDP (M2)
(Financial Development), interaction
term of average years of schooling of
those aged 25 and over and percentage
of the total urban population
(structural development), instruments
for democracy, constraints on
executives and political competition,
proxy for political regime
characteristics, government share of
GDP, external debt to GDP
Argentina,
Bolivia,
Brazil and
Peru
No 1970-2007
Inflation has had a detrimental effect
on growth in the region. Excessive
inflation has clearly offset the
Mundell–Tobin effect and
consequently the high costs that
inflation has had on economic activity
in the region.
14
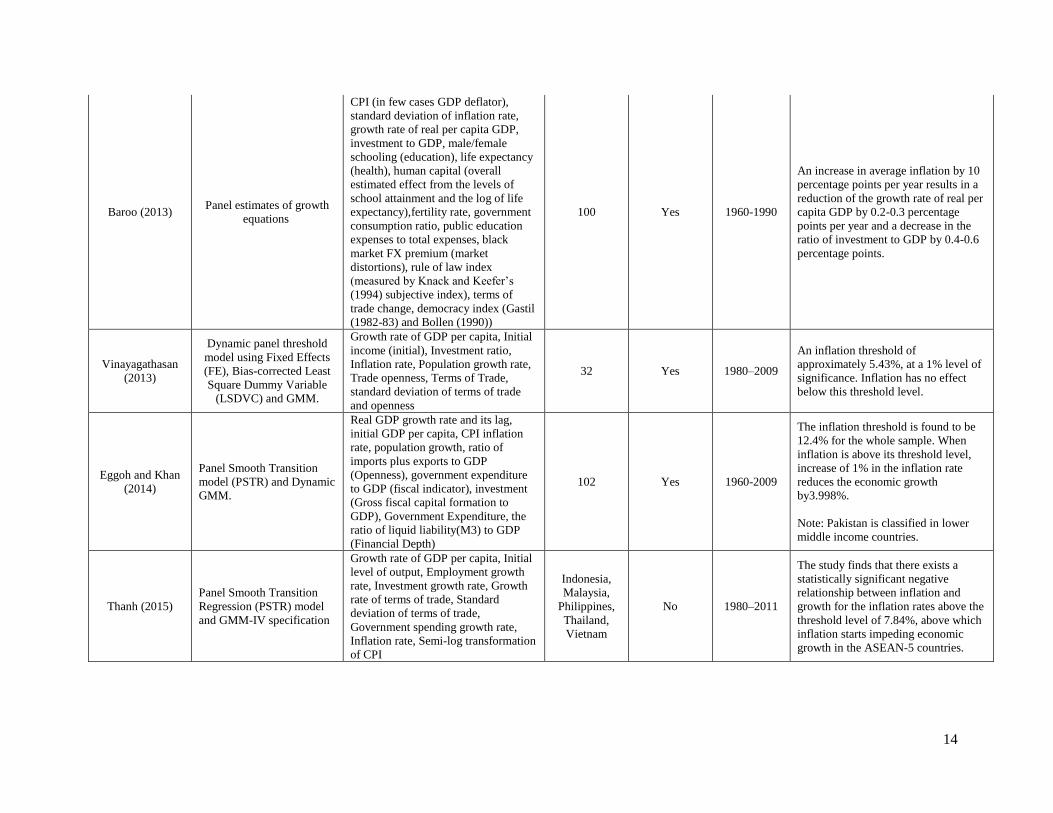
Baroo (2013) Panel estimates of growth
equations
CPI (in few cases GDP deflator),
standard deviation of inflation rate,
growth rate of real per capita GDP,
investment to GDP, male/female
schooling (education), life expectancy
(health), human capital (overall
estimated effect from the levels of
school attainment and the log of life
expectancy),fertility rate, government
consumption ratio, public education
expenses to total expenses, black
market FX premium (market
distortions), rule of law index
(measured by Knack and Keefer’s
(1994) subjective index), terms of
trade change, democracy index (Gastil
(1982-83) and Bollen (1990))
100 Yes 1960-1990
An increase in average inflation by 10
percentage points per year results in a
reduction of the growth rate of real per
capita GDP by 0.2-0.3 percentage
points per year and a decrease in the
ratio of investment to GDP by 0.4-0.6
percentage points.
Vinayagathasan
(2013)
Dynamic panel threshold
model using Fixed Effects
(FE), Bias-corrected Least
Square Dummy Variable
(LSDVC) and GMM.
Growth rate of GDP per capita, Initial
income (initial), Investment ratio,
Inflation rate, Population growth rate,
Trade openness, Terms of Trade,
standard deviation of terms of trade
and openness
32 Yes 1980–2009
An inflation threshold of
approximately 5.43%, at a 1% level of
significance. Inflation has no effect
below this threshold level.
Eggoh and Khan
(2014)
Panel Smooth Transition
model (PSTR) and Dynamic
GMM.
Real GDP growth rate and its lag,
initial GDP per capita, CPI inflation
rate, population growth, ratio of
imports plus exports to GDP
(Openness), government expenditure
to GDP (fiscal indicator), investment
(Gross fiscal capital formation to
GDP), Government Expenditure, the
ratio of liquid liability(M3) to GDP
(Financial Depth)
102 Yes 1960-2009
The inflation threshold is found to be
12.4% for the whole sample. When
inflation is above its threshold level,
increase of 1% in the inflation rate
reduces the economic growth
by3.998%.
Note: Pakistan is classified in lower
middle income countries.
Thanh (2015)
Panel Smooth Transition
Regression (PSTR) model
and GMM-IV specification
Growth rate of GDP per capita, Initial
level of output, Employment growth
rate, Investment growth rate, Growth
rate of terms of trade, Standard
deviation of terms of trade,
Government spending growth rate,
Inflation rate, Semi-log transformation
of CPI
Indonesia,
Malaysia,
Philippines,
Thailand,
Vietnam
No 1980–2011
The study finds that there exists a
statistically significant negative
relationship between inflation and
growth for the inflation rates above the
threshold level of 7.84%, above which
inflation starts impeding economic
growth in the ASEAN-5 countries.
15
Annexure 2: Double Digit Inflation Periods in Pakistan
Year CPI inflation Factors
1974 30.0 OPEC oil shock (from $3.24 per barrel to $ 11.6 per barrel); floods (affected area
= 41,472 Sq Km); and pest attacks
1975 26.8 Floods (affected area = 34,931 Sq km)
1976 11.6 Floods (Affected area = 81,920 Sq Km); and pest attacks
1977 11.8 Floods (Affected area = 4,657 Sq Km); and pest attacks
1980 10.7 Oil price shock (from $12.8 per barrel to $ 29.8 per barrel)
1981 12.4 Floods (affected area = 4,191 Sq Km)
1982 11.1 Delinking of PKR from USD; increase in import prices; increase in administered
prices (e.g Petrol, gas tariffs for households, sugar)
1989 10.4 Floods (affected area = 6,144 Sq Km); exchange rate depreciation (12.4%)
1991 12.6 Oil price shock due to Gulf war (33% YoY); exchange rate depreciation (8.8%);
increase in unit value of imports; and increase in administered prices
1992 10.6 Depreciation of currency against USD (5.1%); increase in administered prices;
floods (affected are = 38,758 Sq Km)
1994 11.3 Depreciation of currency against USD (8%); increase in POL prices; increase in
procurement prices of wheat; decrease in imports of key food items such as palm
oil; tea, sugar, pulses etc; floods (affected area = 5,568 Sq km)
1995 13.0 Floods (affected area = 16,686 Sq Km); increase in administered prices; supply
bottlenecks of essential items due to poor wheat crop; decline in rice output and
unsatisfactory performance of minor crops; and increase in global price of palm oil
1996 10.8 Depreciation of currency against USD (12.3%); increase in administered prices
1997 11.8 Depreciation of currency against USD ( 12.2 %); increase in administered prices
such as POL; increase in support prices of agricultural commodities; withdrawal of
subsidies on basic food items; withholding tax on imports and supplies.
2008 12.0 Soaring global food and oil prices; exchange rate shock (13.7 percent depreciation)
2009 17.0 Peak of global oil prices just before Global Financial Crisis; exchange rate shock
(13.8% depreciation)
2010 10.1 Floods all across Pakistan (affected area = 160,000 Sq Km); rising international
prices of sugar, cotton, and oil; and domestic oil prices were also increased
2011 13.7 Floods (affected area = 27,581 Km); higher global prices of edible oils, sugar,
cotton, crude oil and petroleum products, and metals, and phasing out of power
subsidies
2012 11.0 Floods (affected area = 4,746 Sq Km); exchange rate depreciation (7.6%) Source: Economic surveys of various years, SBP annual reports, Federal Flood Commission and authors’ calculations.

16
Annexure 3: A: Results of Unit Root tests – Annual data 1976 2017
(1) Level (With Constant)
Augmented Dickey-Fuller Test
Phillips-Perron test statistic
Null Hypothesis: Series has a Unit
root
Null Hypothesis: Series has a Unit
root
ADF t-statistics Probability
Adj. t-Stat Probability
CPI Inflation -4.042 0.004
-3.148 0.031
Real GDP Growth -5.240 0.001
-5.211 0.001
Real Investment Growth -3.242 0.026
-5.157 0.000
(2) 1st difference -3.367 0.001
-8.127 0.000
CPI Inflation -5.461 0.000
-12.544 0.000
Real GDP Growth -3.949 0.000
-9.061 0.000
Real Investment Growth
Notes: (a) Lag Length selection is based on AIC; and (b) Probability is based on MacKinnon (1996) one-sided p-values.