sbst 2015 - 3rd tool competition for java junit test tools
TRANSCRIPT

3rd Java Unit Testing Tool Competition
Tanja E.J. Vos Urko Rueda
Universidad Politecnica de Valencia http://sbstcontest.dsic.upv.es/
8th International Workshop on Search-Based Software Testing (SBST) at the 37th IEEE International Conference on Software Engineering ICSE 2015
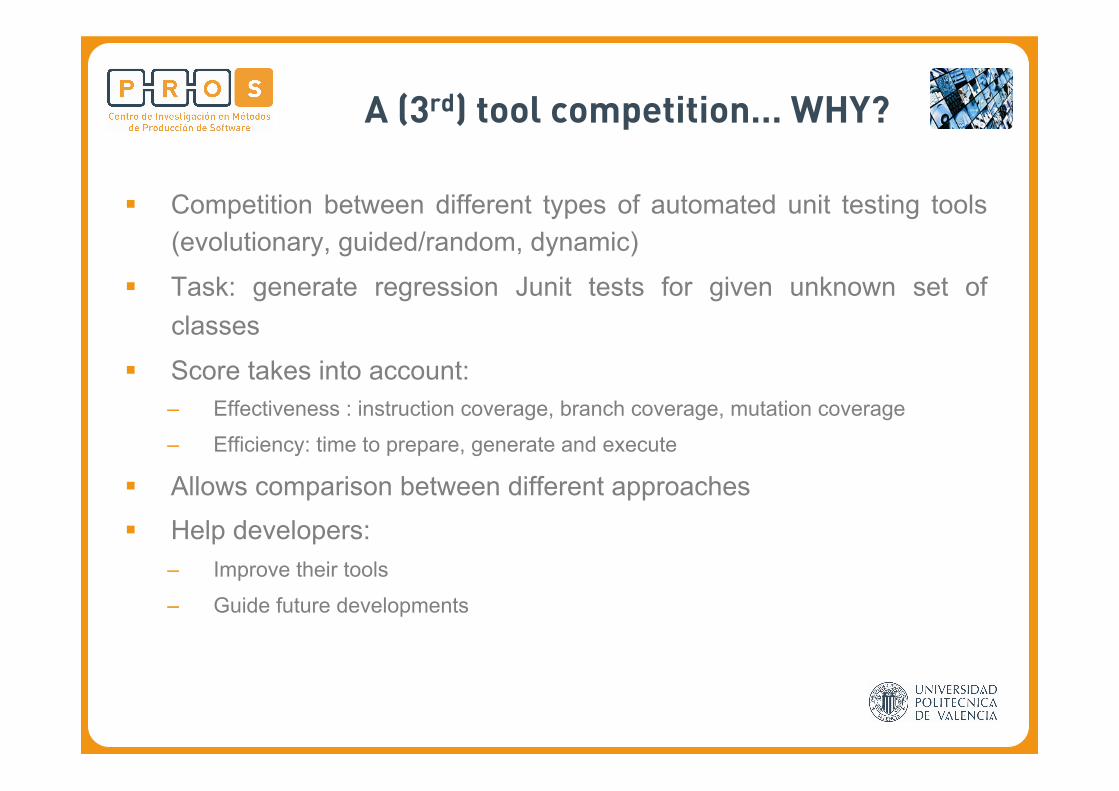
A (3rd) tool competition… WHY?
§ Competition between different types of automated unit testing tools (evolutionary, guided/random, dynamic)
§ Task: generate regression Junit tests for given unknown set of classes
§ Score takes into account: – Effectiveness : instruction coverage, branch coverage, mutation coverage
– Efficiency: time to prepare, generate and execute
§ Allows comparison between different approaches § Help developers:
– Improve their tools
– Guide future developments
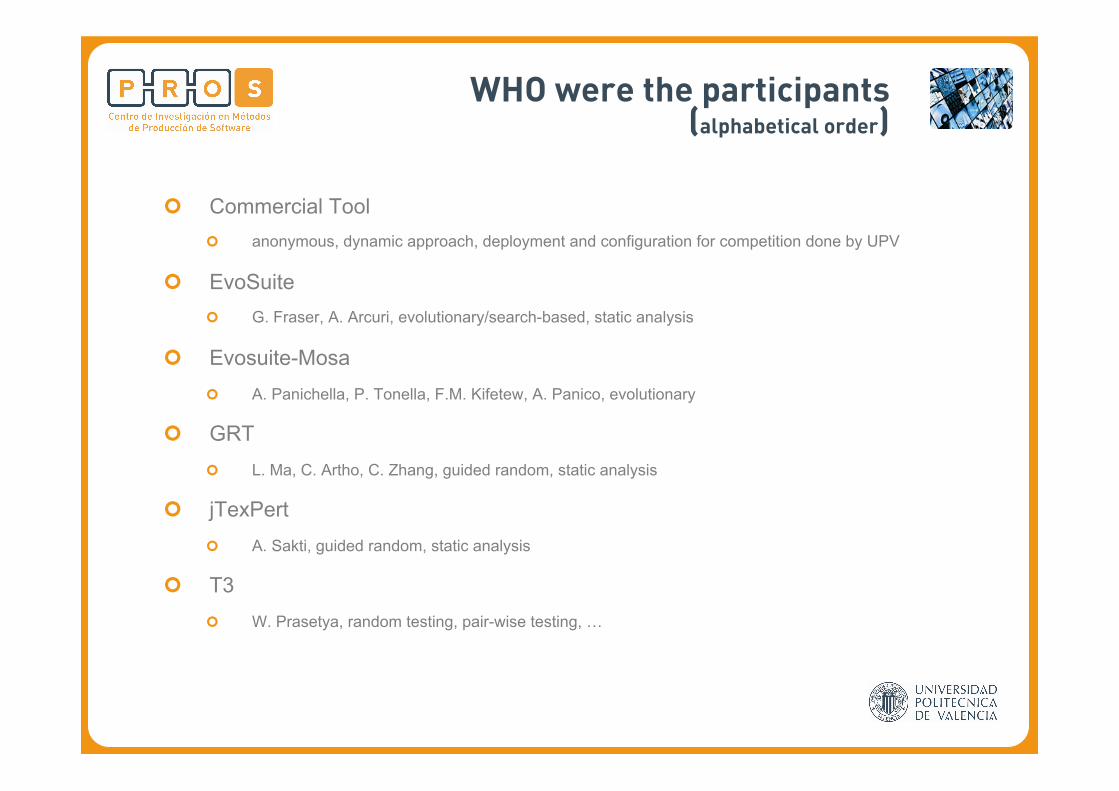
¢ Commercial Tool ¢ anonymous, dynamic approach, deployment and configuration for competition done by UPV
¢ EvoSuite ¢ G. Fraser, A. Arcuri, evolutionary/search-based, static analysis
¢ Evosuite-Mosa ¢ A. Panichella, P. Tonella, F.M. Kifetew, A. Panico, evolutionary
¢ GRT ¢ L. Ma, C. Artho, C. Zhang, guided random, static analysis
¢ jTexPert ¢ A. Sakti, guided random, static analysis
¢ T3 ¢ W. Prasetya, random testing, pair-wise testing, …
WHO were the participants (alphabetical order)
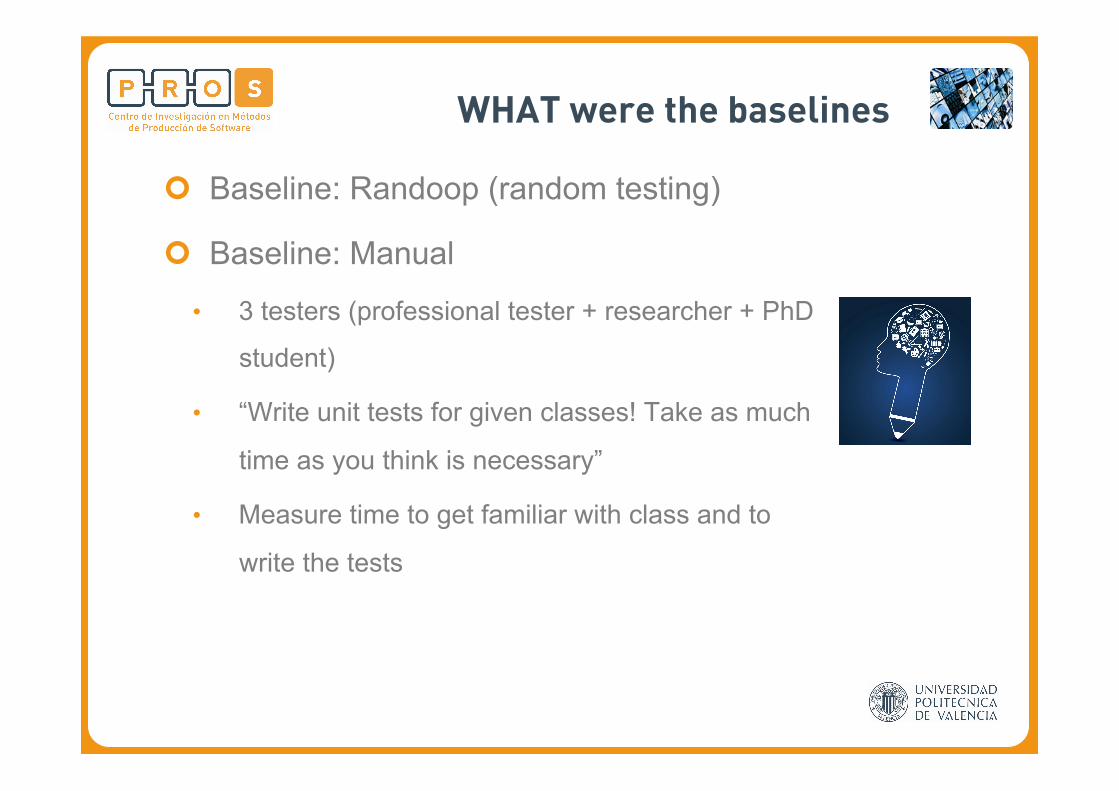
¢ Baseline: Randoop (random testing)
¢ Baseline: Manual
• 3 testers (professional tester + researcher + PhD
student)
• “Write unit tests for given classes! Take as much
time as you think is necessary”
• Measure time to get familiar with class and to
write the tests
WHAT were the baselines
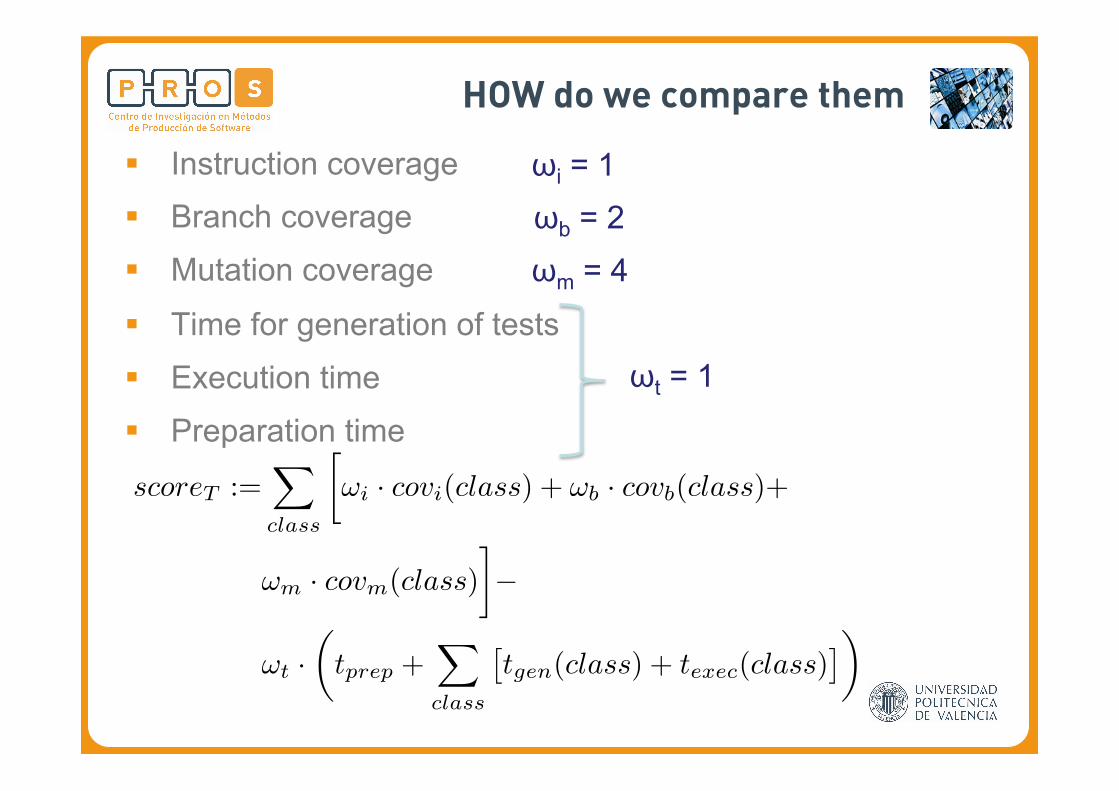
§ Instruction coverage § Branch coverage
§ Mutation coverage
§ Time for generation of tests
§ Execution time
§ Preparation time
Unit Testing Tool Competition – Round Two 9
we defined a benchmark function which assigns to each run of a test tool T ascore as the weighted sum over the measured variables:
score
T
:=X
class
!
i
· covi
(class) + !
b
· covb
(class)+
!
m
· covm
(class)
��
!
t
·✓t
prep
+X
class
⇥t
gen
(class) + t
exec
(class)⇤◆
where, consistent with Section 2.4, covi
, covb
, covm
refer to achieved instruction,branch and mutation coverage and t
prep
, tgen
, texec
refer to the tool’s preparationtime, test case generation time and test case execution time, measured in hours.!
i
, !b
, !m
and !
t
are the weights, for which we chose the values !i
= 1, !b
= 2,!
m
= 4 and !
t
= 1. As mentioned before, we chose the ability to kill mutants tobe the most important quality indicator, thus !
m
has been assigned the highestvalue. !
t
has been assigned a comparatively low value. The reason for that is,that after the first edition of this benchmark competition (where !
t
= 5) we hada discussion with all the participants and agreed to reduce the impact of time.After all, the tools are fully automatic and a tool’s generation time should playa considerably less important role than its ability to detect faults.
Since it is generally more di�cult to obtain a good branch coverage thana good instruction coverage, we chose !
b
to be two times the value of !i
. Thereason why we included instruction coverage, is to compensate for JaCoCo’snon-standard definition of branch coverage, where methods without conditionalstatements are considered branch-free. Therefore, in the worst case, it is possibleto obtain 100% branch coverage, but at the same time achieving only extremelylow instruction coverage.
The benchmark function and the chosen weight values have been announcedseveral days before the start of the benchmark, so that the participants wereable to tune their tools’ parameters.
2.7 Threats to Validity of the Studies Performed
Conclusion validity The following threats could a↵ect the ability to draw thecorrect conclusion about relations between our treatments (testing tools) andtheir respective outcomes:
Reliability of treatment implementation: This means that there is a risk thatapplication of treatments to subjects is not similar. In order to reduce this threat,a clear protocol was designed, by giving the same instructions to all participants(developers of testing tools that will be evaluated) of the unit testing tool com-petition.
Reliability of measures: Unreliable measures can invalidate our competition.We tried to be as objective as possible for measuring the test e�ciency and ef-fectiveness. For example, all timing information was measured in wall clock time
ωi = 1 ωb = 2 ωm = 4
ωt = 1
HOW do we compare them

Unit Testing Tool Competition – Round Two 7
RUN TOOL
RUN TOOL
RUN TOOL
RUN TOOL
T1T1
T2
TN-1
TN
SCORE
BEN
CHM
ARK
TOO
L
CUTs
GENERATED TEST CASES
COMPILE EXECUTE
MEASURE PERFORMANCE:
M1
COMPETITION EXECUTION FRAMEWORK
AGGREGATOR
MEASURE PERFORMANCE:
M2
Fig. 1. Competition Execution Framework
participant had to implement a run tool, which is a wrapper around the actualtesting tool T
i
and enables communication with the benchmark framework. Itimplements a simple protocol over the standard input and output streams, asdepicted in Figure 2. The benchmark framework starts the protocol by send-ing the string “BENCHMARK” to the standard output stream. It proceedsby sending the location of the SUT’s source code, the compiled class files andits dependencies (the Java classpath). Once the run tool received this informa-tion, it may inform the framework about its own dependencies which might benecessary to compile the generated unit test cases. It therefore can send a class-path string to the framework to be used during the compilation stage. Once ithas done this, it will emit “READY” to inform the framework that it awaitsthe testing challenges. The Framework then starts to send the fully qualifiedname of the first CUT to stdout. The run tool reads this name, analyzes theclass, generates a unit test and creates one or more JUnit test case files in the“temp/testcases” directory. Then, it emits “READY”, after which the frame-work looks into “temp/testcases”, compiles the file(s), executes the test casesand measures the appropriate variables. These steps are repeated until the runtool generated responses for all CUT challenges in the benchmark.
Prior to the final benchmark, we o↵ered a set of test benchmarks compiledfrom popular open source projects. The participants were able to use these inorder to test the correct implementation of the protocol and to tune their tool’sparameters. However, none of the classes of these test benchmarks were part ofthe final benchmark.
HOW do we execute them
JaCoCo
PiTest

8 Sebastian Bauersfeld, Tanja E. J. Vos, and Kiran Lakhotia
run tool for Tool T
BenchmarkFramework
"BENCHMARK"
Src Path / Bin Path / ClassPath
ClassPath for JUnit Compilation
"READY"
.
.
.
name of CUT...
generate file in./temp/testcases
"READY"
compile + execute + measure test case
loop
preparation
Fig. 2. Benchmark Automation Protocol
We carried out the experiment on an Intel(R) Core(TM)2 Quad CPU Q9550@ 2.83GHz with 8GB of main memory running Ubuntu 12.04. 1 LTS. Since mostof the tools work non-deterministic and make use of random number generation,the results often vary between distinct runs. Thus, it was necessary to run thebenchmark multiple times, in order to obtain an average value for the achievedscore. We carried out 7 benchmark runs for each tool before we averaged theachieved score over all runs. Due to time and resource restrictions we were unableto carry out more runs. However, we are confident that the obtained results areaccurate enough, since for each tool the sample standard deviation and resultingconfidence intervals of the scores were small. All timing information was mea-sured in wall clock time using Java’s System.currentTimeMillis() method.
After we obtained and averaged the data, we made the results available toall participants on our benchmark website.
2.6 Data Analysis - How to interpret the findings?
Having measured all variables during the benchmark runs, we had to define aranking scheme in order to determine which tool performed best. We defined themost important indicator of a tool’s quality to be the ability of the generatedtests to kill mutants. In addition, we rewarded a tool’s ability to generate testswith good code coverage. To express the quality of a tool T as a single number,
HOW to implement RUNTOOL

¢ Same as the 2nd competition (but nobody knew ;-))
¢ Java open source libraries
¢ 9 Projects (async http client, eclipse checkstyle, gdata client, guava, hibernate, java machine learning library, Java wikipedia library, scribe, twitter4j)
¢ Sources: Google Code, GitHub, Sourceforge.net
¢ 7 classes per project è total of 63 classes
¢ Packages with highest value for the Afferent Coupling Metric
¢ AFC determines the number of classes from other packages that depend on
classes in the current package.
¢ Select ”popular” classes within a project.
¢ Classes with highest Nested Block Depth
¢ NBD determines the maximal depth of nested statements such as if-‐else
constructs, loops and excepCon handlers.
¢ Select complex classes for which it is difficult to achieve high branch coverage.
¢ No exclusions: abstract, small, large, file constructors…
WHAT were the Benchmark Classes
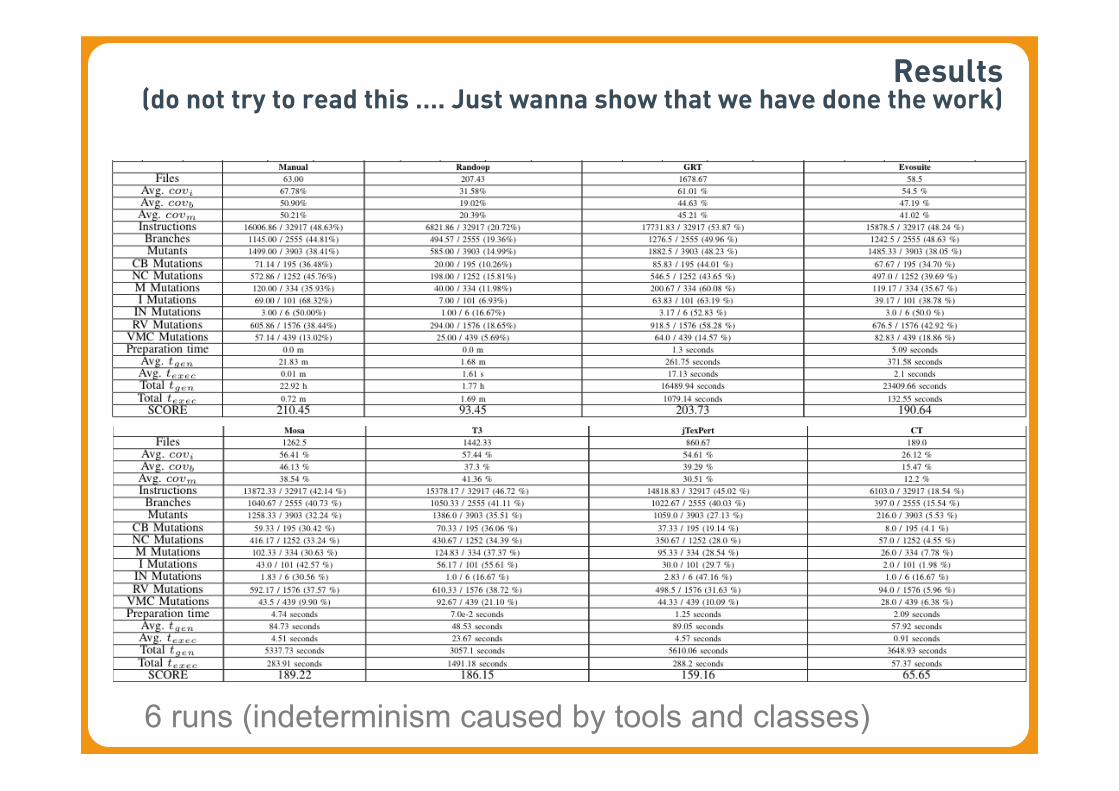
6 runs (indeterminism caused by tools and classes)
Results (do not try to read this …. Just wanna show that we have done the work)

Results per class (do not try to read this …. Just wanna show that we have done the work)

Results per class (do not try to read this …. Just wanna show that we have done the work)

And the winner is…….
210, 45 Manual 203, 73 GRT (1) 190,64 EvoSuite (2) 189,22 MOSA-EvoSuite (3) 186,15 T3 (4) 159,16 Jtexpert (5) 93,45 Randoop 65,5 CT (6)

Combined strength
tools tools+humansAverage covi 78.0 % 84.9 %Average covb 64.7 % 70.1 %Average covm 60.3 % 69.4 %# CUTs with covb = 100% 6 7# CUTs with covb � 80% 31 34CUTs with covi 10% { 43,45,49,61 } { 45 }CUTs with covi 5% { 45,61 } { 45 }SCORE 266.7 277.8
TABLE IVCOMBINED STRENGTH OF THE CONTESTING TOOLS
In Table IVCombined strength of the contesting toolstable.4we show some additional statistics. The column tools showsthe resulting performance if all the competing tools are usedtogether. We do not actually run them together. Instead, foreach target class we simply take the maximum deliveredcoverage of these tools and use this in the scoring formula. Fort
g
and t
ex
we sum the times of all competing tools. The actualperformance if we would really execute all the tools wouldthus be even better than the numbers in Table IVCombinedstrength of the contesting toolstable.4. However, we can seethat together, the tools do beat the novice testers.
The tools+humans column shows the resulting performanceif the novice testers also use all the competing tools to helpthem. The numbers show a big improvement! Without tools,the testers only manage get e.g. 51% branch coverage. Withthe tools they can improve this to as much as 70%, without,in principle, having to tune the tools.
Will the tools be able to beat expert testers? With the datawe currently have, we do not know. In the industry it iscommonly required that tests should deliver at least 80% codecoverage, a ’standard’ that thus also applies to human testers.In terms of instruction coverage, when combined, our toolsalmost reach this milestone. In terms of branch coverage, muchwill have to be improved first. The numbers suggest that atleast individually each tool has ample room to improve (noticethe big difference between each individual score and the tools’collective score). It would be interesting to see if then theywould be able to beat expert testers.
ACKNOWLEDGMENT
We would like to thank the company of CT for offering usa free license of the tool and assisting with all the questionwe had during the configuration.
REFERENCES
[1] S. Bauersfeld, T. Vos, and K. Lakhotia, “Unit testing tool competition –lessons learned,” Workshop on Future Internet Testing (FITTEST), 2013.
[2] “Randoop v1.3.3,” http://code.google.com/p/randoop/, accessed:22/02/2013.
[3] G. Fraser and A. Arcuri, “Evosuite: automatic test suite generation forobject-oriented software.” in SIGSOFT FSE, 2011, pp. 416–419.
[4] L. Ma, C. Artho, H. Sato, J. Gmeiner, R. Rudolf, and C. Zhang,“Enhancing random testing via run-time guidance,” in preparation.
[5] A. Sakti, G. Pesant, and Y. Gueheneuc, “Instance generator and problemrepresentation to improve object oriented code coverage.” to appear inIEEE Transactions on Software Engineering, 2015.
[6] A. Panichella, F. M. Kifetew, and P. Tonella, “Reformulating branchcoverage as a many-objective optimization problem,” in InternationalConference on Software Testing, Verification and Validation (ICST),2015.
[7] C. Pacheco and M. D. Ernst, “Randoop: feedback-directed randomtesting for java,” in Companion to the 22nd ACM SIGPLAN conferenceon Object-oriented programming systems and applications companion,ser. OOPSLA ’07. New York, NY, USA: ACM, 2007, pp. 815–816.[Online]. Available: http://doi.acm.org/10.1145/1297846.1297902
[8] I. S. W. B. Prasetya, “T3, a combinator-based random testing tool forJava: Benchmarking,” Int. Workshop Future Internet Testing, 2014.
[9] I. Prasetya, T. Vos, and A. Baars, “Trace-based reflexive testing of OOprograms with T2,” 1st Int. Conf. on Software Testing, Verification, andValidation (ICST), 2008.
[10] V. R. Basili, F. Shull, and F. Lanubile, “Building knowledge throughfamilies of experiments,” IEEE Trans. Softw. Eng., vol. 25, no. 4, pp.456–473, 1999.
[11] B. Kitchenham, T. Dyba, and M. Jorgensen, “Evidence-based softwareengineering,” in Proc of ICSE. IEEE, 2004, pp. 273–281.
[12] P. Tonella, M. Torchiano, B. Du Bois, and T. Systa, “Empirical studies inreverse engineering: state of the art and future trends,” Empirical Softw.Engg., vol. 12, no. 5, pp. 551–571, 2007.
[13] S. Vegas and V. Basili, “A characterisation schema for software testingtechniques,” Empirical Softw. Engg., vol. 10, no. 4, pp. 437–466, 2005.
[14] B. A. Kitchenham, S. L. Pfleeger, L. M. Pickard, P. W. Jones, D. C.Hoaglin, K. E. Emam, and J. Rosenberg, “Preliminary guidelines forempirical research in software engineering,” IEEE Trans. Softw. Eng.,vol. 28, no. 8, pp. 721–734, 2002.
[15] “Gdata Java Client v1.4.7.1,” https://code.google.com/p/gdata-java-client/, accessed: 08/07/2013.
[16] “Java Machine Learning Libraryr v0.1.7,” http://java-ml.sourceforge.net/, accessed: 09/09/2013.
[17] “Twitter4j v3.0.4,” http://twitter4j.org/en/, accessed: 03/09/2013.[18] “Eclipse checkstyle plugin v5.6.1,” http://eclipse-cs.sourceforge.net/, ac-
cessed: 02/09/2013.[19] “Guava v15,” https://code.google.com/p/guava-libraries/, accessed:
08/09/2013.[20] “Hibernate v4.2.7,” http://www.hibernate.org, accessed: 02/09/2013.[21] “Java Wikipedia Library v0.9.2,” https://code.google.com/p/jwpl/, ac-
cessed: 17/07/2013.[22] “Async Http Client v1.7.20,” https://github.com/AsyncHttpClient/
async-http-client, accessed: 03/09/2013.[23] “Scribe v1.3.5,” https://github.com/fernandezpablo85/scribe-java, ac-
cessed: 03/09/2013.

¢ More classes
¢ Need testers for manual baseline
¢ Any volunteers? ;-)
¢ More participants!!
¢ Score: ¢ The participants will have a lot to say ;-)
¢ Tool library dependencies appearing as CUTs (the known Guava library problems)
Future Editions

Contact
§ Tanja E. J. Vos § correo: [email protected] § twi2er/skype: tanja_vos § web: hIp://staq.dsic.upv.es/ § teléfono: +34 690 917 971