sc08 workshop on the path to exascale: an overview of
TRANSCRIPT
DEPARTMENT OF COMPUTER SCIENCE @ LOUISIANA STATE UNIVERSITY 1
SC08 Workshop on the Path to Exascale:An Overview of Exascale Architecture Challenges
Thomas Sterling (with Peter Kogge, UND)Arnaud and Edwards Professor of Computer Science
Louisiana State University
Visiting Associate, California Institute of TechnologyDistinguished Visiting Scientist, Oak Ridge National Laboratory
November 16, 2008
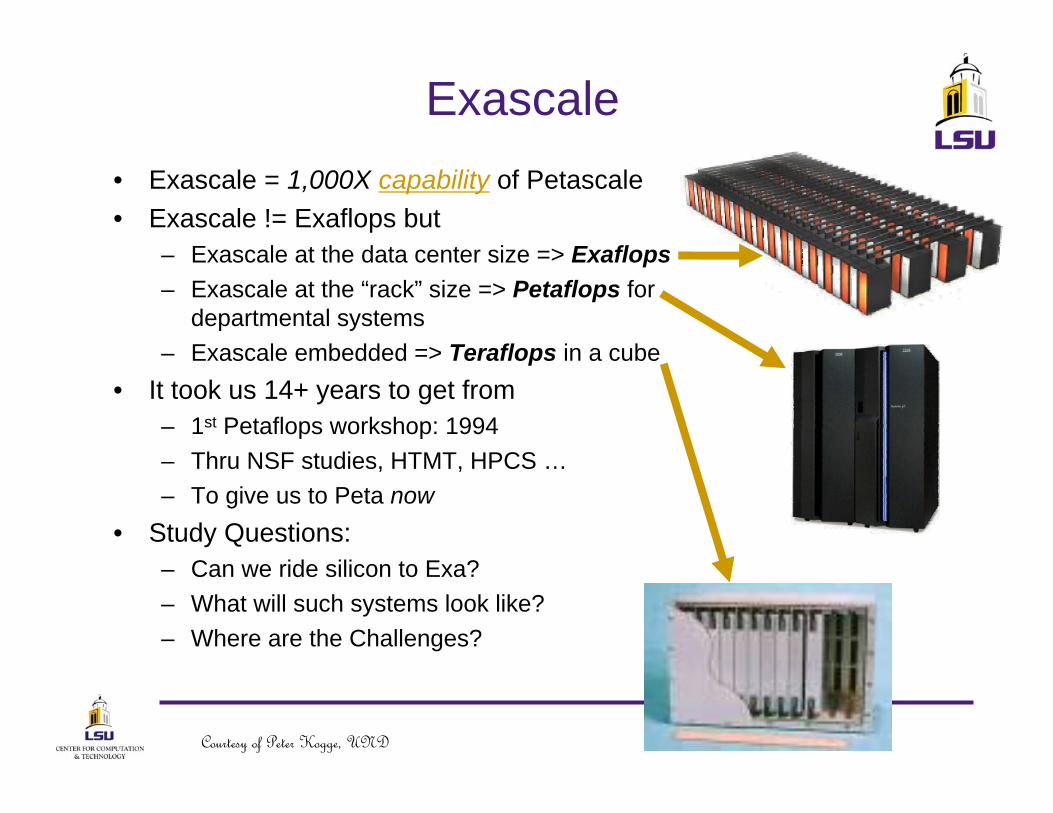
Exascale• Exascale = 1,000X capability of Petascale• Exascale != Exaflops but
– Exascale at the data center size => Exaflops– Exascale at the “rack” size => Petaflops for
departmental systems – Exascale embedded => Teraflops in a cube
• It took us 14+ years to get from– 1st Petaflops workshop: 1994– Thru NSF studies, HTMT, HPCS …– To give us to Peta now
• Study Questions: – Can we ride silicon to Exa?– What will such systems look like?– Where are the Challenges?
Courtesy of Peter Kogge, UND
3
100 Mflops
1 Gflops
10 Gflops
100 Gflops
1 Tflops
10 Tflops
100 Tflops
1 Pflops
10 Pflops
100 Pflops
1 Eflops
10 Eflops
2000 2010 2040 20431995 2005 20301993
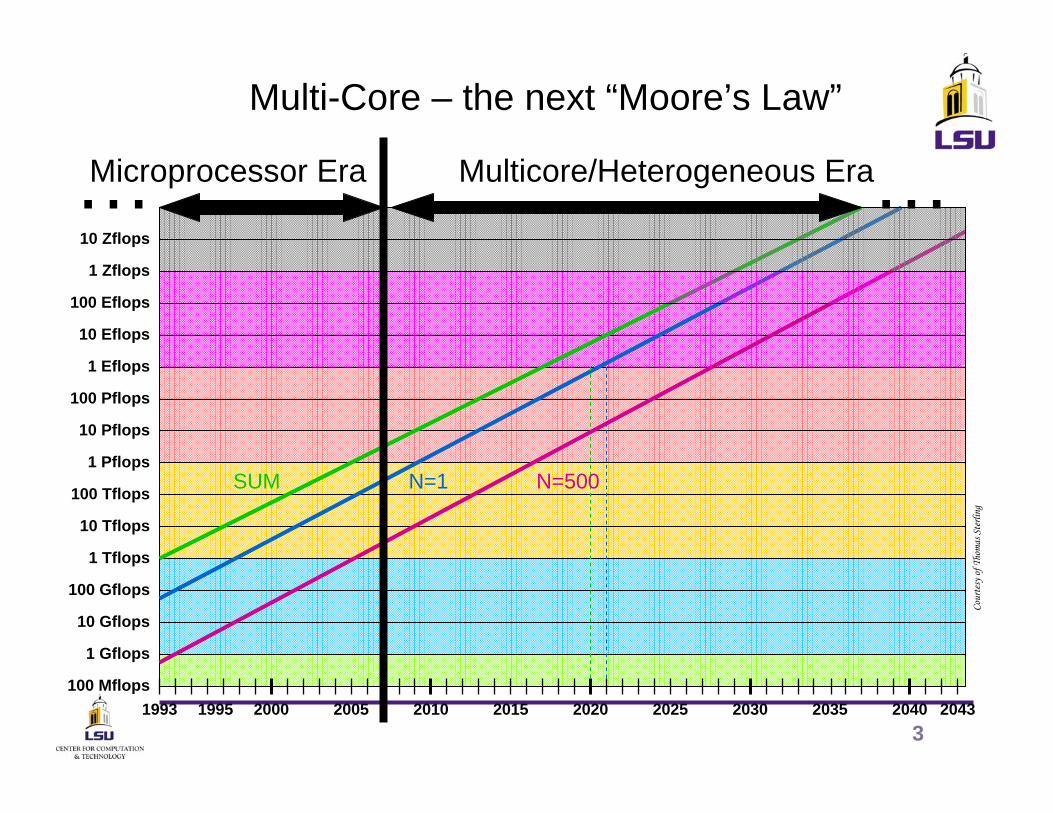
SUM N=1 N=500
Cour
tesy
of T
hom
as S
terli
ng
100 Eflops
1 Zflops
10 Zflops
2015 2020 2025 2035
……Microprocessor Era Multicore/Heterogeneous Era
Multi-Core – the next “Moore’s Law”
Top Level View – the 6 P’s• Performance
– Sustained flops but informatics too• Parallelism
– At unprecedented scales requiring low overhead• Power
– perhaps #1 constraint• Price
– Practical upper bounds, more severe for products• Persistence
– By this we mean continued operation– Reliability, availability, time to repair, …
• Programming– Multicore and heterogeneous already a major challenge
DEPARTMENT OF COMPUTER SCIENCE @ LOUISIANA STATE UNIVERSITY 4

11 Academic 6 Non-Academic 5 “Government”+ Special Domain Experts
11 Academic 6 Non-Academic 5 “Government”+ Special Domain Experts
The Exascale Study Group
UT-AustinSteve KecklerColumbiaKeren Bergman
AffiliationNAMEAffiliationNAME
MicronDean KleinIntelShekhar Borkar
Notre DamePeter KoggeGTRIDan Campbell
UC-BerkeleyKathy YelickSTASherman Karp
HPStan WilliamsSTAJon Hiller
LSUThomas SterlingAFRLKerry Hill
SDSCAllan SnavelyDARPABill Harrod
CraySteve ScottNCSUPaul Franzon
AFRLAl ScarpeliIBMMonty Denneau
Georgia TechMark RichardsStanfordBill Dally
USC/ISIBob LucasIDABill Carlson
10+ Study Meetings over 2nd half 200710+ Study Meetings over 2nd half 2007Courtesy of Peter Kogge, UND
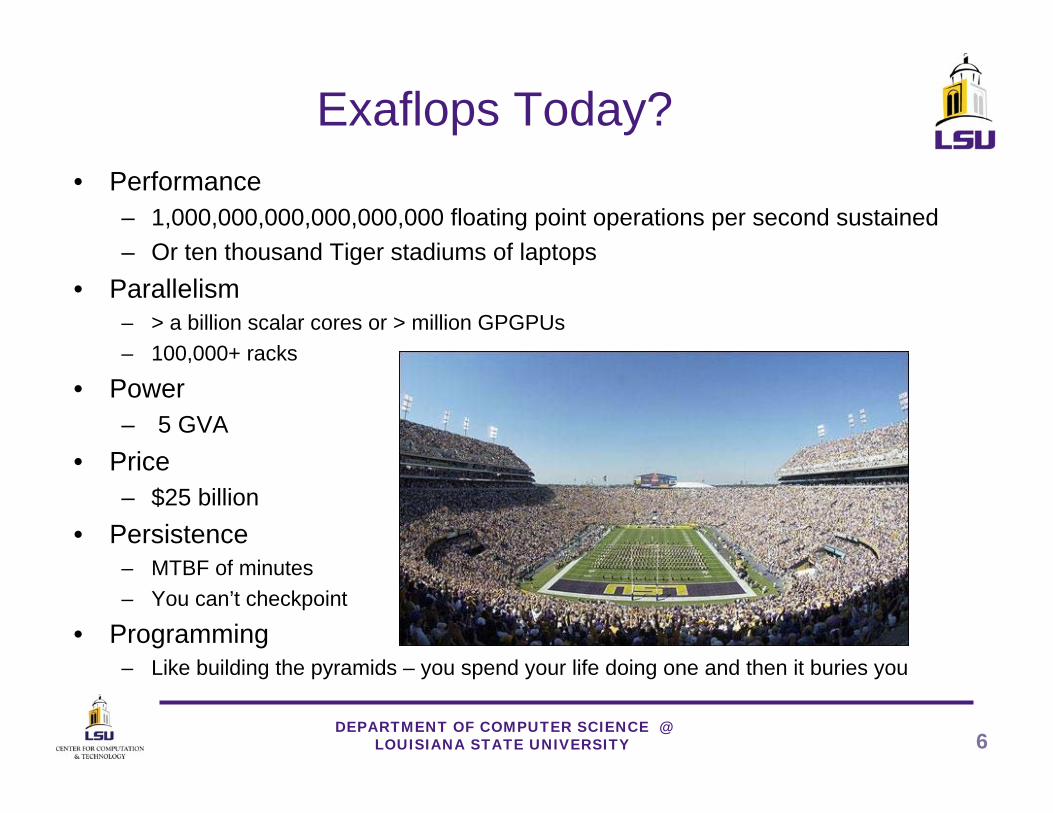
Exaflops Today?• Performance
– 1,000,000,000,000,000,000 floating point operations per second sustained– Or ten thousand Tiger stadiums of laptops
• Parallelism– > a billion scalar cores or > million GPGPUs– 100,000+ racks
• Power– 5 GVA
• Price– $25 billion
• Persistence– MTBF of minutes– You can’t checkpoint
• Programming– Like building the pyramids – you spend your life doing one and then it buries you
DEPARTMENT OF COMPUTER SCIENCE @ LOUISIANA STATE UNIVERSITY 6
Architectures Considered
• Evolutionary Strawmen – “Heavyweight” Strawman” based on
commodity-derived microprocessors– “Lightweight” Strawman” based on
custom microprocessors
• Aggressive Strawman– “Clean Sheet of Paper” Silicon
Courtesy of Peter Kogge, UND
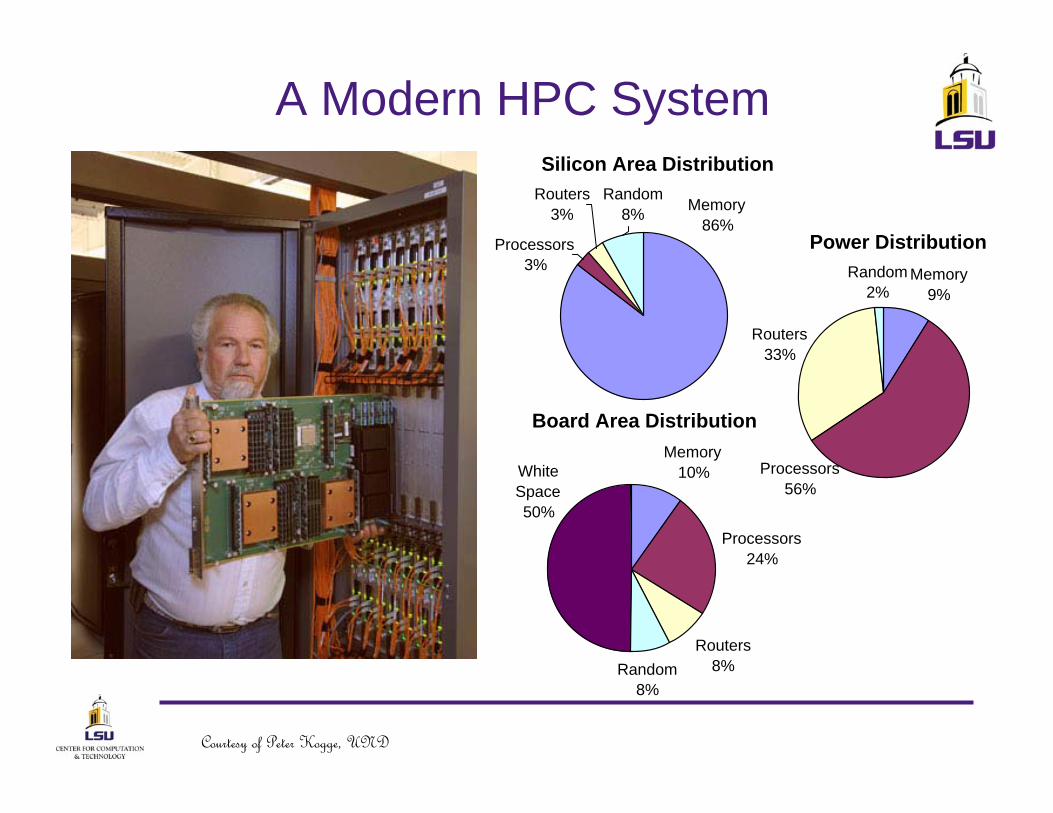
A Modern HPC System
Power DistributionMemory
9%
Routers33%
Random2%
Processors56%
Silicon Area Distribution
Processors3%
Routers3% Memory
86%
Random8%
Board Area DistributionMemory
10%
Processors24%
Routers8%
White Space50%
Random8%
Courtesy of Peter Kogge, UND

Evolutionary Scaling Assumptions
• Applications will demand same DRAM/Flops ratio as today
• Ignore any changes needed in disk capacity
• Processor die size will remain constant
• Continued reduction in device area => multi-core chips
• Vdd, max power dissipation will flatten as forecast– Thus clock rates limited as before
• On a per core basis, microarchitecture will improve from 2 flops/cycle to 4 in 2008, and 8 in 2015
• Max # of sockets per board will double roughly every 5 years
• Max # of boards per rank will increase once by 33%
• Max power per rack will double every 3 years
• Allow growth in system configuration by 50 racks each year
Courtesy of Peter Kogge, UND
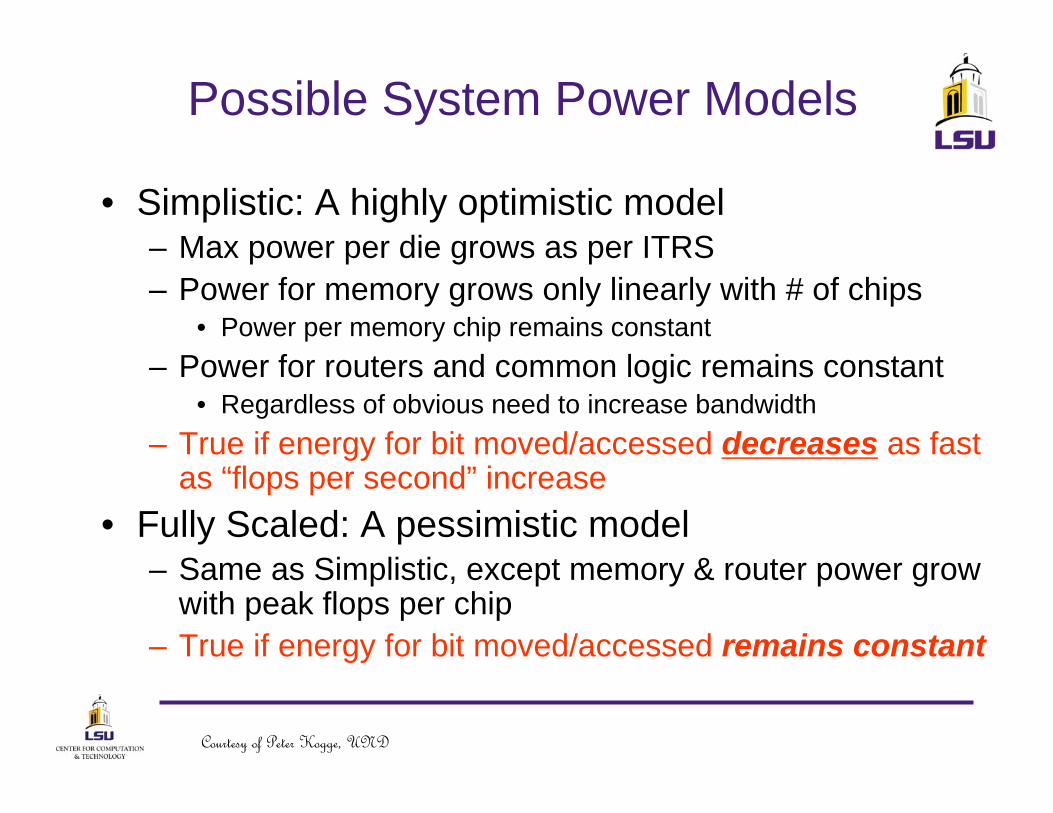
Possible System Power Models
• Simplistic: A highly optimistic model– Max power per die grows as per ITRS– Power for memory grows only linearly with # of chips
• Power per memory chip remains constant– Power for routers and common logic remains constant
• Regardless of obvious need to increase bandwidth– True if energy for bit moved/accessed decreases as fast
as “flops per second” increase• Fully Scaled: A pessimistic model
– Same as Simplistic, except memory & router power grow with peak flops per chip
– True if energy for bit moved/accessed remains constant
Courtesy of Peter Kogge, UND
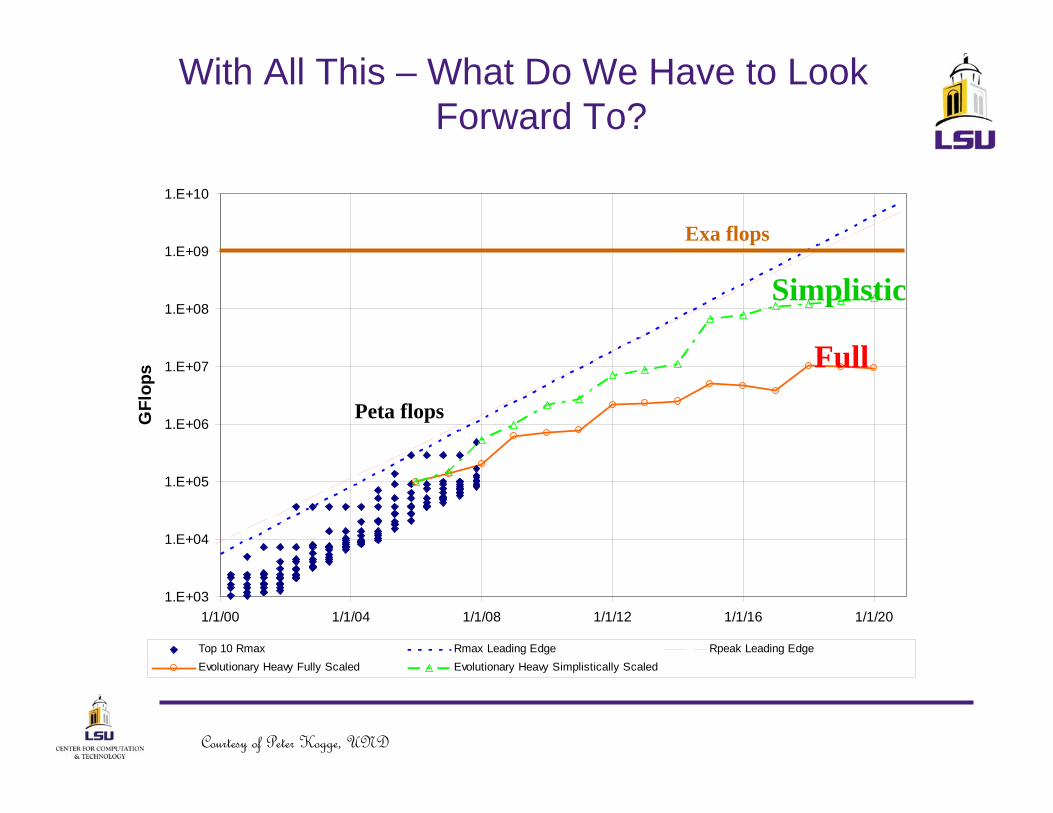
With All This – What Do We Have to Look Forward To?
1.E+03
1.E+04
1.E+05
1.E+06
1.E+07
1.E+08
1.E+09
1.E+10
1/1/00 1/1/04 1/1/08 1/1/12 1/1/16 1/1/20
GFl
ops
Top 10 Rmax Rmax Leading Edge Rpeak Leading EdgeEvolutionary Heavy Fully Scaled Evolutionary Heavy Simplistically Scaled
Full
Simplistic
Peta flops
Exa flops
Courtesy of Peter Kogge, UND
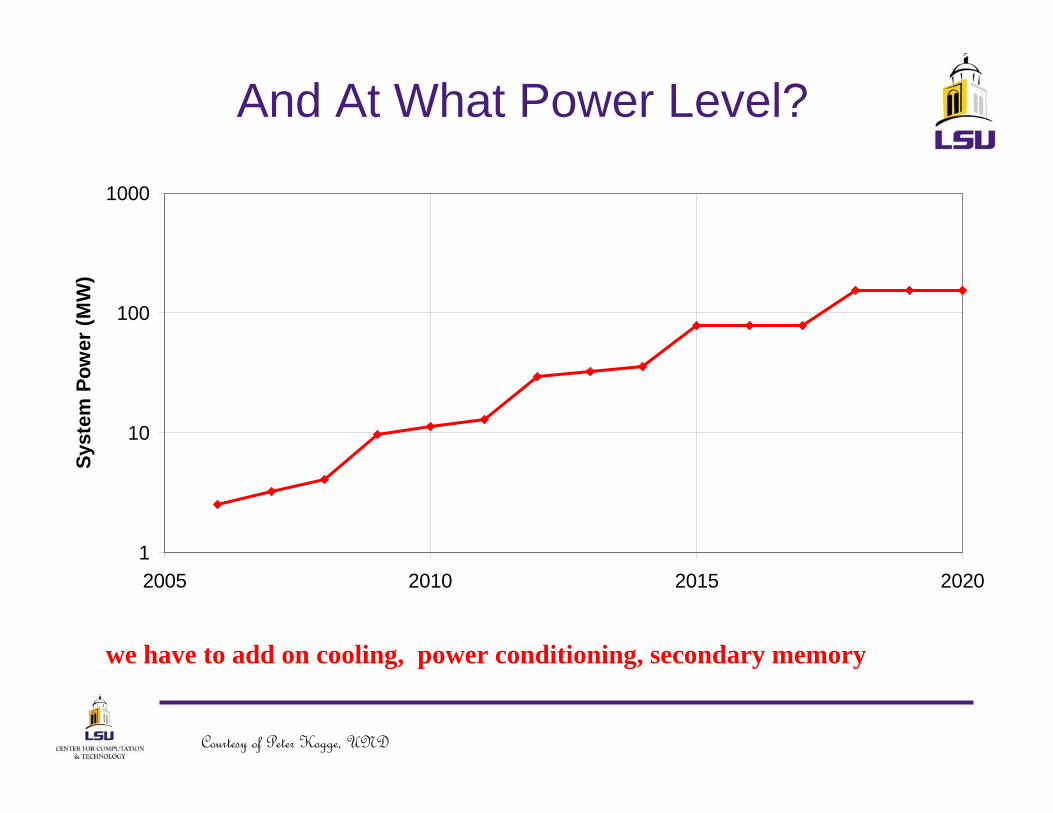
And At What Power Level?
we have to add on cooling, power conditioning, secondary memory
1
10
100
1000
2005 2010 2015 2020
Syst
em P
ower
(MW
)
Courtesy of Peter Kogge, UND
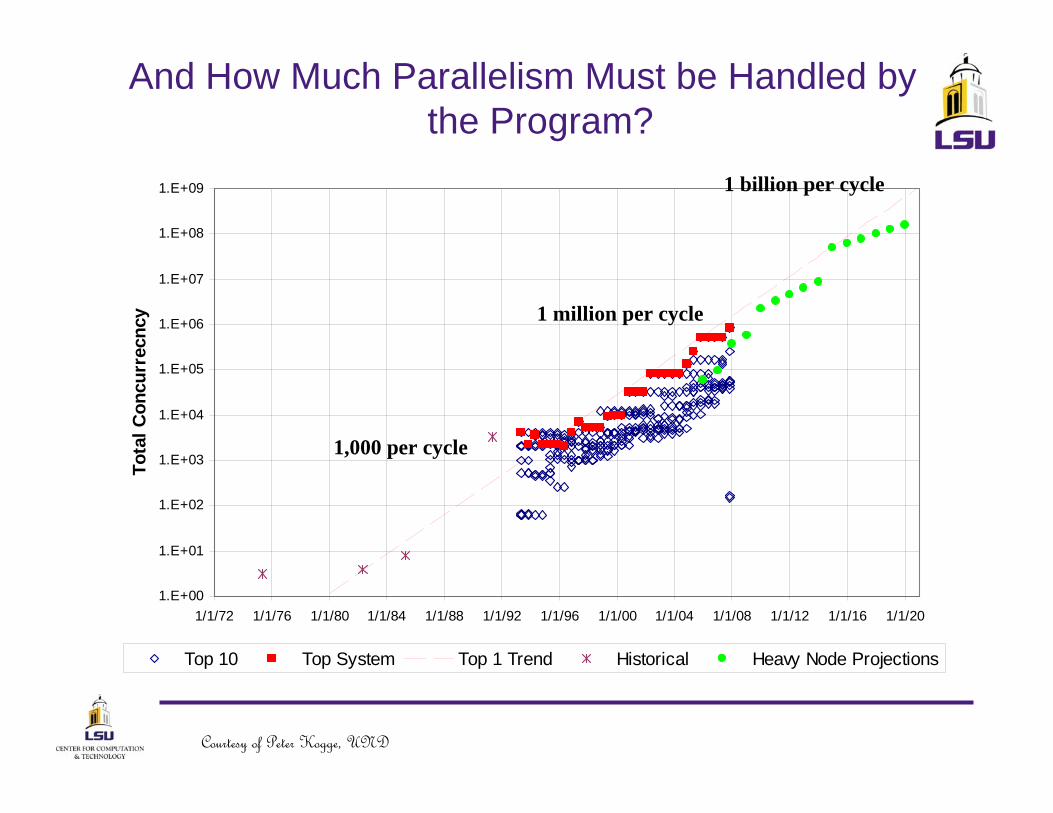
And How Much Parallelism Must be Handled by the Program?
1.E+00
1.E+01
1.E+02
1.E+03
1.E+04
1.E+05
1.E+06
1.E+07
1.E+08
1.E+09
1/1/72 1/1/76 1/1/80 1/1/84 1/1/88 1/1/92 1/1/96 1/1/00 1/1/04 1/1/08 1/1/12 1/1/16 1/1/20
Tota
l Con
curr
ecnc
y
Top 10 Top System Top 1 Trend Historical Heavy Node Projections
1,000 per cycle
1 million per cycle
1 billion per cycle
Courtesy of Peter Kogge, UND
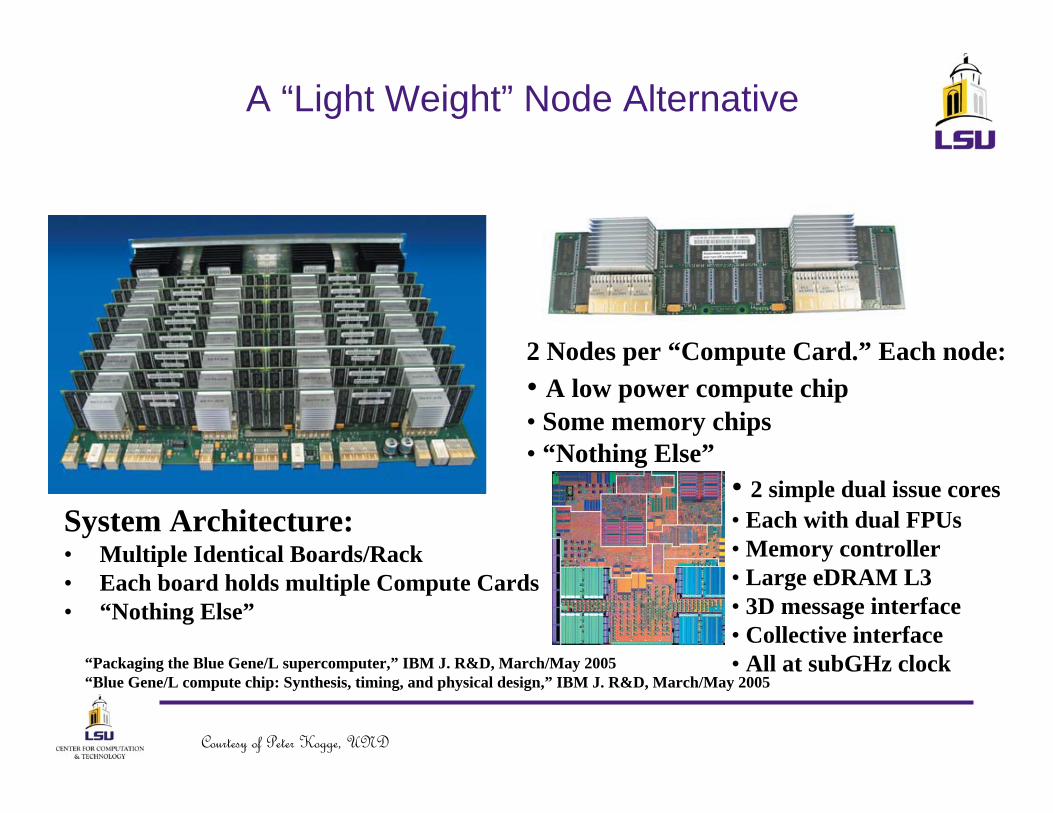
A “Light Weight” Node Alternative
2 Nodes per “Compute Card.” Each node:• A low power compute chip• Some memory chips• “Nothing Else”
System Architecture:• Multiple Identical Boards/Rack• Each board holds multiple Compute Cards• “Nothing Else”
• 2 simple dual issue cores• Each with dual FPUs• Memory controller• Large eDRAM L3• 3D message interface• Collective interface• All at subGHz clock“Packaging the Blue Gene/L supercomputer,” IBM J. R&D, March/May 2005
“Blue Gene/L compute chip: Synthesis, timing, and physical design,” IBM J. R&D, March/May 2005
Courtesy of Peter Kogge, UND
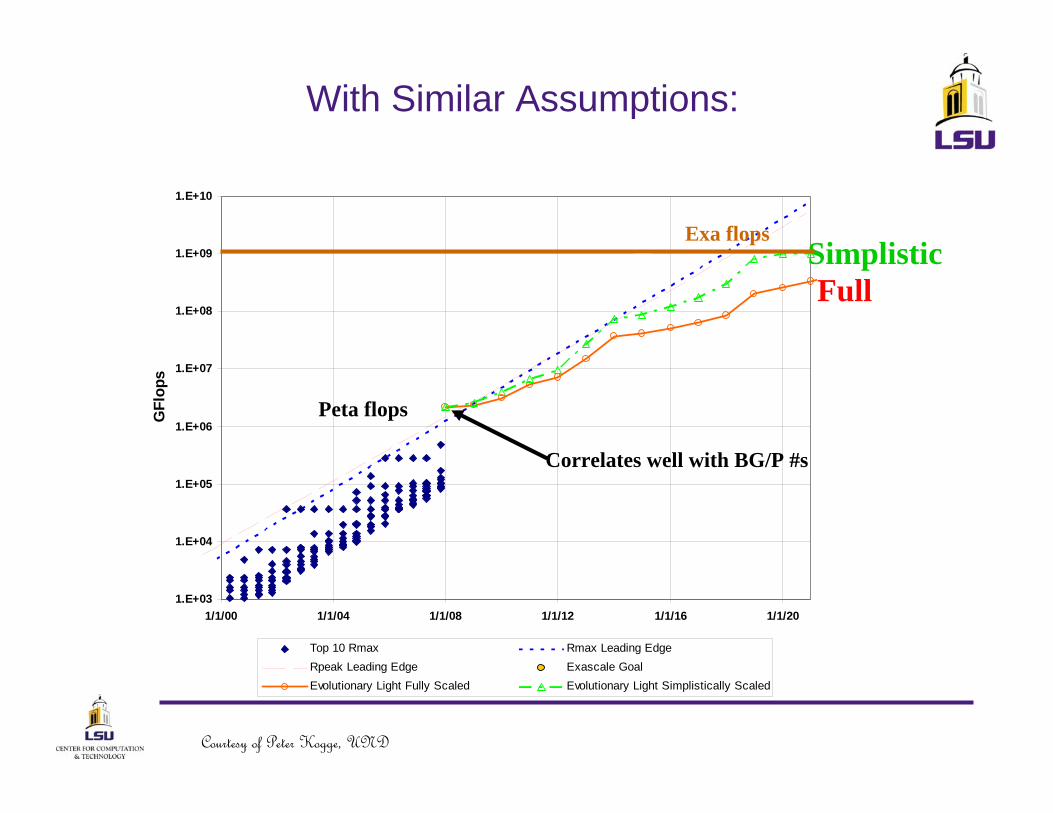
1.E+03
1.E+04
1.E+05
1.E+06
1.E+07
1.E+08
1.E+09
1.E+10
1/1/00 1/1/04 1/1/08 1/1/12 1/1/16 1/1/20
GFl
ops
Top 10 Rmax Rmax Leading EdgeRpeak Leading Edge Exascale GoalEvolutionary Light Fully Scaled Evolutionary Light Simplistically Scaled
With Similar Assumptions:
FullSimplistic
Peta flops
Exa flops
Correlates well with BG/P #s
Courtesy of Peter Kogge, UND
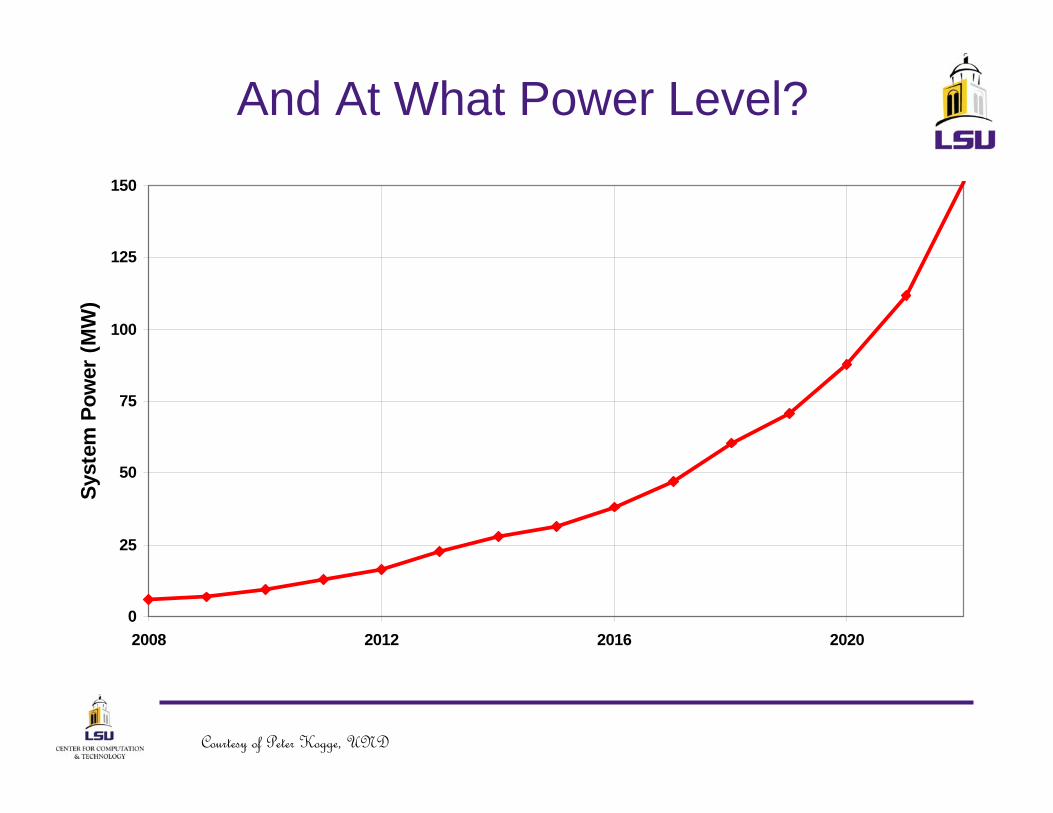
And At What Power Level?
0
25
50
75
100
125
150
2008 2012 2016 2020
Syst
em P
ower
(MW
)
Courtesy of Peter Kogge, UND
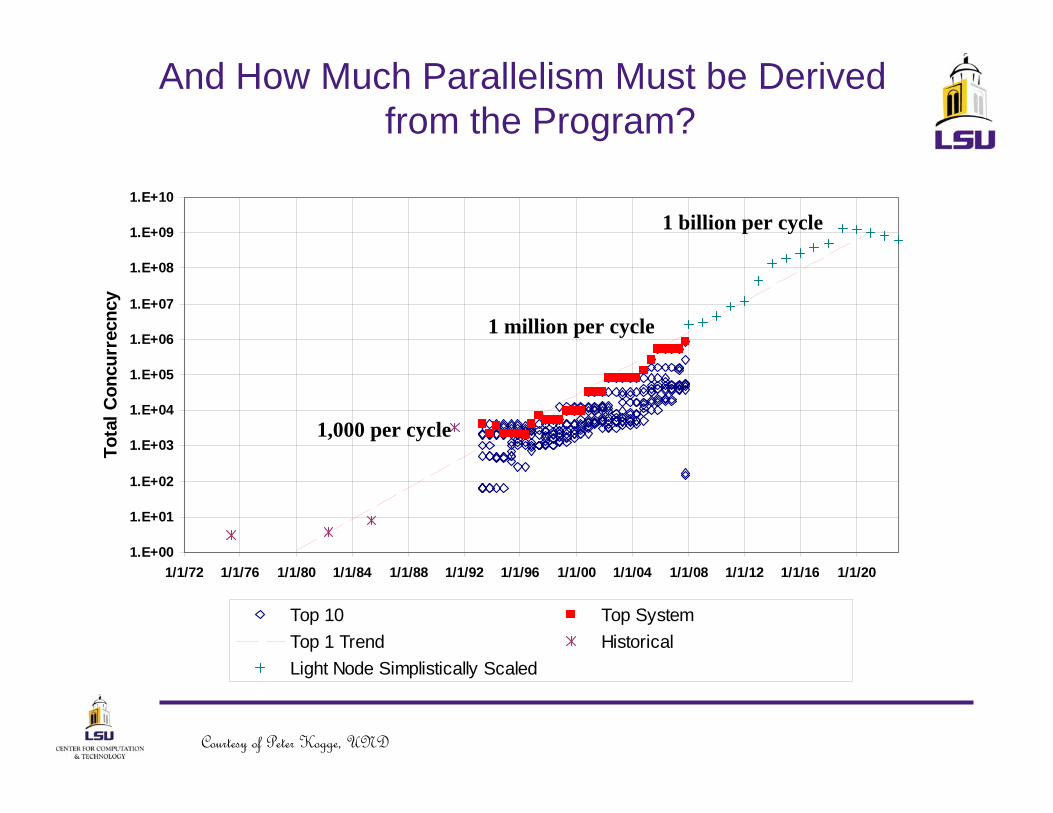
1.E+00
1.E+01
1.E+02
1.E+03
1.E+04
1.E+05
1.E+06
1.E+07
1.E+08
1.E+09
1.E+10
1/1/72 1/1/76 1/1/80 1/1/84 1/1/88 1/1/92 1/1/96 1/1/00 1/1/04 1/1/08 1/1/12 1/1/16 1/1/20
Tota
l Con
curr
ecnc
y
Top 10 Top SystemTop 1 Trend HistoricalLight Node Simplistically Scaled
And How Much Parallelism Must be Derived from the Program?
1,000 per cycle
1 million per cycle
1 billion per cycle
Courtesy of Peter Kogge, UND
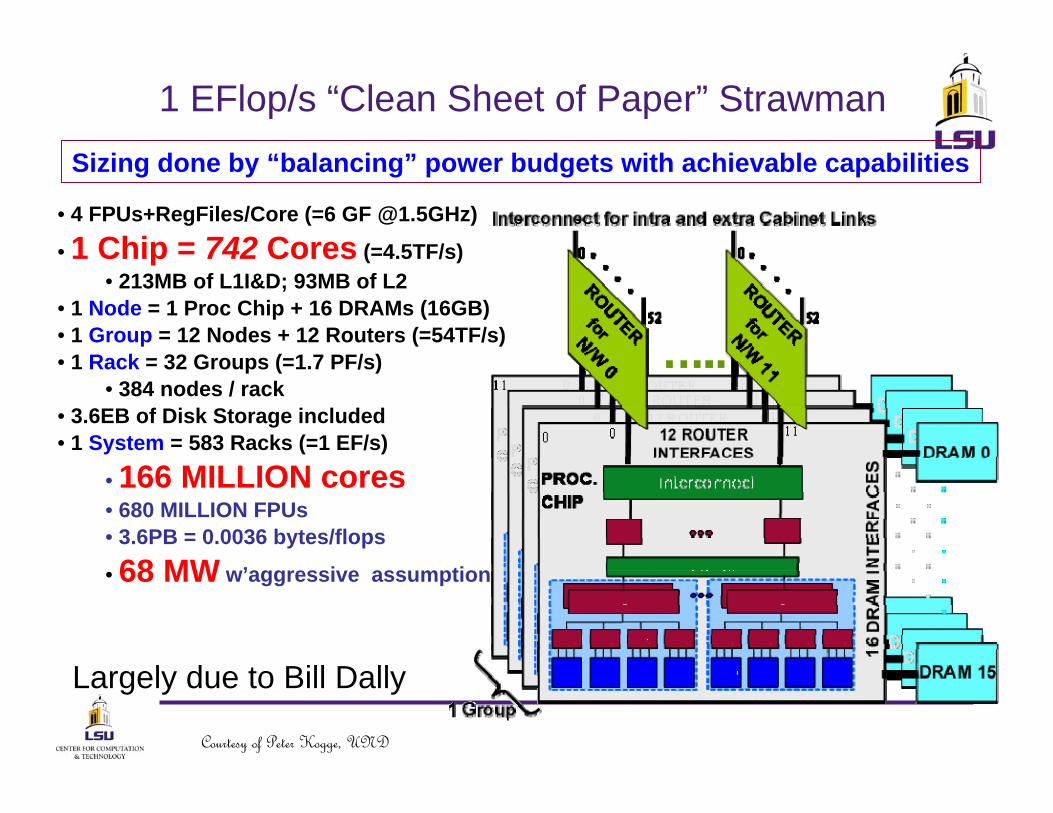
1 EFlop/s “Clean Sheet of Paper” Strawman
• 4 FPUs+RegFiles/Core (=6 GF @1.5GHz)
• 1 Chip = 742 Cores (=4.5TF/s)• 213MB of L1I&D; 93MB of L2
• 1 Node = 1 Proc Chip + 16 DRAMs (16GB)• 1 Group = 12 Nodes + 12 Routers (=54TF/s)• 1 Rack = 32 Groups (=1.7 PF/s)
• 384 nodes / rack• 3.6EB of Disk Storage included • 1 System = 583 Racks (=1 EF/s)
• 166 MILLION cores• 680 MILLION FPUs• 3.6PB = 0.0036 bytes/flops
• 68 MW w’aggressive assumptions
Sizing done by “balancing” power budgets with achievable capabilities
Largely due to Bill Dally
Courtesy of Peter Kogge, UND
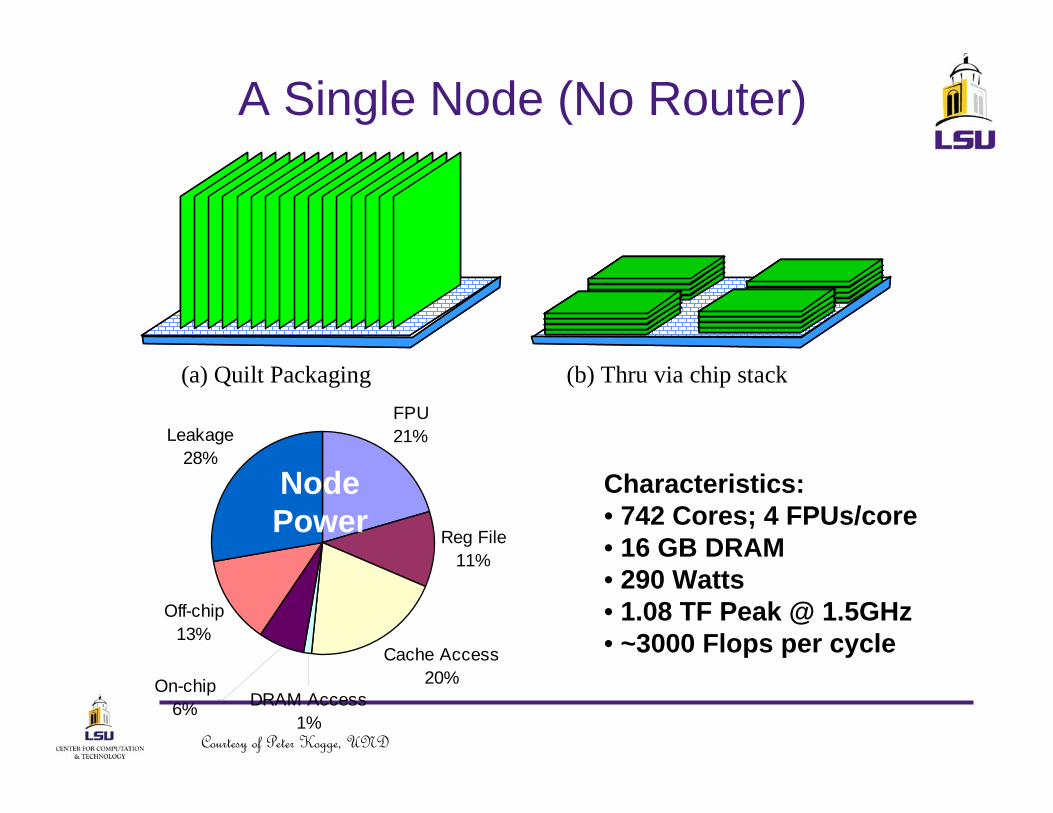
A Single Node (No Router)
(a) Quilt Packaging (b) Thru via chip stack
Reg File11%
Cache Access20%
Off-chip13%
Leakage28%
On-chip 6% DRAM Access
1%
FPU21%
NodePower
Characteristics:• 742 Cores; 4 FPUs/core • 16 GB DRAM• 290 Watts• 1.08 TF Peak @ 1.5GHz• ~3000 Flops per cycle
Courtesy of Peter Kogge, UND
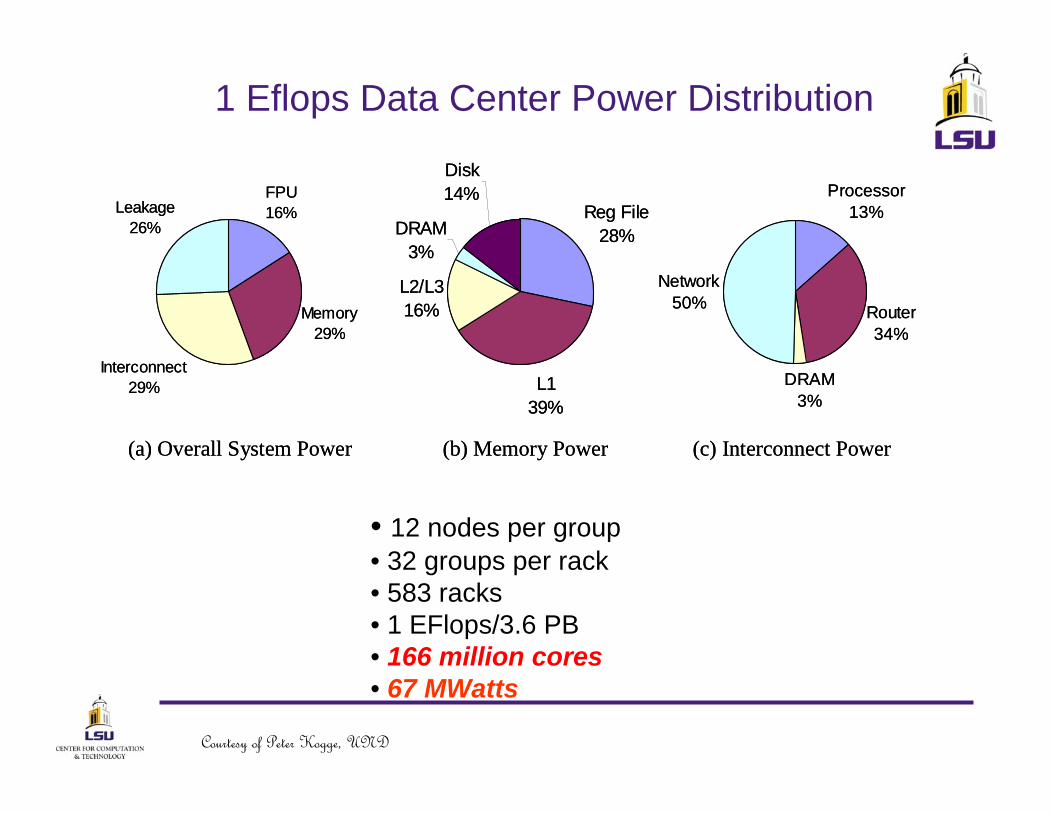
1 Eflops Data Center Power Distribution
Processor13%
Router34%
DRAM3%
Network50%
FPU16%
Memory29%
Interconnect29%
Leakage26%
Reg File28%
L139%
L2/L316%
DRAM3%
Disk14%
(a) Overall System Power (b) Memory Power (c) Interconnect Power
Processor13%
Router34%
DRAM3%
Network50%
FPU16%
Memory29%
Interconnect29%
Leakage26%
Reg File28%
L139%
L2/L316%
DRAM3%
Disk14%
(a) Overall System Power (b) Memory Power (c) Interconnect Power
• 12 nodes per group• 32 groups per rack• 583 racks• 1 EFlops/3.6 PB• 166 million cores• 67 MWatts
Courtesy of Peter Kogge, UND
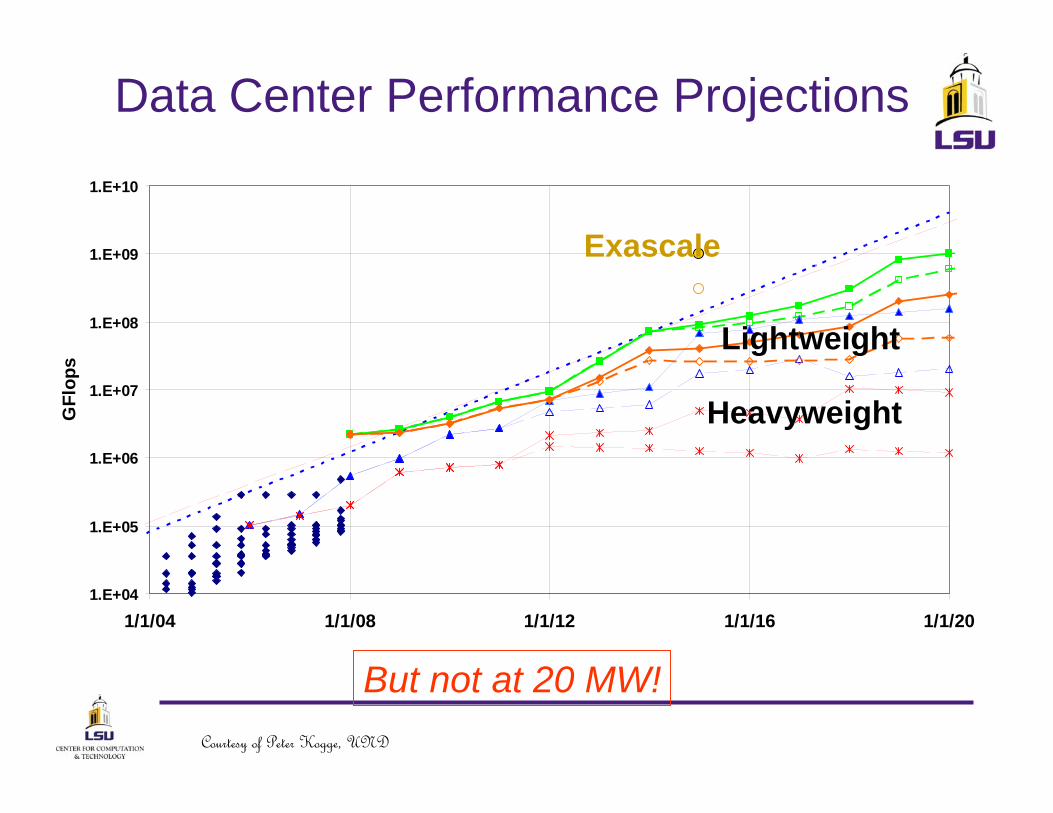
Data Center Performance Projections
1.E+04
1.E+05
1.E+06
1.E+07
1.E+08
1.E+09
1.E+10
1/1/04 1/1/08 1/1/12 1/1/16 1/1/20
GFl
ops
Exascale
But not at 20 MW!
Heavyweight
Lightweight
Courtesy of Peter Kogge, UND
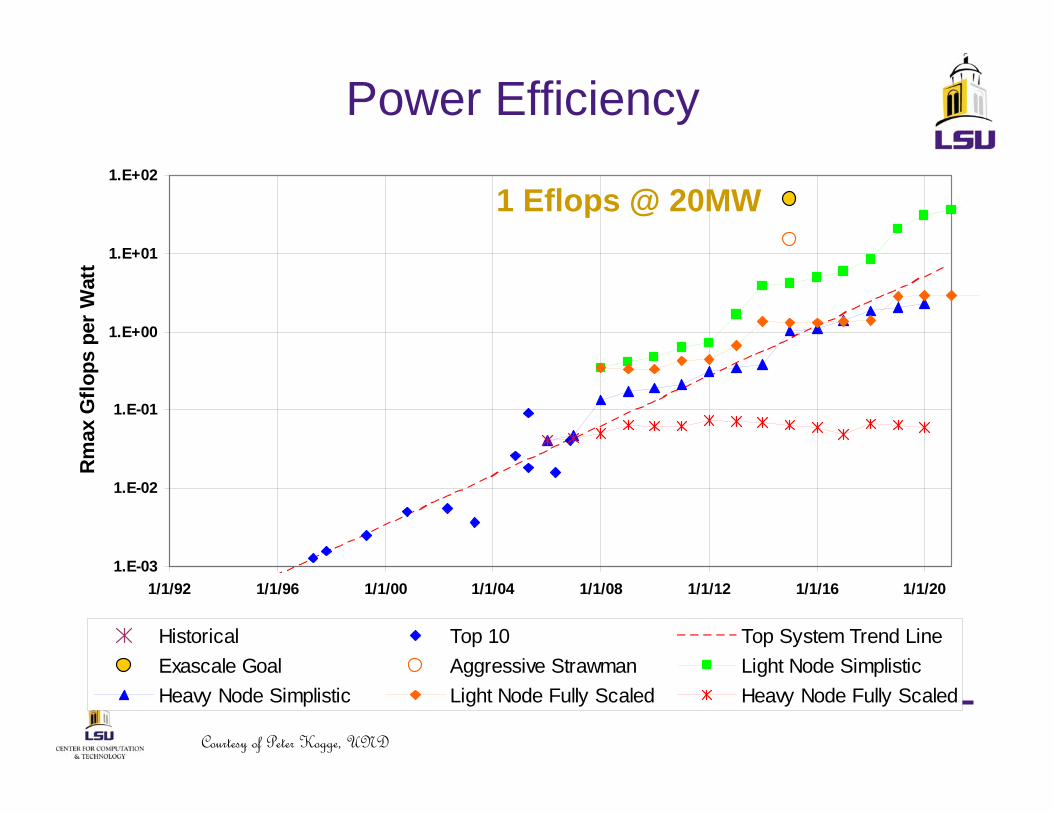
Power Efficiency
1.E-03
1.E-02
1.E-01
1.E+00
1.E+01
1.E+02
1/1/92 1/1/96 1/1/00 1/1/04 1/1/08 1/1/12 1/1/16 1/1/20
Rm
ax G
flops
per
Wat
t
Historical Top 10 Top System Trend LineExascale Goal Aggressive Strawman Light Node SimplisticHeavy Node Simplistic Light Node Fully Scaled Heavy Node Fully Scaled
1 Eflops @ 20MW
Courtesy of Peter Kogge, UND
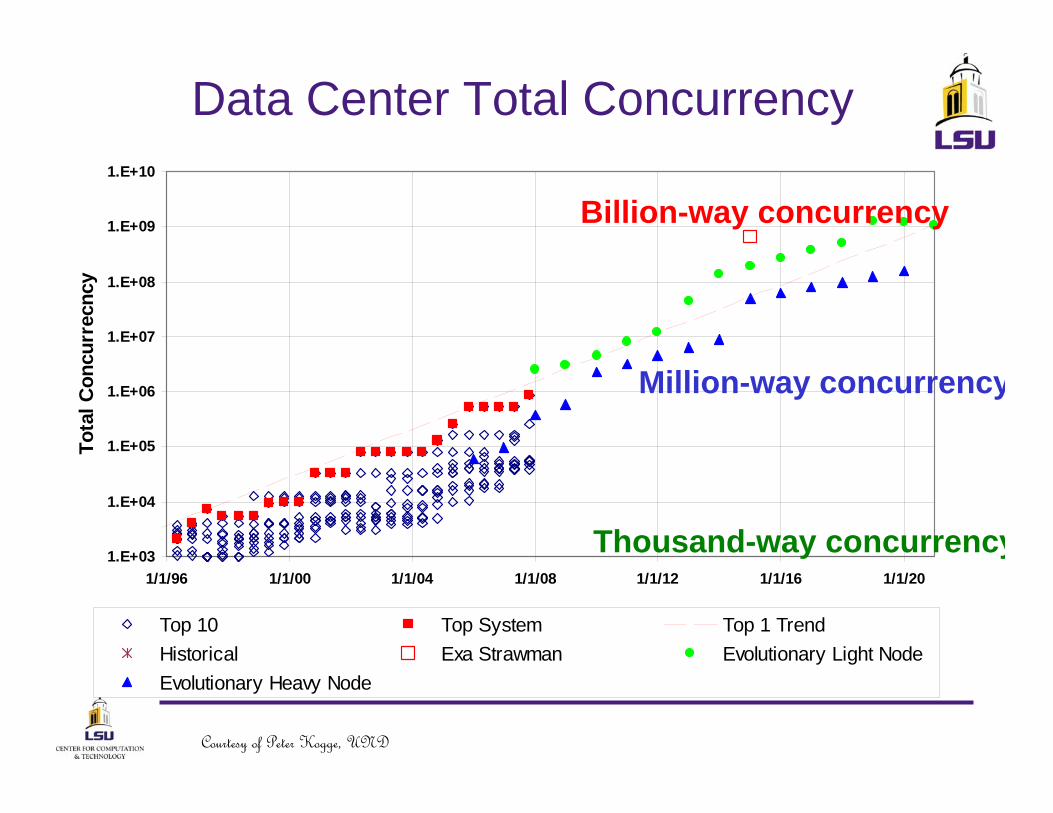
1.E+03
1.E+04
1.E+05
1.E+06
1.E+07
1.E+08
1.E+09
1.E+10
1/1/96 1/1/00 1/1/04 1/1/08 1/1/12 1/1/16 1/1/20
Tota
l Con
curr
ecnc
y
Top 10 Top System Top 1 TrendHistorical Exa Strawman Evolutionary Light NodeEvolutionary Heavy Node
Data Center Total Concurrency
Billion-way concurrency
Million-way concurrency
Thousand-way concurrency
Courtesy of Peter Kogge, UND

24
Two Strategies for Exaflops
• Structure– Low overhead mechanisms for parallel execution management– Heterogeneous support for
• in memory computing• High data reuse streaming
– Rebalance of resources to emphasize precious technology elements
• Execution Model– Expose and exploit diversity of parallelism granularity form and scale– Intrinsic latency hiding– Dynamic adaptive resource management
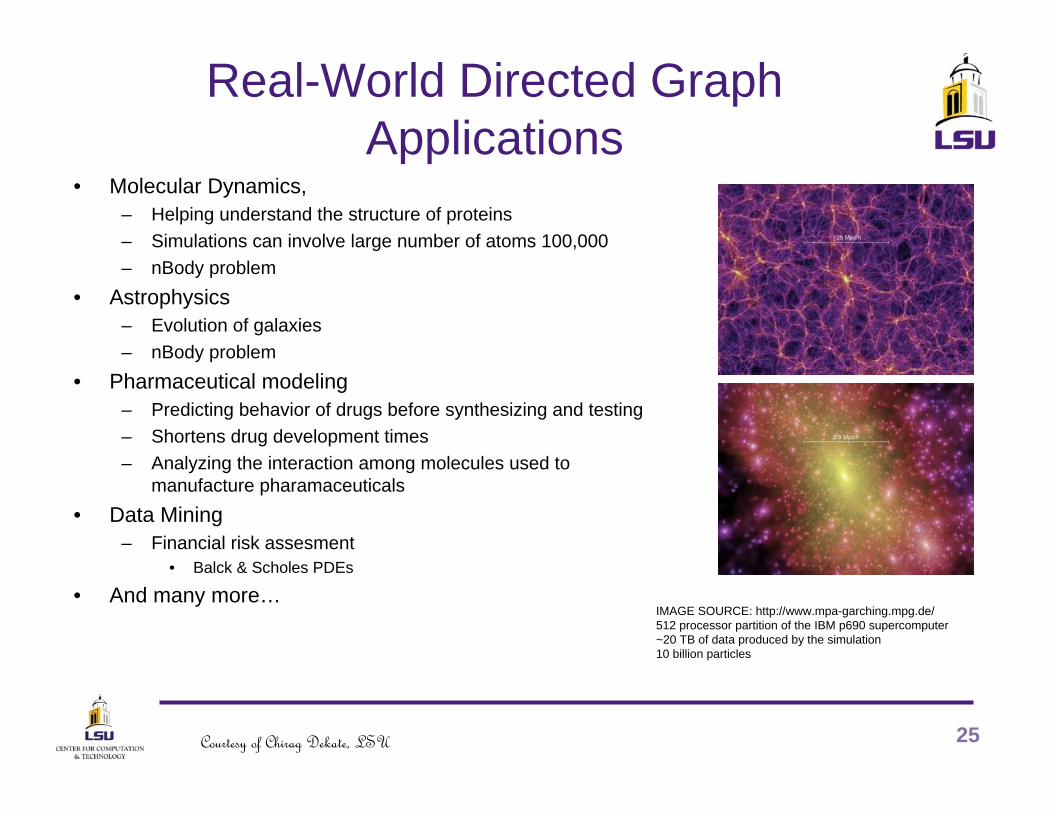
Real-World Directed Graph Applications
• Molecular Dynamics, – Helping understand the structure of proteins– Simulations can involve large number of atoms 100,000– nBody problem
• Astrophysics– Evolution of galaxies– nBody problem
• Pharmaceutical modeling– Predicting behavior of drugs before synthesizing and testing– Shortens drug development times– Analyzing the interaction among molecules used to
manufacture pharamaceuticals• Data Mining
– Financial risk assesment• Balck & Scholes PDEs
• And many more…
25
IMAGE SOURCE: http://www.mpa-garching.mpg.de/512 processor partition of the IBM p690 supercomputer~20 TB of data produced by the simulation10 billion particles
Courtesy of Chirag Dekate, LSU
Dynamic Graph Processing For Informatics
• Run-time Scheduling of Directed Graphs– Sub-domain of graphs:
• Search space problems • Planning
– Data-driven• Progress towards the global objective of the application• Local Evaluation value• Global status of the problem
– Evaluation value across the leaf nodes of the current stage of execution in Graphs
• Inverse inheritance from children – Captures feedback from the children of the current node– Recursive search
• Resource Contention – Local and Global resources such as Bandwidth and Memory are key constraining
factors
26Courtesy of Chirag Dekate, LSU

Chess Game Engine• The Game of chess has several
attributes that makes it the core of the experiments to be carried out – NOT to build the best chess engine
• Key aim is to help design and develop data-directed semantics of execution model and associated scheduling policies to improve the scalability of graph problems
• Minimax algorithm and Alpha-Beta pruning will be tested as the first workload.
27
Images from: http://www.pressibus.org/ataxx/autre/minimax
Courtesy of Chirag Dekate, LSU
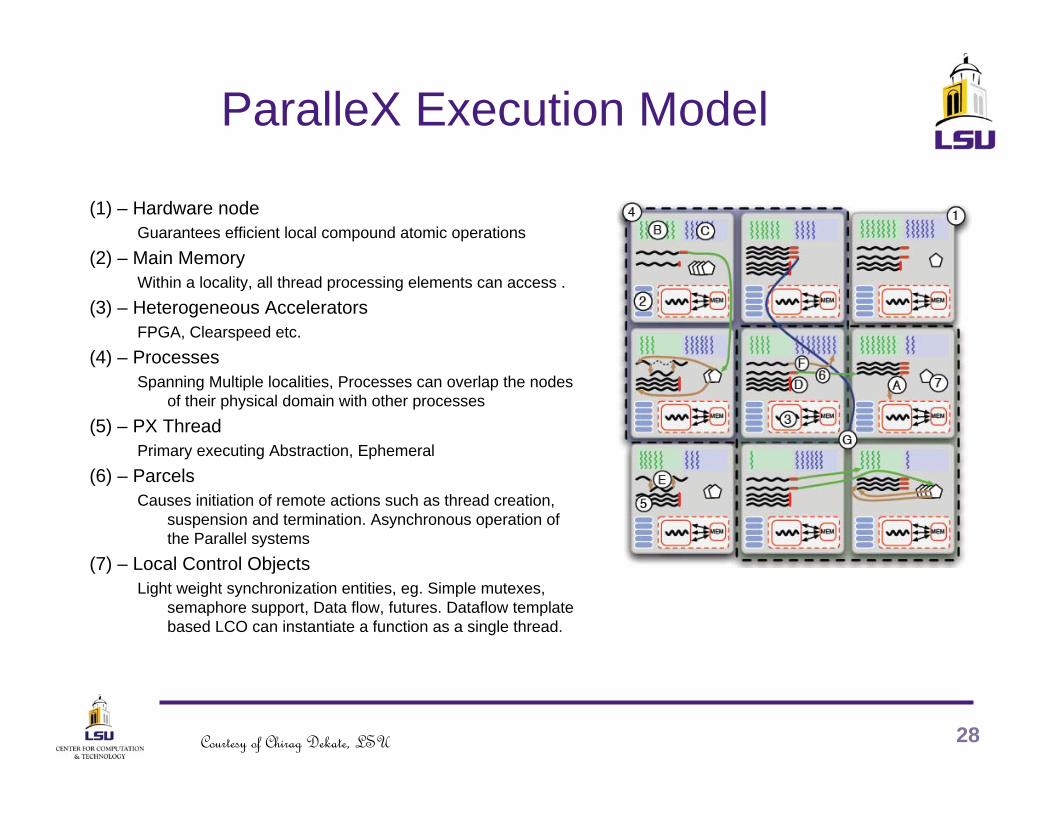
ParalleX Execution Model
(1) – Hardware nodeGuarantees efficient local compound atomic operations
(2) – Main MemoryWithin a locality, all thread processing elements can access .
(3) – Heterogeneous AcceleratorsFPGA, Clearspeed etc.
(4) – ProcessesSpanning Multiple localities, Processes can overlap the nodes
of their physical domain with other processes(5) – PX Thread
Primary executing Abstraction, Ephemeral(6) – Parcels
Causes initiation of remote actions such as thread creation, suspension and termination. Asynchronous operation of the Parallel systems
(7) – Local Control ObjectsLight weight synchronization entities, eg. Simple mutexes,
semaphore support, Data flow, futures. Dataflow template based LCO can instantiate a function as a single thread.
28Courtesy of Chirag Dekate, LSU
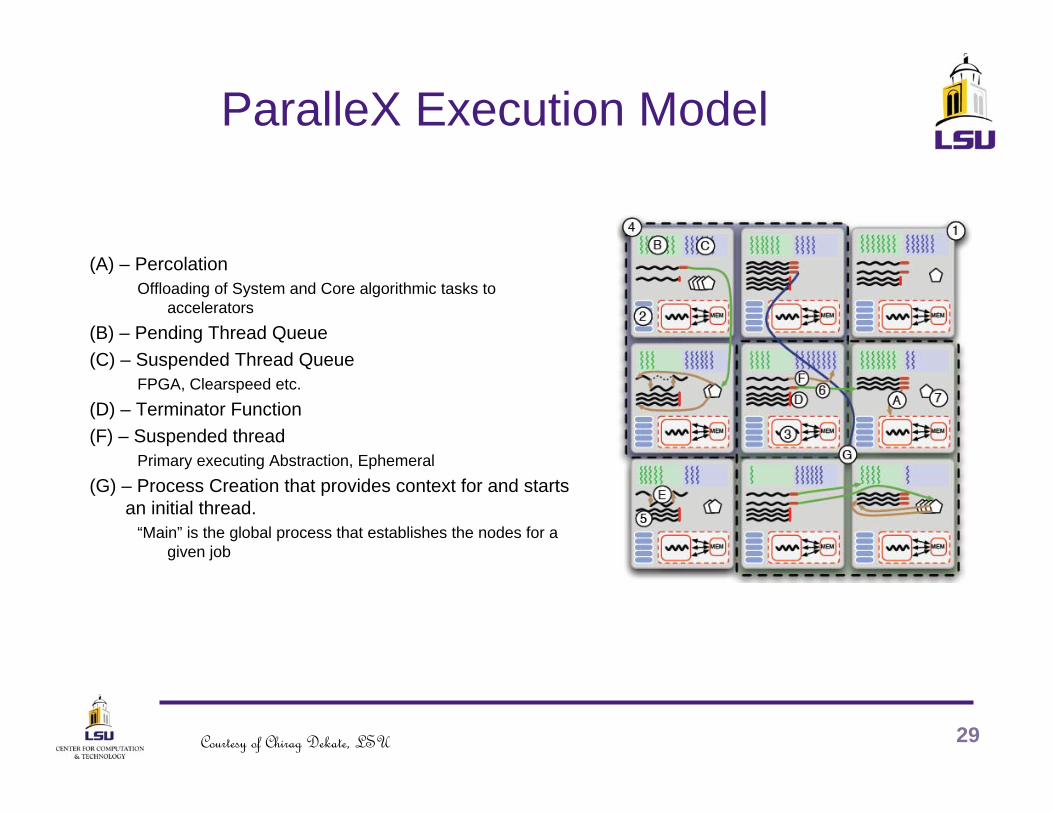
ParalleX Execution Model
(A) – PercolationOffloading of System and Core algorithmic tasks to
accelerators(B) – Pending Thread Queue(C) – Suspended Thread Queue
FPGA, Clearspeed etc. (D) – Terminator Function(F) – Suspended thread
Primary executing Abstraction, Ephemeral(G) – Process Creation that provides context for and starts
an initial thread. “Main” is the global process that establishes the nodes for a
given job
29Courtesy of Chirag Dekate, LSU
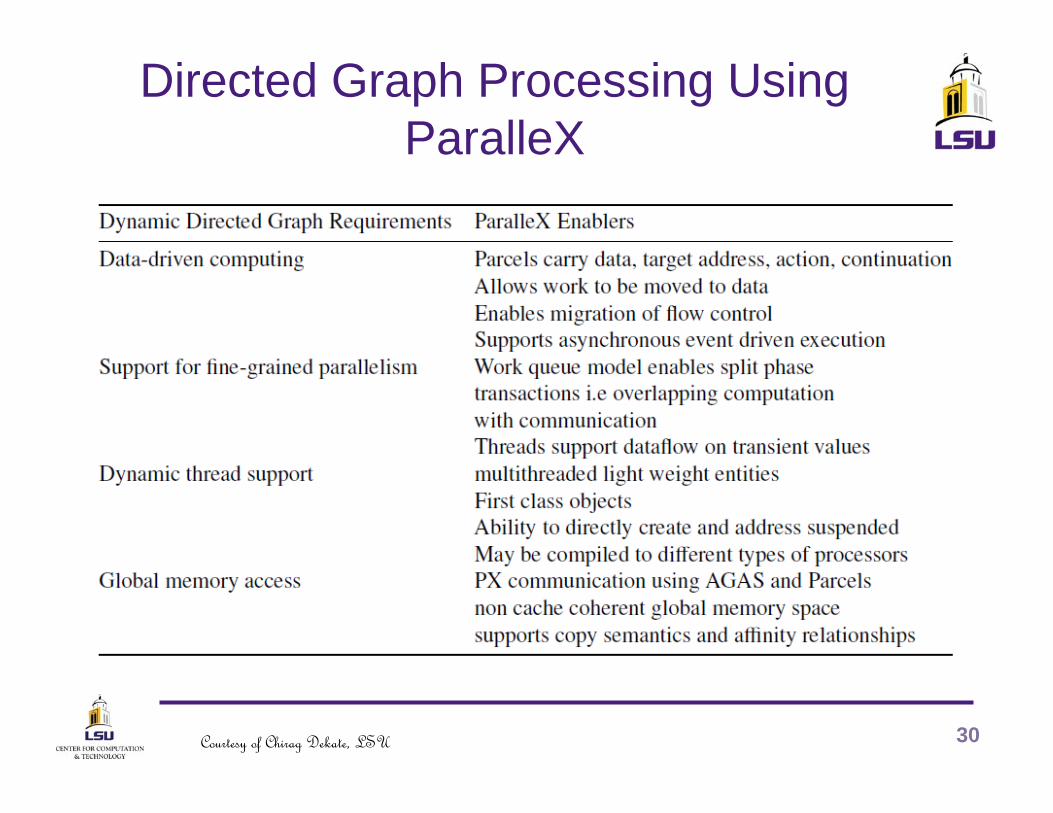
Directed Graph Processing Using ParalleX
30Courtesy of Chirag Dekate, LSU
31
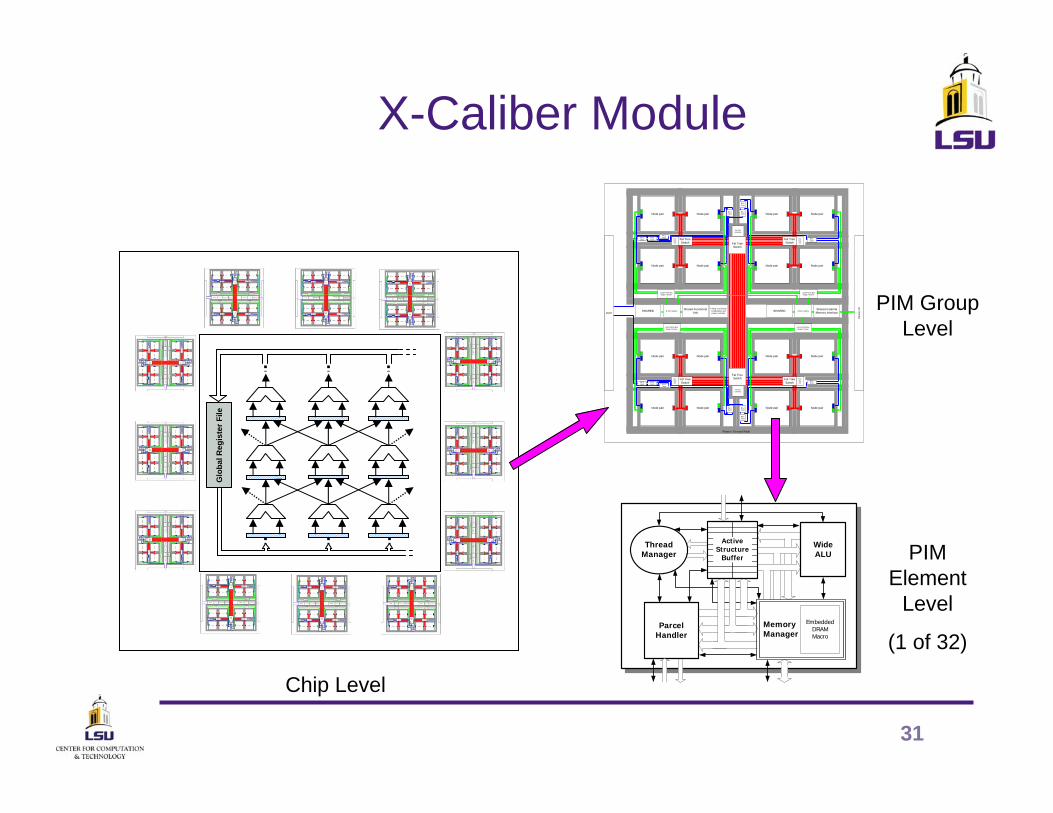
X-Caliber Module
Bit-1Jnctn
Bit-2Jnctn
Bit-1Jnctn
Bit-1Jnctn
Bit-1Jnctn
Fat-tree controller
Fat-tree ctrl
Power / Ground Rails
Fat-tree ctrlBit-3
JnctnBit-2Jnctn
Bit-1Jnctn
Bit-2Jnctn
Bit-1Jnctn
Bit-1Jnctn
Bit-1Jnctn
Fat-tree controller
Fat-tree ctrl
Fat-tree ctrl
Bit-3Jnctn
Bit-2Jnctn
SHARED
Local Parcel Bus Stage 2 Router
Shared Functional Unit
Local Parcel Bus Stage 2 Router
3 2x2 routers
Local Parcel Bus Stage 2 Router
SHARED
Local Parcel Bus Stage 2 Router
3 2x2 routersShared External Memory interface
Mem
ory
IO
PORT
Timing, and master configuration and power controller
Fat Tree Switch
Fat Tree SwitchFat Tree
Switch
Fat Tree Switch
Fat Tree Switch
Fat Tree Switch
Node pairNode pair
Node pairNode pair
Node pair Node pair
Node pair Node pair
Node pairNode pair
Node pairNode pair
Node pair Node pair
Node pair Node pair
Glo
bal R
egis
ter F
ile
MemoryManager
Embedded DRAM Macro
ParcelHandler
ActiveStructure
Buffer
ThreadManager
WideALU
Chip Level
PIM Group Level
PIM Element
Level
(1 of 32)
32
Conclusions
• Developing Exascale systems will be really tough – In any time frame, for any of the 3 classes
• Evolutionary Progression is at best 2020ish– With limited memory
• 4 key challenge areas – Power– Concurrency: – Memory Capacity– Resiliency
• New execution model required– Unify heterogeneous multicore systems– Programmability– Address challenges to heterogeneous multicore computing
• New architectures essential to address of overhead, latency, and starvation– Memory accelerators a critical form of multicore heterogeneity
• Responds to variation in temporal locality• Addresses the memory wall

33