sc6-doc19 - sprfmo.int · 6th meeting of the scientific committee puerto varas, chile, 9 - 14...
TRANSCRIPT
6th Meeting of the Scientific Committee
Puerto Varas, Chile, 9 - 14 September 2018
SC6-Doc19 Peru’s Annual Report, part I (SPRFMO Area)
IMARPE – PRODUCE
South Pacific Regional Fisheries Management Organisation 6th Meeting of the Scientific Committee
Puerto Varas, Chile, 09-14 September 2018
Peru National Report No 1
REPORT ON THE FISHING ACTIVITIES OF THE PERUVIAN FLEET IN THE AREA OF
APLICCATION OF THE CONVENTION ON THE CONSERVATION AND MANAGEMENT OF HIGH SEAS FISHERY RESOURCES IN THE
SOUTH PACIFIC OCEAN, PERIOD JANUARY 2017 – JUNE 2018
by
IMARPE - PRODUCE
2018
INSTITUTO DEL MAR DEL PERU IMARPE
MINISTERIO DE LA PRODUCCION PRODUCE

2
SUMMARY
None of the 98 Peruvian vessels registered and authorized to fish within the SPRFMO Convention area participated in the jack mackerel (Trachurus murphyi) fishery in the Convention area during 2017 or the first six months of 2018 and there are no jack mackerel fishing activities or jack mackerel catches to report for this period. There are no other fishing activities or commercial catches by Peruvian fleets to report for this period in the SPRFMO Convention area. Limited research activities on jumbo flying squid (Dosidicus gigas) have been conducted by IMARPE in part of the SPRFMO Convention area, beyond and adjacent to the Peruvian jurisdictional waters. These activities took place during three research surveys conducted in January-February and November-December 2015 and in November-December 2017. A summary of the observations made in the Convention area during these research surveys is provided together with comparable observations in nearby areas within Peruvian jurisdictional waters.
TYABLE OF CONTENTS
COVER PAGE ..................................................................................................... 1 SUMMARY .......................................................................................................... 2 TABLE OF CONTENTS ...................................................................................... 2 1. DESCRIPTION OF THE FISHERY................................................................. 3
1.1. Structure of the fleet and annual catches ................................................. 3 1.2. Jack mackerel catch entitlements and transfers ....................................... 4
2. CATCH, EFFORT AND CPUE IN THE JACK MACKEREL FISHERY .......... 4 2.1. Catch trends ............................................................................................. 4 2.2. Fishing effort trends ................................................................................. 5
3. BIOLOGICAL INFORMATION ....................................................................... 5 4. RESEARCH AND DATA COLLECTION ACTIVITIES .................................... 5
4.1. SPRFMO Onboard Observer Program..................................................... 6 4.2. Scientific research surveys (jumbo flying squid) ....................................... 6
CPUE by distance from the coast ........................................................... 11 Length frequency distributions by distance from the coast ..................... 15 Summary comments .............................................................................. 16
5. REFERENCES .............................................................................................. 17
2 Aug 2018 SC6-Doc19

3
1. DESCRIPTION OF THE FISHERY 1.1 Structure of the fleet and annual catches
The Peruvian fleet registered and authorized to participate in fishing activities within the area of application of the Convention on the Conservation and Management of High Seas Fishery Resources in the South Pacific Ocean (SPRFMO Convention) to June 2018 were 98 vessels, including 92 purse seiners with an average holding capacity of 500 m3, 1 trawler/freezer with a holding capacity of 2 400 m3, 4 multipurpose vessels (purse seine/trawler) with an average holding capacity of 1 805 m3 and 1 support tanker with a holding capacity of 10 339 m3 (Table 1). In accordance with the provisions in CMM 05-2016, during the period from January 2017 to June 2018, the SPRFMO was informed of the cancellation by Peru of the registration of the following 4 vessels with registration numbers as indicated within brackets: Germcs (CO-38384-PM), Liafjord (CO-38046-PM), Sheriff (CO-41532-PM) and Pacific Voyaguer (CO-41331-PM). Also, during the same period, the registration of the following 4 vessels with registration numbers as indicated within brackets were transmitted to the SPRFMO for inclusion in the Commission’s Record of Vessels: Alorca (CO-28749-MM), Eten Diez (HO-38087-PM), Huacho Cinco (IO-38109-PM) and Costa de Sol (CO-15311-PM). Table 1. Peruvian fleet registered and authorized to fish within the SPRFMO Convention area (as of 30 June 2018) Number of
vessels Types of fishing
vessels Total holding capacity (m3)
Average holding capacity (m3)
92 Purse seine 46 005 500 1 Trawl/freezer 2 400 2 400 4 Purse seine/trawl 7 221 1 805 1 Tanker 10 339 10 339
As of the writing of this report none of these vessels have set sail or have participated in fishing activities in the Convention area in 2017 and 2018, and, therefore, there are no jack mackerel directed fishing activities and no jack mackerel catches to report (Table 2). Figure 1 shows the annual catches of jack mackerel by the Peruvian fleet in the SPRFMO Convention area since 2009. A maximum annual catch of 40 516 t was obtained in 2010 and no catches (0 t) have been obtained between 2015 and 2018 (through June 2018). Table 2. Peruvian fleet that operated in the jack mackerel (T. murphyi) fishery in the SPRFMO area during the period January 2017 - June 2018
Year Number of vessels
Types of fishing gear
Total holding capacity (m3)
Average holding
capacity (m3)
Jack mackerel catch (t)
2017 0 n/a n/a n/a 0
2018* 0 n/a n/a n/a 0 * January-June only
2 Aug 2018 SC6-Doc19

4
1.2 Jack mackerel catch entitlements and transfers As per CMM 01-2017, the 2017 Peruvian catch entitlement for jack mackerel to be caught within the SPRFMO Convention area was 10 000 t. This whole 2017 catch entitlement was transferred in accordance with paragraph 9 of CMM 01-2017. A total catch entitlement of 8 000 t was transferred to Chile on 13 November 2017 (accepted on 16 November 2017) and on the same date the remaining 2 000 t were transferred to the European Union (accepted on 15 November 2017). As per CMM 01-2018, the Peruvian catch entitlement for 2018 is 11 684 t. As of 30 June 2018, no transfer has been made against this 2018 Peruvian catch entitlement. 2 CATCH, EFFORT AND CPUE IN THE JACK MACKEREL FISHERY 2.1 Catch trends Figure 2 shows the monthly trend in catches of jack mackerel by the Peruvian fleet in the SPRFMO Convention area between 2012 and 2014. As noted above, no catches have been made in 2015, 2016, 2017 and the first six months of 2018.
Figure 2. Jack mackerel (Trachurus murphyi) monthly catches by the Peruvian fleet in the SPRFMO Convention area, 2012 – 2018 (until June 2018)
0.0
5.0
10.0
15.0
20.0
25.0
30.0
35.0
40.0
45.0
2009 2010 2011 2012 2013 2014 2015 2016 2017 2018
Catch
('000
t)
YEARS
Figure 1. Annual Peruvian catches of jack mackerel (Trachurus murphyi) in the SPRFMO Convention area, years 2009 to 2018 (until June 2018)
0
200
400
600
800
1000
1200
1400
1600
jan
-12
ap
r
jul
oct
jan
-13
ap
r
jul
oct
jan
-14
ap
r
jul
oct
jan
-15
ap
r
jul
oct
jan
-16
ap
r
jul
oct
jan
-17
ap
r
jul
oct
ton
ne
s
2012 2013 2014 2015 2016 2017
0
200
400
600
800
1000
1200
1400
1600
jan
-12
ap
r
jul
oct
jan
-13
ap
r
jul
oct
jan
-14
ap
r
jul
oct
jan
-15
ap
r
jul
oct
jan
-16
ap
r
jul
oct
jan
-17
ap
r
jul
oct
ton
ne
s
2012 2013 2014 2015 2016 20172018
8
2 Aug 2018 SC6-Doc19

5
2.2 Fishing effort trends
Figure 3 shows the trend of the fishing effort directed to jack mackerel by the Peruvian fleet in the SPRFMO Convention area since 2012. The number of vessels and holding capacity has been highly variable, with 6 vessels in 2012, 1 vessel in 2013, 5 vessels in 2014 and 0 vessels (no fishing effort exerted) in 2015, 2016, 2017 and the first six months 2018. Therefore, there are no catch per unit of effort (CPUE) estimates available for the last three and a half years.
Figure 3. Total holding capacity and number of vessels in the Peruvian fleet that operated in the jack mackerel (T. murphyi) fishery in the SPRFMO area, by year 2012-2018 (until June 2018) 3 BIOLOGICAL INFORMATION
No fishing activities by the Peruvian fleet in beyond the 200 mile-limit of Peruvian jurisdictional waters have been reported during 2017 and the first half of 2018 covered in this report. Therefore, no biological information from fishing in the Convention area is available for this period. Some biological information gathered during scientific research surveys in provided in the following section. 4 RESEARCH AND DATA COLLECTION ACTIVITIES The Peruvian research and data collection activities in the SPRFMO Convention area include those undertaken during regular fishing operations in the Convention area and those undertaken during scientific research surveys (independently from regular fishing operations). Research and data collection activities undertaken during regular fishing operations are carried out onboard the fishing vessels participating in commercial fishing operations in the Convention area as part of the SPRFMO Onboard Observer Program, which aims at monitoring the fishing fleet and obtaining biological information from their catches and areas of operation. Scientific research surveys are carried out by scientific research vessels which, eventually, can also be supported by the temporary use of fishing vessels devoted
2 Aug 2018 SC6-Doc19

6
purely to research purposes. Three such scientific research surveys have been carried out by the Peruvian Institute of Marine Research (IMARPE, for Instituto del Mar del Peru) with its own scientific research vessels in 2015 and 2017 with a main focus on jumbo flying squid (Dosidicus gigas). Further details are given below.
4.1 SPRFMO Onboard Observer Program
Peruvian fishing fleets have not been operating in the Convention area since 2015 and, therefore, the Peruvian SPRFMO Onboard Observer Program is on holding until regular fishing activities can resume. However, it is worth noting that while operational, this programme was set to achieve almost full coverage of the Peruvian fishing fleet fishing for jack mackerel in the SPRFMO Convention area and it is expected that it will continue to do so when it resumes. The monitoring of the jack mackerel fishing fleet was set to provide reliable information on fishing effort, catch volumes, species composition of the catches, fishing areas, sea surface temperatures in the fishing areas and horizontal and vertical distribution of the target species. This was complemented with an onboard biological sampling programme aimed at obtaining biological information of the species caught, including body length, total weight, gonad weight and sexual maturity, and to also obtain samples of ovaries, otoliths and stomachs to undertake further studies of spawning activity, growth and feeding. This has been done using a stratified two-stage sampling, where 10 individuals were taken for each size range. The program also provides for the observation and identification of seabirds based on prior training of observers and the use of a species identification guide. These observations are carried out on board, mainly during fishing trawls, and they are recorded in the form of seabird interactions with the jack mackerel´s fishery in the high seas. 4.2 Scientific research surveys (jumbo flying squid) Limited research activities on jumbo flying squid (D. gigas) have been conducted in the recent past by IMARPE in part of the SPRFMO Convention area in a relatively small area adjacent to the southern part of the Peruvian jurisdictional waters. These activities took place during three cruises or scientific research surveys, that were conducted two in 2015 and one in 2017. Cruise 1501-02 was conducted in January-February 2015, Cruise 1511-12 was conducted in November-December 2015 and Cruise 1711-12 was conducted in November-December 2017. All three cruises or scientific research surveys were directed to investigate the distribution, abundance, habitat, species interactions and other biological aspects of jumbo flying squid. Samplings and observations were done along pre-established tracks with two research vessels using multifrequency scientific eco-sounders EK60 for echo-acoustic observations, combined with a series of oceanographic, biological and fishing research stations. Commercial type manual jiggers and pelagic trawl nets with fine codend (13 mm, to catch juveniles) were used at the fishing research stations. The northern and southern parts of the Peruvian jurisdictional waters were surveyed with a main focus on assessing the situation in the fishing areas more frequently visited
2 Aug 2018 SC6-Doc19

7
by the artisanal fleet fishing for jumbo flying squid in Peru. During these three cruises the survey areas in the south were extended beyond the 200 nm limit of national jurisdictional waters, into the SPRFMO Convention area, to complement the observations made inshore and assess the situation in the nearby areas more frequently visited by distant-water fleets fishing for jumbo flying squid in the high seas. Cruise 1501-02 took place from 20 January throughout 9 February 2015 with two research vessels, RV Jose Olaya Balandra covered the northern part and RV Humboldt covered the southern part (IMARPE 2015). During this Cruise (Cr.) the survey area in the south was extended beyond the 200 nm limit of national jurisdictional waters, into the SPRFMO Convention area, into an area between 201 and 270 nm from the coast within latitudes 16° and 19°S (Figure 4). A total of 52 fishing research operations with manual jiggers were made in the southern area during this cruise, of which 36 operations were made within 200 nm from the coast and 16 beyond. Also, a total of 25 fishing research operations were made with pelagic trawl, of which 19 were made within 200 nm and 6 beyond the 200 nm limit. Cruise 1511-12 took place from 14 November through 8 December 2015 with only one research vessel, the RV Jose Olaya Balandra, which covered the northern and southern parts (IMARPE 2015a). During this Cruise, the survey area in the south was also extended into an area between 201 and 270 nm from the coast within latitudes 16° and 18°S (Figure 5). A total of 16 fishing research operations with manual jiggers
Figure 4.- Cruise 1501-02, jumbo flying squid survey track, 20 January – 9 February 2015
Figure 5.- Cruise 1511-12, jumbo flying squid survey track, 14 November – 8 December 2015
2 Aug 2018 SC6-Doc19

8
were made in the southern area during this cruise, of which 12 operations were made within 200 nm and 4 beyond. Also, a total of 12 fishing research operations were made with pelagic trawl, of which 7 within 200 nm and 5 beyond. Cruise 1711-12 took place from 21 November through 12 December 2017 with two research vessels, RV Jose Olaya Balandra covered the northern part and RV Humboldt covered the southern part (IMARPE 2018). During this Cruise, the survey area in the south was also extended into an area between 201 and 360 nm from the coast within latitudes 16° and 20°S (Figure 6). A total of 67 fishing research operations with manual jiggers were made in the southern area during this cruise, of which 48 operations were made within 200 nm and 19 beyond. Also, a total of 21 fishing research operations were made with pelagic trawl, of which 15 were made within 200 nm and 6 beyond.
Figure 6.- Cruise 1711-12, jumbo flying squid survey track with indication of the fishing research operations (left panel) and oceanographic and biological stations (right panel), 21 November - 12 December 2017
2 Aug 2018 SC6-Doc19
9
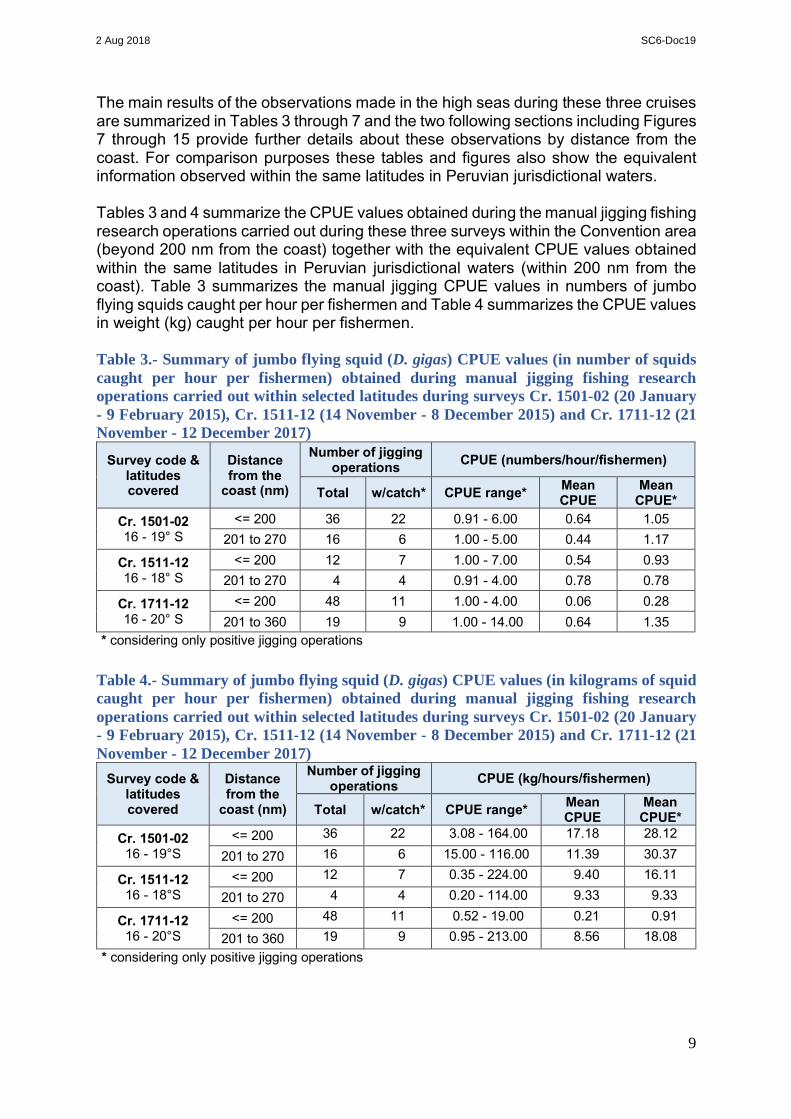
The main results of the observations made in the high seas during these three cruises are summarized in Tables 3 through 7 and the two following sections including Figures 7 through 15 provide further details about these observations by distance from the coast. For comparison purposes these tables and figures also show the equivalent information observed within the same latitudes in Peruvian jurisdictional waters. Tables 3 and 4 summarize the CPUE values obtained during the manual jigging fishing research operations carried out during these three surveys within the Convention area (beyond 200 nm from the coast) together with the equivalent CPUE values obtained within the same latitudes in Peruvian jurisdictional waters (within 200 nm from the coast). Table 3 summarizes the manual jigging CPUE values in numbers of jumbo flying squids caught per hour per fishermen and Table 4 summarizes the CPUE values in weight (kg) caught per hour per fishermen. Table 3.- Summary of jumbo flying squid (D. gigas) CPUE values (in number of squids caught per hour per fishermen) obtained during manual jigging fishing research operations carried out within selected latitudes during surveys Cr. 1501-02 (20 January - 9 February 2015), Cr. 1511-12 (14 November - 8 December 2015) and Cr. 1711-12 (21 November - 12 December 2017)
Survey code & latitudes covered
Distance from the
coast (nm)
Number of jigging operations CPUE (numbers/hour/fishermen)
Total w/catch* CPUE range* Mean CPUE
Mean CPUE*
Cr. 1501-02 16 - 19° S
<= 200 36 22 0.91 - 6.00 0.64 1.05 201 to 270 16 6 1.00 - 5.00 0.44 1.17
Cr. 1511-12 16 - 18° S
<= 200 12 7 1.00 - 7.00 0.54 0.93 201 to 270 4 4 0.91 - 4.00 0.78 0.78
Cr. 1711-12 16 - 20° S
<= 200 48 11 1.00 - 4.00 0.06 0.28 201 to 360 19 9 1.00 - 14.00 0.64 1.35
* considering only positive jigging operations Table 4.- Summary of jumbo flying squid (D. gigas) CPUE values (in kilograms of squid caught per hour per fishermen) obtained during manual jigging fishing research operations carried out within selected latitudes during surveys Cr. 1501-02 (20 January - 9 February 2015), Cr. 1511-12 (14 November - 8 December 2015) and Cr. 1711-12 (21 November - 12 December 2017)
Survey code & latitudes covered
Distance from the
coast (nm)
Number of jigging operations CPUE (kg/hours/fishermen)
Total w/catch* CPUE range* Mean CPUE
Mean CPUE*
Cr. 1501-02 16 - 19°S
<= 200 36 22 3.08 - 164.00 17.18 28.12
201 to 270 16 6 15.00 - 116.00 11.39 30.37
Cr. 1511-12 16 - 18°S
<= 200 12 7 0.35 - 224.00 9.40 16.11
201 to 270 4 4 0.20 - 114.00 9.33 9.33
Cr. 1711-12 16 - 20°S
<= 200 48 11 0.52 - 19.00 0.21 0.91 201 to 360 19 9 0.95 - 213.00 8.56 18.08
* considering only positive jigging operations
2 Aug 2018 SC6-Doc19
10
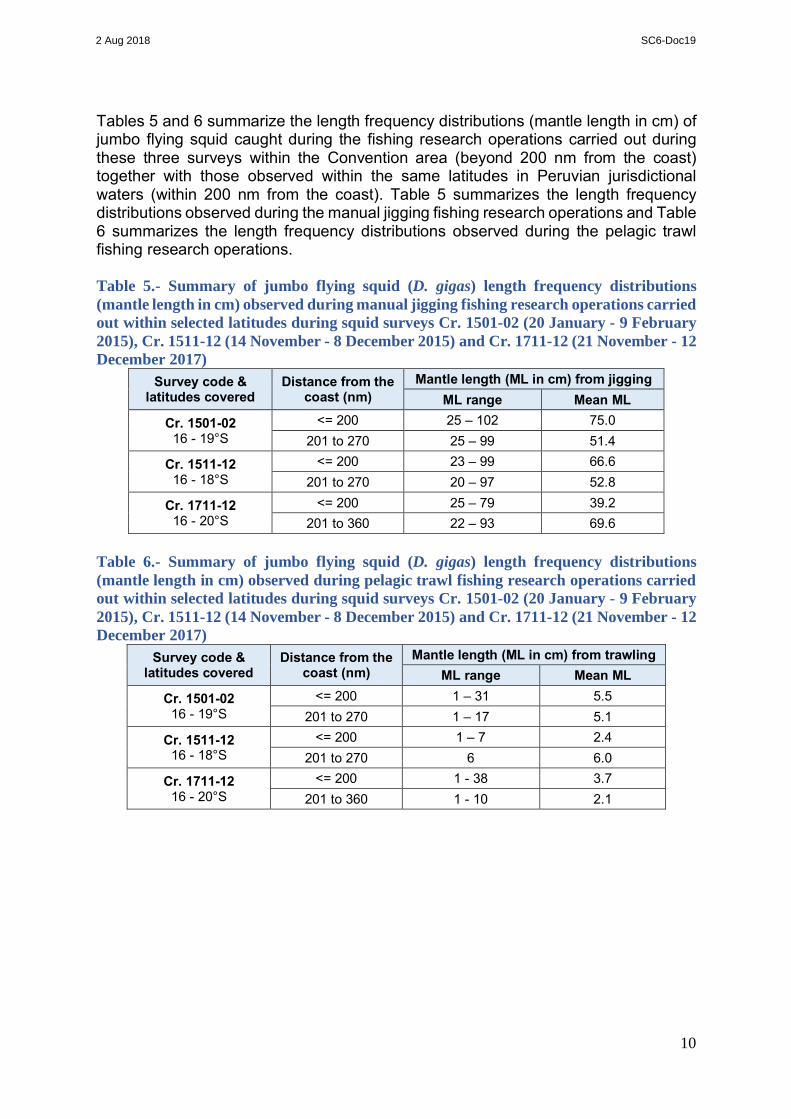
Tables 5 and 6 summarize the length frequency distributions (mantle length in cm) of jumbo flying squid caught during the fishing research operations carried out during these three surveys within the Convention area (beyond 200 nm from the coast) together with those observed within the same latitudes in Peruvian jurisdictional waters (within 200 nm from the coast). Table 5 summarizes the length frequency distributions observed during the manual jigging fishing research operations and Table 6 summarizes the length frequency distributions observed during the pelagic trawl fishing research operations. Table 5.- Summary of jumbo flying squid (D. gigas) length frequency distributions (mantle length in cm) observed during manual jigging fishing research operations carried out within selected latitudes during squid surveys Cr. 1501-02 (20 January - 9 February 2015), Cr. 1511-12 (14 November - 8 December 2015) and Cr. 1711-12 (21 November - 12 December 2017)
Survey code & latitudes covered
Distance from the coast (nm)
Mantle length (ML in cm) from jigging ML range Mean ML
Cr. 1501-02 16 - 19°S
<= 200 25 – 102 75.0 201 to 270 25 – 99 51.4
Cr. 1511-12 16 - 18°S
<= 200 23 – 99 66.6 201 to 270 20 – 97 52.8
Cr. 1711-12 16 - 20°S
<= 200 25 – 79 39.2 201 to 360 22 – 93 69.6
Table 6.- Summary of jumbo flying squid (D. gigas) length frequency distributions (mantle length in cm) observed during pelagic trawl fishing research operations carried out within selected latitudes during squid surveys Cr. 1501-02 (20 January - 9 February 2015), Cr. 1511-12 (14 November - 8 December 2015) and Cr. 1711-12 (21 November - 12 December 2017)
Survey code & latitudes covered
Distance from the coast (nm)
Mantle length (ML in cm) from trawling ML range Mean ML
Cr. 1501-02 16 - 19°S
<= 200 1 – 31 5.5 201 to 270 1 – 17 5.1
Cr. 1511-12 16 - 18°S
<= 200 1 – 7 2.4 201 to 270 6 6.0
Cr. 1711-12 16 - 20°S
<= 200 1 - 38 3.7 201 to 360 1 - 10 2.1
2 Aug 2018 SC6-Doc19

11
The number of fishing research operations with pelagic trawl carried out during these three surveys both within the Convention area (beyond 200 nm from the coast) as well as within the same latitudes in Peruvian jurisdictional waters (within 200 nm from the coast), with an indication of the positive operations and total and jumbo flying squid is provided in Table 7. Table 7.- Number of pelagic trawl fishing research operations carried out within selected latitudes during squid surveys Cr. 1501-02 (20 January - 9 February 2015), Cr. 1511-12 (14 November - 8 December 2015) and Cr. 1711-12 (21 November - 12 December 2017) and catch obtained within and beyond the 200 nm from the coast Survey code & latitudes
covered Distance from the coast (nm)
Number of pelagic trawl fishing research operations Total catch
(kg) Jumbo
flying squid catch (kg) Total Positive
Cr. 1501-02 16 - 19°S
<= 200 19 18 282.32 44.73 201 to 270 6 6 87.07 15.38
Cr. 1511-12 16 - 18°S
<= 200 7 6 311.39 0.41 201 to 270 5 1 22.47 0.02
Cr. 1711-12 16 - 20°S
<= 200 15 6 1 366.55 1.70 201 to 360 6 4 38.98 0.24
CPUE by distance from the coast More detailed information on the CPUE values (in numbers and in weight) by distance from the coast obtained during the manual jigging fishing research operations carried out during these three surveys is provided in Figures 7 though 9 below. Figure 7 shows the CPUE values for latitudes 16 to 19°S from Cruise 1501-02, Figure 8 shows the CPUE values for latitudes 16 to 18°S from Cruise 1511-12 and Figure 9 shows the CPUE values for latitudes 16 to 20°S from Cruise 1711-12.
2 Aug 2018 SC6-Doc19

12
Figure 7.- CPUEs of jumbo flying squid (D. gigas) by distance from the coast obtained during the manual jigging fishing research operations carried out between latitudes 16 and 19°S during Cruise 1501-02 in January-February 2015, in number of squids caught per hour per fishermen (top panel) and in kilos of squid caught per hour per fishermen (bottom panel)
2 Aug 2018 SC6-Doc19

13
Figure 8.- CPUEs of jumbo flying squid (D. gigas) by distance from the coast obtained during the manual jigging fishing research operations carried out between latitudes 16 and 18°S during Cruise 1511-12 in November- December 2015, in number of squids caught per hour per fishermen (top panel) and in kilograms of squid caught per hour per fishermen (bottom panel)
2 Aug 2018 SC6-Doc19

14
Figure 9.- CPUEs of jumbo flying squid (D. gigas) by distance from the coast obtained during the manual jigging fishing research operations carried out between latitudes 16 and 20°S during Cruise 1711-12 in November- December 2017, in number of squids caught per hour per fishermen (top panel) and in kilograms of squid caught per hour per fishermen (bottom panel)
2 Aug 2018 SC6-Doc19
15
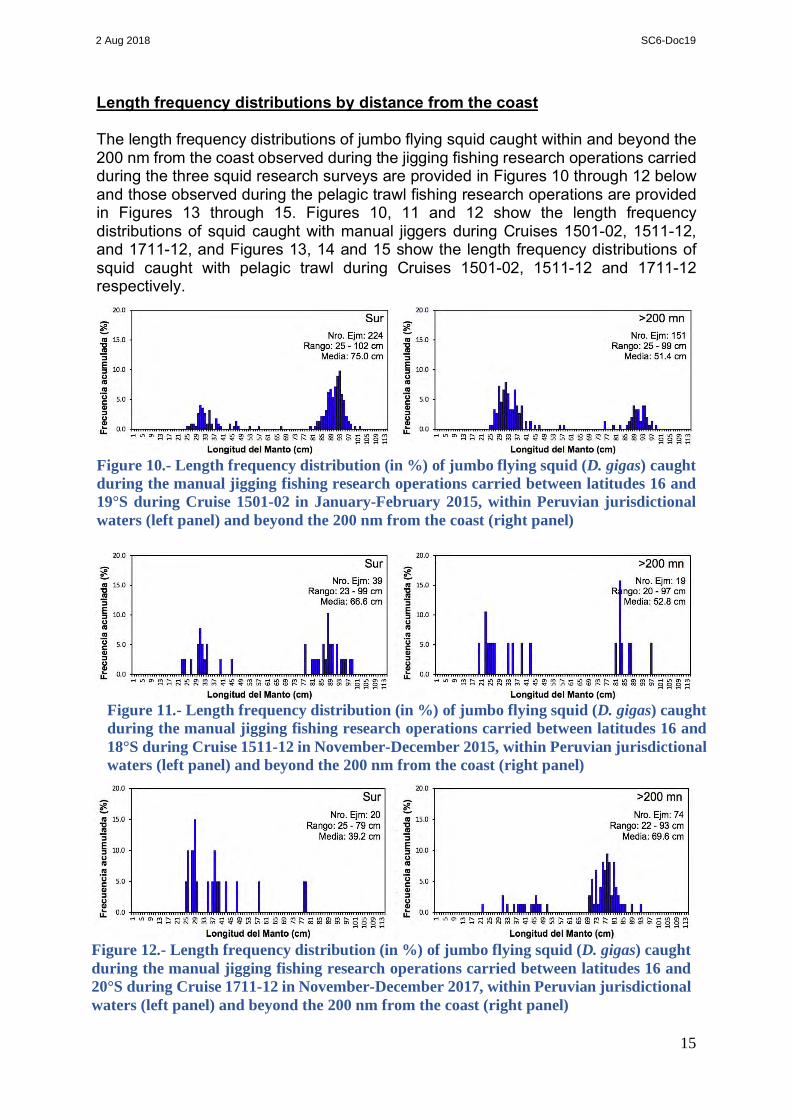
Length frequency distributions by distance from the coast The length frequency distributions of jumbo flying squid caught within and beyond the 200 nm from the coast observed during the jigging fishing research operations carried during the three squid research surveys are provided in Figures 10 through 12 below and those observed during the pelagic trawl fishing research operations are provided in Figures 13 through 15. Figures 10, 11 and 12 show the length frequency distributions of squid caught with manual jiggers during Cruises 1501-02, 1511-12, and 1711-12, and Figures 13, 14 and 15 show the length frequency distributions of squid caught with pelagic trawl during Cruises 1501-02, 1511-12 and 1711-12 respectively.
Figure 10.- Length frequency distribution (in %) of jumbo flying squid (D. gigas) caught during the manual jigging fishing research operations carried between latitudes 16 and 19°S during Cruise 1501-02 in January-February 2015, within Peruvian jurisdictional waters (left panel) and beyond the 200 nm from the coast (right panel)
Figure 11.- Length frequency distribution (in %) of jumbo flying squid (D. gigas) caught during the manual jigging fishing research operations carried between latitudes 16 and 18°S during Cruise 1511-12 in November-December 2015, within Peruvian jurisdictional waters (left panel) and beyond the 200 nm from the coast (right panel)
Figure 12.- Length frequency distribution (in %) of jumbo flying squid (D. gigas) caught during the manual jigging fishing research operations carried between latitudes 16 and 20°S during Cruise 1711-12 in November-December 2017, within Peruvian jurisdictional waters (left panel) and beyond the 200 nm from the coast (right panel)
2 Aug 2018 SC6-Doc19

16
Summary comments As shown in Figures 4-6 and Tables 3 and 4 above, the fishing research operations in the southern part were more numerous and more evenly distributed during Cr. 1501-02 and Cr. 1711-12 than during Cr. 1511-12. This may partially contribute to a reduced confidence in the mean CPUE values obtained during Cr. 1511-12 and may also explain the reduced number of samples, and the scattered data in the length frequency
Figure 13.- Length frequency distribution (in %) of jumbo flying squid (D. gigas) caught during the pelagic trawl fishing research operations carried between latitudes 16 and 19°S during Cruise 1501-02 in January-February 2015, within Peruvian jurisdictional waters (left panel) and beyond the 200 nm from the coast (right panel)
Figure 14.- Length frequency distribution (in %) of jumbo flying squid (D. gigas) caught during the pelagic trawl fishing research operations carried between latitudes 16 and 18°S during Cruise 1511-12 in November-December 2015, within Peruvian jurisdictional waters (left panel) and beyond the 200 nm from the coast (right panel)
Figure 15.- Length frequency distribution (in %) of jumbo flying squid (D. gigas) caught during the pelagic trawl fishing research operations carried between latitudes 16 and 20°S during Cruise 1711-12 in November-December 2017, within Peruvian jurisdictional waters (left panel) and beyond the 200 nm from the coast (right panel)
2 Aug 2018 SC6-Doc19

17
distributions from this cruise. Nevertheless, it is still worth noting that in January-February 2015 (Cr. 1501-02), the jigging mean CPUE values were higher both in numbers and in weight, within the Peruvian jurisdictional waters than in the adjacent high sea, even though the proportions and CPUE values of positive jigging operations were fairly even. The CPUE values were not much different in November-December 2015 (Cr. 1511-12), but in November-December 2017 (Cr. 1711-12) there was a significant drop in the CPUE and in the proportion of positive operations within the 200 nm, and a slight decline in the CPUE, both in weight and proportion of positive operations beyond the 200 nm limit (Tables 3 and 4 and Figures 7 through 9). Also, it is noted that in the length frequency distributions from jigging during Cr. 1501-02 (Figure 10) there are two clear modal groups, one with mode in 33 and the other in 93 cm ML, and the modal group in 93 cm ML predominates within the 200 nm while the smaller modal group in 33 cm ML predominates beyond the 200 nm. Two modal groups also appear in Cr. 1511-12 and Cr. 1711-12 (Figures 11 and 12) but the number squids sampled in these last two surveys are too small to be conclusive. Nevertheless, contrary to what was observed during Cr. 1501-02, during Cr. 1711-12, the smaller modal group seems to predominate within the 200 nm, while the larger modal group seems to predominate beyond the 200 nm. The presence of small and juvenile squid caught with the pelagic trawl also seems to have changed from one cruise to the next (Figures 13-15). They appeared to be more abundant and showed up in a wider range of sizes in January-February 2015 (Cr. 1501-02), and less abundant and in only smaller sizes both within and beyond the 200 nm limit in November-December 2015 (Cr. 1511-12) and November-December 2017 (Cr. 1711-12). The above changes in the length frequency distributions and in particular the clear CPUE decline in 2017 was and still is a matter of concern for the Peruvian jumbo squid local fishery and should probably also be for the high seas fishery. 5. REFERENCES IMARPE. 2015. Crucero de investigación del calamar gigante, Cr. 1501-02, 20 enero
al 09 febrero de 2015. BIC José Olaya Balandra - Zona Norte, BIC Humboldt-Zona Sur. Informe Ejecutivo, IMARPE, Callao: 54 p. (http://www.imarpe.pe/imarpe/archivos/informes/CruceroInvestigacionCalamar
Gigante.pdf)
IMARPE. 2015a (Unpublished). Informe Ejecutivo “Crucero de Investigación del Calamar gigante Cr. 1511-12” Memorándum N° AFIIMM-412-2015, con fecha 30.12.2015 del Área Funcional de Investigaciones de Invertebrados Marinos y Macroalgas.
IMARPE. 2018. Informe Ejecutivo del Crucero de investigación del calamar gigante,
Cr. 1711-12, 21 noviembre al 12 de diciembre de 2017, BIC “José Olaya Balandra”- Zona Norte, BIC “Humboldt” – Zona Sur. IMARPE, Callao, enero 2018: 40p (http://www.imarpe.gob.pe/imarpe/archivos/informes/informe_calmar_gigante_nov_dic_2017.pdf )
2 Aug 2018 SC6-Doc19