scada systems – control, supervision and data ac ...anale-ing.uem.ro/2015/238.pdf · scada...
TRANSCRIPT

378
Cosmin Ursoniu, Damaschin Pepa
Scada Systems – Control, Supervision and Data Ac-quisition for the Power Plants Settled on a Stream (Part 1)
Scada (supervisory control and data acquisition) is a complex system that supervises and control an industrial process and performs several functions. A human machine interface will also be presented and how the process in a power plant is controlled and supervised through it by the operator. The main screen will be described (which is a global view of the hydro unit) and what the operator can see and what he can press to control the power plants process also a few more screens will be presented for auxiliary installations and it will be described what the operator can see and what he can do to control the installation.
Keywords: Scada Systems, Power Plants, energy
1. Introduction
As discussed in a hydropower facility comprises the main storage reservoir,
with a large capacity of water storage, which collects the running and rain waters flowing waters on the slopes of the mountains. It supplies the main hydro power
plant built in the area with a configuration that provides a maximum head and
minimal energy losses on the water conduit. Downstream of this main power plant is built a cascade of hydro power plants of low output that uses the water flow of
the downstream plant to which is added the water of the secondary catchments between the two power plants. These plants, called run-of-the-river power plants,
have a reservoir with low storage capacity, a gross head that is usually small,
where the delivered output depends on the flow received from the downstream power plant.
In this case, it is clear that there is a need of implementing a SCADA system to correlate operation the assembly of hydro power plants built in cascade on the
streamline, in order to maximize the use of the hydraulic energy available at any time.
ANALELE UNIVERSIT ĂŢII
“EFTIMIE MURGU” RE ŞIŢA
ANUL XXII, NR. 2, 2015, ISSN 1453 - 7397

379
Such a system must be organized in a structure hierarchical distributed on three functional levels, namely: [ICFelix]
- Level 1 - includes the SCADA systems in each power plant separately, that monitors the control, protection and remote control systems at each group
separately.
- Level 2 - includes the SCADA systems in the control room of the load dispatcher from the run-of-the-river power plants.
- Level 3 - includes the SCADA systems in the control room of the load dispatcher from the power area (off-Site).
Usually, Level 2 and Level 3 form an integrated structure of computer equipment grouped in the same building.
Hereinafter follows a presentation of the structure and functions of a SCADA
system for an assembly of run-of-the-river power plants. The charts and screens in this application had as source the "System of control, supervision and data acquisi-
tion (SCADA) of run-of-the-river power plants built on middle Olt" conducted by ICE Felix - Factory of computers S.A. Bucharest (documentary material used with
the consent of the company ICE-Felix).[1]
2. SCADA System in a hydro power plant
The structure of a process computer system at the level of the hydro power
plant is shown in Fig. 1 and includes the operator console, the SCADA server and
the server of historical data running on the same computer. The schematic diagram of the process computer system at level of the hydro
power plant is shown in Fig. 1 (processed after the SCADA system of a hydro power plant on the river Middle Olt - produced by ICE Felix SA Bucharest) and in-
cludes the operator console, the SCADA server and the server of historical data
running on the same computer. The process computer system is coupled to the existing automation computer
implemented with numerical computing equipment via the Ethernet network and provide a SCADA system at the level of the hydro power plant. The latter provides
data through an OPC server to which the SCADA server is connected as a client [2] The system also ensures incorporation of the thermal protection plants, of the
smart electricity meter in accordance with IEC1107 Standard and other transducers
and/or intelligent electronic modules (IED) installed at the level of a HPP, and which are integrated into the management structure by means of serial links RS
422/485 standard [8], [9].

380
Figure 1. The structure of a process computer system at the level of the hydro
power plant
The SCADA system at the level on the hydro power plant includes following
modules:
* Operator console. The operator console/ SCADA serve /the server of historical data are implemented with a common computer in IBM standard, with
two monitors VGA with liquid crystals, which ensure immunity at display against
electromagnetic field in hydro power plants. The system is connected with the computer that provides automatic regulation functions of the hydropower unit pa-
rameters via a local Ethernet networks. The protocol used is TCP/IP. The operating system used is Windows
2000, Windows XP or even Windows NT. For application development, SCADA software packages are used (eg. iFIX Standard) and the drivers used will be OPC
type. The operator console communicates with the SCADA system implemented at
the dispatcher and to whom it provides data. The SCADA system used allows the user to develop his own application
screens, to define variables in the database, to issue reports, to define and to modify the access rights to information, to memorize the history of certain values.
In principle, the operator console is a SCADA system centre and can perform spe-
cific functions. * Automation computer. Provides the functions for automatic adjust-
ment of the hydropower groups and has the following general characteristics:

381
- The automation computer has an open structure and allows both dis-tributed processing as well as centralization of data;
- Has the ability to process the volume of data required for the application of command and control to the hydropower groups;
- Has a modular structure that allows future expansion;
- The robust operation guarantees that failure of a peripheral module does not block operation of the system function and all peripheral modules are
connected to two common process buses; - Allows replacing of modules by removing them during operation;
- Ensure connecting of I/O points from the process to the cabinet; - Has the capability of system self-test during operation;
- The software of the application is resident both on magnetic base and
on FLASH disk; - The real-time operating system belonging to UNIX (QNX) family includes
the protocol TCP/IP and enables distributed processing of the application for a group of computers connected in a local Ethernet network;
- Provides communication with the modules distributed by I/O with differ-
ent protocols: IEC 1107 for smart meters, MODBUS (Serial and TCP/IP); - Luminescent indicators (LEDs) at the level of each module, indicating
the activity of the module, state of inputs/outputs and alarm status (depending on the module type).
The system must be tested for electromagnetic compatibility, radio distur-bances, immunity for the equipment installed in the power substations - industrial
environments, tests for disturbances at high frequency pulses, mechanical shocks
and high frequency shocks.[10] * The automation computer consists of a central unit and a number of
intelligent peripheral modules which have their own processing capability. the pe-ripheral modules provide local processing of information. The system allows both
centralized configuration and data collection in distributed mode. The automation
computer allows managing of the program for remote control such as: application start-up/shut-down, downloading of a new version for the application, to perform
commands at the level of the operating system, etc. The automation computer enables integration of smart devices for I/O, such as electronic meters, thermal
protections for the hydropower unit, etc. It also accepts standard clock synchroni-
zation for real-time by GPS.
3. Control bar of the application
It is shown all the time at the top of the screen and displays general informa-
tion about the application (current user name, date and time, name of the screen
opened at a time) and allows control of application (to select the current screen, to change the current user and to close the application).

382
Figure 2. The control bar of the application at a SCADA system from a hydro
power plant
From the selection box "DISPLAY" select the screen that is desired to be
viewed. The "Login" button allows you to change the current user. This is done by pressing the button, which leads to opening a dialog box in which click the button
"Logout" for the current user to leave the application, then the new user will enter his name and password, then click the button "Login". The "Alarms" button selects
the window with alarms. The "Exit" button closes the application. The application
will close only if the current user is the administrator of the application.[1]
4. Synoptic display of HPP
The synoptic display of HPP shows to the operator, in a condensed form, the
main operational sizes of the hydro power plant. These are: the real and reactive powers generated by the groups, status of circuit breakers, network frequency,
sizes related to the water level in the dam [10].
5. Alarm screen
Includes a table of the latest alarms in the system ordered by date and time
in descending order. Each line in the table represents an alarm and includes the date and time it occurred, the message of the alarm and its type. The background
color of each alarm indicates if the alarm is confirmed or not, or if it is canceled or
not, according to the legend at the bottom of the screen. If you click the plus sign (+) "additional information next to an alarm" will appear also other information
related to the alarm: if it is canceled - the time at which was canceled, if confirmed - the time and name of the person that confirmed the alarm. At the top of the
window appear some elements of control by which can be filtered the alarms that
appear in the table. You can select only unconfirmed alarms, not annulled, or those of the type (TROUBLE, PREVENTION or INFO). It is possible to filter the
alarms from a certain time, or those confirmed by a certain person. To confirm an alarm two buttons are used for confirmation. Name of the person making the con-
firmation, the date and time at which confirmation is done will appear in the ap-propriate columns of the table [10].

383
Figure 3. Synoptic display of HPP
6. Screen for report printing
This screen displays and print the reports drawn-up by operators. In the
checkbox "Report" select the desired report, and in the checkbox "Data" choose
the day for which the report will be displayed. The button "EDIT" allows entering in the window "Edit Reports". Printing of the reports is performed by pressing the
print button in the top left corner of the report. You can select also the zoom level of the report from the checkbox on the top of the report.
384
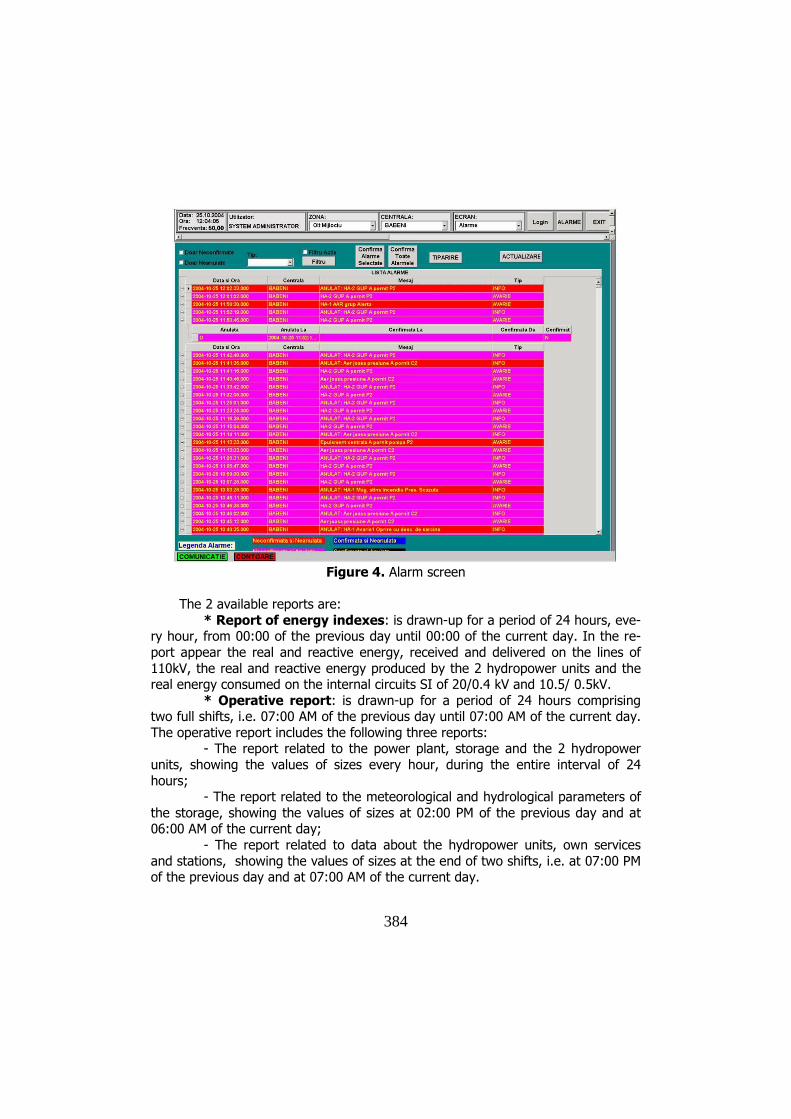
Figure 4. Alarm screen
The 2 available reports are:
* Report of energy indexes: is drawn-up for a period of 24 hours, eve-ry hour, from 00:00 of the previous day until 00:00 of the current day. In the re-
port appear the real and reactive energy, received and delivered on the lines of
110kV, the real and reactive energy produced by the 2 hydropower units and the real energy consumed on the internal circuits SI of 20/0.4 kV and 10.5/ 0.5kV.
* Operative report: is drawn-up for a period of 24 hours comprising two full shifts, i.e. 07:00 AM of the previous day until 07:00 AM of the current day.
The operative report includes the following three reports: - The report related to the power plant, storage and the 2 hydropower
units, showing the values of sizes every hour, during the entire interval of 24
hours; - The report related to the meteorological and hydrological parameters of
the storage, showing the values of sizes at 02:00 PM of the previous day and at 06:00 AM of the current day;
- The report related to data about the hydropower units, own services
and stations, showing the values of sizes at the end of two shifts, i.e. at 07:00 PM of the previous day and at 07:00 AM of the current day.

385
The data of the report are filled in by observing the instructions "Edit Re-ports". [9]
Figure 5. Report printing screen
7. Screen for report printing
Paper This report allows to change the values for all reports. Selection of the desired report is performed in the checkbox "Report" and the date and time for
which the values will be edited is selected from the checkboxes "Date" and "Time".
The columns in the table have the following meanings: name of the size, value of the size acquired from the system, the value proposed for the size by the operator,
the date and time at which was proposed the value of the size and the name of the person making the proposal.

386
Figure 6. Screen for report printing
Text Instead of the name of the person that proposed the value other texts
may occur, which have the following meanings: Normal PROCES - The size was acquired from the system and the value
was not changed by the operator; Normal - The size was neither acquired nor was given a value by the op-
erator;
CALCULATING - for the report related to data about the hydropower units, own services and stations the size was calculated from the data saved and
was not changed by the operator. Editing the value for the size is made as follows: Select the report, the
date and time for which you wish to edit the values. If there are values in the da-
tabase for the sizes in the report, in relation to time and date selected, they will appear in the table, and if there are not, the table does not show anything. At this
moment the values cannot be changed. If you want to modify the values, or if they do not exist and you want to introduce them, press the button "Start Edit". This
causes recalculation of the existing values or their insertion in the table with the value 0 for those that do not exist. At this moment it is possible to change the val-

387
ues for the sizes in the report. The change is performed by selecting in the column 'Value proposed "the cell next to the desired size and entering the new value.
The background colors of cells or lines in the table indicate the status of the value for that size, according to the legend at the bottom of the screen. The table
at the bottom right of the screen contains the history of the size selected in the
main table in the last 2 weeks. The values appear in this table only when in the main table the current cell is from the column 'Value proposed ". The columns in
this table represent the dates and times at which there are stored values for the selected size, the value acquired, the value proposed and the final value of the
size, also the name of the person who proposed the value. The button "Display" makes switching to the screen Viewing Reports, and the "Print" button allows
printing of the selected report directly to printer, without going through the view-
ing screen [4], [5], [6].
8. Screen for energy indexes
This screen displays the energy indexes. On the first row appear the current
values of the indexes and on the following rows appear the previous values stored in the database of the last 6 hours, at the exact hour. The indexes are saved at the
beginning of each hour, after the minute 1 of the current time, as soon as the val-ue was acquired from the meter. For instant sizes (i.e. Powers) is stored the first
value acquired from the current time. Refresh on the screen of the values stored is
performed automatically at intervals of 1 minute.
9. Screen for data store (Back Up)
Allows exporting data stored from the database into text files. Optional, the
data from the database may be deleted and the text files to which they were ex-ported may be archived. The export is performed as follows: select the desired
table in the checkbox "Tables" and check the deletion or archiving options, if de-sired. If it was selected a table with information saved over the time, it will appear
a box in which you must specify the age of the data to be exported. The box "File
destination" should be given the filename in which to export the data. The applica-tion proposes a name that contains the name of the table name and the date of
the export done with the extension ".text". The path of the file cannot be changed and it is subdirectory "APP/BK /" from the directory in which the application was
installed. You cannot export data to a file that already exists, if you try this, the
application generates an appropriate message. At the bottom appears a message indicating the number of entries from the table they have been selected to be ex-
ported. Exporting is done by pressing the button "Execute" after you specify the selection parameters and the desired options.[6], [7], [8].

388
Figure 7. Screen for energy indexes
Figure 8. Screen for data store

389
Acknowledgement
The work has been funded by the Sectoral Operational Programme Human
Resources Development 2007-2013 of the Ministry of European Funds through the
Financial Agreement POSDRU/159/1.5/S/132395.
References
[1] General Electric, Proficy HMI/SCADA Cimplicity documentation and brochures [2] General Electric, Proficy Machine Edition documentation and brochures [3] General Electric documentation, catalogs and brochures [4] Schneider, Vijeo Citect documentation and brochures [5] Schneider, Vijeo Designer documentation and brochures [6] Schneider, Unity Pro documentation and brochures [7] Schneider, Twido Suite documentation and brochures [8] Schneider documentation, catalogs and brochures [9] ***** Masuratori la testele de performanta si probele index pentru CHE Babeni, 2004, Hidroelectrica SA Bucuresti [10] ***** Sistem de monitorizare si SCADA pentru OLT Mijlociu–2004-Automatic Systems Craiova
Addresses:
• Ph.D. student Eng. Cosmin Ursoniu, “Eftimie Murgu” University of Re-
şiţa, Piaţa Traian Vuia, nr. 1-4, 320085, Reşiţa, [email protected] • Ph.D. student Eng. Damaschin Pepa, “Eftimie Murgu” University of Re-
şiţa, Piaţa Traian Vuia, nr. 1-4, 320085, Reşiţa, [email protected]