scalable social sensing of interdependent …dz220/cs671/11sociasensing.pdf... "how long to...
TRANSCRIPT

Scalable Social Sensing of Interdependent Phenomena
Shiguang Wang et al.
Presented by: Andrew Cai
1

Overview
• Background & Related Work
• Problem Formulation
• Methodology
• Evaluation
2

Background & Related WorkCrowd Sensing
Correlated Variables
3

Crowd Sensing
• Users share data for common interest
• Sometimes other data sources not available
• E.g. natural disaster
• Mobile Devices: phones, tablets, wearables• Reliable within error distribution
• Measurements from many sensors
4

Crowd Sensing
• E.g. Bus Arrival Time – Zhou [3](week 2 paper)
5

Crowd Sensing
• E.g. Vtrack – Thiagarajan[4] (week 2 paper)
6

Crowd Sensing: Humans as Sensors
• Users report data
• Good for events of interest
• Humans classify rather than measure
• e.g. can’t say exact temperature
• Binary Sensors (Easy to extend to multivalued)
• Unknown reliability
7

Humans as Sensors: Reliability
• Previous works assume fixed reliability for each source
• People may know more in different areas• E.g. what’s still open after a disaster
• Source reliability different for different variables
8

Correlated Event Variables
• Some previous works assumed independence
• In practice, variables often correlated
• E.g. traffic model: weather, events, road condition:
Traffic correlates within large scale
9

Correlated Event Variables
• Works considering correlation were exponential time• In size of largest interdependent group of variables
• Very bad!
• Did not consider structure of correlations
10

Dependencies
• Can be modeled as Bayesian Network
• Underlying dependency graph 𝐺
• Θ(2N) inference if complete graph
• Conditional Independence model avoids this
11

Conditional Independence
• P(A|X) independent from P(B|X)
• A and B both have dependency on X
• More common in real applications
• Arise from structure in real world• E.g. Traffic conditionally independent given all wider effects
12

Other Past Work
• Dependencies between sources• Maximum Likelihood – Wang [1]
• E.g. Second hand sources
• Real world isn’t static: Time-varying ground truth• Expectation Maximization – Wang [2]
• Both can easily be modeled in Authors’ method
13

Problem Formulation
14

Problem Formulation
• Large number of binary variables 𝐶
• Bayesian network: Directed Acyclic Graph 𝐺• Nodes correspond to variables
• Directed edges & parameters correspond to dependencies
• Encodes conditional independencies
• Can easily encode time-varying variables
15

Problem Formulation: Humans as Sensors
• True, False, Unknown (T, F, U)
• Source Claim matrix
• 𝑆𝐶𝑖,𝑗 = 𝑣 : source 𝑖 claims variable 𝑗 to be 𝑣.• Authors use 𝑆𝐶𝑖,𝑗
𝑣 as well
• Disagreements? Don’t know how reliable claims are
16

Problem Formulation: Reliability
• Each variable 𝐶𝑗 has a category 𝑙
• This is denoted 𝑙𝐶𝑗
• Reliability of source 𝑖 fixed within category
• Reliability defined 𝑙𝑡𝑖 = Pr( 𝑙𝐶𝑗𝑣|𝑆𝐶𝑖,𝑗
𝑣 )
• Reliability vector for each source
17

Problem Formulation: Reliability
• 𝑙𝑇𝑖𝑣 = Pr 𝑆𝐶𝑖,𝑗
𝑣 |𝑙𝐶𝑗𝑣
• 𝑙𝐹𝑖𝑣 = Pr 𝑆𝐶𝑖,𝑗
ത𝑣 |𝑙𝐶𝑗𝑣
• 𝑙𝑇𝑖𝑣+ 𝑙𝐹𝑖
𝑣≤ 1 (U responses)
18

Objective
• Given 𝑆𝐶 and 𝐺
• Estimate reliability of sources
• Estimate true values of event variables
19

Contributions
• Extend previous solution• more accurate and efficient
• Generalizes models in previous work• Previous works are special cases
• Evaluation by simulation and using real world data
20

Methodology
21

Estimating the States of Variables
• Expectation Maximization• Classical Machine Learning algorithm
• Modified to consider categories
• “EM-CAT”
• Assume sources are independent• But can apply previous work
22
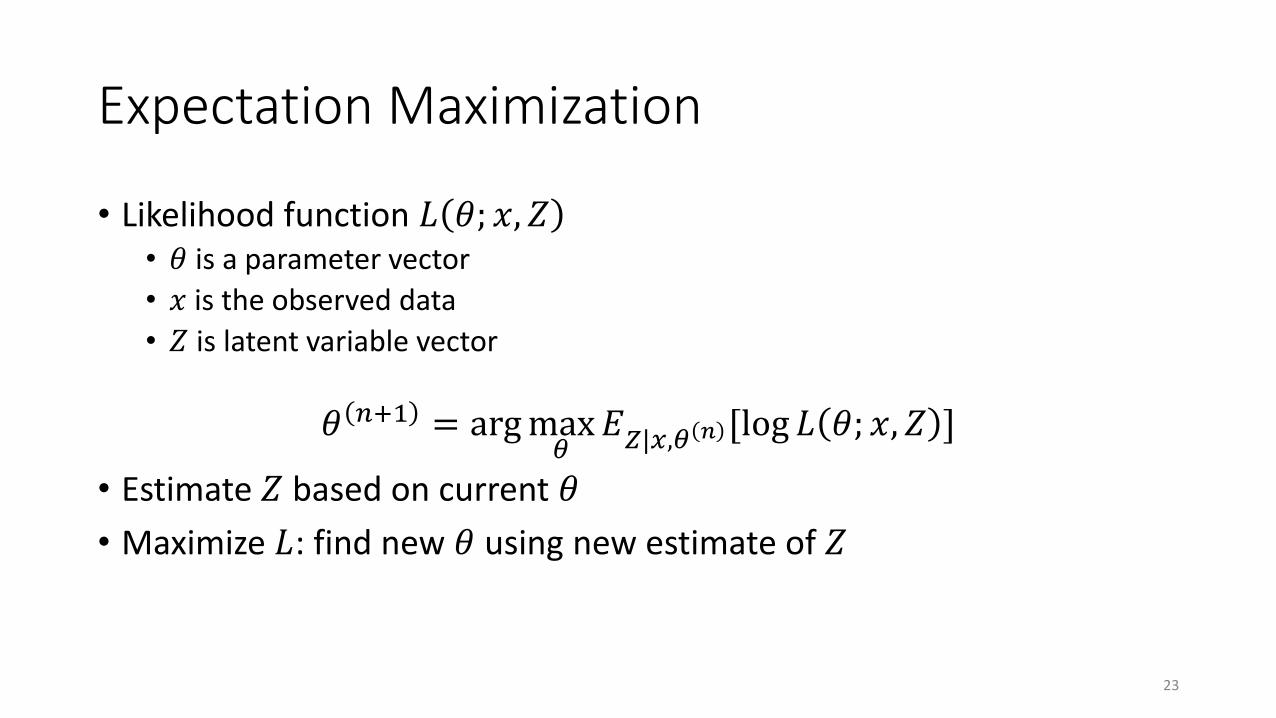
Expectation Maximization
• Likelihood function 𝐿 𝜃; 𝑥, 𝑍• 𝜃 is a parameter vector
• 𝑥 is the observed data
• 𝑍 is latent variable vector
𝜃 𝑛+1 = argmax𝜃
𝐸𝑍|𝑥,𝜃 𝑛 [log 𝐿 𝜃; 𝑥, 𝑍 ]
• Estimate 𝑍 based on current 𝜃
• Maximize 𝐿: find new 𝜃 using new estimate of 𝑍
23

Expectation Maximization
• 𝐿 𝜃; 𝑥, 𝑍 = Pr 𝑥, 𝑍 𝜃 = Pr 𝑍 𝜃 Pr 𝑥 𝑍; 𝜃
• Build 𝑍 such that 𝑥𝑖 and 𝑥𝑗 are conditionally independent given 𝑍
𝐿 𝜃; 𝑥, 𝑍 = Pr(𝑍1, … , 𝑍𝑁)ෑ
𝑗∈𝐶
ෑ
𝑖∈𝑆
Pr(𝑥𝑖,𝑗|𝑍𝑗; 𝜃)
24

Expectation Maximization
• 𝜃 contains 𝑙𝑇𝑖𝑣, 𝑙𝐹𝑖
𝑣
• 𝑥 is 𝑆𝐶 matrix
• 𝑍 is true values of variables
• Iteratively:• Estimate 𝑍 using 𝜃(𝑛) and Bayesian Network
• Optimize 𝜃(𝑛+1) to maximize 𝑃(𝑥, 𝑍|𝜃(𝑛+1))
25

Expectation Maximization: Pseudo Code
26

Generalization
• Dependent Sources
• Time Varying variables
27

EvaluationExtensive Simulation
Real-world data set
28

Baselines
• EM-REG:• Independent variables, single reliability per source
• EM-T:• Bayesian network dependencies, single reliability
• EM-C:• Independent variables, categorized reliability
29

Simulation
• 100 variables, 40 sources, randomly generated• Expected reliability 0.6
• Expected “talkativeness” 0.6
• Included “Experts”
• 𝐺 randomly generated• 100 edges
• Ground truth randomly generated• 50/50 prior, but uses Bayesian network for marginal (actual)
30

Simulation Results
• Simulation based on same model as their system…
• Even uses same DAG for dependencies• Unlikely to be handed a perfect Bayesian network in
real world
• The 𝐺s used was very sparse
31

Simulation Results
32
• Authors’ EM-CAT generally best
• EM-C better reliability than EM-REG or EM-T

Simulation Results
• Better sources give better variable estimation
• Reliability still hard to predict
33

Simulation Results
• More Data (of same quality) is better
34

Simulation Results
• More Complex 𝐺 reduces performance
• Source Reliability graph missing• Authors included 8(b) (slide 36) here instead…
35

Simulation Results
• Performance with more Labels concerning
36

Simulation Results
• Again, more data (of same quality) is better
37

Performance
38
• <1s using JTree
• Graphs only given for very small data sizes…

Real World Data Set
• Hurricane Sandy (Nov ‘12)
• Modeled groceries, pharmacies,gas stations
• Only had ground truth data
• Simulated noisy sources…
39

Real World Data Set Cont.
• Tested few hypothesis as dependency graphs:
• Independent
• Supply line: all variables in same state connected• “Ideally, we should have considered the real topology of supply lines”
• “Exact” hypothesis• based on prior work that analyzed the data set
40
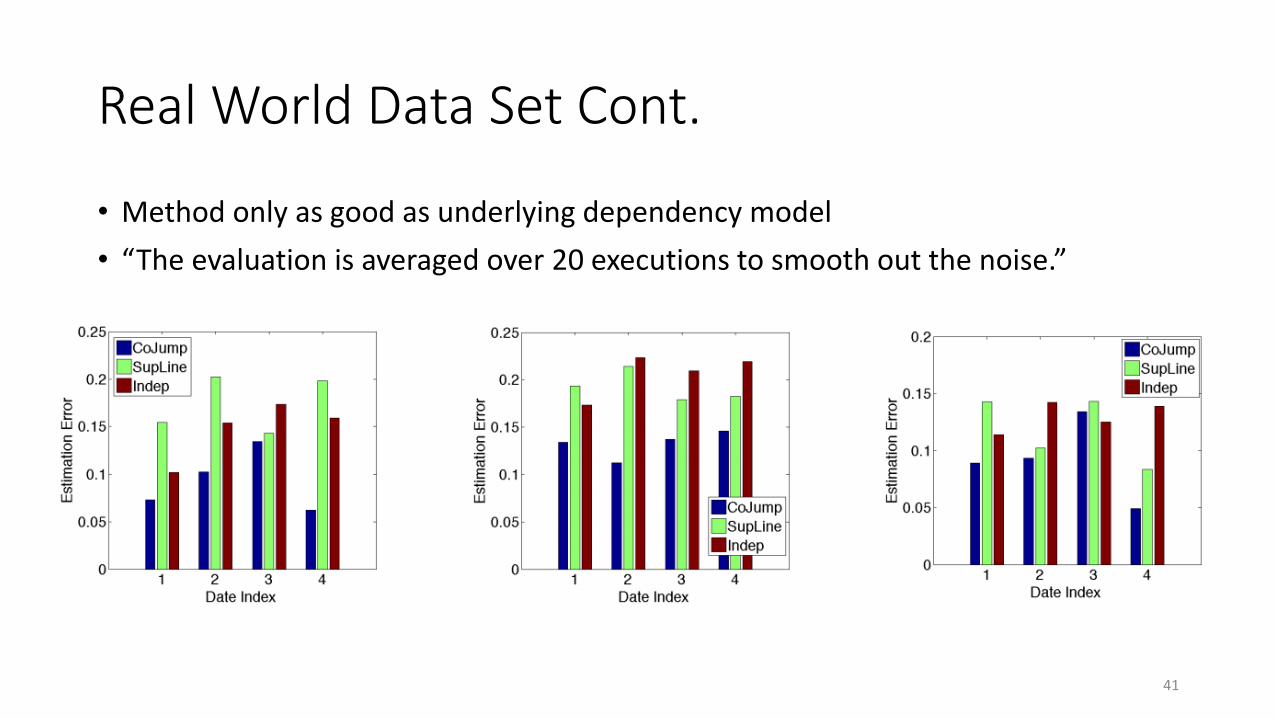
Real World Data Set Cont.
• Method only as good as underlying dependency model
• “The evaluation is averaged over 20 executions to smooth out the noise.”
41

Hypothesis Evaluation
• The “right” hypothesis will have best performance• We won’t have ground truth
• Doesn’t help in real time
• Also has highest 𝐿 upon convergence
42

Limitations
• Dependency among variables must be a DAG
• Hard to create real world Bayesian Network• NP complete
• Discusses a way to evaluate, possible overfit?
• Score based and constraint based approaches
43

Conclusion
• Can infer variables from crowd reports IF:• Dependency between variables is known
• Dependency between variables is DAG
• Can achieve good accuracy if few categories
44

Questions?
45

References
[1] D. Wang, T. Amin, S. Li, T. A. L. Kaplan, S. G. C. Pan, H. Liu, C. Aggrawal, R. Ganti, X. Wang, P. Mohapatra, B. Szymanski, and H. Le. Humans as sensors: An estimation theoretic perspective. In IPSN, 2014.
[2] S. Wang, D. Wang, L. Su, L. Kaplan, and T. Abdelzaher. Towards cyber-physical systems in social spaces: The data reliability challenge. In Real-Time Systems Symposium (RTSS), 2014.
[3]P. Zhou, Y. Zheng and M. Li, "How Long to Wait? Predicting Bus Arrival Time With Mobile Phone Based Participatory Sensing," in IEEE Transactions on Mobile Computing, vol. 13, no. 6, pp. 1228-1241, June 2014.
[4] Thiagarajan, Arvind, et al. "VTrack: accurate, energy-aware road traffic delay estimation using mobile phones." Proceedings of the 7th ACM Conference on Embedded Networked Sensor Systems. ACM, 2009.
46