scalable visualization of semantic nets using power … · concept of power-law degree distribution...
TRANSCRIPT
Appl. Math. Inf. Sci.8, No. 1, 355-367 (2014) 355
Applied Mathematics & Information SciencesAn International Journal
http://dx.doi.org/10.12785/amis/080145
Scalable Visualization of Semantic Nets usingPower-Law Graphs
Ajaz Hussain1, Khalid Latif1,∗, Aimal Tariq Rextin1, Amir Hayat2 and Masoon Alam2
1 School of Electrical Engineering and Computer Science, National University of Sciences and Technology (NUST), Sector H-12,Islamabad 44000, Pakistan
2 Comsats Intitute of Information Technology, Islamabad 44000, Pakistan
Received: 1 Jul. 2013, Revised: 10 Nov. 2013, Accepted: 13 Nov. 2013Published online: 1 Jan. 2014
Abstract: Scalability and performance implications of semantic net visualization techniques are open research challenges. This paperfocuses on developing a visualization technique that mitigates these challenges. We present a novel approach that exploits the underlyingconcept of power-law degree distribution as many realistic semantic nets seems to possess a power law degree distribution and presenta small world phenomenon. The core concept is to partition the node set of a graph into power and non-power nodes and to applya modified force-directed method that emphasizes the power nodes which results in establishing local neighborhood clusters amongpower nodes. We also made refinements in conventional force-directed method by tuning the temperature cooling mechanism in orderto resolve ‘local-minima’ problem. To avoid cluttered view, we appliedsemantic filtrationon nodes, ensuring zero loss of semantics.Results show that our technique handles very large scale semantic nets witha substantial performance improvement while producingaesthetically pleasant layouts. A visualization tool,NavigOWL, is developed by using this technique which has been ported as a plug-infor Protege, a famous ontology editor.
Keywords: Ontology visualization, semantic net visualization, power law graphs, scalable directed graphs, force-directed graphs.
1 Introduction
Due to recent advancements in semantic web, the web ofdata is continuously growing. One evidence isLinkedData initiative1, which has resulted into billions of triples.Similarly, several large ontology structures have evolvedover the last few years. There is a growing need ofeffective visualization methods that could be adopted foran effective representation of ontologies in order to fullyunderstand the structures.
Literature indicates that several research initiativeshave targeted 2D and 3D ontology visualizationtechniques [16,7,3,29,22,14,6,8,9,23,17,10,31,11,13,19]. Several tools exist to visualize the semantic nets [20].Different layout techniques have been implemented inthese tools, but each technique has shortcomings due towhich either the structure of ontology becomesambiguous to the user or the view losses the semantics.As the ontology size increases, several issues such as
1 http://linkeddata.org
node cluttering, edge crossings, local minima problem,angular resolution problem, computational inefficiency,shape/view distortion, ineffective rendering techniques,and asymmetrical drawings, are observed. Hence aneffective and scalable visualization technique is needed,that should clearly depict the structure of completeontology while maintaining persistent aestheticconstraints. We present the optimized, scalable, andperformance oriented directed graph layout technique tovisualize the large-scale ontology graph by maintainingthe aesthetics aspects of visualization as discussed in [25].
We exploited the underlying concept of power-lawdegree distribution topology pertaining to the propertythat a small proportion of nodes have a high degree(power nodes) while the vast majority of nodes have alow degree (non-power nodes). Thus, in a realisticnetwork, there exists few power-nodes that needs to beemphasized more as compared to other non-power nodes.The basic idea is to partition all the nodes/vertices basedupon power-law degree distribution and then to apply our
∗ Corresponding author e-mail:[email protected]
© 2014 NSPNatural Sciences Publishing Cor.
356 A. Hussain et al: Scalable Visualization of Semantic Nets using...
optimized and modified force-directed layout algorithmwhich manages scalability and performance implications.
We begin by summarizing previous approaches thathave been applied to graph layout and their aestheticmeasures along with review of various tools of semanticnet visualizations in Section2. Section3 discusses thedetailed design of our novel graph layout technique alongwith refinements. In Section4 we discuss our developedvisualization tool,NavigOWL, and plug-in for Protege. InSection5, we demonstrate how our algorithm achievessubstantially better performance and mitigates scalabilitychallenge by comparing it to the existing approacheswhile visualizing large scale semantic nets.
2 Related Work
In this section we discuss the generally accepted aestheticcriteria for graph layouts and describe various graphdrawing layout techniques that have been implemented sofar. Further, we discuss few existing ontologyvisualization tools.
2.1 Graph Drawing Aesthetics and Layouts
There are certain graph drawing constraints that avisualization must follow. These constraints are appliedon a graph in order to get better understanding andstructure of graph. These constraints are aestheticallymeasured. We are concerned with an optimized andscalable layout technique that posses generally acceptedaesthetic criteria [25].
Moreover, visualization of semantic net gets complexdue to its structure or role-relations hierarchy defined inan ontology. One node can be linked to many other nodes,so the user is hardly able to understand the structure ofsemantic net. In order to create clear mental map for theuser, a layout has to be applied to the visualization.Following are few existing layout techniques that arediscussed in detail.
The most popular layout algorithms are based onforce-directed or spring-embedded methods [8,10,9,13,29,4,17]. Eades designed the earliest spring-embeddedmodel for graph drawing [8]. The basic idea was toembed a graph by replacing the vertices by steel rings andreplace each edge with a spring to form a mechanicalsystem. The vertices are placed in some initial layout andthen released so that the spring forces on the rings movethe system to a minimal energy state. The attractive forceis calculated between neighbors with complexity ofΘ (|E|) whereas the repulsive force is calculated betweenevery pair of vertices with complexity ofΘ
(∣
∣V2∣
∣
)
. Thistechnique generates aesthetically pleasing layouts.However, the repulsive force complexity poses seriouscomputational issues for large graphs, hence it has to belimited to few hundred nodes. Moreover, this technique
highlights certain shortcomings likeoccluding verticeswith edges, edge-crossings, and angular resolutionproblemi.e. the angle between incident edges may be toosmall, and it may get smaller in case of larger graphs.
Another variant by Fruchterman and Reingold [13]simplified forces formulae and made several refinementsby using cooling scheduleto limit nodes maximumdisplacement. Repulsive force is still being calculatedbetween every node in a graph, yielding to a complexityof Θ
(∣
∣V2∣
∣
)
.Similarly, a modified spring layout was presented by
Huang et al. [17], in which they used OnlineForce-Directed Animated Visualization(OFDAV)technique for assisting web-navigation. This techniquedescribes, which most of existing visualization systemshave problems presenting, huge graphs like fish-eye [26],hyperbolic browser, cone trees [23]. The main issue ofthis technique iszero angular resolution problemi.e. thesmallest angle between two neighboring edges incidenton common vertex. Also, no role- relation hierarchy andcontext details are observed in graphs and this techniquealso does not resolve issue of overlapping edges ofcommon vertex.
Later Lin and Yen also proposed a variant ofEades [10]. As many conventional force-directed methodsare based on either vertex-vertex repulsion [8,13] orvertex-edge repulsion [17,29], therefore this approach isan enhancement which is based uponedge-edge repulsionto draw graphs. Although this technique resolved problemof minimum angular resolution[12], but it was notscalable and results show the drawings of smaller graphswith upto few dozen nodes. Further, this technique doesnot always guarantee to produce nice symmetricaldrawing and poseslocal minima problemwhere forcesget too week to spread graph. The main issue of thisalgorithm is its complexity which is in square. i.e.
Θ(
|N|2+ |E|)
. Hence performance of algorithm is worst
in case of large scale ontologies.From the discussion it is evident that despite various
modifications and implementations, the force-directedalgorithm is not scalable and gives worst performance incase of large ontologies. There is a need to optimize it formanaging scalability challenge and to preserve aestheticvisualization.
2.2 Graph Clustering Algorithms
Apart from traditional force directed algorithms,significant research work has been done on clustering ofthe graphs [30,9,1,15,4,24,27,32]. Cluster graph isanother important concept to visualize semantic nets. Theclusters are built for the aesthetic view of graph structure.Few implementations, by tuning the force directedalgorithms with clustering techniques, are given in [4,9,27]. In this section, we review various approaches beingadopted to build the graph clusters.
© 2014 NSPNatural Sciences Publishing Cor.
Appl. Math. Inf. Sci.8, No. 1, 355-367 (2014) /www.naturalspublishing.com/Journals.asp 357
Clusters or groups are investivated for biological andsocial community structures by Girvan [15] be exploitingcentrality in order to find community boundaries. Theworst case complexity of algorithm though isΘ(m2n)wherem represents the number of edges andn as numberof vertices. This technique was not highly scalable andsupported few thousands nodes. Moreover, it isalgorithmically complex as it operates on edges. In caseof sparse graphs, its complexity isΘ(n3), which isinefficient.
Another variant of clustering approach was presentedby Yuruk et al. [32] in which finding the hierarchicalstructure of clusters without any input parameters wasdiscussed. They presented, ahierarchical structuralclustering algorithm for networks. Although, thisapproach is considered as highly effective in findinghierarchical clusters in social networks, but theimplementations showed small scale graphs, thus thisapproach is also not highly scalable. Algorithm is notefficiently applicable in semantic networks, as using onlystructural similarity is not sufficient for building clusters.Results also showed node cluttering and edge-overlappingissues.
Wallner also described hierarchical cluster graphs thatimpose higher level of granularity controlled byusers [27]. Although cluster center detection technique isefficient and controlled by user-defined threshold,however, this technique has certain shortcomings.Algorithm’s complexity is very high due to cluster buildphase and further Fruchterman and Reingoldforce-directed algorithm [13] is applied, which has highcomplexity. Because of breakdown condition problem, insome cases, algorithm aborts too early, hence shows longdistances between meta-nodes. Finally, no computationtime and scalability aspects are mentioned in literature.
2.3 Power Law Graphs
Several research efforts have targeted the power-lawgraphs and their combinations with the traditionalforce-directed algorithms [16] by exploiting theunderlying structure of power-law networkdistribution [6,2,5]. In this section we review the researchwork related to power-law graphs.
Chan and colleagues presented a novel algorithm ofOut Degree Layoutfor the visualization of large scalenetwork topologies [6]. They divided the whole networkinto multiple layers based upon the Out Degree (thenumber of edges coming out of the node). They adoptedthePower Law topology, which is commonly being foundin topology networks.A power-law topology has theproperty that a small proportion of nodes have a highout-degree i.e., have many connections to other nodes,while the vast majority of nodes have a low out-degree,i.e., have connections to few nodes[6]. The methodologyadopted is to layout the nodes with highest out-degreefirst, then to layout the nodes with smaller out-degrees
and so on. They partitioned the graph into multiple layersbased upon out-degrees. The graph layout is being adjustby using Fruchterman-Reingold (FR) Force DirectedAlgorithm [13]. Complexity of FR algorithm is
Θ(
|N|2+ |E|)
, but the overall complexity of their
algorithm is Θ(
∑ |Nk|2+∑ |Ek|)
, where Nk and Ek
presents the No. of nodes and edges in layerLkrespectively. They tested the BGP networks of up to 7,000nodes and compared the results with traditionalalgorithms (including [10,13,28]) and achievedsignificant improvement in aesthetic layouts, though theview gets cluttered if the structure of network is complex.
Focus-based filtering and clustering technique inpower-law network graphs provides better layout ascompared to classical filtering technique as it is basedupon power-law distribution [5]. Dense graphs can befiltered into clear view. However, scalability remains anopen challenge as this technique is only demonstrated forsmall graph of 1,511 nodes and 7,902 co-authoring links.Moreover, it is computationally inefficient as firstlycluster cores are extracted and then layout is applied.Also, changing user-focus in this technique, givescluttered view in few silhouettes.
In power-law topology a small portion of nodes havemany connections to other nodes which means that in asemantic net, core nodes have the maximum degree andin the whole graph, there exists very few core-nodes.Similarly, as the degree of the nodes increase, thefrequency behavior of the degree decreases, which is thebasic property of mathematical power-law. It has beenproven to be effective by various approaches that theinteraction networks (Graphs containing actors andrelationships among actors) or semantic nets exhibit thepower-law behavior. Thus we can follow the power-lawproperty in ontology visualization as ontology alsoexhibit power-law property, as the degree of nodesincreases, its frequency decreases (i.e frequency of corenodes is very low) [5]. Our technique also exploit theunderlying concept of power-law degree distribution, thatwe discuss in Section3.
2.4 Ontology Visualization
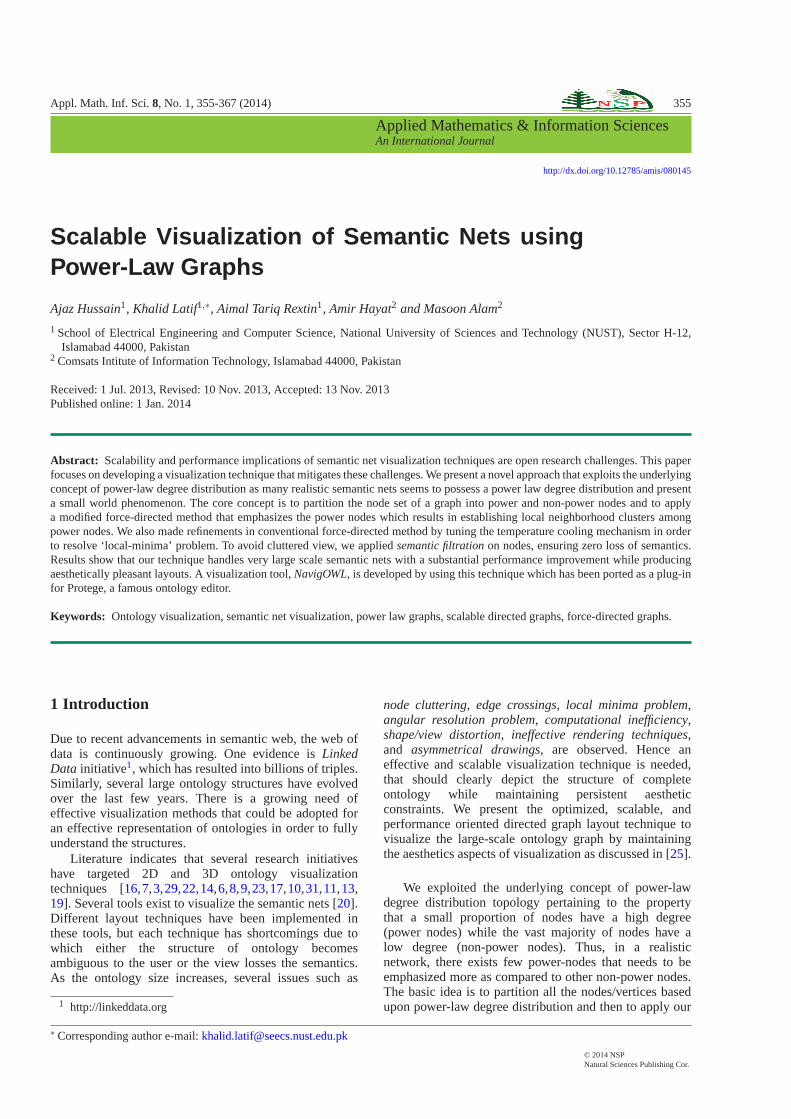
Various ontology visualization tools are in use includingCytoscape, Giny, graphViz, HyperGraph, rdfGravity,IsaViz, Jambalaya, Owl2Prefuse, and SocNetV [3,19].Most of these tools either lack in visualizing role-relationhierarchies of complete ontology or in aspect of drawinglayouts. Figure1 represents the visualization ofAminoAcid Ontologyof 1,484 triples, the drawing layout is finebut it misses role-relation hierarchy and simply representsclasses along with their instances. Moreover, theanimation doesn’t stops in layout process as graphcontinuously adjusts itself which makes it harder for userto preserve mental map.
© 2014 NSPNatural Sciences Publishing Cor.
358 A. Hussain et al: Scalable Visualization of Semantic Nets using...
Fig. 1: Owl2Prefuse: view of classes and their instances, missingrole-relation hierarchy, and other constructs in AminoAcidontology graph
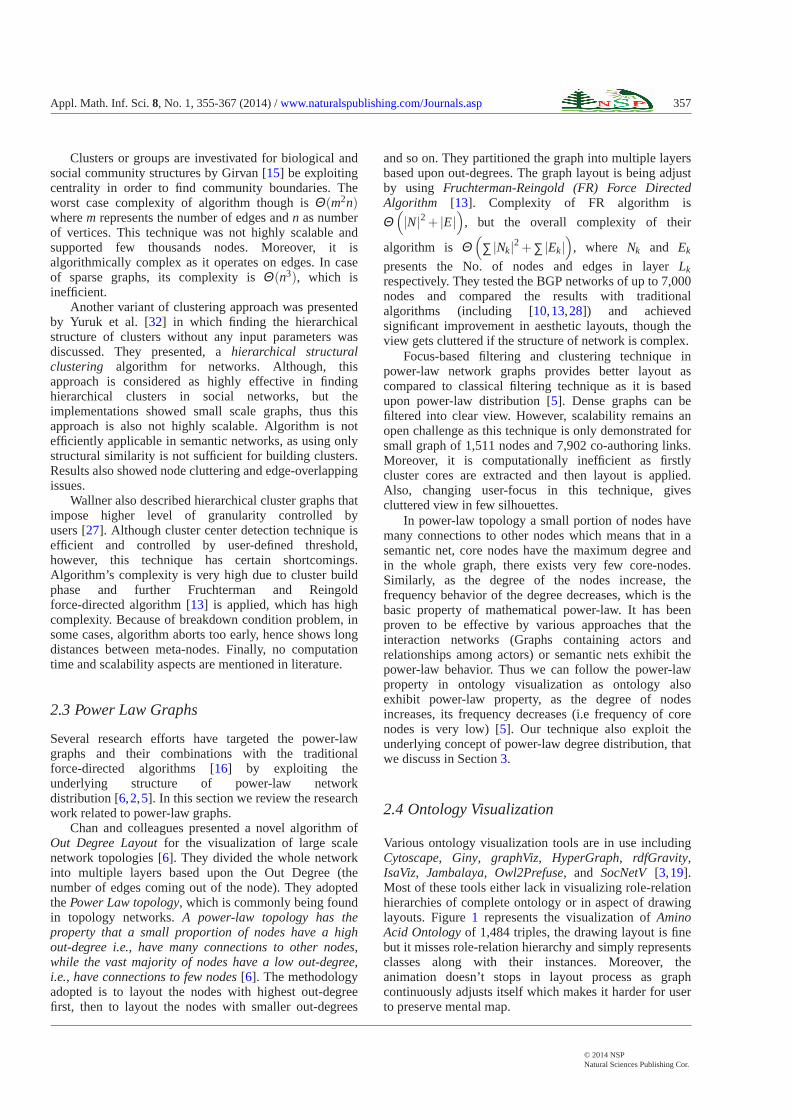
We also visualized sameAmino Acid ontology tocompare its graph in another popular ontologyvisualization tool named asSocNetV. The tool is enrichedwith various graph properties and used mostly tovisualize and exploit the properties of social networks.The tool is computationally not very efficient, layouts areambiguous, and lacks role-relation hierarchy. Figure2represents snapshot of amino-acid ontology after applyingforce-directed layout on, it shows ambiguous view withlack of details about role-relations.
Fig. 2: SocNetV: Force-directed layout applied over AminoAcidontology, cluttered view with node-overlaps, missing role-relations details.
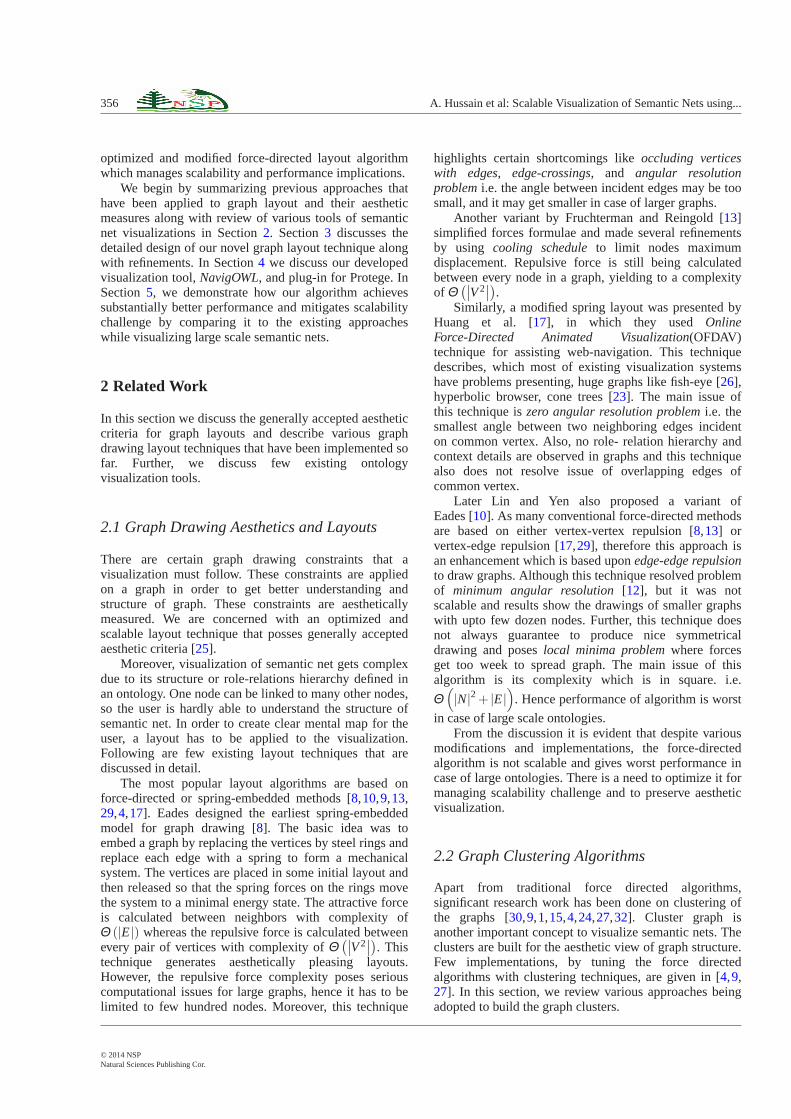
rdfGravity is another popular ontology visualizationtool. It represents the ontology graph with completerole-relation hierarchy and in full context along withliterals and other constructs with filtering features.Unfortunately, it does not support any graph drawinglayout so it gives holistic view after filtering but givescluttered view for complete ontology graph. Figure3represents graph ofTransOntology-Bhakti, this ontologygraph consists of only 195 triples yet we can observecluttered view and node-overlap in asymmetrical view ofontology graph. Its also not scalable to support largeontology graphs as the view becomes ambiguous andunstructured.
Fig. 3: rdfGravity: Cluttered view with node-overlap,asymmetrical drawing on small TransOntology-Bhakti graph.
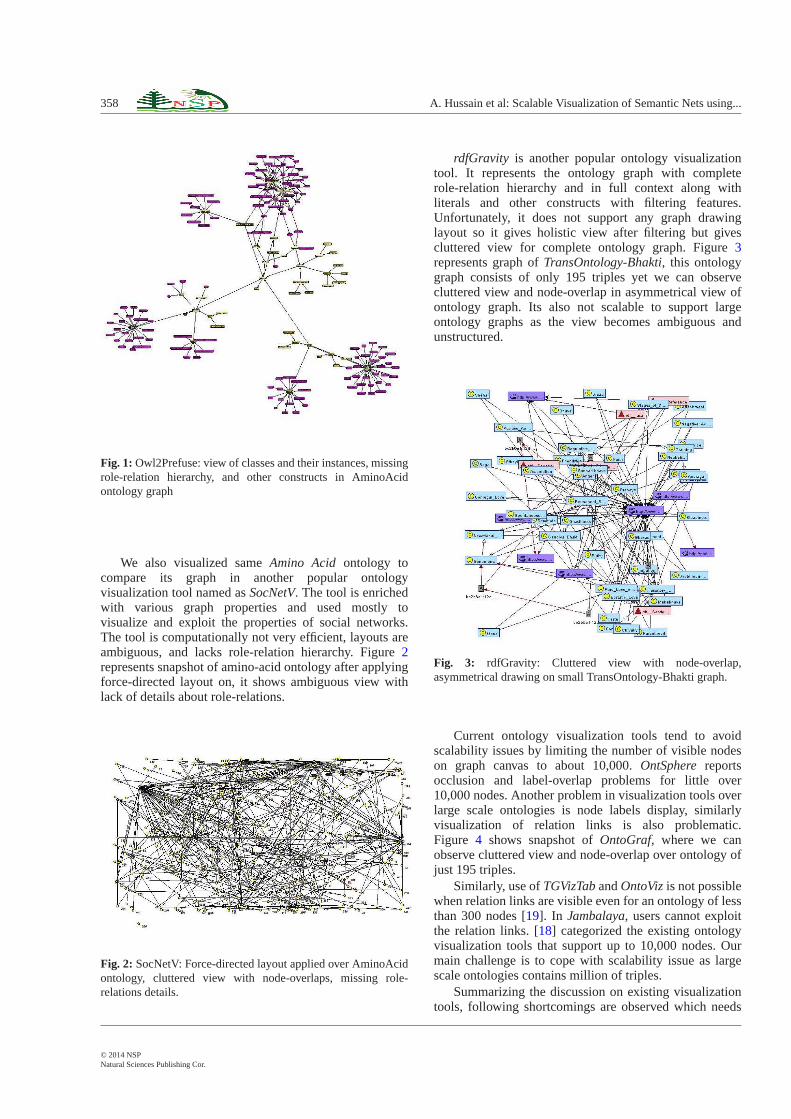
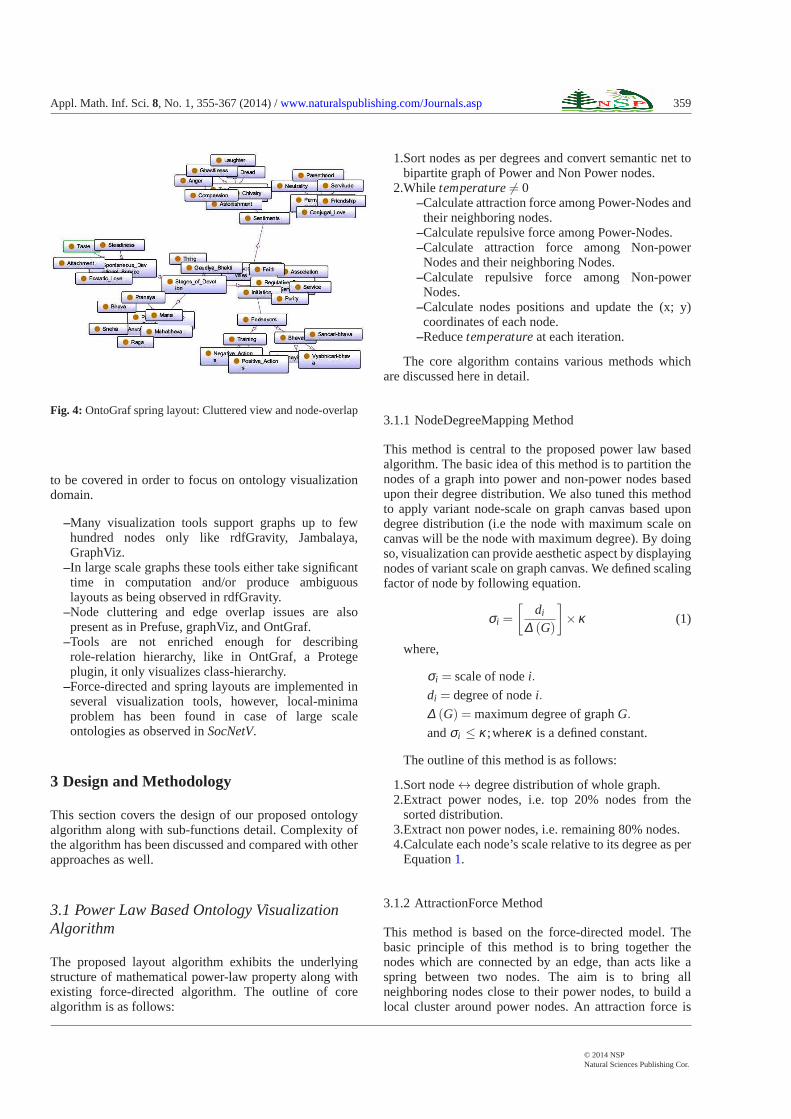
Current ontology visualization tools tend to avoidscalability issues by limiting the number of visible nodeson graph canvas to about 10,000.OntSpherereportsocclusion and label-overlap problems for little over10,000 nodes. Another problem in visualization tools overlarge scale ontologies is node labels display, similarlyvisualization of relation links is also problematic.Figure 4 shows snapshot ofOntoGraf, where we canobserve cluttered view and node-overlap over ontology ofjust 195 triples.
Similarly, use ofTGVizTabandOntoVizis not possiblewhen relation links are visible even for an ontology of lessthan 300 nodes [19]. In Jambalaya, users cannot exploitthe relation links. [18] categorized the existing ontologyvisualization tools that support up to 10,000 nodes. Ourmain challenge is to cope with scalability issue as largescale ontologies contains million of triples.
Summarizing the discussion on existing visualizationtools, following shortcomings are observed which needs
© 2014 NSPNatural Sciences Publishing Cor.
Appl. Math. Inf. Sci.8, No. 1, 355-367 (2014) /www.naturalspublishing.com/Journals.asp 359
Fig. 4: OntoGraf spring layout: Cluttered view and node-overlap
to be covered in order to focus on ontology visualizationdomain.
–Many visualization tools support graphs up to fewhundred nodes only like rdfGravity, Jambalaya,GraphViz.
–In large scale graphs these tools either take significanttime in computation and/or produce ambiguouslayouts as being observed in rdfGravity.
–Node cluttering and edge overlap issues are alsopresent as in Prefuse, graphViz, and OntGraf.
–Tools are not enriched enough for describingrole-relation hierarchy, like in OntGraf, a Protegeplugin, it only visualizes class-hierarchy.
–Force-directed and spring layouts are implemented inseveral visualization tools, however, local-minimaproblem has been found in case of large scaleontologies as observed inSocNetV.
3 Design and Methodology
This section covers the design of our proposed ontologyalgorithm along with sub-functions detail. Complexity ofthe algorithm has been discussed and compared with otherapproaches as well.
3.1 Power Law Based Ontology VisualizationAlgorithm
The proposed layout algorithm exhibits the underlyingstructure of mathematical power-law property along withexisting force-directed algorithm. The outline of corealgorithm is as follows:
1.Sort nodes as per degrees and convert semantic net tobipartite graph of Power and Non Power nodes.
2.While temperature6= 0–Calculate attraction force among Power-Nodes andtheir neighboring nodes.
–Calculate repulsive force among Power-Nodes.–Calculate attraction force among Non-powerNodes and their neighboring Nodes.
–Calculate repulsive force among Non-powerNodes.
–Calculate nodes positions and update the (x; y)coordinates of each node.
–Reducetemperatureat each iteration.
The core algorithm contains various methods whichare discussed here in detail.
3.1.1 NodeDegreeMapping Method
This method is central to the proposed power law basedalgorithm. The basic idea of this method is to partition thenodes of a graph into power and non-power nodes basedupon their degree distribution. We also tuned this methodto apply variant node-scale on graph canvas based upondegree distribution (i.e the node with maximum scale oncanvas will be the node with maximum degree). By doingso, visualization can provide aesthetic aspect by displayingnodes of variant scale on graph canvas. We defined scalingfactor of node by following equation.
σi =
[
di
∆ (G)
]
×κ (1)
where,
σi = scale of nodei.
di = degree of nodei.
∆ (G) = maximum degree of graphG.
andσi ≤ κ ;whereκ is a defined constant.
The outline of this method is as follows:
1.Sort node↔ degree distribution of whole graph.2.Extract power nodes, i.e. top 20% nodes from the
sorted distribution.3.Extract non power nodes, i.e. remaining 80% nodes.4.Calculate each node’s scale relative to its degree as per
Equation1.
3.1.2 AttractionForce Method
This method is based on the force-directed model. Thebasic principle of this method is to bring together thenodes which are connected by an edge, than acts like aspring between two nodes. The aim is to bring allneighboring nodes close to their power nodes, to build alocal cluster around power nodes. An attraction force is
© 2014 NSPNatural Sciences Publishing Cor.
360 A. Hussain et al: Scalable Visualization of Semantic Nets using...
Algorithm 1: AttractionForceData: n−→ node;d−→ degree;
N−→ Nodes;E−→ Edges; k← StretchConstant;Input : The graphG< N,V > and< n,d >−→ set
of node-degree pairs;Description: Attraction force among connected nodes, by
updating their(x,y) coordinates to bringthem closer to each other.
1 begin2 for i← 1 to |N| do3 for j ← 1 to |Eni | do4 n1← i andn2← Other end node ofn1
5 ∆x← n1x−n2x
6 ∆y← n1y−n2y
7 Length←√∆x×∆x+∆y×∆y
8 force← Length−kk×(100)
9 dx← force×∆x
10 dy← force×∆y
11 n1x← n1x−dx
12 n1y← n1y−dy
13 n2x← n2x+dx
14 n2y← n2y+dy
15 end16 end17 end
computed based upon the distance between twoconnected nodes. Our optimized approach is presented inAlgorithm 1.
The complexity of attraction force method inforce-directed model isΘ(E), whereE represents numberof edges in graph. In our power-law based approach itscomplexity is reduced toΘ
(∣
∣Vp∣
∣
∣
∣Ep∣
∣
)
, where Vprepresents number of Power-Vertices andEp representsthe number of edges of power-vertices in a graph.Moreover,|Vp| ≪ |V| and |Ep| ≪ |E|, i.e the complexityis being reduced.
3.1.3 RepulsionForce Method
This method is based on the force-directed model. Thebasic principle of this method is to move away the nodeswhich are not connected by an edge. All non-connectednodes are moved away from each other. A repulsive forceis computed based upon the distance between twoconnected nodes. The optimized method is provided inAlgorithm 2.
The major pit fall of force-directed algorithm is thecomplexity of repulsive force method which isΘ(E2),where E represents number of edges in graph. In ourpower-law based approached, we reduced its complexity
Algorithm 2: RepulsionForce
Data: n−→ node;d−→ degree;N−→ Nodes;E−→ Edges ;k−→ Repulsion Constant;dx −→ distance co-efficient ofn1;dy −→ distance co-efficient ofn2;R = Random Value;λ −→ a constanct initially set to 700;Input : < n,d >−→ nodes along their degrees;Description: Repulsive force between non-connected
nodes, by updating their(x,y) coordinates tomove them away from each other.
1 begin2 for i← 1 to N do3 n1← i4 for j ← i+1 to N do5 n2← j dx = 0 anddy = 0
6 ∆x← n1 x − n2 x
7 ∆y← n1 y − n2 y
8 Length←√∆x×∆x+∆y×∆y
9 if Length equal to 0then ;// Collision Detection
10
11 dx = R anddy = R
12 end13 end14 else ifLength < λ 2 then ; // Distance
Limit15
16 dx← ∆xLength anddy← ∆y
Length
17 end
18 force← (n1k×n2k)80
19 n1x← n1x+dx ∗ force
20 n1y← n1y+dy ∗ force
21 n2x← n2x−dx ∗ force
22 n2y← n2y−dy ∗ force
23 end24 end
to θ(∣
∣Vp2∣
∣
)
, whereVp represents of power vertices and|Vp| ≪ |V|.
3.1.4 UpdateNodesPosition Method
This method changes the node positions once they havebeen processed by attraction and repulsion forces andupdates each node’s(x,y) coordinates based on node’stemperature and distance co-efficients.
© 2014 NSPNatural Sciences Publishing Cor.
Appl. Math. Inf. Sci.8, No. 1, 355-367 (2014) /www.naturalspublishing.com/Journals.asp 361
3.1.5 CoolDown Method
This method iteratively reduces the temperature (or heat).As Temperature∝ SpringForcesor we can say at eachiteration the heat is being cooled down.
One can easily build such a method throughsynchronized iterations. We have tuned algorithmtemperature cooling mechanism such that while operatingon Power-Nodes temperature slowly cools down, as theseare core nodes and need maximum temperature throughwhich maximum force value can be exerted upon thesenodes. On the other hand, when algorithm calculatesforces on Non-Power nodes, temperature falls quickly byrapid cooling as it is least important to exert equal amountof force on non-power nodes as compared topower-nodes.
Logically, power-nodes need high temperature whichis slowly decreasing and non-Power should needrelatively low temperature which is rapidly decreasing,because of their least importance. By tuning this coolingmechanism, we achieved significant improvement inlayout (tightly coupled cluster built around power-nodes)and performance as temperature rapidly decreases onpower-nodes thus saving iterations and execution time.
3.2 Time Complexity
The major pitfall in the traditional force-directedalgorithm is its complexity which isΘ(
∣
∣V2∣
∣+ |E|), whereV are Vertices andE are Edges. In our algorithm the timecomplexity for each function is as under:
–Attractive Force⇒Θ(∣
∣Vp∣
∣
∣
∣Ep∣
∣)
–Repulsive Force⇒Θ(∣
∣Vp2∣
∣)
–Forces Complexity⇒Θ(∣
∣Vp∣
∣ · (∣
∣Vp∣
∣+∣
∣Ep∣
∣))–Vp→ Number of Power Nodes.–Ep→Number of Edges connected to Power Nodes–Moreover,Vp≪V andEp≪ E
Force complexity of our proposed power-law basedalgorithm is significantly reduced as compare toforce-directed algorithm’s forces complexity. Moreover,the complexity of each function is almost linear thereforetotal complexity of power-law based algorithm is alsolinear which indicates significant improvement incomplexity.
3.3 Refinements and Optimizations
In the previous section, we claimed that|Vp| ≪ |V| and|Ep| ≪ |E|. We optimized our algorithm along withperformance tweaks due to which we are able to gainsignificant performance as well as more aesthetic andclear visualization of semantic net.
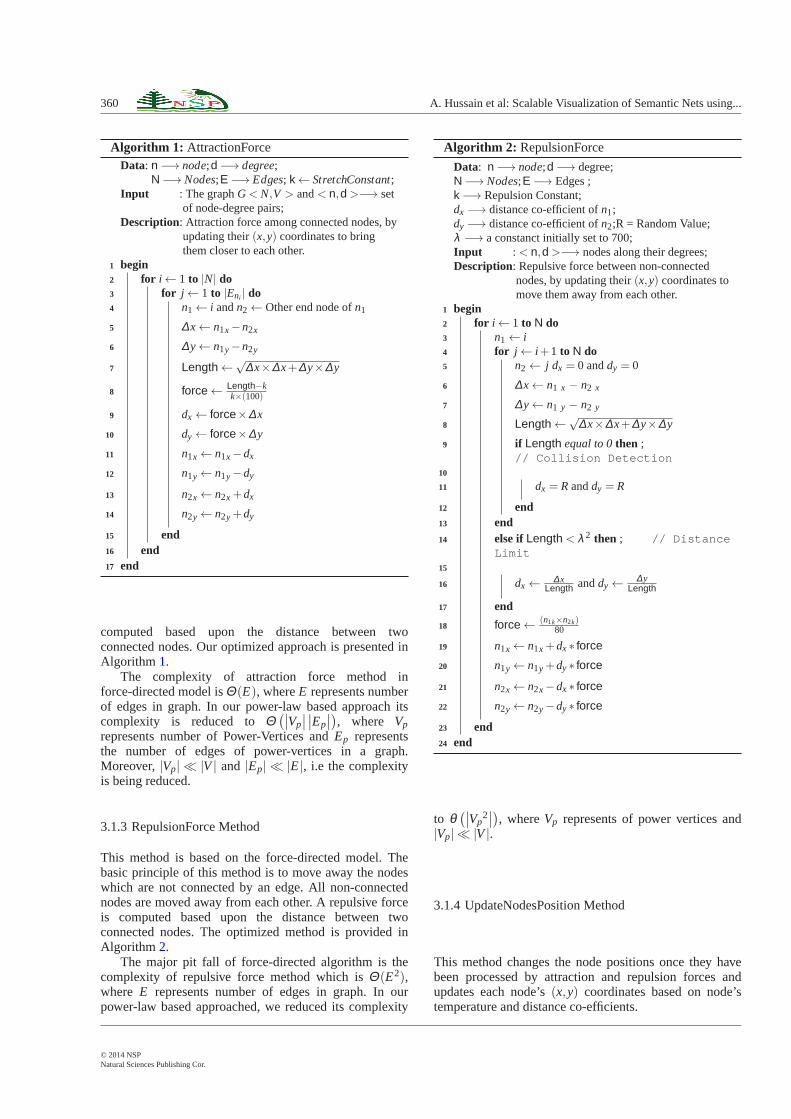
3.3.1 Semantic Based Filtration
It has been observed that in an ontology many conceptsare linked with model specific core nodes such asrdf:Class. When an ontology is visualized, many edgesseem connected to the RDF and OWL specific core nodes.By considering this fact we have applied the filteringprocess on graph drawing canvas. Figure5 explains theview-complexity over Amino Acid Ontology of 1,484Triples which has been reduced due to filtration process.
Fig. 5: Semantic filtration (a) Unfiltered graph, (b) Filtered graph
We have filtered primitive constructs of RDF, RDFS,OWL, and XML. Similarly, we also filtered the primitiveconstructs related to predicates ofRDF, RDFS, OWL,XML. Any built up edges due to this property are notshown in graph like propertiesrdf:Domain, rdf:Range,however, we do not loss the semantics of visualization byretaining all the information in a tool-tip over nodes. TheTable1 explains the filtered number of nodes and edgesas compared to un-filtered.
Table 1: Filtration statistics on nodes and edges
TriplesUnfiltered Graph Filtered Graph
Nodes Edges Nodes Edges1,515 474 1,515 246 1,2455,527 3,045 5,527 1,738 3,4677,330 3,090 7,330 1,052 2,14910,893 5,937 10,893 3,446 6,83016,229 8,697 16,629 5,097 10,25047,003 34,291 47,003 11,767 23,490
© 2014 NSPNatural Sciences Publishing Cor.
362 A. Hussain et al: Scalable Visualization of Semantic Nets using...
4 Implementation Details
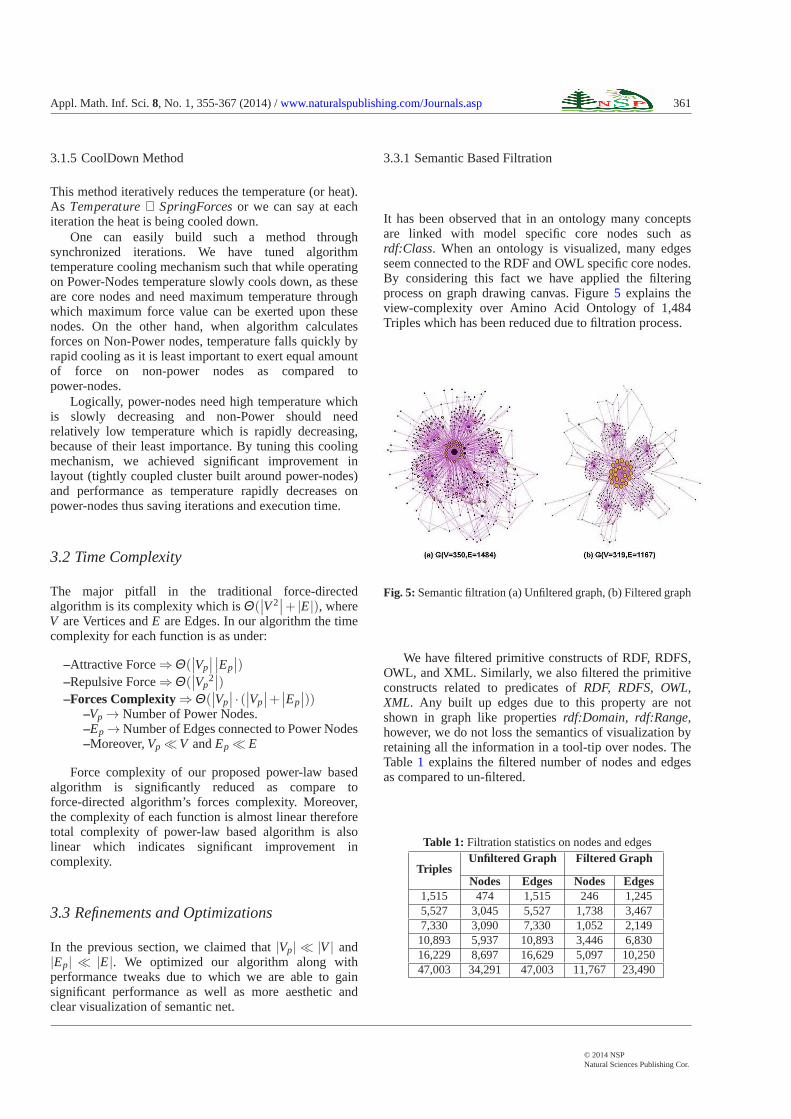
We implemented the power-law based semantic netvisualization algorithm in a tool calledNavigOwl2. It isdeveloped in Java and for graph drawing we usedPiccolo3. Jena4 is used for the processing of semanticmodels.
Fig. 6: Snapshot of NavigOwl.
The tool enriched with complete ontologyvisualization contains whole role-relation hierarchy ofeach concept (node) and has applied semantic basedfiltration as we have discussed in Section3.3.1. This toolsupports RDF and OWL ontology files. The snapshot ofNavigOwl is given in Figure6. It supports many featuresas listed below:
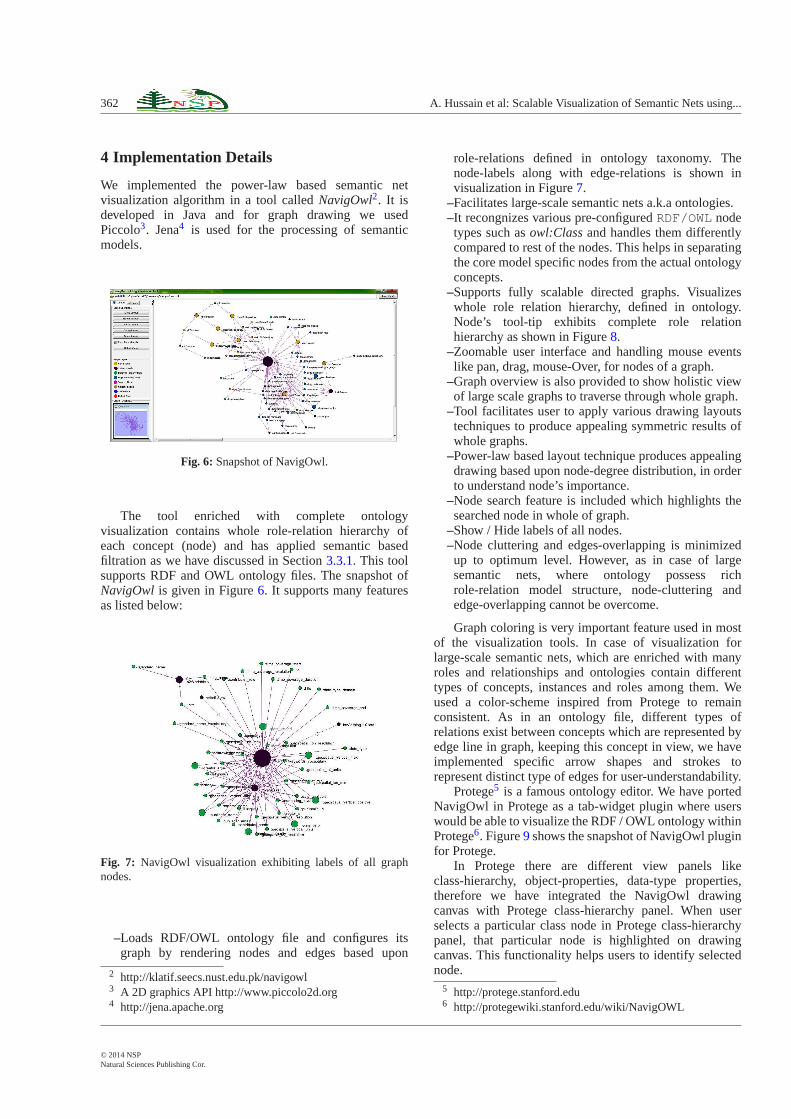
Fig. 7: NavigOwl visualization exhibiting labels of all graphnodes.
–Loads RDF/OWL ontology file and configures itsgraph by rendering nodes and edges based upon
2 http://klatif.seecs.nust.edu.pk/navigowl3 A 2D graphics API http://www.piccolo2d.org4 http://jena.apache.org
role-relations defined in ontology taxonomy. Thenode-labels along with edge-relations is shown invisualization in Figure7.
–Facilitates large-scale semantic nets a.k.a ontologies.–It recongnizes various pre-configuredRDF/OWL nodetypes such asowl:Classand handles them differentlycompared to rest of the nodes. This helps in separatingthe core model specific nodes from the actual ontologyconcepts.
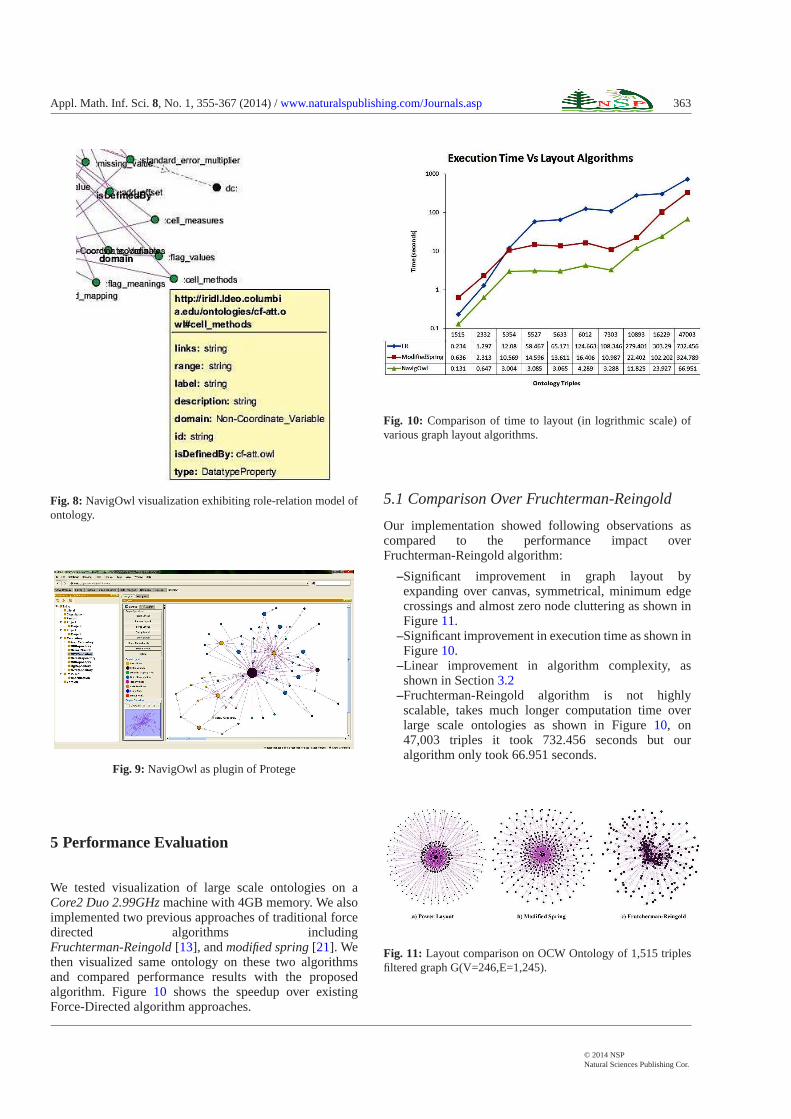
–Supports fully scalable directed graphs. Visualizeswhole role relation hierarchy, defined in ontology.Node’s tool-tip exhibits complete role relationhierarchy as shown in Figure8.
–Zoomable user interface and handling mouse eventslike pan, drag, mouse-Over, for nodes of a graph.
–Graph overview is also provided to show holistic viewof large scale graphs to traverse through whole graph.
–Tool facilitates user to apply various drawing layoutstechniques to produce appealing symmetric results ofwhole graphs.
–Power-law based layout technique produces appealingdrawing based upon node-degree distribution, in orderto understand node’s importance.
–Node search feature is included which highlights thesearched node in whole of graph.
–Show / Hide labels of all nodes.–Node cluttering and edges-overlapping is minimizedup to optimum level. However, as in case of largesemantic nets, where ontology possess richrole-relation model structure, node-cluttering andedge-overlapping cannot be overcome.
Graph coloring is very important feature used in mostof the visualization tools. In case of visualization forlarge-scale semantic nets, which are enriched with manyroles and relationships and ontologies contain differenttypes of concepts, instances and roles among them. Weused a color-scheme inspired from Protege to remainconsistent. As in an ontology file, different types ofrelations exist between concepts which are represented byedge line in graph, keeping this concept in view, we haveimplemented specific arrow shapes and strokes torepresent distinct type of edges for user-understandability.
Protege5 is a famous ontology editor. We have portedNavigOwl in Protege as a tab-widget plugin where userswould be able to visualize the RDF / OWL ontology withinProtege6. Figure9 shows the snapshot of NavigOwl pluginfor Protege.
In Protege there are different view panels likeclass-hierarchy, object-properties, data-type properties,therefore we have integrated the NavigOwl drawingcanvas with Protege class-hierarchy panel. When userselects a particular class node in Protege class-hierarchypanel, that particular node is highlighted on drawingcanvas. This functionality helps users to identify selectednode.
5 http://protege.stanford.edu6 http://protegewiki.stanford.edu/wiki/NavigOWL
© 2014 NSPNatural Sciences Publishing Cor.
Appl. Math. Inf. Sci.8, No. 1, 355-367 (2014) /www.naturalspublishing.com/Journals.asp 363
Fig. 8: NavigOwl visualization exhibiting role-relation model ofontology.
Fig. 9: NavigOwl as plugin of Protege
5 Performance Evaluation
We tested visualization of large scale ontologies on aCore2 Duo 2.99GHzmachine with 4GB memory. We alsoimplemented two previous approaches of traditional forcedirected algorithms includingFruchterman-Reingold[13], andmodified spring[21]. Wethen visualized same ontology on these two algorithmsand compared performance results with the proposedalgorithm. Figure10 shows the speedup over existingForce-Directed algorithm approaches.
Fig. 10: Comparison of time to layout (in logrithmic scale) ofvarious graph layout algorithms.
5.1 Comparison Over Fruchterman-Reingold
Our implementation showed following observations ascompared to the performance impact overFruchterman-Reingold algorithm:
–Significant improvement in graph layout byexpanding over canvas, symmetrical, minimum edgecrossings and almost zero node cluttering as shown inFigure11.
–Significant improvement in execution time as shown inFigure10.
–Linear improvement in algorithm complexity, asshown in Section3.2
–Fruchterman-Reingold algorithm is not highlyscalable, takes much longer computation time overlarge scale ontologies as shown in Figure10, on47,003 triples it took 732.456 seconds but ouralgorithm only took 66.951 seconds.
Fig. 11: Layout comparison on OCW Ontology of 1,515 triplesfiltered graph G(V=246,E=1,245).
© 2014 NSPNatural Sciences Publishing Cor.
364 A. Hussain et al: Scalable Visualization of Semantic Nets using...
5.2 Comparison Over Modified-Spring
Similar implementation showed following observations ascompared to the performance impact over Modified springalgorithm [21]:
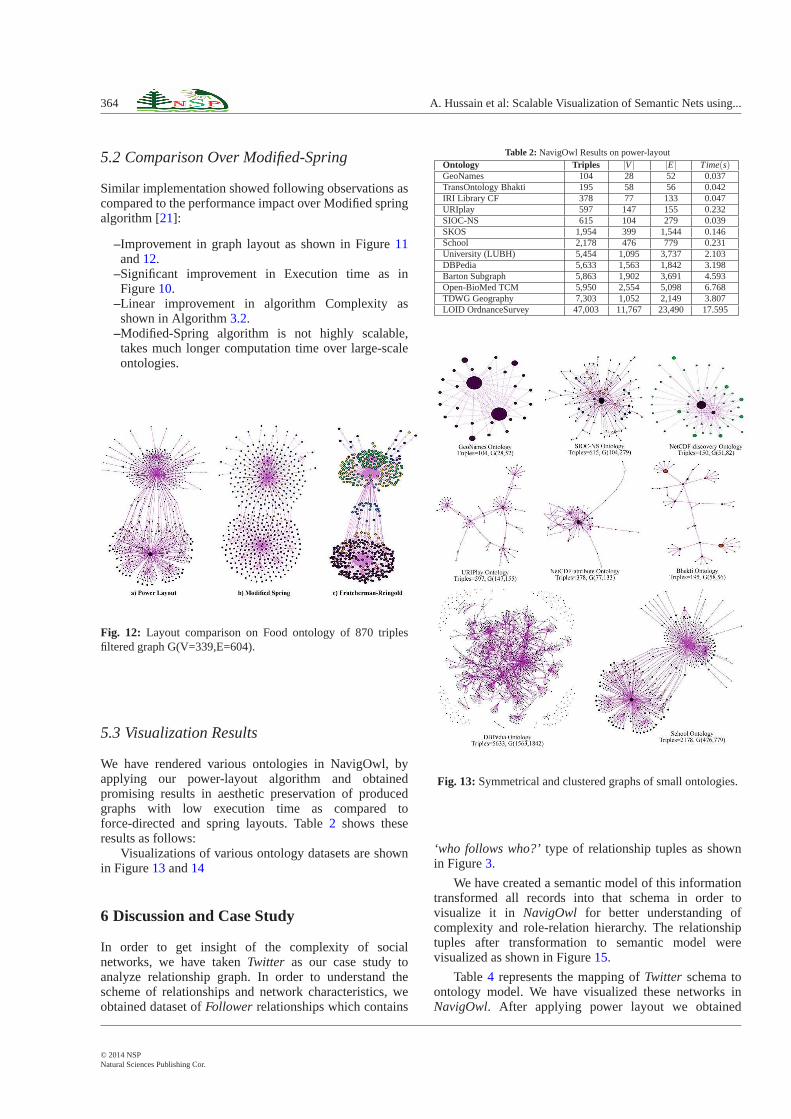
–Improvement in graph layout as shown in Figure11and12.
–Significant improvement in Execution time as inFigure10.
–Linear improvement in algorithm Complexity asshown in Algorithm3.2.
–Modified-Spring algorithm is not highly scalable,takes much longer computation time over large-scaleontologies.
Fig. 12: Layout comparison on Food ontology of 870 triplesfiltered graph G(V=339,E=604).
5.3 Visualization Results
We have rendered various ontologies in NavigOwl, byapplying our power-layout algorithm and obtainedpromising results in aesthetic preservation of producedgraphs with low execution time as compared toforce-directed and spring layouts. Table2 shows theseresults as follows:
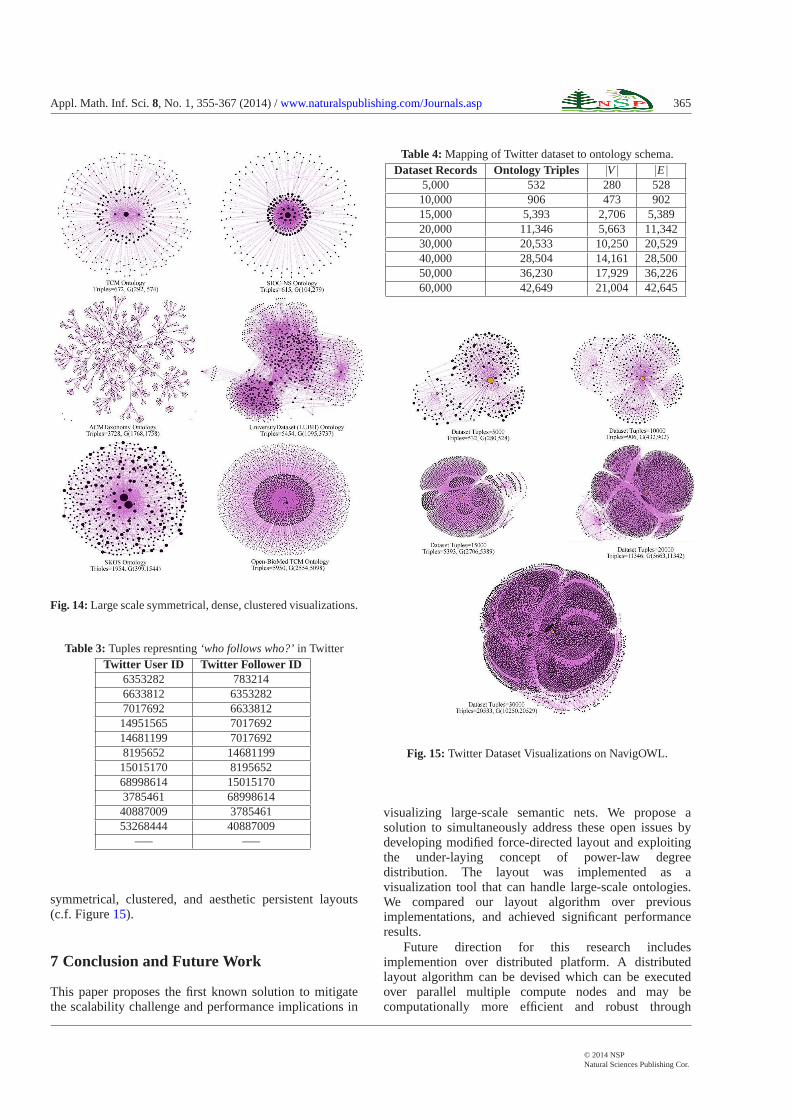
Visualizations of various ontology datasets are shownin Figure13and14
6 Discussion and Case Study
In order to get insight of the complexity of socialnetworks, we have takenTwitter as our case study toanalyze relationship graph. In order to understand thescheme of relationships and network characteristics, weobtained dataset ofFollower relationships which contains
Table 2: NavigOwl Results on power-layoutOntology Triples |V| |E| Time(s)GeoNames 104 28 52 0.037TransOntology Bhakti 195 58 56 0.042IRI Library CF 378 77 133 0.047URIplay 597 147 155 0.232SIOC-NS 615 104 279 0.039SKOS 1,954 399 1,544 0.146School 2,178 476 779 0.231University (LUBH) 5,454 1,095 3,737 2.103DBPedia 5,633 1,563 1,842 3.198Barton Subgraph 5,863 1,902 3,691 4.593Open-BioMed TCM 5,950 2,554 5,098 6.768TDWG Geography 7,303 1,052 2,149 3.807LOID OrdnanceSurvey 47,003 11,767 23,490 17.595
Fig. 13: Symmetrical and clustered graphs of small ontologies.
‘who follows who?’type of relationship tuples as shownin Figure3.
We have created a semantic model of this informationtransformed all records into that schema in order tovisualize it in NavigOwl for better understanding ofcomplexity and role-relation hierarchy. The relationshiptuples after transformation to semantic model werevisualized as shown in Figure15.
Table4 represents the mapping ofTwitter schema toontology model. We have visualized these networks inNavigOwl. After applying power layout we obtained
© 2014 NSPNatural Sciences Publishing Cor.
Appl. Math. Inf. Sci.8, No. 1, 355-367 (2014) /www.naturalspublishing.com/Journals.asp 365
Fig. 14:Large scale symmetrical, dense, clustered visualizations.
Table 3: Tuples represnting‘who follows who?’in TwitterTwitter User ID Twitter Follower ID
6353282 7832146633812 63532827017692 663381214951565 701769214681199 70176928195652 1468119915015170 819565268998614 150151703785461 6899861440887009 378546153268444 40887009
—– —–
symmetrical, clustered, and aesthetic persistent layouts(c.f. Figure15).
7 Conclusion and Future Work
This paper proposes the first known solution to mitigatethe scalability challenge and performance implications in
Table 4: Mapping of Twitter dataset to ontology schema.Dataset Records Ontology Triples |V| |E|
5,000 532 280 52810,000 906 473 90215,000 5,393 2,706 5,38920,000 11,346 5,663 11,34230,000 20,533 10,250 20,52940,000 28,504 14,161 28,50050,000 36,230 17,929 36,22660,000 42,649 21,004 42,645
Fig. 15: Twitter Dataset Visualizations on NavigOWL.
visualizing large-scale semantic nets. We propose asolution to simultaneously address these open issues bydeveloping modified force-directed layout and exploitingthe under-laying concept of power-law degreedistribution. The layout was implemented as avisualization tool that can handle large-scale ontologies.We compared our layout algorithm over previousimplementations, and achieved significant performanceresults.
Future direction for this research includesimplemention over distributed platform. A distributedlayout algorithm can be devised which can be executedover parallel multiple compute nodes and may becomputationally more efficient and robust through
© 2014 NSPNatural Sciences Publishing Cor.
366 A. Hussain et al: Scalable Visualization of Semantic Nets using...
exploitation of under-laying parallel computing benefits.Moreover, we also plan to further enrich visualization toolwith ontology editing, text searching and SPARQL queryoptions along with formal assessment of our results overmore complex large-scale semantic nets.
Acknowledgement
The authors acknowledge the financial support by the ICTR&D Fund (Pakistan) project on Semantic Search andFiltering.
References
[1] H. Akama, M. Miyake, and J. Jung. A New EvaluationMethod for the Graph Clustering of Semantic NetworksBuilt from Lexical Co-occurrence Information. Japan,2009.
[2] R. Andersen, F. Chung, and L. Lu. Drawing power lawgraphs using local/global decomposition.Twelfth AnnualSymposium on Graph Drawing, 2004.
[3] Mike Bergman. Large-scale rdf graph visualizationtools. http://www.mkbergman.com/414/large-scale-rdf-graph-visualization-tools.
[4] R. Bourqui, D. Auber, and P. Mary. How to drawclusteredweighted graphs using a multilevel force-directedgraph drawing algorithm. InInformation Visualization,2007. IV’07. 11th International Conference, pages 757–764.IEEE, 2007.
[5] F. Boutin, J. Thievre, and M. Hascoet. Focus-based filtering+ clustering technique for power-law networks with smallworld phenomenon.SPIE-IS & T Electronic Imaging, 6060,2006.
[6] D.S.M. Chan, K.S. Chua, C. Leckie, and A. Parhar.Visualisation of power-law network topologies. InNetworks, 2003. ICON2003. The 11th IEEE InternationalConference on, pages 69–74. IEEE, 2004.
[7] C. Chen. Information visualization: Beyond the horizon.Springer-Verlag New York Inc, 2004.
[8] P Eades. A heuristic for graph drawing. CongressNumerantium, 42:149–160, 1984.
[9] P. Eades. Navigating clustered graphs using force-directedmethods. Journal of Graph Algorithms and Applications,4(3):157–181, 2000.
[10] P. Eades and X. Lin. Spring algorithms and symmetry.Computing and Combinatorics, pages 202–211, 1997.
[11] P. Eklund, N. Roberts, and S. Green. Ontorama: Browsingrdf ontologies using a hyperbolic-style browser. InCyberWorlds, 2002. Proceedings. First International Symposiumon, pages 405–411. IEEE, 2003.
[12] M. Forman, J. Haralambides, F. T. Leighton Kaufmann,A. Simvonis, E. Welzl, and G. Woeginger. Drawing graphsin the plane with high resolution. SIAM Journal onComputing, 22(5):1035–1052, 1993.
[13] T.M.J. Fruchterman and E.M. Reingold. Graph drawingby force-directed placement. Software: Practice andExperience, 21(11):1129–1164, 1991.
[14] V. Geroimenko and C. Chen.Visualizing the semantic web:XML-based internet and information visualization, chapterSpring-Embedded Graphs for Semantic Visualization, pages172–182. Springer-Verlag New York Inc, 2006.
[15] M. Girvan and M.E.J. Newman. Community structures insocial and biological networks.PINAS, 99(12):7821–7826,2002.
[16] J. Golbeck and P. Mutton. Force-Directed DrawingAlgorithms, chapter Force-Directed Drawing Algorithms,pages 8493–8957. CRC Press LLC, 2004.
[17] M.L. Huang, P. Eades, and J. Wang. On-line animatedvisualization of huge graphs using a modified springalgorithm. Journal of Visual Languages & Computing,9(6):623–645, 1998.
[18] A. Katifori, C. Halatsis, G. Lepouras, C. Vassilakis, andE. Giannopoulou. Ontology visualization methods: a survey.ACM Computing Surveys (CSUR), 39(4):10, 2007.
[19] A. Katifori, E. Torou, C. Halatsis, G. Lepouras, andC. Vassilakis. A comparative study of four ontologyvisualization techniques in prot ´ege: Experiment setup andpreliminary results. InInformation Visualization, IV 2006.,pages 417–423. IEEE, 2006.
[20] M. Lanzenberger, J. Sampson, and M. Rester. Visualizationin ontology tools. InInternational Conference on Complex,Intelligent and Software Intensive Systems, pages 705–711.IEEE, 2009.
[21] C.C. Lin and H.C. Yen. A new force-directed graph drawingmethod based on edge-edge repulsion.IEEE ComputerSociety, 2005.
[22] J. Lin and C. Dyer. Data-Intensive Text Processing withMapReduce, chapter Graph Algorithms. University ofMaryland, College Park, 2010.
[23] K. Misue, P. Eades, W. Lai, and K. Sugiyama. Layoutadjustment and the mental map. Journal of VisualLanguages and Computing, 6(2):183–210, 1995.
[24] H. Omote and K. Sugiyama. Method for drawingintersecting clustered graphs and its application to webontology language. InProceedings of the 2006 Asia-PacificSymposium on Information Visualisation-Volume 60, pages89–92. Australian Computer Society, Inc., 2006.
[25] H.C. Purchase. Metrics for graph drawing aesthetics.Journal of Visual Languages & Computing, 13(5):501–516,2002.
[26] M. Sarkar and M.H. Brown. Graphical fisheye views ofgraphs. InProceedings of the SIGCHI conference on Humanfactors in computing systems, pages 83–91. ACM, 1992.
[27] Wallner.G. Force directed embedding of hierarchical clustergraphs. In1st International Conference on Relations,Orders and Graphs: Interaction with Computer Science,Mahdia, Tunesia, volume 17. ROGIS08, 2008.
[28] C. Walshaw. A multilevel algorithm for force-directed graphdrawing. InGraph Drawing, pages 31–55. Springer, 2001.
[29] C. Walshaw. A multilevel algorithm for force-directed graphdrawing. Journal of Graph Algorithms and Applications,7(3):253–285, 2003.
[30] X. Xu, N. Yuruk, Z. Feng, and T.A.J. Schweiger. Scan: astructural clustering algorithm for networks. InProceedingsof the 13th ACM SIGKDD international conference onKnowledge discovery and data mining, pages 824–833.ACM, 2007.
© 2014 NSPNatural Sciences Publishing Cor.

Appl. Math. Inf. Sci.8, No. 1, 355-367 (2014) /www.naturalspublishing.com/Journals.asp 367
[31] K.P. Yee, D. Fisher, R. Dhamija, and M. Hearst. Animatedexploration of dynamic graphs with radial layout. Ininfovis,page 43. Published by the IEEE Computer Society, 2001.
[32] N. Yuruk, M. Mete, X. Xu, and T.A.J. Schweiger. A divisivehierarchical structural clustering algorithm for networks.icdmw, pages 441–448, 2007.
© 2014 NSPNatural Sciences Publishing Cor.