scale 4.4 validation for the dfs system at srs/67531/metadc... · scale 4.4 validation for the dfs...
TRANSCRIPT

WSRC-TR-99-OOI 98, Rev. O
Scale 4.4 Validation for the DFS System at SRS
by
A. Blanchard
Westinghouse Savannah River CompanySavannah River SiteAiken, South Carolina 29808
B. T. BarankoWSMS
DOE Contract No. DE-AC09-96SR18500
003-i
on44
w
Ill
This paper was prepared in connection with work done under the above contract number with the U. S.Department of Energy. By acceptance of this paper, the publisher ancfforrecipient acknowledges the U. S.Government’s right to retain a nonexclusive, royalty-free license in and to any copyright covering this paper,along with the right to reproduce and to authorize others to reproduce all or part of the copyrighted paper.
DISCLAIMER
This report was prepared as an account of work sponsored by an agency of the United StatesGovernment. Neither the United States Government nor any agency thereof, nor any of theiremployees, makes any warranty, express or implied, or assumes any legal liability orresponsibility for the accuracy, completeness, or usefulness of any information, apparatus,product, or process disclosed, or represents that its use would not infringe privately ownedrights. Reference herein to any specific commercial product, process, or service by trade name,trademark, manufacturer, or otherwise does not necessarily constitute or imply its endorsement,recommendation, or favoring by the United States Government or any agency thereof. Theviews and opinions of authors expressed herein do not necessarily state or reflect those of theUnited States Government or any agency thereof.
This report has been reproduced directly from the best available copy.
Available to DOE and DOE contractors from the Office of Scientific and Technical Information,P. O. Box 62, Oak Ridge, TN 37831;prices available from (423)576-8401.
Available to the public from the National Technical Information Service, U. S. Department ofCommerce, 5285 Port Royal Road, Springfield, VA 22161.

DISCLAIMER
Portions of this document may be illegiblein electronic image products. Images areproduced from the best available originaldocument.
.. I

Westinghouse Safety Management SolutionsCriticality Technology Group
WSRC-TR-99-00198
July 7, 1999
SCALE 4.4 Validation for the DFS System at SRS (U)
Originators:
Technical
Manager:
. ?+?’??B.T. Baranko Date
Criticality Technology Group
-@&+-Reviewer:
_&pj’GrOup ~,,,
S. M. Revolinski ateRadiological& Spent Fuel Engineering
Criticality Technology Group
7/@qDate
UNCLASSIFIEDDOESNOTCONTAIN
UNCLASSIFIEDCONTROLLEDNUCLEAR1NFORMATION
ADC&
4“ReviewingOfficial: LJ ~
Date:~ $J~;~~ Title)
,
Distribution
C.E. ‘Apperson Jr CCC-3B.T. Baranko CCC-3D. Biswas ccc-3A. Blanchard 730-BJ. Brotherton ccc-3D. Dolin 704-2HN.J. Jordan 707-C
B.R. Kerr 704-2H M: Harris 707-C
S.M. Revolinsli CCC-3 J. Bryce 707-CO. Rivera ccc-3 WSMS/CRT Files
M.A. Rosser 703-F Records 773-5 1A
R. Webb 773-42AE.F. Trumble ccc-3M. Nadeau 707-C

< , WSRC-TR-99-00 198 SCALE 4.4 Validation for the DFS System at SRS Page 2 of 99(Rev. O)
Prologue
WSRC SCALE 4.4 Validation
SCALE 4.4 has been validated on the WSMS DEC Alpha machines in the CentennialComplex. As this same version of the code will be run at WSRC on their RS/6000workstations under the Distributed File System (DFS), it was desirable to determine if thevalidation that was performed for SCALE 4.4 on the WSMS platform could be used forthe WSRC platform as well. In order to determine if the WSMS SCALE 4.4 validationcould be used to efficiently document the WSRC SCALE 4.4 validation, a comparison ofresults was performed. Representative samples of input files from each of the majorfissile types and forms were run under the SRS certified SCALE 4.4 code (Ref. 26, 27),and outputs subsequently compared to their WSMS counterparts. The results of thesecomparisons cordlrm that the two platforms provide statistically similar ~ff anduncertainty values, without the introduction of an additional bias. This outcome providessufficient certification that the WSMS SCALE 4.4 validation is directly comparable asthe SRS validation for SCALE 4.4 on DFS. Appendices D and E contain discussiondetailing the validity of this argument, and present the results of this comparison. Theresults of this comparison confmn that it is appropriate and logical to use the bias andbias uncertainties calculated in the WSMS SCALE 4.4 Validation for analysis withSCALE 4.4 ~erformed on the WSRC svstem.
The input files for the SRS SCALE 4.4 validation experiments can be found in the/raidl/packages/crit/ValidationLScale4.x directory on the WSMS DEC Alpha workstationplatform. Output files have been saved to a compact disk, held by the owner of theSCALE 4.4 CTF notebook (Ref. 26). The remainder of this document (with theexception of Appendices D and E, and formatting such as page numbering) is identical tothe WSMS SCALE 4.4 validation document.

WSRC-TR-99-00198 SCALE -1.4Validation for the DFS System at SRS(Rev. O)
\ 3
Contents
1.
2.
3.
4.
5.
6.7.
Introduction
Calculation Methodology
Bias and Uncertainty CalculationsSutmmary of Results
Plutonium Systems4.1 Metal
4.1.1
4.1.24.1.3
4.1.4
4.2 Solution
4.2.1
4.2.2
4.2.34.2.4
Area of ApplicabilitySystem DescriptionsBias and UncertaintyLimitations
Area of App~icabilitySystem DescriptionsBias and UncertaintyLimitations
Uranium Systems5.1 Metal
5.1.15.1.25.1.35.1.4
5.2 Solution5.2.15.2.25.2.35.2.4
Area of ApplicabilitySystem DescriptionsBias and UncertaintyLimitations
Area of ApplicabilitySystem DescriptionsBias and Uncertainty
Limitations5.3 RBOFFuels
5.3.1 Explicitly Modeled MTR Type Fuel5.3.1.1 Area of Applicability5.3.1.2 System Descriptions5.3.1.3 Bias and Uncertainty5.3.1.4 Limitations
5.3.2 Homogeneously Modeled MTR Type Fuel5.3.2.1 Area of Applicability5.3.2.2 System Descriptions5.3.2.3 Bias and Bias Uncertainty5.3.2.4 Limitations
AcknowledgmentsReferences
Appendix A: Validation Results and ParametersAppendix B: Tally Information by Benchmark ExperimentAppendix C: Sample Input FilesAppendix D: 27 Group Comparison ResultsAppendix E: 238 Group Comparison Results
4
5
6688
16
2727
40
5252
55
57586070719698
W’SRC-TR-99-00 I 98 SCALE 4.4 Validation for the DFS System at SRS? (Rev. 0)
Page 4 of 99
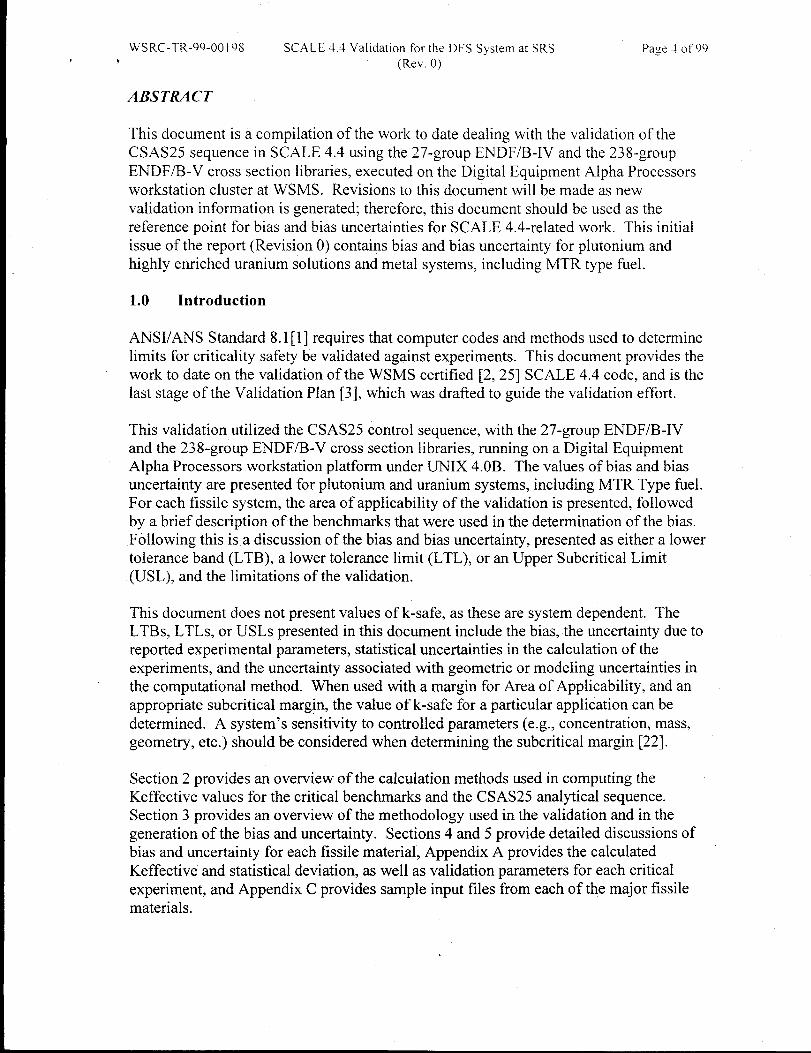
ABSTRACT
This document is a compilation of the work to date dealing with the validation of theCSAS25 sequence in SCALE 4.4 using the 27-group ENDF/B-IV and the 258-groupENDF/B-V cross section libraries, executed on the Digital Equipment Alpha Processorsworkstation cluster at WSMS. Revisions to this document will be made as newvalidation information is generated; therefore, this document should be used as thereference point for bias and bias uncertainties for SCALE 4.4-related work. This initialissue of the report (Revision O) contains bias and bias uncertainty for plutonium andhighly enriched uranium solutions and metal systems, including MTR type fuel.
1.0 Introduction
ANSI/ANS Standard 8.1 [1] requires that computer codes and methods used to determinelimits for criticality safety be validated against experiments. This document provides thework to date on the validation of the WSMS certified [2, 25] SCALE 4.4 code, and is thelast stage of the Validation Plan [3], which was drafted to guide the validation effort.
This validation utilized the CSAS25 control sequence, with the 27-group ENDF/B-IVand the 238-group ENDF/B-V cross section libraries, running on a Digital EquipmentAlpha Processors workstation platform under UNIX 4.OB. The values of bias and biasuncertainty are presented for plutonium and uranium systems, including MTR Type fuel.For each fissile system, the area of applicability of the validation is presented, followedby a brief description of the benchmarks that were used in the determination of the bias.Following this is a discussion of the bias and bias uncertainty, presented as either a lowertolerance band (LTB), a lower tolerance limit (LTL), or art Upper Subcritical Limit(USL), and the limitations of the validation.
This document does not present values of k-safe, as these are system dependent. TheLTBs, LTLs, or USLS presented in this document include the bias, the uncertainty due toreported experimental parameters, statistical uncertainties in the calculation of theexperiments, and the uncertainty associated with geometric or modeling uncertainties inthe computational method. When used with a margin for Area of Applicability, and anappropriate subcritical margin, the value of k-safe for a particular application can bedetermined. A system’s sensitivity to controlled parameters (e.g., concentration, mass,geometry, etc.) should be considered when determining the subcritical margin [22].
Section 2 provides an overview of the calculation methods used in computing theKeffective values for the critical benchmarks and the CSAS25 analytical sequence.Section 3 provides an overview of the methodology used in the validation and in thegeneration of the bias and uncertainty. Sections 4 and 5 provide detailed discussionsbias and uncertainty for each fissile material, Appendix A provides the calculatedKeffective and statistical deviation, as well as validation parameters for each critical
of
experiment, and Appendix C provides sample input files from each of the major fissilematerials.
W’SRC-TR-99-00198
2.0 Calculation
SCALE -!.4 Validation for the DFS System at SRS
(Rev. O)
Methodology
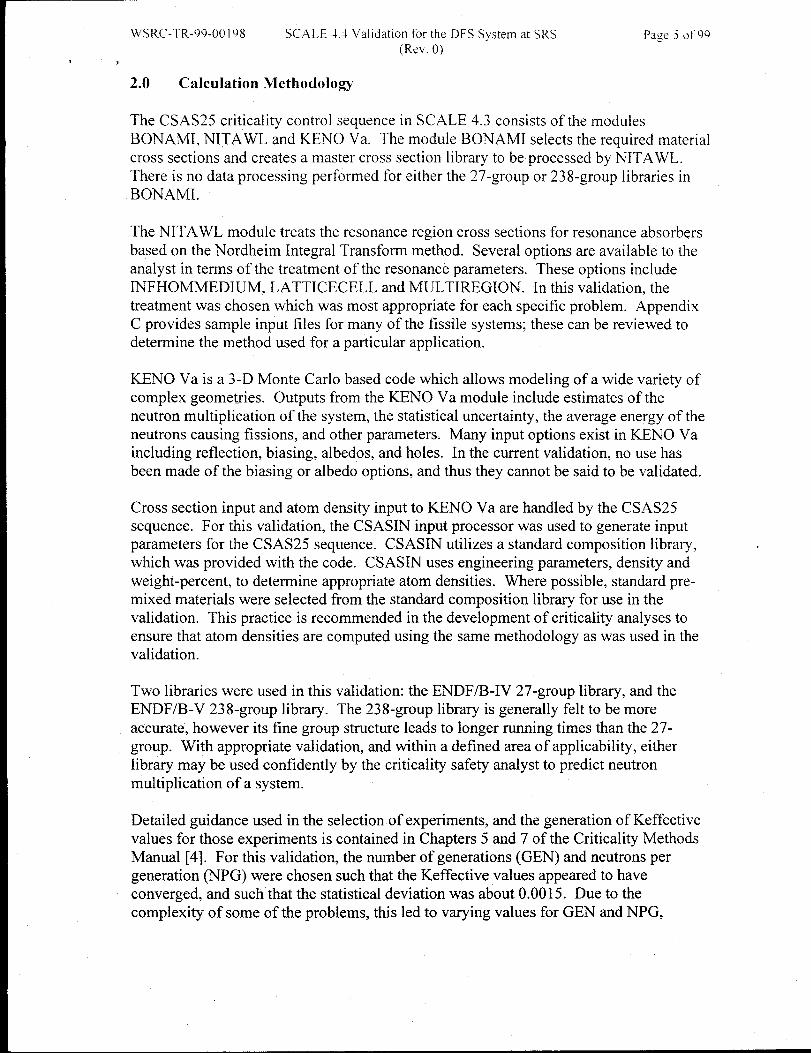
The CSAS25 criticality control sequence in SCALE 4.3 consists of the modulesBONAMI, NITAWL and KENO Va. The module BONAMI selects the required materialcross sections and creates a master cross section library to be processed by NITAWL.There is no data processing performed for either the 27-group or 23 8-group libraries inBONAMI.
The NITAWL module treats the resonance region cross sections for resonance absorbersbased on the Nordheim Integral Transform method. Several options are available to theanalyst in terms of the treatment of the resonance parameters. These options includeINFHOMMEDIUM, LATTICECELL and MULTIREGION. In this validation, thetreatment was chosen w-hich was most appropriate for each specific problem. AppendixC provides sample input files for many of the fissile systems; these can be reviewed todetermine the method used for a particular application.
KENO Va is a 3-D Monte Carlo based code which allows modeling of a wide variety ofcomplex geometries. Outputs from the KENO Va module include estimates of theneutron multiplication of the system, the statistical uncertainty, the average energy of theneutrons causing fissions, and other parameters. Many input options exist in KENO Vaincluding reflection, biasing, albedos, and holes. In the current validation, no use hasbeen made of the biasing or albedo options, and thus they cannot be said to be validated.
Cross section input and atom density input to KENO Va are handled by the CSAS25sequence. For this validation, the CSASIN input processor was used to generate inputparameters for the CSAS25 sequence. CSASIN utilizes a standard composition library, .which was provided with the code. CSASIN uses engineering parameters, density andweight-percent, to determine appropriate atom densities. Where possible, standard pre-mixed materials were selected from the standard composition library for use in thevalidation. This practice is recommended in the development of criticality analyses toensure that atom densities are computed using the same methodology as was used in thevalidation.
Two libraries were used in this validation: the ENDF/B-IV 27-group library, and theENDF/B-V 238-group library. The 238-group library is generally felt to be moreaccurate, however its fine group structure leads to longer running times than the 27-group. With appropriate validation, and within a defined area of applicability, eitherlibrary may be used confidently by the criticality safety analyst to predict neutronmultiplication of a system.
Detailed guidance used in the selection of experiments, and the generation of Keffectivevalues for those experiments is contained in Chapters 5 and 7 of the Criticality MethodsManual [4]. For this validation, the number of generations (GEN) and neutrons pergeneration (NPG) were chosen such that the Keffective values appeared to haveconverged, and such that the statistical deviation was about 0.0015. Due to thecomplexity of some of the problems, this led to varying values for GEN and NPG,
WSRC-TR-99-00 198 SCALE -1.4Validation for the DFS System at SRS page (j of 99, , (Rev. O)
depending on the particular configuration. Appendix B provides information concerningGEN, NPG, and NSK. while Appendix C provides sample input files, which can be usedfor reference.
3.0 Bias and Uncertainty Methodology
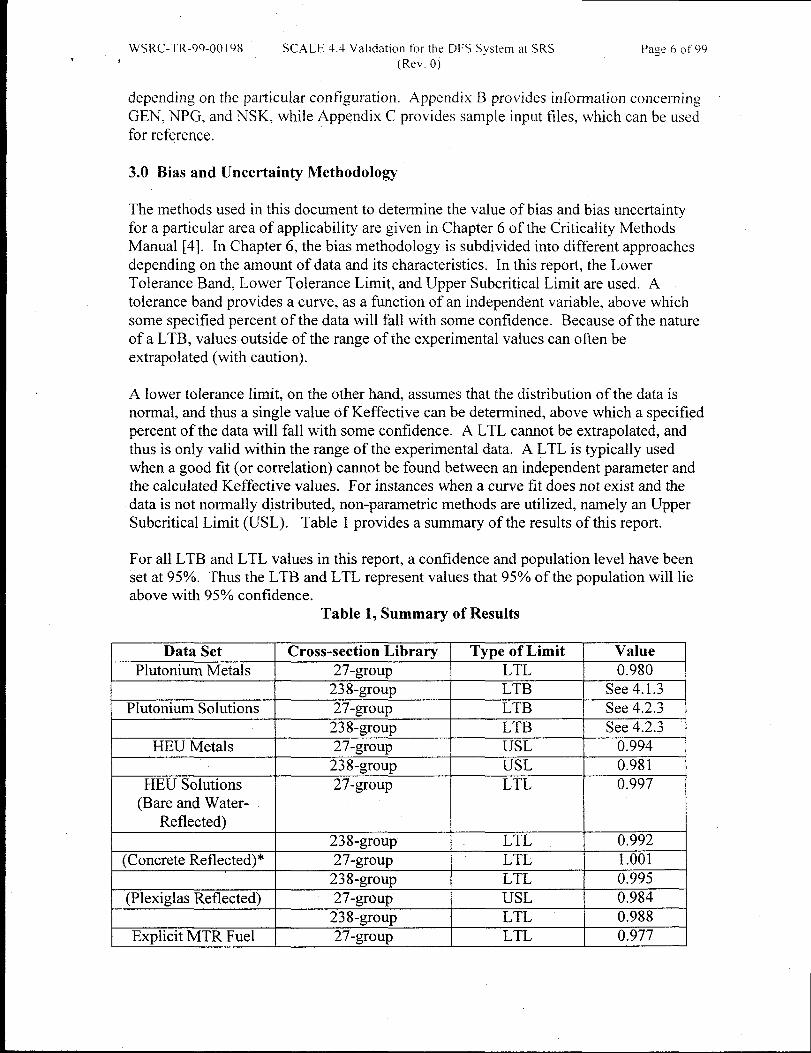
The methods used in this document to determine the value of bias and bias uncertaintyfor a particular area of applicability are given in Chapter 6 of the Criticality MethodsManual [4]. In Chapter 6, the bias methodology is subdivided into different approachesdepending on the amount of data and its characteristics. In this report, the LowerTolerance Band, Lower Tolerance Limit, and Upper Subcritical Limit are used. Atolerance band provides a curve, as a function of an independent variable, above whichsome specified percent of the data will fall with some confidence. Because of the natureof a LTB, values outside of the range of the experimental values can often beextrapolated (with caution).
A Iower tolerance limit, on the other hand, assumes that the distribution of the data isnormal, and thus a single value of Keffective can be determined, above which a specifiedpercent of the data will fall with some confidence. A LTL cannot be extrapolated, andthus is only valid within the range of the experimental data. A LTL is typically usedwhen a good fit (or correlation) cannot be found between an independent parameter andthe calculated Keffective values. For instances when a curve fit does not exist and thedata is not normally distributed, non-parametric methods are utilized, namely an UpperSubcritical Limit (USL). Table 1 provides a summary of the results of this report.
For all LTB and LTL values in this report, a confidence and population level have beenset at 95°/0. Thus the LTB and LTL represent values that 95°/0 of the population will lieabove with 950/0confidence.
Table 1, Summary of Results
Data Set Cross-section Library Type of Limit ValuePlutonium Metals 27-group LTL 0.980
238-group LTB See 4.1.3Plutonium Solutions 27-group LTB See 4.2.3
238-group LTB See 4.2.3HEU Metals 27-group USL 0.994
238-group USL 0.981HEU Solutions 27-group LTL 0.997
(Bare and Water-Reflected)
238-group LTL 0.992
(Concrete Reflected)* 27-group LTL 1.001238-group LTL 0.995
(Plexiglas Reflected) 27-group USL 0.984
238-group LTL 0.988Explicit MTR Fuel 27-group LTL 0.977

WSRC-TR-99-0019S SCALE J.4 Validation for the DFS System at SRS Page 7 OF9Q(Rev. oj
, ,
238-group LTL 0.978Homogeneous MTR 27-,group LTL 0.997
238-group LTL 0.992*See Section 5.2.4

W’SRC-TR-99-00 198 SCALE 4.4 Validation for the DFS System at SRS Pay? s of 99, (Rev. O)
4.0 Plutonium Systems4.1 Plutonium Metal4.1.1 Area of Applicability
This section presents the SCALE validation analysis for plutonium metal systems. Theresult from this analysis is a weighted lower tolerance limit for SCALE with the 27-groupcross sections and a single-sided Iower tolerance band for the 238-group cross sections.Benchmark experiments selected for validation have been previously evaluated and aredocumented inSRT-EMS-96-0017 [5] and N-CLC-H-0178 [6]. Key areas ofapplicability for these experiments include:
1.2.3.4.
;:
7.
Fuel: Plutonium Metal SystemsModeration: H/Pu-239 --0-0.63Pu-240 Content: 4.5 -20.2 wt% PU-2401Moderating Material: None or Slight (Polymer Mock Explosive)Reflecting Material None or HydrogenousGeometry Single Spheres and Arrays of Cylinders
4.2<4 VIS <16.6Neutron Spectrum Fast; 4.4< AEG (27) <7.4
21.3< AEG (238) <50.7
4.1.2 System Description4.1.2.1 Single Unit Plutonium Spheres
Six benchmark experiments have been evaluated and documented inSRT-EMS-96-0017[5]. These experiments were extracted from the International Handbook of EvaluatedCriticality Safety Benchmark Experiments [7]. These experiments utilized spheres ofplutonium metal with different compositions and reflectors. A summary of theexperiment parameters reported in Reference 5 are provided in Table 2.
‘ Please note limitations in Section 4.1.4 before use.

, , WSRC-TR-99-00198 SCALE 4.4 Validation for the DFS System at SRS Page 9 of 99(Rev, O)
Table 2, Reported Pu Metal Sphere Experiment Parameters
Benchmark Descriptor Fuel Alloy Pu Isotopic Composition Sphere Reflector &(Wt %) Radius Thickness
(cm) (cm)239 240 241 242
PU-MET-FAST-OOI 98.98 ‘Yo&phase 95.18 4.52 0.30 0.00 6.3849 NonePu, 1.02 % Ga
PU-MET-FAST-O02 98.99 ?ZO&phase 76.31 20.16 3.12 0.41 6.6595 NonePu, l.Ol%Ga
PU-MET-FAST-005’ 99.00 Y. i$phase 94.77 4.92 0.31 0.00 5.0419 W, 4.699Pu, 1.00% Ga
PU-MET-FAST-008’ 98.99 VO&phase 94.55 5.15 0.30 0.00 5.310 Th, 24.57Pu, 1.01 V. Ga
PU-MET-FAST-O 10’ 99.00 % &phase 94.77 4.92 0.31 0.00 5.0419 U,4.1274Pu, 1.00% Ga
PU-MET-FAST-O 1I 100 % u -phase Pu 94.48 5.20 0.30 0.02 4.1217 HZO,25.4
4.1.2.2 Arrays of Plutonium Metal Cylinders
Three sets of benchmark experiments have been evaluated and documented in N-CLC-H-0178 [6]. Nineteen experiments were extracted from the International Handbook ofEvaluated Criticality Safety Benchmark Experiments [7]. Experimental arrays wereconstructed from canned plutonium metal cylinders. Alpha phase plutonium with thecomposition specified in Table 3 was used for these experiments. Specific details on theexperiments are provided in the following sections.
Table 3, Plutonium Isotopic Composition, Arrays Of Cyiinders
I Benchmark Descriptor I Isotopic Composition II(Wt %)
239 240 I 241 242PU-MET-FAST-003 93.56 I 5.97 0.46 I 0.01PU-MET-FAST-O04 93.56 5.97 0.46 0.01
{
PU-MET-FAST-017 93.56 5.97 0.46 0.01
4.1.2.2.1 PU-MET-FAST-003 [7]
Five experiments involving arrays of plutonium metal cylinders were evaluated [6].Plutonium cylinders were contained within aluminum cans with steel lids.
Square pitched arrays were constructed using single (3 kg) and double (6 kg) parts.Spacing between arrays was maintained by use of aluminum support tubes and spacersfastened to an experimental table by means of a support shoe. Benchmark specificationsfor these experiments did not include an experimental room. Specific details on the
2 This experiment has been omitted from the validation results due to the scarcity of data for this type ofreflector.
WSRC-TR-99-00 198 SCALE 4.4 Validation for the DFS System at SRS
(Rev. O),
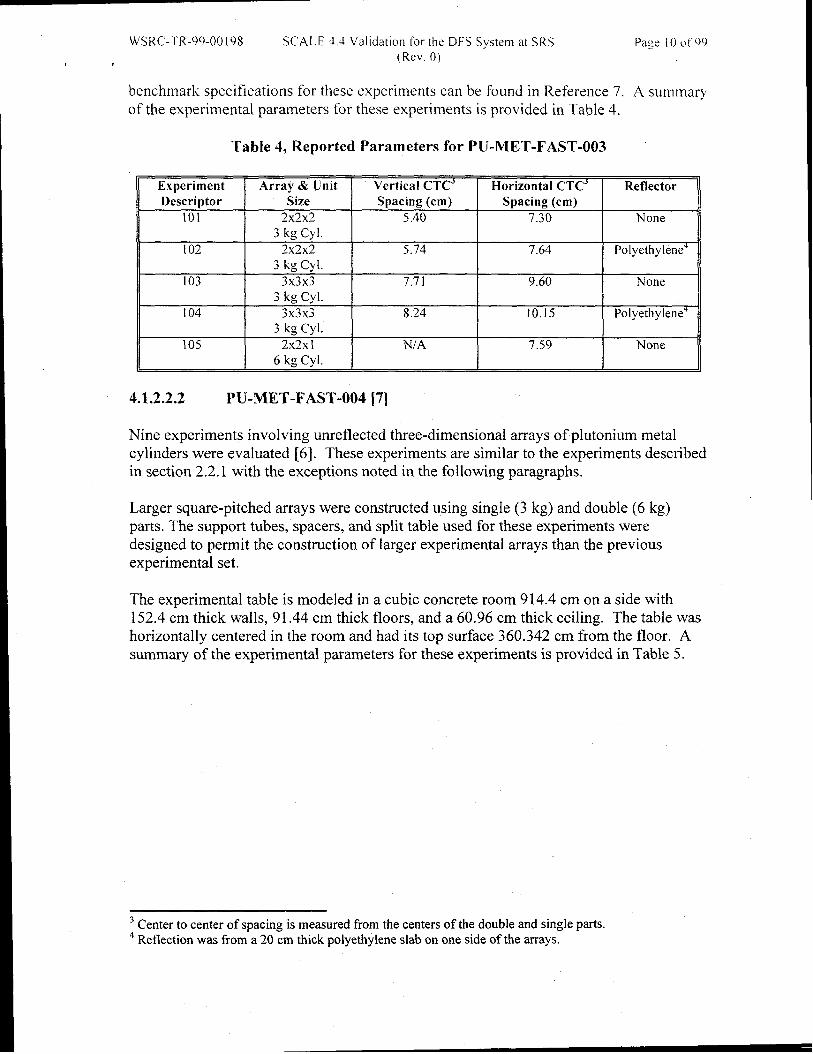
benchmark specifications for these experiments can be found in Reference 7.of the experimental parameters for these experiments is provided in Table 4.
Table 4, Reported Parameters for PU-MET-FAST-O03
page [0 ~f99
A summary
Experiment Array & Unit Vertical CTC’ Horizontal CTC’ ReflectorDescriptor Size Spacing (cm) Spacing (cm)
10} 2X2X2 5.40 7.30 None3 kg Cy].
102 2X2X2 5.74 7.64 Polyethylene”3 kg Cy[.
103 3X3X3 7.71 9.60 None3 kg Cyl.
I04 3X3X3 8.24 10.15 Polyethylene’3 kg Cy].
105 2x2x 1 N/A 7.59 None6 kg Cy[.
4.1.2.2.2 PU-MET-FAST-O04 [7]
Nine experiments involving unreflected three-dimensional arrays of plutonium metalcylinders were evaluated [6]. These experiments are similar to the experiments describedin section 2.2.1 with the exceptions noted in the following paragraphs.
Larger square-pitched arrays were constructed using single (3 kg) and double (6 kg)parts. The support tubes, spacers, and split table used for these experiments weredesigned to permit the construction of larger experimental arrays than the previousexperimental set.
The experimental table is modeled in a cubic concrete room 914.4 cm on a side with152.4 cm thick walls, 91.44 cm thick floors, and a 60.96 cm thick ceiling. The table washorizontally centered in the room and had its top surface 360.342 cm from the floor. Asummary of the experimental parameters for these experiments is provided in Table 5.
3Center to center of spacing is measured from the centers of the double and single parts.4 Reflection was from a 20 cm thick polyethylene slab on one side of the arrays.

,WSRC-TR-99-O0 I98 SCALE 4.4 Validation for the DFS System at SRS ‘ Pa<e I I of99
(Rev. O)
Table 5, Reported Parameters for PU-MET-FAST-004
Experiment Array & Unit Vertical CTC’ Horizontal CTC3Descriptor Size Spacing (cm) Spacing (cm)
~07 4X4X4 7.86 1~.513 kg Cyl.
108 4x4x4 17.12 17.28
6 kg Cyi.209 4x4x4 32.12 12.09
6 kg Cyi.210 4x4x4 47.12 11.93
6 kg Cyl.~11 4x4x4 22.12 15.23
6 kg Cyl.212 4x4x4 13.12 20.19
6 kg Cy[.213 4X4X1 N/A 10.91
6 kg Cyi.214 3X3X3 13.68 14.51
6 kg Cy].215 2x2x2 11.98 9.76
6 kg Cyl.
4.1.2.2.3 PU-MET-FAST-017 [7]
Five experiments involving unreflected arrays of moderated plutonium metal cylinderswere evaluated [6]. These experiments were conducted using the same experimentalapparatus and facility as the experiments in section 4.1.2.2.2. Moderator jackets and enddisks were added to the outside of the support tube and above or below Pu parts,respectively. These disks were made of a mock explosive material (density = 1.559g/cm3) consisting primarily of carbon (30.56 wt ‘%0), hydrogen (3.14 wt ?40), nitrogen(31.57 wt %) and oxygen (34.73 wt %). Three sizes of moderator jackets and end diskswere used. A summary of the experimental parameters for these experiments is providedin Table 6.
Table 6, Reported Parameters for PU-MET-FAST-017
Experiment Array & Unit Vertical CTC’ Horizontal CTC’Descriptor Size Spacing (cm) Spacing (cm)
201 4x4x4 6 Kg Cyl. 25.79 17.50202 4x4x4 6 Kg Cyl. 25.82 21.24203 4x4x4 6 Kg Cyl. 25.82 24.52204 4x4x4 ~ Kg Cyl. 9.63 14.19205 4x4x4 3 Kg Cyl. 13.64 14.55
5Center to center of spacing is measured from the centers of the double and single parts.

WSRC-TR-99-00 198
,
SCALE 4.4 Validation for the DFS System at SRS Page 12 of99(Rev. O)
4.1.3 Bias and Uncertainty
Table 7 presents the outcome of the normalcy tests performed on the informationprovided in Appendix A, Table A. 1. Weighted and unweighed means are also includedas part of this table.
Table 7, Normalcy Results
Cross Normal Kmean Weighted (Y/N)Sections (YIN)
Figures 1 and 2 provide the plots used to analyze trends. Keffective was plotted againstenergy group for the 27-group and 238-group results to identify trends. Keffectiveincreases by 1.7’Mo(27 gr.) and 1.10/0(238 gr.) over the energy group ranges. The dataused to construct these plots is provided in Appendix A, Table A. 1.
Figure 1, Energy Group vs. Keffective (27-group)
1.005
1
0.985
0.98
(Pu Metal Systems)
*---- x ~.--+
--3?-X
x
ii-”--“xxx
4 6 8
Average Energy Group
Single, Bare Pu ‘“-Spheres
Single, Water-Reflected Pu Sphere
UnrnoderatedButton Array
Unrnoderated
Pu Metal
Pu MetalCylinder Array
Moderated Pu MetalCylinder Array
..

WSRC- rR-99-Oo i 98 SCALE -t.~ Validation for the DFS System at SRS Page 13 of99(Rev, O)
Figure 2, Energy Group vs. Keffective (238-group)(Pu ~MetalSystems)
1<005
1
0.985
+
0.98
10 30 50 70
Average Energy Group
+Single, Bare PuSpheres
~ Single, Water-Reflected Pu Sphere
Unmoderated PuMetal Button Array
~ Unmoderated PuMetal Cylinder Array
x Moderated Pu MetalCylinder Array
A set of benchmark experiments for single units and arrays of Pu metal has beenevaluated. These experiments cover bare and water reflected Pu metal systems with boththe 27 and 238-group cross sections in SCALE 4.4 on the DEC Alpha workstationcluster. A Lower tolerance limit of 0.980 has been calculated for the 27-grouplibrary.
Table 8 LTL Calculation Results (27 group)
Weighted Data 27 groupOne-sided Lower Tolerance Factor (U) 2,.350Average ~ff 0.9938Sqrt. of Pooled Variance (Sp) 5.849E-05Variance about the Mean (S’) 2.525E-05
.Average Uncertainty (c’) 8.958E-06
1Lower Tolerance Limit 0.980 1
The 238-group had a non-normal distribution. However, a linear trendline could be fit tothe array data. Figure 3 shows the linear fit to the Pu metal array data. The result of theregression gives a linear correlation coefficient of 0.5028. Due to this fit, a LowerTolerance Band may be calculated for the Pu metal array data. The LTB for 238 groupPu metal arrays is shown in Figure 4. The data used in this calculation is given inAppendix A, Table A. 1.

! , WSRC-TR-99-00 198 SCALE 4.4 Validation for the DFS System at SRS p~~~ [ ~ Qf 99
1.005
1
0.995
% 0.99s
0.985
0.98
0.975
(Rev. 0)
Figure 3 Pu Metal Array Data Linear Fit
Keff = a + bX Tolerance Band
..—_———__ -._._,. .__..—______________________
w“y = 0.0003x ~ 0.9839
R = 0.5028
●: Benchmark Data Values
_ Linear (Benchmark Data Values)
o 10 20 30 40 50 60
Average he rgy Group (238)
Figure 4 Pu Metal Lower Tolerance Band
Keff = a + bX Tolerance Band
1.005 ——..——..—..—...–”
1+ ArrayBenchmarkDataValues
0.995
5 0.99x
4+’
0.985—Linear (Fitted Line)
0.98
0.975
0 10 20 30 40 50 co R*= 1.00E+OO
Average Energy Group (238)
The 238 group Pu metal Lower Tolerance Band within the area or applicability for agiven 238 group average energy may be represented by the equation:
LTB = 4.7794E-07 (X3) – 5.8752E-05 (X2) + 2.3446E-03 (X) + 9.4937E-01
where x is the supplied average energy group. This equation only represents the LTBwithin the evaluated area of applicability and may not be used to extrapolate beyond therange of the area of applicability.
Bias and bias uncertainty for Pu metal single units may also be obtained from this Pumetal array lower tolerance band. Due to the fact that the single unit experiments all

WSRC-TR-99-00 198 SC,4LE 4.4 Validation for the DFS System at SRS Page 15 oF99, (Rev. O)
calculate high relative to the array cases, the array bias is judged acceptable andconservative for use with single unit cases.
The data used in this validation covers a broad spectrum of materials, therefore asubcritical margin as low as 0.02 may be appropriate for those systems with Pu-240contents near 5°/0. For systems with significantly different Pu-240 contents, a largersubcritical margin would be necessary.
4.1.4 Limitations
These results are applicable to bare and hydrogenously reflected Pu-239 (Pu-240 wt’70 =
4.5-20%) metal systems with average neutron fission groups from 4.4 -7.4 (27gr.) and21.3 -50.7 (23 8 gr.) from SCALE Version 4.4 running on the Digital Equipment AlphaProcessors Workstation Cluster. The results are not applicable to thermal [avg. energygr. >7.4 (27 gr.), >50.7 (238 gr.)] systems, systems containing significant interstitialmoderation (i.e., H/Pu-239 ratio # O) and systems with non-hydrogenous reflectors.
As can be seen in the tables in this section, the majority of the evaluated experimentshave Pu-240 content near 5?40. As discussed in 4.1.3, use of this bias with cases havingPu-240 content significantly different from 5% requires an increase in the subcriticalmargin.
Again, the equation supplied in Section 4.1.3 to determine the238 group Pu metal lowertolerance band may not be used to extrapolate beyond the area of applicability. This isdue to the fact that the polynomial fit to the data was evaluated using power series theory,which may lead to unrealistic shapes for the fit determination (oscillations) outside of thedata region. Limited extrapolation would be allowed through evaluation of the data byalternate methods, such as orthogonal Legendre polynomials.

WSRC-TR-W-00 198 SCALE 4.4 Validation for the DFS System at SRS page [6 ~f99
(Rev, O)
4.2 Plutonium Solutions4.2.1 Area of Applicability
This section presents the SCALE validation analysis for plutonium nitrate solutionsystems. The results of this analysis present weighted (including statistical andexperimental uncertainties) lower tolerance bands as a function of H/Pu-239 for theSCALE code system with the 27-group ENDF/B-IV and 238-group ENDF/B-V crosssection libraries. Benchmark experiments selected for validation have been previouslyevaluated and are documented in N-CLC-F-00060 [9] and SRT-EMS-95-O084 [1O]. Keyareas of applicability for these experiments include:
1. Fuel: Plutonium Nitrate (Pu(N03)4) Solution2. Moderation: H/Pu-239 --90-280063. Pu-240 Content: Weight ‘%0 (0.54 -18.91 ‘Yo Pu-240)4. Moderating Material: No Interspersed Heterogeneous Moderators5. Reflecting Material Bare or Water Reflected6. Geometry Single Spheres or Slabs
19.3 <4 VIS <81.37. Neutron Spectrum Thermal; 21.4< AEG (27) <24.6
195.7 <AEG (238) <219.8
4.2.2 System Description
Eighty-two critical experiments involving unreflected and water-reflected spheres andslabs were extracted from the International Handbook of Evaluated CriticalityBenchmark Experiments [’7]for this evaluation. Thirty-six experiments have beenevaluated and documented in N-CLC-F-00060 [9]. Forty-six Benchmark experimentshave been evaluated and documented in SRT-EMS-95-O084 [1O]. The experimentalconfigurations for these experiments are described in the following sections.
4.2.2.1 Unreflected Spheres
Three sets of experiments, dealing with unreflected 48-inch, 16-inch, and 18-inch sphereswere evaluated. Details on each type of experiment are provided below.
Unreflected 48-Inch Diameter Spheres [8]
Three of the experiments utilized a single unreflected 48-inch diameter sphere ofplutonium nitrate (Pu(N03)4) solution. A summary of the experiment parametersreported in Reference 8 are provided in Table 9. The isotopic composition of theplutonium used in the experiments is provided in Table 10.
6 Please note limitations listed in Section 4.2.4 before use.

WSRC-rR-99-00198 SCALE 4.4 Validation for the DFS System at SRS Page(Rev. O),
Table 9, Reported 48-Inch Sphere Experiment Parameters
Benchmark Descriptor Pu MolarityDensity
(g/l)
Pu-soL-THERM-oo9/l 10.02 1.119PU-SOL-THERM-O09/2 9.539 1.118Pu-soL-THERM-oo9/3 9.457 1.123
Table 10, Plutonium Isotopic Composition
Isotope Weight YO
Pu-238 0.004Pu-239 97.386Pu-240 2.521
Pu-241 0.075Pu-242 0.014
Unreflected 16-Inch Diameter Spheres [9]
Four of the experiments utilized a single unreflected 16-inch diameter sphere ofplutonium nitrate (PU(NOS)l) solution. A summary of the reported experimentalparameters is provided in Table 11. The plutonium used in these experiments was
wt. ‘?40 Pu-239 and 4.17 wt. ‘?40 Pu-240.
Table 11, Reported 16-Inch Sphere Experiment Parameters
ExperimentDescriptor Pu MoIarityDensity
(g/l)
Pu-soL-THERM-ol l/16-l 35.59 1.123PU-SOL-THERM-O1 1/16-2 38.13 1.984PU-SOL-THERM-O 11/16-3 38.16 2.255PU-SOL-THERM-O 11/16-4 43.43 3.808
Unreflected 18-Inch Diameter Spheres (Cadmium Shell) [9]
I 7 of99
95.83
Six of the experiments utilized a single unreflected 1%inch diameter sphere of plutonium
nitrate (Pu(NOJ)4) solution. A thin cadmium shell (0.02 inches thick) was placed on theoutside of the spherical reactor tank. A summary of the reported experimental parametersis provided in Table 12. The plutonium used in these experiments was 95.8 JYLO/O Pu-239and 4.2 wt.Yo Pu-240.

WSRC-TR-99-00 198 SCALE 4,4 Validation for the DFS System at SRS . Page 18 0f99
(Rev. O)1
Table 12, Reported 18-Inch Sphere Experiment Parameters
Experiment Descriptor Pu Molarit yDensity
(g/l)PU-SOL-THERM-01 l/’l8-l 22.35 0.847PU-SOL-THERM-01 1/18-2 23.18 1,263PU-SOL-THERM-O 11/18-3 23.82 1.988PU-SOL-THERM-O 11/18-4 25,20 2.783PU-SOL-THERM-01 1/18-5 27.49 4.1411 1PU-SOL-THERM-O 11/18-6 23.94 1.623
4.2.2.2 Water Reflected Spheres [10]
Experiments were conducted with aluminum or stainless steel tanks of various sizes.These tanks were filled with various plutonium nitrate (Pu(N03)1) solutions and reflectedby 30 cm of water. A summary of the experimental parameters for these experiments isprovided in Table 13.
Table 13, Reported Sphere Parameters
II Experiment Descriptor Pu isotopic Composition I Molarity I RadiusDensity (Wt %) (cm) II
II I (g/l) I I I IIPU-SOL-THERM-OO1 ‘ Pu-239 Pu-240
1 73.0 95.011 4.669 0.199 14.51512 96.0 95.01 I 4.669 1.669 14.5377! ,3 119.0 95.01 I 4.669 1.999 14.51134 132.0 95.011 4.669 2.299 14.53025 140.0 95.011 4.669 2.199 14.53026 268.7 95.011 4.669 1.099 14.5189
PU-SOL-THERM-O021 49.84 96.88 3.12 1.390 15.3399
2 51.42 96.88 3.12 1.754 15.3399
3 56.09 96.88 3.12 2.387 15.3399
4 59.64 96.88 3.12 2.814 15.3399
5 63.33 96.88 3.12 3.284 15.3399
6 70.11 96.88 3.12 4.008 15.3399
7 77.09 96.88 3.12 4.487 15.3399PU-SOL-THERM-O03
I 33.32 98.24 1.76 0.834 16.51562 34.32 98.24 1.76 1.298 16.5156
3 37.43 99.46 0.54 1.465 16.5156
1 4 38.12 99.46 0.54 1.871 16.5156
5 40.65 99.46 0.54 2.612 16.5156L
6 44.09 99.46 0.54 1.982 16.5156
7 35.98 99.46 0.54 0.807 16.2487
8 36.81 99.46 0.54 1.277 16.2487
7 Plutonium isotopic composition also contains 0.006% Pu-238, 0.305 %Pu-241 and 0.009% Pu-242.

WSRC-TR-99-00 198 SCALE 4.4 Validation for [he DFS System at SRS
(Rev. O)
, ,Table 13, Reported Sphere Parameters
(continued)
Experiment Descriptor Pu Isotopic Composition Molarity RadiusDensity (Wt “A) (cm)
(g/l)
PU-SOL-THERM-O04 Pu-239 PU-2401 26,27 99.46 0.54 1.754 17.78652 26.31 99.46 0.54 2.545 17.78653 27.20 99.46 0,54 1.299 17,78654 28.09 99.46 0.54 0.925 17.78655 27.58 98.24 1.76 1.264 17.78656 28.6 98,24 1.76 1.799 17.78657 29. j7 98.24 1.76 2.819 17.78658 29.95 98.24 1.76 4.?I92 17.78659 31.6 98.24 1.76 5.913 17.786510 35.36 98.24 1.76 1.356 17.786511 39.38 98.24 1.76 1.298 17.786512 29.44 98.24 1.76 0.908 17.786513 29.27 98.24 1.76 1.409 17.7865
PU-SOL-TI-IERM-0051 29.65 95.95 4.05 1.837 i7.78652 30.54 95.95 4.05 2.832 17.7865. 31.43 95.95 4.05 3.785 17.7865; 33.54 95.95 4.05 4.755 17,78655 36.04 95.95 4.05 3.903 17.78656 38.49 95.95 4.05 1.523 17.78657 40,91 95.95 4.05 2.010 17.78658 30,58 95.60 4.40 1.451 17.78659 31.85 95.60 4.40 1.938 17.7865
PU-SOL-THERM-O061 24.80 96.88 3.12 2.963 19.04162 25.56 96.88 3.12 0.893 19.04163 26.97 96.88 3.12 1.393 19.0416
1 J
4.2.2.3 Reflected And Unreflected Slabs [9]
Twenty-three of these experiments were conducted in a stainless steel slab tank with a130 cm x 130 cm square base. Critical solution heights were determined for variousplutonium nitrate (Pu(N03)4) solution compositions. The plutonium isotopic compositionis provided in Table 14. A summary of the reported experimental parameters is providedin Table 15.

WSRC-TR-99-O0 I98 SCALE 4.4 Validation for the DFS System at SRS(Rev. O)
,
Table 14, Plutonium Isotopic Composition
Isotope I Weight O/.If J
PU-239 74,3189PU-240 18.9102Pu-241 5.629Pu-242 1.1418
Am-24 1 0.61 (’%.of Pu)
Page 20 of99
Table 15, Reported Slab Parameters
Experiment Descriptor Pu Molarit y Critical ReflectorDensity Height
(g/l) (cm)
PU-SOL-THERM-O 12/1 19.7 2.02 28.17 WaterPu-soL-THERM-o12/2 17.7 2.01 32.35 WaterPu-soL-THERM-o12/3 16.7 2.02 35.44 WaterPU-SOL-THERM-O 12/4 14.7 2.03 45.68 WaterPU-SOL-THERM-01 2/5 13.2 2.05 66.15 WaterPU-SOL-THERM-012/6 105.Q 2.43 16.32 Water, 5 SidesPU-SOL-THERM-012/7 84.0 2.04 16.32 Water, 5 SidesPU-SOL-THERM-012/8 52.7 2.09 17.63 Water, 5 SidesPU-SOL-THERJ4-O 12/9 31.9 2.07 21.31 Water, 5 SidesPU-SOL-THERM-O 12/10 26.9 2.09 23.11 Water, 5 SidesPU-SOL-THERM-O 12/11 21.7 1.99 27.15 Water, 5 SidesPu-soL-THERM-o12/12 19.7 2.02 29.90 Water, 5 SidesPu-soL-THERM-012 /13 13.2 2.06 67.46 Water, 5 SidesPU-SOL-THERM-O 12/14 52.7 2.09 19.43 UnreflectedPU-SOL-THERM-O 12/15 31.9 2.07 22.98 UnreflectedPU-SOL-THERM-012/l 6 26.9 2.09 24.76 UnreflectedPU-SOL-THERM-012/17 21.7 1.99 28.80 UnreflectedPU-SOL-THERM-O 12/18 19.7 2.02 31.52 UnreflectedPU-SOL-THERM-O 12/19 17.7 2.01 35.53 Water, 1 SidePU-SOL-THERM-O 12/20 16.7 2.02 38.60 Water, 1 SidePU-SOL-THERM-O 12/21 14.7 2.03 49.09 Water, 1 SidePu-soL-THERM-o12/22 13.2 2.05 69.57 Water, 1 SidePU-SOL-THERM-O 12/23 13.2 2.05 70.00 Unreflected
4.2.3 Bias and Uncertainty
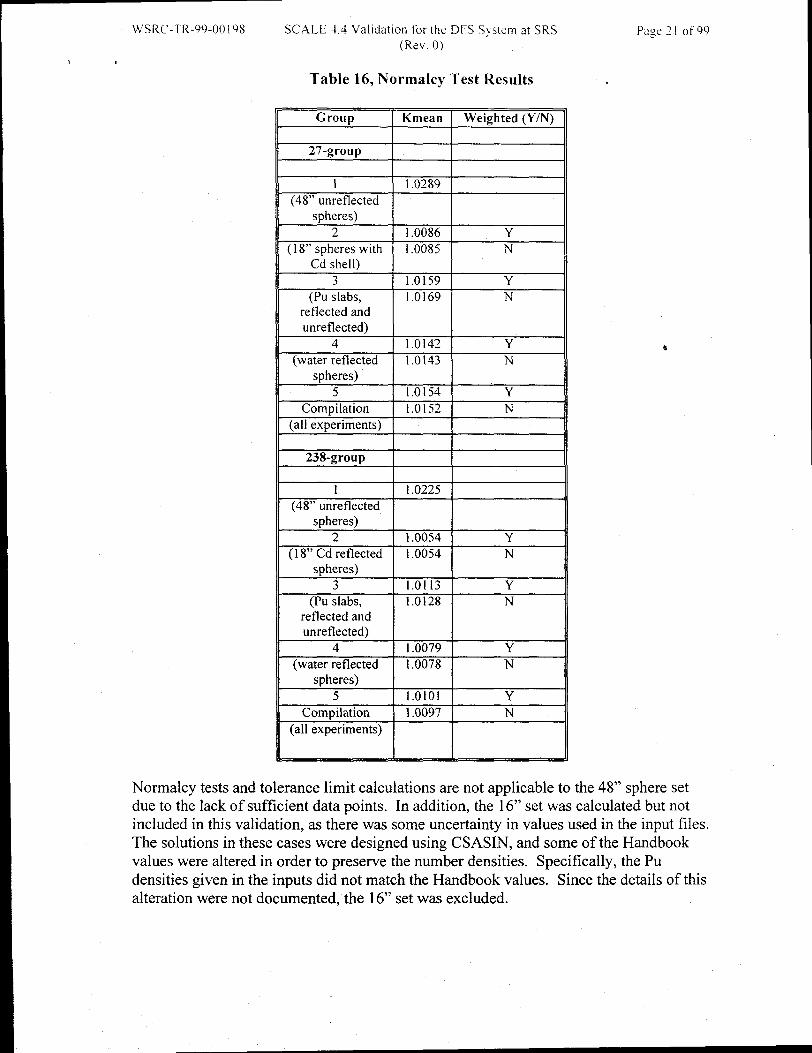
Table 16 presents the results of the normalcy tests performed on the data in Appendix A,Table A.2. Additionally, weighted and unweighed means have been provided in thistable. A discussion of data acceptability follows this table.
WSRC-TR-99-00 I98 SCALE 4.4 Validation for the DFS System at SK
(Rev. O),
Table 16, Normalcy Test Results
G=?=+==1 1.0289
(48” unreflected
spheres)2 1.0086 Y1
( 18“ spheres with 1.0085 NCd shell)
-, 1.0159 Y(Pu ;Iabs, 1.0169 N
reflected andunreflected)
4 1.0142 Y!! (water reflected i 1.0143 i N
II spheres)5 I 1.0154 I Y
Compilation 1.0152 N(all experiments)
,
II 238-groupI I
1 1.0225(48” unreflected
spheres)2 1.0054 Y
( 18“ Cd reflected 1.0054 Nspheres)
3 1.0113 Y(Pu slabs, 1.0128 N
II reflected and I [
uunreflected)4 I 1.0079 i Y
(water reflected 1.0078 Nspheres)
5 1.0101 YCompilation 1.0097 N
(all experiments)
1 I I
$
Normalcy tests and tolerance limit calculations are not applicable to the 48” sphere setdue to the lack of sufficient data points. In addition, the 16“ set was calculated but notincluded in this validation, as there was some uncertainty in values used in the input files.The solutions in these cases were designed using CSASIN, and some of the Handbookvalues were altered in order to preserve the number densities. Specifically, the Pudensities given in the inputs did not match the Handbook values. Since the details of thisalteration were not documented, the 16“ set was excluded.
WSRC-TR-99-00 I9s SCALE 4.4 Validation for the DFS System at SRS Page 2? of99
(Rev. O),
The 48-inch spheres calculate significantly higher than other experiments. Similar resultshave been previously documented [12]. Slab experiments approaching the H/Pu-239ratios represented by the spheres calculate lower, but their higher Pu-240 content maycloud the comparison. Caution should be used when using bias results with H/Pu-239greater than 2000 until the number of data points in this region has been increased.
Several of the 18-inch cadmium reflected spheres calculate lower than the polynomialfitted value. The average Keffective for these spheres is lower than the polynomial fittedvalues for the 27 and 238-group data, respective y. This difference does not appear to bethe result of the cadmium shell around the spheres. Removal of the shell from theexperimental models results in a statistically insignificant change in Keffective. Theseexperiments were retained because their net effect would be to reduce the positive bias(conservative). The inclusion of the cadmium-reflected spheres in this validation shouldnot be considered an adequate test of the cadmium cross sections, as Cd presence is notstatistically significant.
Several independent variables were evaluated to determine if any trends existed in thedata. H/Pu-239 ratios produced the best data fits. Reference 11 provides a discussion ofthe other independent variables that were tested for a correlation with Keffective.
H/Pu-239 ratios were plotted against Keffective for the 27-group and 238-group datas.The resulting plots (Figures 4 & 5) have well-defined negative inflections in the center ofthe H7Pu-239 range (1,000 - 1,500). A polynomial regression was selected for evaluationbecause of this inflection. The data appears to be well correlated but a reason for thecorrelation is not apparent. For this reason, weighted single sided lower tolerance bandswere developed from the polynomials fits to the 27 and 238-group data.
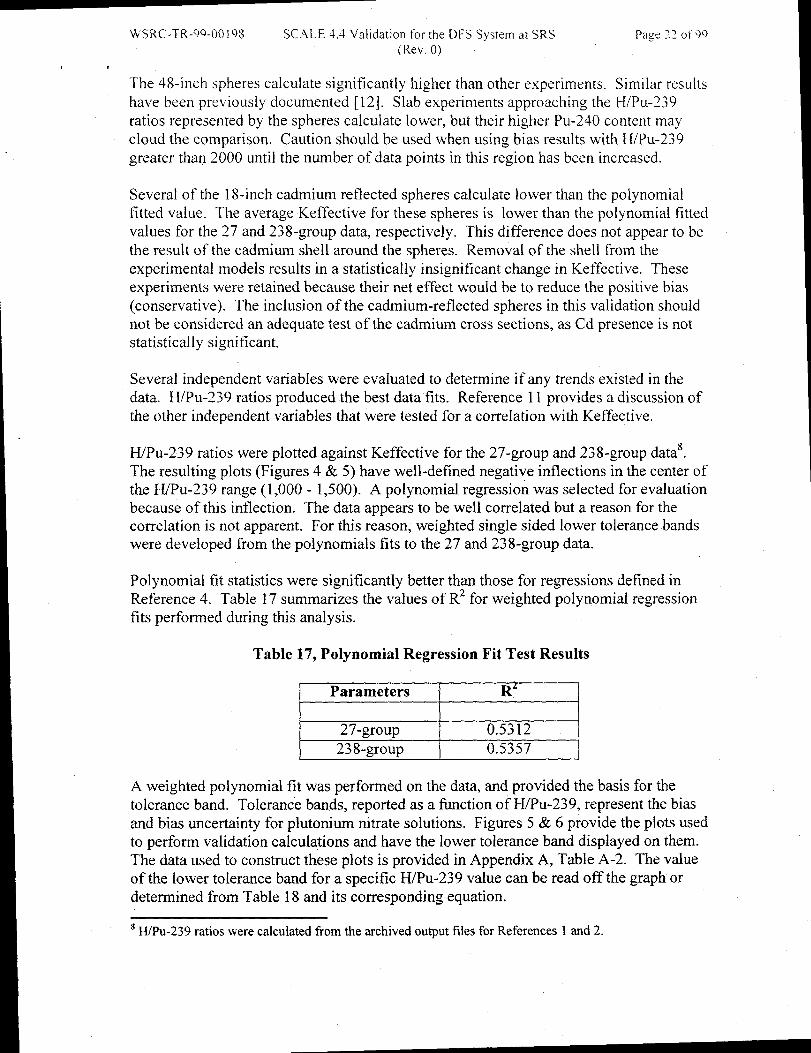
Polynomial fit statistics were significantly better than those for regressions defined inReference 4. Table 17 summarizes the values of R2 for weighted polynomial regressionfits performed during this analysis.
Table 17, Polynomial Regression Fit Test Results
Parameters R’
27-group 0.5312238-group 0.5357
A weighted polynomial fit was performed on the data, and provided the basis for thetolerance band. Tolerance bands, reported as a fimction of H/Pu-239, represent the biasand bias uncertainty for plutonium nitrate solutions. Figures 5 & 6 provide the plots usedto perform validation calculations and have the lower tolerance band displayed on them.The data used to construct these plots is provided in Appendix A, Table A-2. The valueof the lower tolerance band for a specific H/Pu-239 value can be read off the graph ordetermined horn Table 18 and its corresponding equation.
g H/Pu-239 ratios were calculated from the archived output files for References 1 and 2.

WSRC-TR-99-00 198 SCALE 4.4 Validation for the DFS System at SRS %lye 23 of 99(Rev. O)
The experiments involved in this validation covered a broad spectrum of material
contents, and were performed at multiple critical facilities, therefore the use of a
subcritical margin as low as 0.02 may be appropriate as long as the H/Pu-239 ratio isbetween 250 and 1200. If the ratio is larger than 1200. the scarcity of data requires that alarger value of margin be used. Since the data varies by a substantial amount at the upperend of the curve (H/Pu-239 - 2500), a margin of at least 0.04 may be appropriate.
The positive bias associated with the 27-group ENDF/B-IV Library maybe the result ofthe cross section collapsing methodology. Section M4.B.3 of the SCALE 4.3 Manualdescribes a problem with the 0.3 ev resonance (Pu-239) and the Maxwellian used tocollapse the cross sections that could cause the positive bias. Justification for suspectingthe collapsing problem can be observed by comparing the 27-group and 238-groupresults. The positive bias is reduced when using the 238-group cross sections. Thepositive bias evident from the 238-group results may be the result of problems with theENDF/B-V cross sections. A comparison of the ENDF/B-V results from SCALE tothose from MCNP produces similar results.
The K-fit is expressed with the following equation. Similarly, the equation may beutilized to represent the LTB within the area of applicability, however, the equationcannot be used to extrapolate beyond the range of the area of applicability. The K-Limit constants must be used when determining the bias. Alternate data evaluationmethods would allow limited extrapolation, if required.
LTB = BO+ B1’(H/239Pu) + B#(H/z39Pu)2 + B3*(H/239Pu)3
Table 18, Tolerance Band, Average Energy Group vs. Keffective
B. Bl B2 B3
27-groupK-Fit 1.0203 -1.3161E-05 5.5335E-09 o
K-Limit (LTB) 1.0082 -8.2348E-06 2.4486E-09 4.5562E-13238-group
K-Fit 1.0115 -7.8695E-06 4.0821E-09 oK-Limit (LTB) 0.9997 -3.0461 E-06 1.0617E-19 4.461 lE-13

‘WSRC-TR-99-00 198
1
SCALE 4.4 Validation for the DFS System at SRS(Rev. O)
Figure 3, H/Pu-239 vs. Keffective (27-group)
1.0351.03
1.0251.02
: 1.0151.01
1.0051
0.995
0
.-———. ————”-- .,. -.-—... —
+
+
%
1000 2000 3000
H/Pu-239
XJx
1.0351.03
1.0251.02
1.0151.01
1.0051
0.995
0
Cases 1-3, Bare 48 Spheres
Cases 8-13, CadmiumCovered 18“ Spheres
Cases 14-18, Water ReflectedSlabs
Cases 19-26, Slabs with WaterReflector On 5 Sides
Cases 27-31 & 36, Bare Slabs
Cases 32-35, Slabs with WaterReflector On 1 Side
Cases 37-82. Water ReflectedSpheres
—Polynomial Fit (CompiledData)
Figure 4, H/Pu-239 vs. Keffective (238-group)
+
m
x
x
●
+
Cases 1-3, Bare 48” Spheres
Cases 8-13, CadmiumCovered 18 Spheres
Cases 14-18, Water ReflectedSlabs
Cases 19-26, Slabs with WaterReflector on 5 Sides
Cases 27-31 & 36, Bare Slabs
Cases 32-35, Slabs with WaterReflector on 1 Side
Cases 37-82, Water Reflected.%heres-,
1000 2000 3000 —Polynomial Fit (Compiled Data)
H/Pu-239
WSRC-”1-R-99-00 I 98 SCALE 4.4 Validation for [he DFS System at SRS Page 25 of ’W
1
1.03
1.025
1.02
~ 1.015
~ 1.01
1.005
1
0.995
(Rev. O)
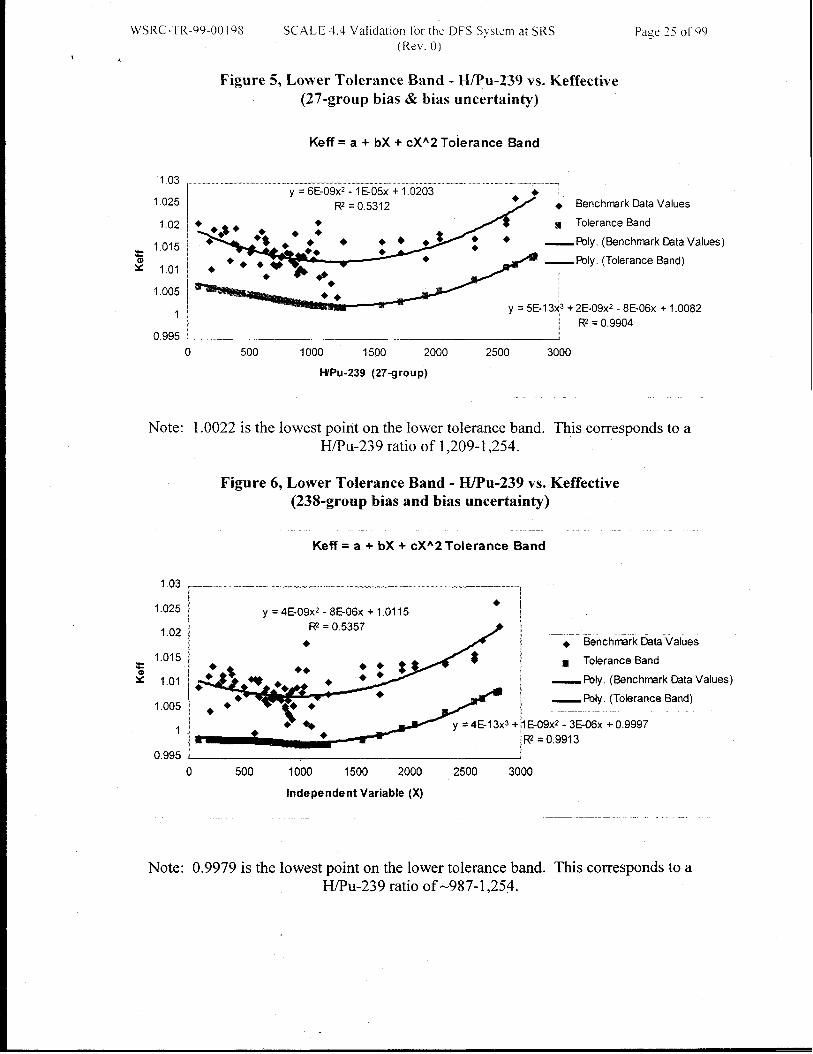
Figure 5, Lower Tolerance Band - H/Pu-239 vs. Keffective(27-group bias & bias uncertainty)
Keff = a + bX + CXA2Tolerance Band
..... . .Y = 6E-09x2 -1 E-05x + 1.0203 ““- ‘-”’- ‘-;—;-’ ‘–:
1%= 0,5312 / + Benchmark Data Values
~ Tolerance Band
— I%Iy. (Benchmark Data Values)
— Poly. (Tolerance Band)+
y = 5E-I 3x3 + 2E-09x* - 8E-06x + 1.0082
Rz= 0,9904
500 1000 1500 2000 2500 3000
HPu-239 (27-group)
Note: 1.0022 is the lowest point on the lower tolerance band. This corresponds to aH/Pu-239 ratio of 1,209-1,254.
Figure 6, Lower Tolerance Band - HIPu-239 vs. Keffective(238-group bias and bias uncertainty)
-.
Keff = a + bX + CXA2Tolerance Band
1.03 ,——...” .....-.-—.___ . ....-__”-..-...-—.__”-
1.0254
y = 4E-09xZ - 8E-06x + 1.0115
1.02 Rz= 0.5357
+ / ● Benchmark Data Values
‘: +~ I :Zi::::vau1 +%
+y = 4E-I 3x3 + ~1E-09xZ- 3E-06x + 0.9997
@ = 0.9913
0.995 t
o 500 1000 1500 2000 2500 3000
Independent Variable (X)
Note: 0.9979 is the lowest point on the lower tolerance band. This corresponds to aH/Pu-239 ratio of -987-1,254.
W’SRC- rR-99-oO [ 98 SCALE 4.4 Validation for the DFS System at SRS
(Rev. O)
F
‘ 4.2.4 Limitations
The tolerance bands developed are applicable to unreflected and water reflected systemsof plutonium nitrate solutions modeled using SCALE Version 4.4 on the DigitalEquipment Alpha Processors Workstation Cluster. These results are not applicable toplutonium metal systems or to plutonium solution systems with significant non-waterreflectors. Use of these results with systems containing different reflectors requiresadditional analysis and justification. Care should also be taken in extrapolating theseresults to arrays of Pu solutions.
Use of the results with H/Pu-239 Ratios above 2000 is strongly cautioned. The results inthis region are based on two sets of experiments that span a range of 1.4°/0of Keffective.Additional analysis and justification is recommended prior to using the results from thisregion.
Extrapolation outside of the area of applicability for these experiments is notrecommended, for several reasons. The polynomial fits used in the validationcalculations were evaluated using power series theory. This can lead to unrealistic shapesfor the fit determination (oscillations) outside of the data region.

W’SRC-”FR-99-00 198 SCALE 4,4 Validation for the DFS System at SRS Page ?7 of99
t ,
5.0 Uranium Systems5.1 Uranium Metal5.1.1 Area of Applicability
This section presents the SCALE
(Rev. O)
validation analysis for uranium metal systems. Theresults from this analysis are non-parametric upper subcritical margins for the 27-groupand 238-group cross sections. Benchmark experiments selected for validation have beenpreviously evaluated and are documented inSRT-EMS-96-0017 [5] and N-CLC-H-O 178[6]. Key areas of applicability for these experiments include:
1.2.3.4.5.
6.
7.
Fuel: Uranium Metal Systems .Moderation: H/U-235 -0Enrichment: 93.5 wt’Xo235UModerating Material: Polyethylene, Plexiglas, TeflonReflecting Material Bare, water, natural uranium, Polyethylene,
Paraffin, Lucite, Tungsten-Carbide, Tuballoy, steel,and aluminum
Geometry Single spheres, slabs, and cylinders; arrayscylinders and slabs
6.4<4 VIS <28.6
Neutron Spectrum Fast; 4.8 <AEG (27)< 15.824.3< AEG (238) <136.9
5.1.2 System Descriptions5.1.2.1 Unreflected HEU Spheres [7]
Two experiments involved unreflected uranium spheres. The first, referred to as Godiva,was a bare 2S5Usphere. The second was a Shell Model that consisted of layers ofuranium with gaps of air. Both consisted of two identical sets of nested oralloyhemispheres. For each, the upper hemisphere was supported by a 0.01 5-inch-thickdiaphragm of stainless steel, and the lower hemisphere rested on a thin-wall aluminumcylinder. The lower stack was raised by remote control to contact the steel diaphragm foreach measurement of the multiplication of neutrons from a near-central source.Specific details on the benchmark specifications for these experiments can be found inReference 7. A summary of the experimental parameters for these experiments isprovided in Table 19.

WSRC-TR-99-00 198 SCALE 4.4 Validation for the DFS System at SRS Page 28 ot’99< 1 (Rev. O)
Table 19, Reported Parameters for HEU-MET-FAST-OO 1
Benchmark Composition U Isotopic Composition Sphere RadiusDescriptor (Wt %) (cm)
234 235 238Godiva HEU 1.02 93.71 5.27 8.7407
Shell Model:Shell I HEU 1,02 93.26 5.72 1.0216Shel12 Air gap 1.0541Shel13 HEU 1.02 93.90 5.08 6.2809SheI14 Air gap 6.2937Shel15 HEU 1.02 93.95 5.03 7.7525Shel16 Air gap - - 7.7620Shel17 HEU 1.02 93.58 5.40 8.2j27
Shel18 Air gap 8.~6113Shel19 HEU I .02 93,89 5.09 8.7062
Shell10 HEU 1.02 93.86 5.12 8.7499
5.1.2.2 Natural Uranium-Reflected Pseudosphere, Pseudocylinder, andParallelepipeds [7]
Six experiments involving tuballoy-reflected critical assemblies were run on the Topsymachine. This set of oralloy assemblies includes a pseudosphere, a pseudocylinder, andfour parallelepipeds. The density of oralloy in all six assemblies is 18.75 g/cm3, and it iscomposed of 93.5 WtO/O 2s~U, 1.02 WtO/O 234U,and 5.48 WtO/O 23gU. The tuballoy reflectorhas a density of 18.90 g/cm3, and is composed of 0.0055 at.% 234U, 0.72 at.% 2s~U, and99.2745 at.% 23*U. All assemblies were taken to critical and used to demonstrate theeffect of geometry on critical mass. A summary of the experimental parameters for theseexperiments is provided in Table 20.
Table 20, Reported Parameters for HEU-MET-FAST-O02
Configuration Region Width Depth Height Radius Material(cm) (cm) (cm) (cm)
Sphere 1 6.0509 Oralloy2 - - - 26.3709 Tuballoy
Cylinder 1 11.43 5.1706 Oralloy2 52.07(’) 25.4906 Tuballoy
4x4x3 .66 Inch 1 10.16 10.16 9.3 - OralloyParallelepipeds 2 50.80 50.80 49.94 - Tuballoy5x5x2.53 Inch 1 12.70 12.70 6.415 - OralloyParallelepipeds 2 53.34 53.34 47.0550 - Tuballoy3x3x7.56 Inch I 7.62 7.62 19.1970 - OralloyParallelepipeds 2 48.26 48.26 59.8370 - Tuballoy3x3.5x6 Inch 1 7.62 8.89 15.2344 - OralloyParallelepipeds 2 48.26 49.53 55.8744 - Tuballoy
(a) 20.32 cm above and below region 1.

, WSRC-TR-99-0019S SCALE 4.4 Validation for the DFS System at SRS,(Rev. O)
5.1.2.3 Unmoderated, Reflected HEU Spheres [7]
Twelve experiments involved unmoderated, reflected spherical assemblies. Includedwere seven spherical oralloy assemblies reflected by tuballoy, four spherical oralloyassemblies reflected by tungsten carbide, and one spherical oralloy assembly reflected bynickel. The acceptability of the nickel-reflected sphere for a benchmark experiment wasdeemed “marginal” in the Handbook, and so it was not included in this validation. Thedensity of the oralloy was 18.75 g/cm3, with constituents of 1.02 wt% ‘3@, 93.5 wt%235U,and 5.48 wt’Yo 2S8U. The density of the tuballoy was 18.90g/ems, and included99.2745 at.% 23*U, 0.0055 at.% 2S4U,and 0.72 at.% 235U. Table21 contains the isotopicabundance for Tungsten.
Table 21, Isotopic Abundance (at.”A) for Tungsten
Isotope Abundance (at.%)t‘“w 0.12‘“w 26.3‘“’w 14.28““W 30.7t‘“w 28.6
The tuballoy-reflected experiments with reflectors less than five inches thick were notbrought to critical and were either “hand-held” or run on the Elsie machine. Threetungsten carbide-reflected experiments were run on the Elsie machine, and one (with thetwo-inch reflector) was “hand-held.” None were brought to critical. All assemblies runon the Topsy machine with tuballoy reflectors of 5 inches or greater were brought tocritical. A summary of the experimental parameters for these experiments is provided inTable 22, where region 1 is the spherical oralloy, and region 2 is the reflector.

W’SRC-TR-W-00 198 SCALE 4.4 Validation for the DFS System at SRS pa~e so of 99
(Rev. O),
Table 22, Reported Parameters for HEU-MET-FAST-O03
Reflector Thickness (in.) I Region Outer Radius (cm) Material2.0 1 6.7820 Oralloy
2 I I ,8620 Tuballoy3.0 [ 6.4423 Oralloy
2 14.0623 Tuballoy4.0 1 6.2851 Oralloy
2 16.4451 Tuballoy5.0 1 6.1535 Oralloy
2 18.8535 Tuballoy7.0 1 6.0740 Oralloy
2 23. s540 Tuballoy8.0 1 6.0509 Ora[loy
2 26.3709 Tuballoy11.0 1 6.0276 Oralloy
2 33.9676 Tuballoy“1.9 I 6.6020 Oralloy
2 I 1.4280 Tungsten Carbide2.9 1 6.2527 Oralloy
2 13.6187 Tungsten Carbide4.5 1 6.0509 Oralloy
2 17.4809 Tungsten Carbide6.5 1 6.0159 Oralloy
2 22.5259 Tungsten Carbide8.0 1 6.4627 Oralloy
2 26.7827 Nickel
5.1.2.4 Water-Reflected HEU Sphere [7]
One experiment involved a water-reflected uranium sphere consisting of two hemispheresof highl y enriched uranium. The hemispheres were joined together using a small HEUpin to forma very nearly uniform sphere with a radius of 6.5537 cm. The sphere wasplaced on a three-legged Plexiglas stand inside an aluminum tank, which was then filledwith water until the system became slightly supercritical, but considerably less thanprompt supercritical. The effect was to estimate the critical mass of a sphere of HEUwith an effective y infinite water reflector. A summary of the constituents of the sphereis provided in Table 23.
Table 23, Components of the HEU Sphere
Item Hemisphere 1 Hemisphere 2 Pin
Net Mass (kg) 11.335 11.336 0.013
Uranium Mass (kg) 11.328 11.331 0.013
‘“u (Wt.vo) <0.01 < ().01 < 0.(31
““u (Wt.?+o) 1.17 1.05 1.04
‘“u (wt.Yo) 97.67 97.68 97.67
‘“U (wt.Yo) 0.20 0.20 0.21
‘“u (Wt.’%o) 0.95 1.06 1.07

f , WSRC-TR-99-00 98 SCALE 4.4 Validation for the DFS System at SRS pa:ej[ ~f99
(Rev. O)
Input files were designed to perform calculations on both one-dimensional and three-
dimensional idealizations of this system. The one-dimensional idealization omits the
Plexiglas stand, and uses a spherical water reflector that preserves the volume of the
actual cylindrical reflector. This idealization was not included in the validation, as there
was no experimental result with which to compare it against. A summary of the
dimensions for the experiment is provided in Tables 24.
Table 24, Dimensions for Three-dimensional Idealization of HEU-MET-FAST-O04
Item Length (cm)Radius of sphere of HEU 6.5537
Thickness of seat of stand 2.54
Outer diameter of seat of stand 2j.4
Inner diameter of seat of stand 7.948Outer diameter of cylinder of water 60.0
Distance from center of sphere to top of stand 5.212Distance from center of sphere to bottom of water’ 32.5
Distance from center of sphere to top of water 23.054
5.1.2.5 Moderated, Reflected and Unreflected HEU Slabs [7]
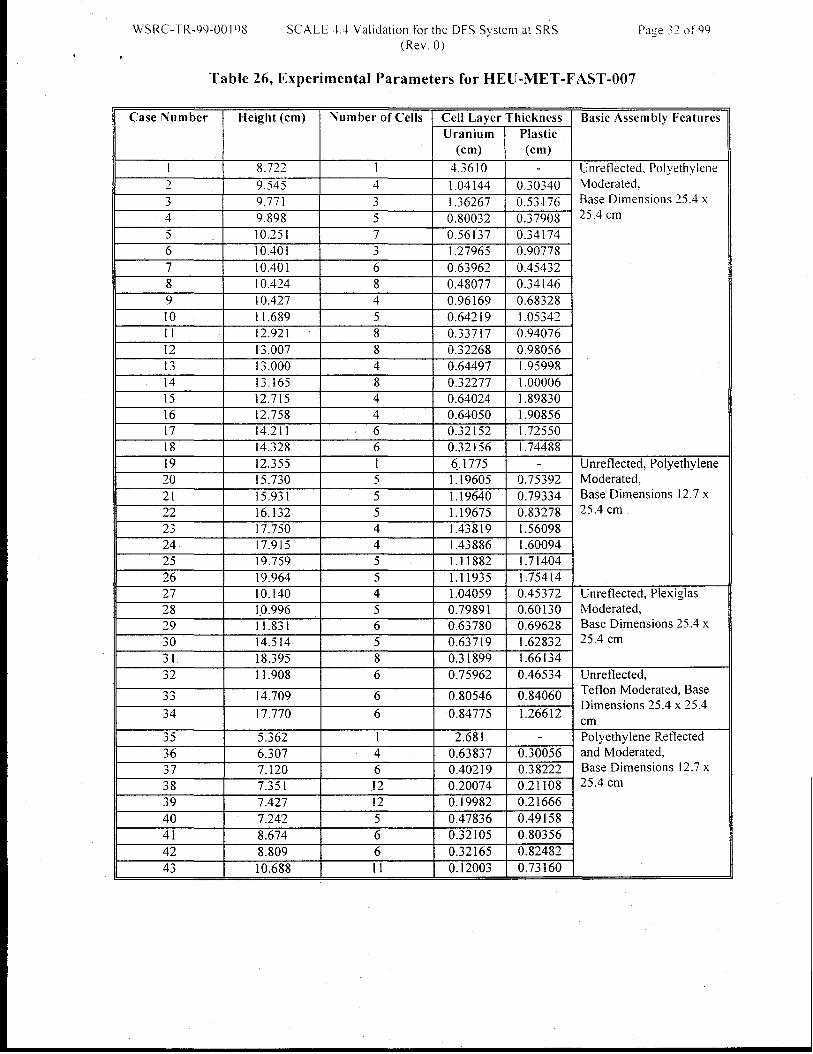
Forty-three experiments involved moderated slabs of highly enriched uranium metal(1.07 wt?4023JU, 93.15 wtYo 23jU, 0.68 wtYo 23GU,and 5.10 wt’Yo 238U). The unreflectedexperiments consisted of uranium metal slabs interleaved with Polyethylene, Plexiglas, orTeflon. Some of the Polyethylene-moderated experiments also had a Polyethylenereflector. Table 25 provides the densities of the moderators.
Table 25, Densities of Moderators in HEU-MET-FAST-O07
The experiments were performed on the Split Table Apparatus, which consists of twocast iron bench plates, one stationary and one movable. Table 26 provides the parametersfor these forty-three experiments.
W’SRC--I-R-99-OO I 9s SCALE 4.4 Validation for the DFS System at SRS Page 32 of99
(Rev. O), ,
Table 26, Experimental Parameters for HEU-MET-FAST-007
Case Number Height (cm) Number of Cells Cell Layer Thickness Basic Assembly FeaturesUranium Plastic
(cm) (cm)
I 8.722 I 4,3610 - Unreflected, Polyethylene2 9.545 4 1.04144 0.30340 Moderated,
3 9.771 3 1.36267 0.53176 Base Dimensions 25.4 x
4 9.898 5 0.80032 0.37908 25.4 cm
5 10.?5 1 7 0.56137 0.341746 10.401 3 1.27965 0.907787 10.401 6 0.63962 0.454328 10.424 8 0.48077 0.341469 10.427 4 0.96169 0.6832810 I 1.689 5 0.64219 i .0534211 12.921 8 0.33717 0.94076[2 13.007 8 0.32268 0.9805613 13,000 4 0.64497 1.9599814 13.165 8 0.32277 1.0000615 12.715 4 0.64024 1.8983016 12.758 4 0.64050 1.9085617 14,211 6 0.32152 1.7255018 14.328 6 0.32156 1.7448819 12.355 1 6.1775 - Unreflected, Polyethylene20 15.730 5 1.19605 0.75392 Moderated,
21 15.931 5 1.19640 0.79334 Base Dimensions 12.7 x
22 16.132 5 1.19675 0.83278 25.4 cm
23 17.750 4 1.43819 1.5609824 17.915 4 1.43886 1.6009425 19.759 5 1.11882 1.7140426 19.964 5 1.11935 1.7541427 10.140 4 1.04059 0.45372 Unreflected, Plexiglas28 1.0.996 5 0.79891 0.60130 Moderated,
29 11.831 6 0.63780 0.69628 Base Dimensions 25.4 x
30 14.514 5 0.63719 1.62832 25.4 cm
31 18.395 8 0.31899 1.6613432 11.908 6 0.75962 0.46534 Unreflected,
33 14.709 6 0.80546 0.84060 Teflon Moderated, Base
34 17.770 6 0.84775Dimensions 25.4 x 25.4
1.26612 ~m
35 5.362 1 2.681 - Polyethylene Reflected36 6.307 4 0.63837 0.30056 and Moderated,
37 7.120 6 0.40219 0.38222 Base Dimensions 12.7 x
38 7.351 12 0.20074 0.21108 25.4 cm
39 7.427 12 0.19982 0.2166640 7.242 5 0.47836 0.4915841 8.674 6 0.32105 0.8035642 8.809 6 0.32165 0.8248243 10.688 11 0.12003 0.73160

WSRC-TR-99-00 198 SCALE 4.4 Validation for the DFS System at SRS< (Rev. O)
5.1.2.5 HEU-MET-FAST-012 [24,7]
This critical experiment. conducted at the Russian Federal Nuclear Center Institute ofTechnical Physics (VNIITF), was a two-unit assembly consisting oftw-elve sphericallayers of highly enriched uranium and an aluminum reflector. The bottom reflector hasone shell; the reflector on the top hemisphere has three shells. In the experiment, the toppart of the assembly rested on a steel diaphragm while the lower part was raised into acritical configuration.
5.1.2.6 HEU-MET-FAST-013 [24,7]
This critical experiment, conducted at VNIITF, was a two-unit assembly consisting ofnine spherical layers of highly enriched uranium and a four-layer aluminum reflector.The top part of the assembly rested on a steel diaphragm, while the lower part was raisedinto a critical configuration. The material compositions and dimensions for thisbenchmark experiment are given in Table 27 [#, 7].
5.1.2.7 HEU-MET-FAST-021 [24,7]
This critical experiment, conducted at VNIITF, was a two-unit assembly consisting ofseven spherical layers of highly enriched uranium with a central cavity and a steelreflector. The upper unit consisted of a hemispherical steel shell resting on a steeldiaphragm, and the moveable lower unit incorporated the remainder of the core andreflector. The material compositions and dimensions for this benchmark experiment aregiven in Table 27.
5.1.2.8 HEU-MET-FAST-022 [24,7]
This critical experiment, conducted at VNIITF, consisted of two units: an upper unitcomposed of a hemispherical shell of highly enriched uranium and three hemisphericalshells of the Duralumin reflector, and a moveable lower unit containing the remainder ofthe core and reflector. An aluminum diaphragm supported the upper unit. The materialcompositions and dimensions for this benchmark experiment are given in Table 27
5.1.2.9 HEU-MET-FAST-024 [24,7]
This experiment performed at VNHTF, was a two-unit assembly consisting of tenspherical layers of highly enriched uranium, a single-layer steel reflector, and a three-layer polyethylene reflector. The material compositions and dimensions for thisbenchmark experiment are given in Table 27
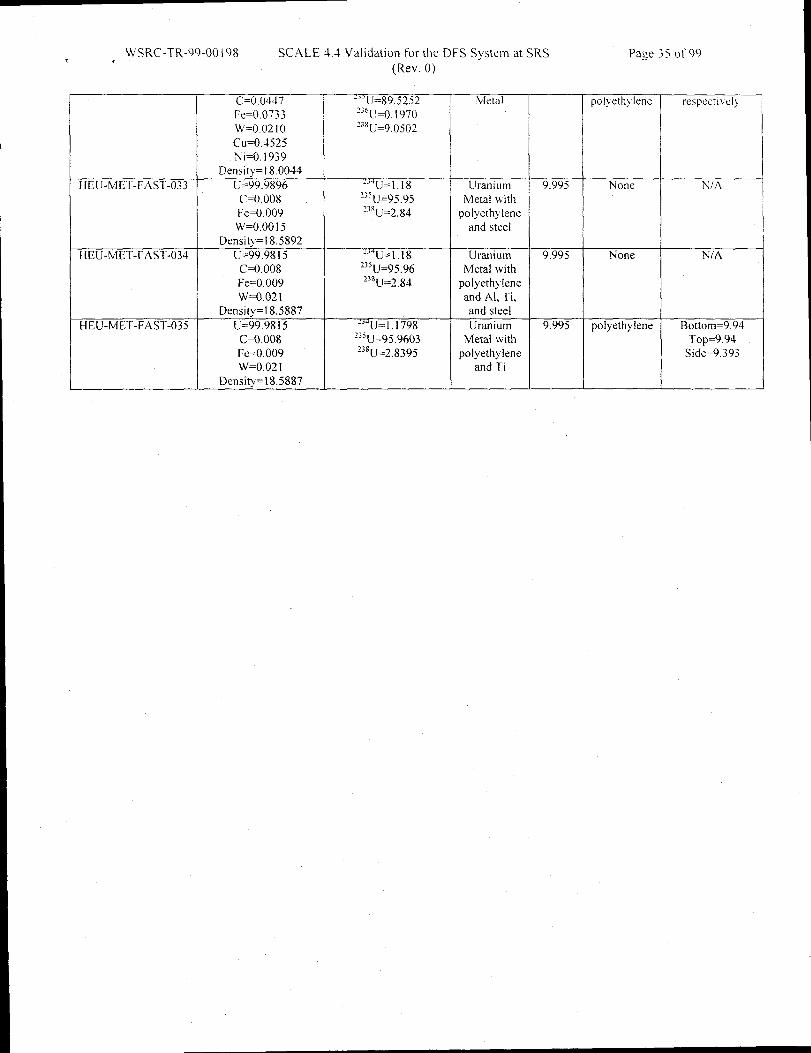
5.1.2.10 HEU-MET-FAST-033 [24,7]
These two critical experiments, conducted at VNIITF, consisted of two hemicylinders ofalternating HEU, steel, and polyethylene disks separated by a gap that yielded a criticalconfiguration. The top hemicylinder rested on a steel diaphragm supported by a

W’SRC-TR-99-00 I 9s SC.4LE 4.4 Validation for the DFS System at SRS Pa~e 34 of 99
(Rev. O)
Duralumin tripod. and the moveable bottom half rested in a Duralumin cone. The
material cotnpositions and dimensions for this benchmark experiment are given in Table
27
5.1.2.11 HEU-MET-FAST-034 [24,7]
These three critical experiments, conducted at VNIITF, consisted of two hemicylinders ofalternating HEU, polyethylene, and either steel, titanium. or aluminum disks separated bya gap that yielded a critical configuration. The top hemicylinder rested on a steeldiaphragm supported by a Duralumin tripod, and the moveable bottom half rested in aDuralumin cone. The material compositions and dimensions for this benchmarkexperiment are given in Table 27
5.1.2.12 HEU-MET-FAST-035 [24,7]
This critical experiment, conducted at VNIITF, consisted of two hemicylinders ofalternating HEU, polyethylene, and titanium disks, separated by a gap that yielded acritical configuration, and reflected on all sides by polyethylene. The top hemicylinderrested on a steel diaphragm, and the moveable bottom half rested on a steel disk. Thematerial compositions and dimensions for this benchmark experiment are given in Table27
Table 27. HEU-MET-FAST-012, 013,021,022,024,033, 034,035 Compositions andDimensions
Handbook I.D. Core Material Uranium Isotopic Core CoreComposition and Composition (wiYO) Material Radius
Density (wt%, g/cc) (cm)HEU-MET-FAST-012 U=99.2626 “TJ=I.1369 Uranium 9.15
C=O.0428 %=89.5982 MetalFe=O.0698 236U=0.1931W=O.021[ ‘S8U=9.0772CU=O.4277Ni=O.18}1
Density= 17.9924HEU-MET-FAST-013 I U=99.2538 I 1’”U=l.1362 I Uranium 8.38
C=O.0443 2S%=89.6324 MetalFe=O.0698 236U=0.l941W=0,0211 238U=9.0730CU=O.4277Ni=O.1833
Density= 17.9924HE U-MET-FAST-021 U=99.6921 “4U=1.1045 Uranium 7,55(average values used C=O.1185 2;%=89.6324 Metal
in the simplified Fe=O.098 ‘38U=9.4064benchmark model) W=O.0914
Density= 18.38HEU-MET-FAST-022 I U=99.7072 “4U=I.104 Uranium 8.35
C=o.1 137 235U=89.4927 MetalFe=O.0933 238U=9.403W=O.0858
Density=18.4HEU-MET-FAST-024 U=99.2 144 “4U=1 .1298 I Uranium 7.55
ReflectorMaterial
Aluminum
steel
Duralumin
Steel and
7Top=2.85
Bottom=l.7
I
:
3.65
------1I
I
I
I
WSRC-TR-99-00 \ 98 SCALE 4.4 Validation for the DFS System at SRS Page 35 of99,(Rev. O)
C=O.04-17 ‘-’>U=89.5252 Metal polyeth> Iene respectivelyFe=o,0733 ‘3’U=0.1970W=O.02[0 ‘58U=9.0502CU=O.4525Ni=O.1939
Density= 18,0044HE U-MET-FAST-033 U=99.9896 “+U= 1.18 Uranium 9.995 None N/A
C=O.008 ‘; SU=95.95 Metal \vithFe=O.009 ‘;8U=2.84 polyethyleneW=O.00 15 and steel
Density= 18.5892HEU-MET-FAST-034 U=99.9815 ‘“U= 1.18 Uranium 9.995 None N/A
C=O.008 ~sSU=95.96 Metal \vithFe=O.009 %J=2.84 polyethyleneW=O.021 and Al, Ti,
Density= 18,5887 and steelHEU-MET-FAST-035 U=99.9815 ““U= 1.1798 Uranium 9.995 polyethylene Bottom=9.94
C=O.008 %=95.9603 Metal \viih Top=9.94Fe=O.009 ‘3gU=2.8395 polyethylene Side=9.393W=O.02 I and Ti
Density =18.5887

WSRC-TR-99-00 I 98 SCALE 4,4 Validation for the DFS System at SRS
7(Rev. O)
*
5.1.2.6 Tinkertoys [71
In 1962-1963 a set of detailed criticality experiments utilizing highly enriched uraniummetal cylinders was conducted at the Oak Ridge Critical Experimental Facility (CEF).Critical arrays of uranium metal cylinders were constructed on a split table apparatus andsurface-to-surface spacings (STS) between the units were measured as a function of thenumber of units and the thickness of a paraffin reflector. HEU-MET-FAST-023 [7]provides a detailed description of the experimental configuration for 22 evaluatedbenchmark experiments developed from these experiments. Details on the benchmarkspecifications used in validation model development are provided in the followingparagraphs.
Arrays were built using cylinders of uranium metal with paraffin blocks for reflectorwalls. Two stainless steel rods passed through each cylinder and through the paraffin tosupport and space the units in the array.
Dimensions for the benchmark are given in Table 28. Table 29 provides the uranium metalcomposition.
Table 28, Benchmark Array Dimensions
Case # Array Cylinder Cylinder Cylinder ReflectorDiameter, Height, Spacing, Thickness,
D (cm) H (cm) STS (cm) RTH (cm)2 2X2X2 11.506 5.382 0.229 1.33 2X2X2 11.506 5.382 1.981 3.84 2x2x2 11.506 5.382 3.416 7.65 2x2x2 11.506 5.382 3.696 15.26 3X3X3 11.509 5.382 2.007 0.07 3X3X3 11.509 5.382 2.992 1.38 3X3X3 11.509 5.382 5.872 3.89 3X3X3 11.509 5.382 8.258 7.610 3x3x3 11.509 5.382 8.689 15.212 2x2x2 9.116 8.641 0.602 1.313 2x2x2 9.116 8.641 2.362 3.814 2x2x2 9.116 8.641 3.97 7.615 2x2x2 9.116 8.641 4.308 15.216 3X3X3 9.116 8.641 2.436 0.017 3X3X3 9.116 8.641 3.426 1.318 3X3X3 9.116 8.641 6.579 3.819 3X3X3 9.116 8.641 9.017 7.620 3X3X3 9.116 8.641 9.434 15.221 4x4x4 11.481 5.382 3.952 0.022 4x4x4 11.481 5.382 12.36 15.228 3X3X3 11.506 5.382 1.349 0.029 3x3x5 11.494 5.382 3.442 0.0

WSRC-TR-99-00 198 SC 4LE 4.4 Validation for the DFS System at SRS
(Rev. O)i
Table 29, Uranium Metal Composition (18.76 g/cm3)
EN!fE Wt 0/0
L1-~34 1.0U-235 93,2U.~36 0.2U-238 5.6
Several arbitrary materials were used in the validation models. Arbitrary materials forthe 0.88 g/cm and 0.93 g/cm paraffin were modeled as compounds (C2jHj2) with theappropriate density (0.88 g/cm for 1.3 cm thick paraffin and 0.93 for all other paraffinthicknesses). Standard SCALE 4.4 compositions of SS304 and RFCONCRETE wereused for the stainless steel rods and room walls, respectively.
5.1.3 Bias and Uncertainty
All SCALE eigenvalues were found by running 250,000 to 450,000 histories. Thisprovided maximum standard deviations of no more than 0.0017.
Table 30 presents the results of the normalcy tests performed on the results provided intabular form in the Appendix A, Table A.3. Weighted and unweighed means are alsoprovided in this table. A discussion of trend identification follows this table.
Table 30, Normalcy Results
Cross Normal Kmean Weighted (Y/N)Sections (YIN)
27-group N 1.0095 Y1.0086 N
238-group N 0.9939 Y
0.9961 N
Keffective was plotted against energy group for the 27-group and 238-group results toidentify trends. Figures 7 and 8 provide the plots used to analyze trends. The data usedto construct these plots is provided in Appendix A, Table A.3.

WSRC-TR-99-00 I 9s SCALE 4.4 Validation for the DFS System at SRS pa<e 38 0f99
(Rev. O)*
Figure 7, Average Energy Group vs. Keffective (27-group)(U Metal Systems)
().99 / ,
0 5 10 15 20
Average Energy Group (27 group)
Figure 8, Energy Group vs. Keffective (238-group)(U Metal Systems)
1.01
1.005
1
% 0.995K
0.99
0.985
0.98
● Benchmark Data Values
_ Fitted Line
o 20 40 60 80 100 120 140 160
Average l%ergy Group (238 group)
A set of benchmark experiments for single units and arrays of HEU metal has beenevaluated. These experiments cover bare and reflected HEU metal systems with both 27-and 238-group cross sections in SCALE 4.4 on the DEC Alpha workstation cluster.
The 27-group had non-normal distribution. Because of the poor fit of the trendline to thedata series , a non-parametric upper subcritical limit was calculated. With a data sampleof 97, there is a 99.3°/0 confidence that 95°/0 of the data lies above the smallest value:
B = 1- (0.95)97= 0.993

WSRC-TR-99-0019S SCALE 4.4 Validation for the DFS System at SRS Page 39 of 99
, (Rev. O),
The non-parametric margin for this level of confidence is 0.0. Therefore. the uppersubcritical limit is:
Kli~iL= smallest K.fYvalue – bias uncertainty – non-parametric margin
27-group:
= 0.9967 -~(0.0009)2 +(0.0019)2 -0.0= 0.9946
The upper subcritical limit for the 27-group HEU Metals is 0.994.
The 238-group had a non-normal distribution. Because of the poor fit of the trendline tothe data series (R2 = 0.0725), a non-parametric upper subcritical limit was calculated.With a data sample of 97, there is a 99.3% confidence thatsmallest value:
95% of the data lies above the
13= 1 – (0.95)97= 0.993
The non-parametric margin for this level of confidence is 0.0. Therefore, the uppersubcritical limit is:
Kli~it = smallest IQ value – bias uncertainty – non-parametric margin
238-group:
= 0.9835–~(0.0014)2 +(0.001)2 - 0.0= 0.9818
The upper subcritical limit for the 238-group is 0.981.
5.1.4 Limitations
These results are applicable to bare and hydrogenously reflected U-235 metal systemswith average neutron fission groups from 4.8 – 24.3 (27gr.) and 24.3 – 215.6 (238 gr.)from SCALE Version 4.4 running on the Digital Equipment Alpha ProcessorsWorkstation Cluster. The results are not applicable to systems containing significantinterstitial moderation (i.e., H/’U-235 ratio # O) or systems with non-hydrogenousreflectors.
As can be seen in the tables in this section, the majority of the evaluated experimentshave U-238 content near 5Y0. A subcritical margin as low as 0.02 maybe appropriate forthose experiments. Use of this bias with cases having U-238 significantly different from5’?40requires an increase in the subcritical margin.

WSRC-TR-99-00 198 SCALE -!.4 Validation for the DFS System at SRS
(Rev. O), 3
5.2 Uranium Solution5.2.1 Area of Applicability
This section presents the SCALE validation analysis for reflected and unreflected highlyenriched uranium solutions. The results of this analysis present weighted (includingstatistical and experimental uncertainties) single sided lower tolerance limits (based onreflector composition) for the SCALE code system with the 27-group ENDF/B-IV and238-group ENDF/B-V cross section libraries. Benchmark experiments selected forvalidation have been previously evaluated and are documented in SRT-EMS-96-0015[13] and EPD-CTG-950013 [14]. Key areas of applicability for these experimentsinclude:
1. Fuel: Highly enriched uranium solutions2. Moderation: H/U-235 --50-130093. Enrichment: High (92.3 wt ‘?40U-235)4. ‘Moderating Material: Water5. Reflecting Material: Concrete, Plexiglas, Water, or None6. Geometry Single Unit Spheres, Cylinders, and Arrays of
Cylinders 15.3<4 VIS <37.27. Neutron Spectrum Thermal; 20.7< AEG (27) <25
186.6< AEG (238) <220.6
5.2.2 System Description
In support of this validation seventy-four critical uranyl nitrate experiments involvingbare and concrete or Plexiglas reflected single cylinders or arrays of cylinders wereextracted from the International Handbook of Evaluated Criticality BenchmarkExperiments [7]. The evaluation of these experiments has been documented in SRT-EMS-96-00 15 [13]. In addition, twelve critical uranium oxyflouride experimentsinvolving single water reflected spheres were extracted from drafl reports that will beissued in Reference 7. The evaluation of these experiments has been documented inEPD-CTG-95013 [14].
5.2.2.1 Single Unit Unreflected Cylinders of Uranyl Nitrate
Ten of the experiments utilized single bare cylinders of uranyl nitrate. A summary of theexperimental parameters from Reference 7 is provided in Table 31. The isotopiccomposition of the uranium used in the experiments is provided in Table 32.
9 Please note limitations listed in Section 5.2.4 before use.

WSRC-TR-99-00 I 98 SCALE 4.-I Validation for the DFS System at SRS pa:e J! 0f99(Rev. O)
,
Table 31, Reported Single Unit Cylinder Parameters
Experiment Descriptor Tank Critical inner Uranium Molarity SolutionComposition Height (cm) Diameter (cm) Concentration (Excess Nitric Density
(g/l) Acid – moles/L) (g/cm3)
HEU-SOL-THERM-OO11 304 Ss 31.20 27.92 145.68 (),294 1.20382 304 Ss 28,93 27.92 346.73 0.542 1.48003 6061 Al 33.55 28.01 142.92 (),283 1.20074 6061 Al 30.91 ~8.ol 357.71 0.549 1.49515 6061 Al 39.48 33.01 54.89 0.105 1.07586 6061 Al 36.67 33.01 59.65 0.114 1,08257 6061 Al 23.96 33.01 137.40 (),287 1.19238 6061 Al ~3,67 33.01 145.68 0.294 1,2038
9 6061 Al 22.53 33.01 357.71 0.549 1.495110 6061 Al 20.48 50.69 63.95 0.111 1.0883
Table 32, Uranium Isotopic Composition
““u 0.434‘“u 5.372
5.2.2.2 Single Unit Concrete-Reflected Cylinders Of Uranyl Nitrate
Fourteen of the experiments utilized single concrete-reflected cylinders of uranyl nitrate.A summary of the experimental parameters from Reference 7 is provided in Table 33.The isotopic composition of the uranium matches that contained in Table 32. Thecomposition of the concrete used in the experimental models is provided in Table 34.Cylinder position was varied within a -1 O-inch-thick concrete box. The insidedimensions of this box formed a rough cube(122 cm per side).
Table 33, Reported Single Unit Cylinder Parameters
Experiment Descriptor Tank Composition Critical Inner Uranium Molarity SolutionHeight Diameter Concentration (Excess Nitric Density(cm) (cm) (g/l) Acid – moles/L) (g/cm’)
HEU-SOL-THERM-O021 304 Ss 29.79 27,92 144.38 0.272 1.2023
2 304 Ss 24.19 27.92 144.38 0.272 1.2023
3 304 Ss 27.23 27.92 334.77 0.521 1.4636
4 304 Ss 21.79 27.92 334.77 0.521 1.4636
5 6061 Al 31.37 28.01 144.38 0.272 1.2023
6 6061 Al 24.70 28.01 144.38 0.272 1.2023
7 6061 Al 28.60 28.01 334.77 0.521 1.4636
8 6061 Al 22.33 28.01 334.77 0.521 1.46369 6061 Al 34.10 33.01 59.65 0.114 1.0825

WSRC-TR-99-0019S SCALE 4.4 Validation for the DFS System at SRS
(Rev. O)J
Table 33, Reported Single Unit Cylinder Parameters(continued)
Experiment Descriptor Tank Composition Critical inner Uranium Molarity SolutionHeight Diameter Concentration (Excess Nitric Density(cm) (cm) (g/l) Acid – moles/L) (g/cm3)
HEU-SOL-THERM-O0211 6061 Al ~2.85 33.01 144.38 0.272 I,~0231,2 606[ Al 18.24 33.01 144.38 0.272 1,202313 6061 Al 21.50 33.01 334.77 0.521 I.463614 6061 Al 16.78 33.01 334.77 0.521 1.4636
Table 34, Concrete Composition ( p = 2.321 g/cm3)
Isotope Wt 0/0
H 0.75K 1.37Si 15.50s 0.19
Na 0.63Ti 0.1Ca 23.0c 5.52N 0.020 48.49
Mg 1.25Al 2.17Fe 1.01
5.2.2.3 Single Unit Plexiglas-Reflected Cylinders of Uranyl Nitrate
Nineteen of the experiments utilized single Plexiglas-reflected cylinders of uranyl nitrate.A summary of the experimental parameters from Reference 7 is provided in Table 35.The isotopic composition of the uranium matches that contained in Table 32. Thecomposition of the Plexiglas used in the experimental models is provided in Table 36.Cylinder position was varied within an -8-inch-thick Plexiglas box. The insidedimensions of this box formed a rough cube(122 cm per side).

W“sRc-TR-99-oo198 SCALE 4.4 Validation for the DFS System at SRS
(Rev. O), 1
Table 35, Reported Single Unit Cylinder Parameters
Experiment Descriptor Tank Composition Critical Inner Uranium Molarity Solution,
Height Diameter Concentration (Excess Nitric Density(cm) (cm) (g/l) Acid – moles/L) (g/cm’)
HE U-SO L-THERM-O031 304 Ss 50.52 27.93 60.32 0,113 1.0837~ 304 Ss 67.48 27,93 60.32 0.113 1.08373 304 Ss 29.71 27.92 147.66 0.27 I 1.2069
4 304 Ss 25,03 27.92 147.66 0.271 1,2069
5 304 Ss 27,60 27.92 345.33 0.534 I .4779
6 304 Ss 22.75 27.92 345.33 0.534 1.4779
7 6061 Al 51.67 27.88 60.32 0.133 1,0837
8 6061 Al 31.26 28.01 147.66 0.271 1.?069
9 6061 Al 25.26 28.01 147.66 0.271 1.2069
10 606 I Al 28.84 28.01 345.33 0.534 I.477911 6061 Al 22.87 28.01 345.33 0.534 I.477912 6061 Al 34.33 33.01 60.32 0.113 1.083713 6061 Al 27.70 33.01 60.32 0.113 1.083714 6061 Al 31,75 33.01 60.32 0.113 1.083715 6061 Al 25.10 33.01 66.33 0.120 1.092016 6061 Al 22.78 33.01 147.66 0.271 1.206917 6061 Al 18.49 33.01 147.66 0.271 1,~069
18 6061 Al 21.67 33.01 345.33 0.534 1.477919 6061 Al 17.20 33.01 345.33 0.534 1.4779
Table 36, Plexiglas Composition, wt% (p side panels= 1.1863 g/cm3,p top and bottom panels= 1.286 g/cm3)
Element Top and Bottom Panels Four Side Panek(Fire Retardant) (Non-Fire Retardant)
Hydrogen 7.18 8.03Carbon 52.68 59.72
Nitrogen 0.10 Not measuredOxygen 29.4 32.14
Phosphorous 1.54 Not measuredChlorine 1.63 Not measuredBromine 6.5 Not measured
Ash 0.71 Not measured
5.2.2.4 Concrete-Reflected Arrays of Uranyl Nitrate Cylinders
Seventeen of the experiments utilized concrete reflected arrays of uranyl’nitrate cylinders.A summary of the experimental parameters from Reference 7 is provided in Table 37.Arrays of various sizes were placed with a -1 O-inch-thick concrete box that was used forthe experiments. The inside dimensions of this box formed a rough cube (122 cm perside). The isotopic composition of the uranium matches that contained in Table 32. Thecomposition of the concrete used in the experimental models is provided above in Table32.

W’SRC-TR-99-00198 SCALE 4.4 Validation for the DFS System at SRS pa:e JJ 0f99
(Rev. O)*
Table 37, Reported Concrete Reflected Array Parameters
Experiment Descriptor Tank Critical Inner Uranium Molarity Solution(array size) Composition Height (cm) Diameter Concentration (Excess Nitric Density
(cm) (g/l) Acid –moles/L) (g/cm’)HE U-SO L-THERM-O07
1(4X4X1) 6061 Al’” 28.63 21,12 67.28 0.128 1.09342(4X4X1) 6061 Al’” 17.24 21.12 369.96 0.598 1.51203(4X4X1) 6061 Al 27.15 21.12 67.28 0.128 I .0934
4(4X4X1) 6061 Al 17.13 21.12 364.11 0,584 I .50545(2 X2 XI) 6061 Al’” 60.70 21.12 76.09 0.137 1.10576(~x2xl) 6061 Al’” 29.49 21.12 360.37 0.585 1.4995
7(2x2x1) 6061 Al 62.34 21.12 76.09 0.137 1.1057
8(2x2x1) 6061 AI 31.11 21.12 364.11 0.584 1.50549(2x2x1) 6061 Al 57.88 21.12 80,72 0.143 1.1122IO(4X4 XI) 6061 Al’” 57.34 16.12 83.49 0.151 1.116411(4X4X1) 6061 Al}” 32.32 16,12 360.37 0.585 I.499512(4x4x1) 6061 Al 51.21 16.12 83.49 0.151 1.116413(4X4X1) 6061 Al 31.82 16.12 359.55 0.578 1.498414(2x4x1) 6061 Al 51.45 16.12 359.55 0.578 1.498415(2x3x1) 6061 Al 65.49 16.12 359.55 0.578 1.498416(2x2x1) 6061 Al’” 101.45 16.12 359.55 0.578 1.498417(2x2x1) 6061 Al 104.04 16.12 359.55 0.578 1.4984
5.2.2.5 Plexiglas-Reflected Arrays of Uranyl Nitrate Cylinders
Fourteen of the experiments utilized single Plexiglas-reflected cylinders of uranyl nitrate.A summary of the experimental parameters from Reference 7 is provided in Table 38.The isotopic composition of the uranium matches that contained in Table 32. Thecomposition of the Plexiglas used in the experimental models is provided in Table 36.Arrays of various sizes were placed with a -8-inch-thick Plexiglas box that was used forthe experiments. The inside dimensions of this box formed a rough cube (122 cm perside).
Table 38, Reported Plexiglas-Reflected Array Parameters
Experiment Descriptor Tank Critical Inner Uranium Molarity Solution(array size) Composition Height Diameter Concentration (Excess Nitric Density
(cm) (cm) (g/l) Acid – moles/L) (g/cm’)HE U-SOL-THERM-O08
1(4X4X1) 6061 Al’” 34.82 21.12 60.32 0.113 1.0837
2(4x4x1) 6061 Al’” 19.27 21.12 355.94 0.494 1.4925
3(4X4X1) 6061 Al 31.76 21.12 60.32 0.113 1.0837
4(4X4X1) 6061 Al 18.82 21.12 355.94 0.494 1.4925
5(2x2x I) 6061 Al’” 110.20 21.12 60.32 0.113 1.0837
6(2x2x1) 6061 Al’” 31.93 21.12 355.94 0.494 1.4925
7(2x2x1) 6061 Al 102.29 21.12 60.32 0.113 1.0837
8(2x2x1) 6061 Al 33.20 21.12 355.94 0.494 1.49259(4X4X1) 6061 Al’” 105.85 16.12 60.32 0.113 1.0837
10A 0.32 cm thick stainless steel sleeve was inserted into the tank for this experiment.
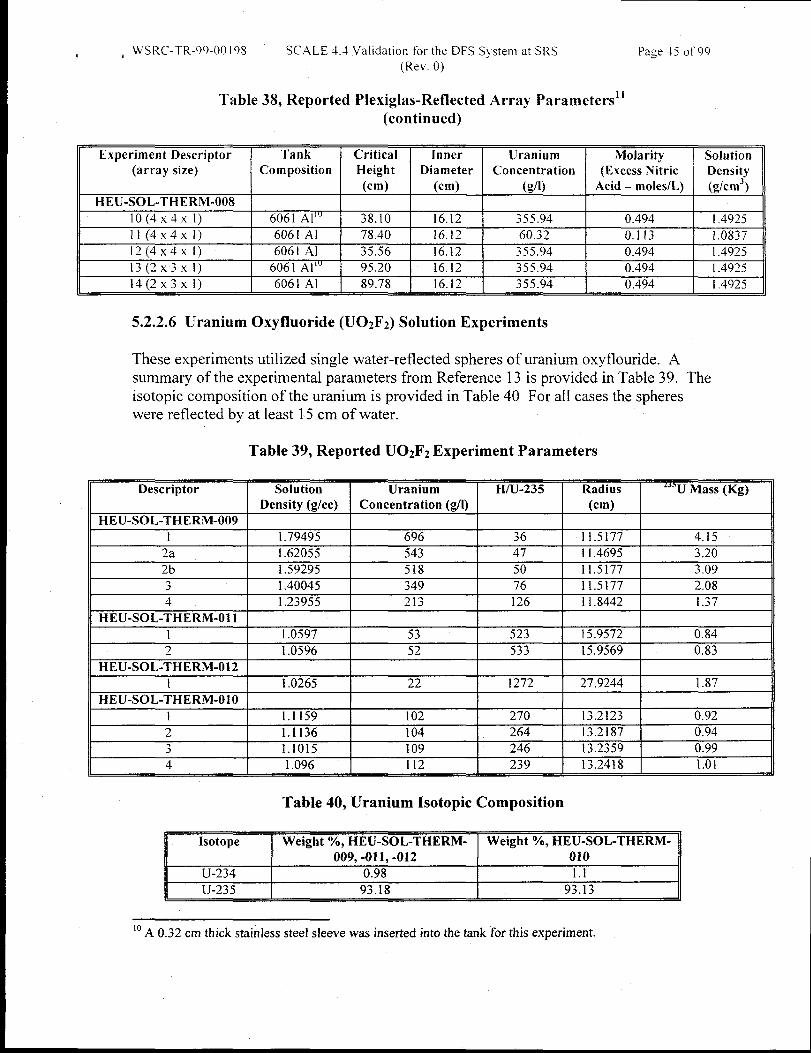
* , WSRC-TR-99-00 198 SCALE 4.4 Validation for the DFS System at SRS pa:e Jj 0f99
(Rev. O)
Table 38, Reported Plexiglas-Reflected Array Parameters”(continued)
Experiment Descriptor Tank Critical Inner Uranium Molarity Solution(array size) Composition Height Diameter Concentration (Excess Nitric Density
(cm) (cm) (g/I) Acid – moles/L) (g/cm’)HE U-SOL-THE RM-O08
10(4 X4X1) 6061 Al’” 38.10 16.12 355.94 0.494 1.492511(4X4X1) 6061 Al 78.40 /6.12 60.32 0.113 1.083712(4x4x1) 6061 Al 35.56 16,12 355.94 0.494 1.492513(2 X3 XI) 6061 Al’” 95.20 16.12 355.94 0.494 1.492514(2x 3xI) 6061 Al 89.78 16.12 355.94 0.494 1.4925
5.2.2.6 Uranium Oxyfluoride (U02F2) Solution Experiments
These experiments utilized single water-reflected spheres of uranium oxyflouride. Asummary of the experimental parameters from Reference 13 is provided in Table 39. Theisotopic composition of the uranium is provided in TabIe 40 For all cases the sphereswere reflected by at least 15 cm of water.
Table 39, Reported U02F2 Experiment Parameters
Descriptor Solution Uranium H/U-235 Radius L“U Mass (Kz) II
II Density (g/cc) I Concentration (g/l) I-.
(cm)HE U-SOL-THE RM-O09
1 1.79495 696 36 11.5177 4.15~a 1.62055 543 47 11.4695 3.20~b 1.59295 518 50 11.5177 3.093 1.40045 349 76 11.5177 2.084 1.23955 213 126 1I.8442 1.37
HEU-SOL-THERM-O111 1.0597 53 523 15.9572 0.842 1.0596 52 533 15.9569 0.83
HEU-SOL-THERM-012I 1.0265 22 1272 27.9244 1.87
HEU-SOL-THERM-O1O1 1.1159 102 270 13.2123 0.922 1.1136 104 264 13.2187 0.943 1.1015 109 246 13.2359 0.994 1.096 112 239 13.2418 1.01
Table 40, Uranium Isotopic Composition
Isotope Weight “A, HEU-SOL-THERM- Weight ?4., HEU-SOL-THERM-009,-011,-012 010
U-234 0.98 1.1U-235 93.18 93.13
10A 0.32 cm thick stainless steel sleeve was inserted into the tank for this experiment.
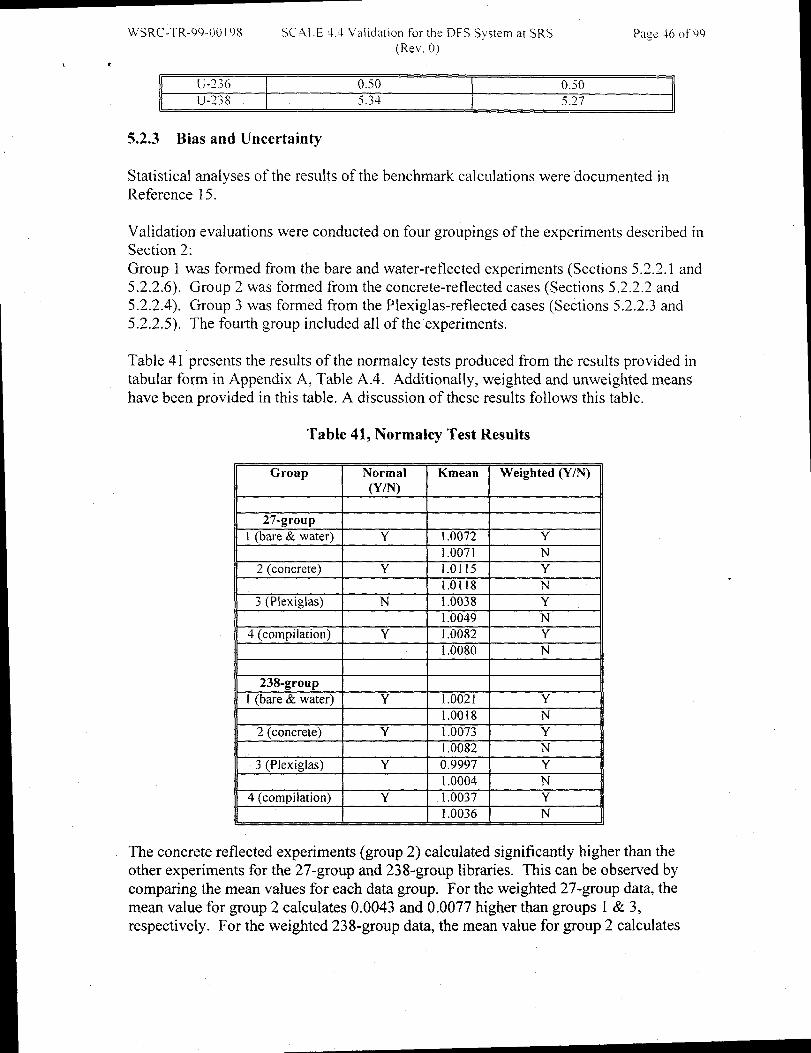
WSRC-”TR-99-00 i 98 SCALE 4.4 Validation for the DFS System at SRS page 46 of 99
(Rev, 0), *
U-236 0.50 0.50U-238 5.34 527
5.2.3 Bias and Uncertainty
Statistical analyses of the results of the benchmark calculations were documented inReference 15.
Validation evaluations were conducted on four groupings of the experiments described inSection 2:Group 1 was formed from the bare and water-reflected experiments (Sections 5.2.2.1 and5.2.2.6).5.2.2.4).5.2.2.5).
Table 41
Group 2 was formed from the concrete-reflected cases (Sections 5.2.2.2 andGroup 3 was formed from the Plexiglas-reflected cases (Sections 5.2.2.3 andThe fourth group included all of the “experiments.
presents the results of the normalcy tests produced from the results provided intabular form in Appendix A, Table A.4. Additionally, weighted and unweighed meanshave been provided in this table. A discussion of these results follows this table.
Table 41, Normalcy Test Results
Group Normal Kmean Weighted (Y/~)(YIN)
27-group1(bare& water) Y 1.0072 Y
1.0071 N2 (concrete) Y 1.0115 Y
1.0118 N3 (Plexiglas) N 1.0038 Y
1.0049 N4 (compilation) Y 1.0082 Y
1.0080 N
238-group1 (bare& water) Y 1.0021 Y
1.0018 N2 (concrete) Y 1.0073 Y
1.0082 N3 (Plexiglas) Y 0.9997 Y
1.0004 N4 (compilation) Y 1.0037 Y
1.0036 N
The concrete reflected experiments (group 2) calculated significantly higher than the
other experiments for the 27-group and 238-group libraries. This can be observed by
comparing the mean values for each data group. For the weighted 27-group data, the
mean value for group 2 calculates 0.0043 and 0.0077 higher than groups 1 & 3,
respectively. For the weighted 238-group data, the mean value for group 2 calculates

WSRC--l_R-99-O0 198 SCALE 4.4 Validation for the DFS System at SRS Page 47 of99
(Rev. O)i ‘i
0.0052 and 0.0076 higher than groups 1 & 3. respectively. The reason for this differenceis not known. A discussion of trend identification is provided.
Energy groups and H/U-235 ratios were plotted against Keffective to visually identifytrends. Data scatter hampered the identification of trends. Figures 9-12 provide the plotsthat were used to identify trends. The experimental data used to construct these plots isprovided in Appendix A, Table A.4.
Figure 9, H/U-235 Vs. Keffective - 27-group Cross Sections
1.0200
1.0100
s1.0000
0.9950
0.9900
0 500 1000 1500
HIU-235
● Bare and WaterReflected
~ Concrete Reflected
Plexiglas Reflected
Figure 10, H/U-235 Vs. Keffective - 238-group Cross Sections—
1.0200
1.0100 ~-= - ----
s
- --- ---
0.9900 I I
0 500 1000 1500
HIU-235
+ Bare and WaterReflected
u Concrete Reflected
Plexiglas Reflected

wsRc-”rR-99-oo I 98 SCALE 4.4 Validation for the DFS System at SRS Page 48 Of 99(Rev. 0)
Y ,
Figure 11, Energy Group Vs. Keffective - 27-group Cross Sections
1.0200
1.0150
1.0100
5 1.0050x
1.0000
0.9950
0.9900
.—-...—.—--— .>+-..”.. .>— .,—...
J 4Pmm
++
# ‘$”‘~
+ Bare and WaterReflected
H Concrete Reflected
Plexiglas Reflected
20 22 24 26
Average Energy Group
Figure 12, Energy Group Vs. Keffective - 238-group Cross Sections
1.0200
1.0150
1.0100
% 1.0050~
1.0000
0.9950
0.9900
+
● ✏✎✎
180 200 220 240
Average Energy Group
+ Bare and WaterReflected
~ Concrete Reflected
Plexiglas Reflected
It is possible that the data scatter was caused by the compositions selected for thereflectors. This hypothesis was tested in Reference 21 with the conclusion that concretecomposition can have a significant effect (-0.5 0/0) on Keffective. Proving that the
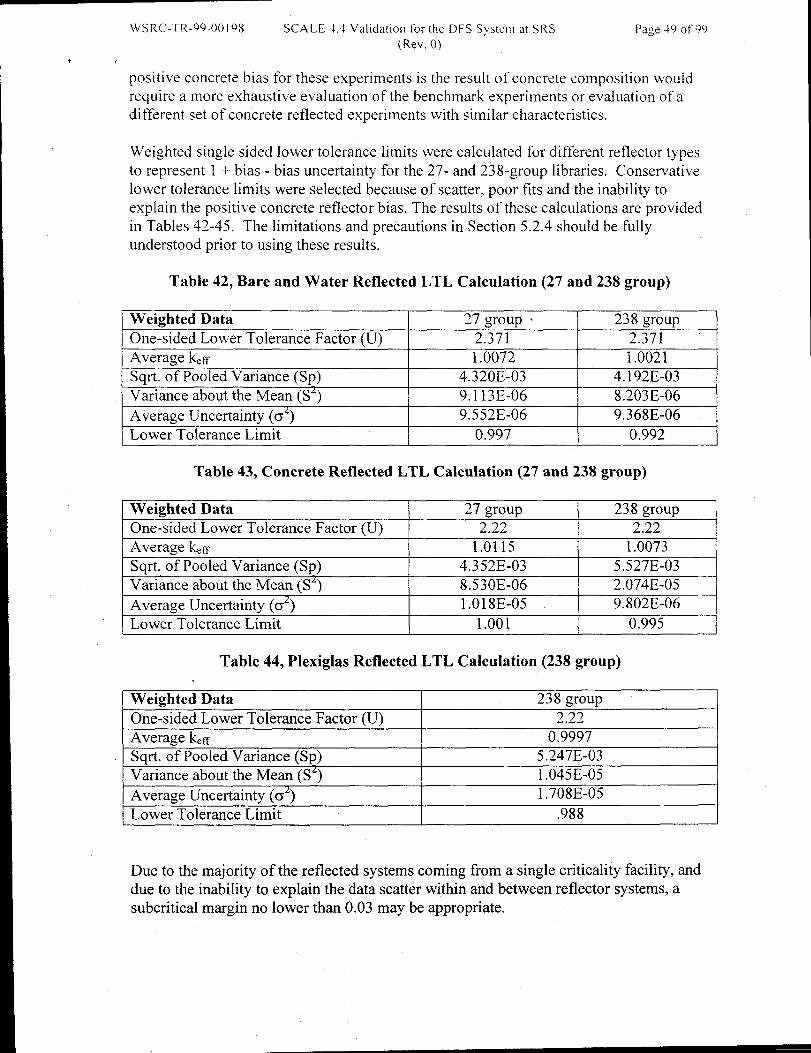
WSRC-TR-99-00198 SCALE 4.4 Validation for the DFS System at SRS pa:e 49 ~f99
(Rev. O)t r
positive concrete bias for these experiments is the result of concrete composition wouldrequire a more exhaustive evaluation of the benchmark experiments or evaluation of adifferent set of concrete reflected experiments with similar characteristics.
Weighted single sided lower tolerance limits were calculated for different reflector typesto represent 1 + bias - bias uncertainty for the 27- and 238-group libraries. Conservativelower tolerance limits were selected because of scatter, poor fits and the inability toexplain the positive concrete reflector bias. The results of these calculations are providedin Tables 42-45. The limitations and precautions in Section 5.2.4 should be fullyunderstood prior to using these results.
Table 42, Bare and Water Reflected LTL Calculation (27 and 238 group)
Weighted Data 27 group c 238 groupOne-sided Lower Tolerance Factor (U) 2.371 2.371Average k,ff 1.0072 1.0021Sqrt. of Pooled Variance (Sp) 4.320E-03 4. 192E-03Variance about the Mean (S4) 9.113E-06 8.203E-06
Average Uncertainty (CTi) 9.552E-06 9.368E-06
Lower Tolerance Limit 0.997 0.992
Table 43, Concrete Reflected LTL Calculation (27 and 238 group)
Weighted Data 27 group 238 groupOne-sided Lower Tolerance Factor (U) 2.22 2.22Average k.ff 1.0115 1.0073Sqrt. of Pooled Variance (Sp) 4.352E-03 5.527E-03Variance about the Mean (Sz) 8.530E-06 2.074E-05
Average Uncertainty (cr2) ‘,
1.018E-05 9.802E-06
Lower Tolerance Limit 1.001 0.995
Table 44, Plexiglas Reflected LTL Calculation (238 group)
Weighted Data 238 group
One-sided Lower Tolerance Factor (U) 2.22.,Average k.ff 0.9997Sqrt. of Pooled Variance (Sp) 5.247E-03Variance about the Mean (S2) 1.045E-05./
Average Uncertainty (az) 1.708E-05
Lower Tolerance Limit .988
Due to the majority of the reflected systems coming from a single criticality facility, anddue to the inability to explain the data scatter within and between reflector systems, asubcritical margin no lower than 0.03 may be appropriate.
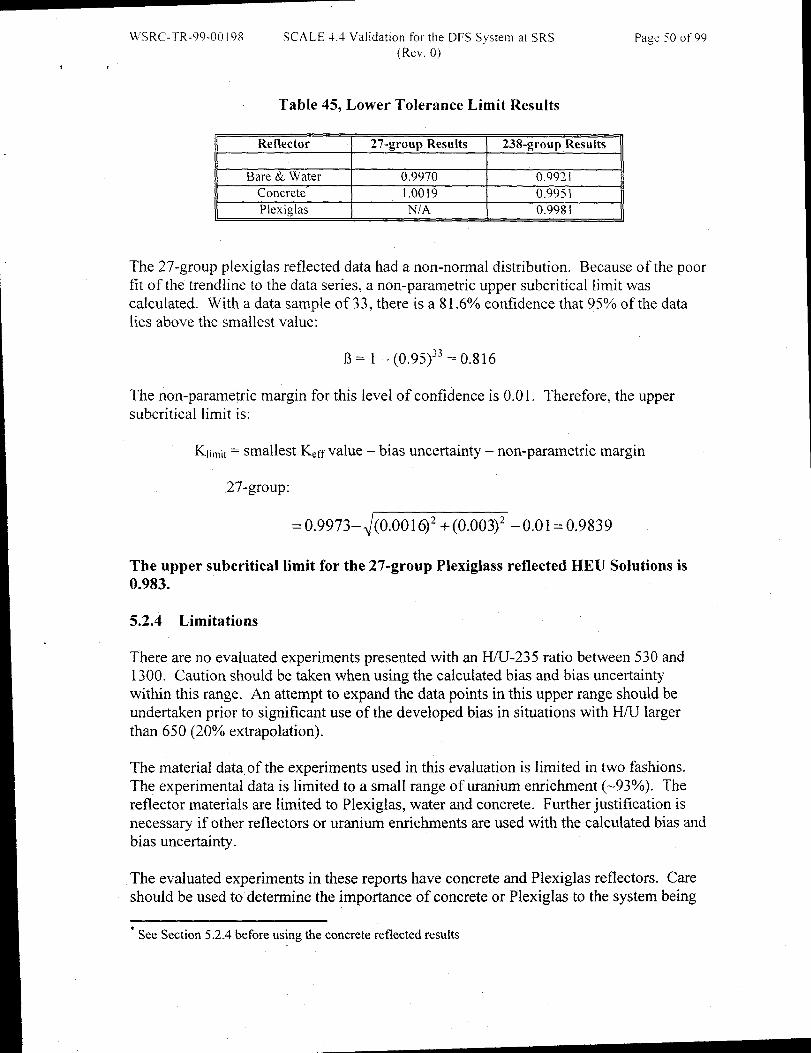
WSRC-TR-99-00 198 SCALE 4.4 Validation for the DFS System at SRS
(Rev. 0)Y
Table 45, Lower Tolerance Limit Results
Reflector I 27-group Results 238-group Results1 I
Bare & Water 0.9970 0.9921
Concrete 1.0019 0.9951
Plexiglas N/A 0.9981
Page 50 of99
The 27-group plexiglas reflected data had a non-normal distribution. Because of the poorfit of the trendline to the data series, a non-parametric upper subcritical limit wascalculated. With a data sample of33, there is a 8 1.6°/0confidence that 95°/0 of the data
lies above the smallest value:
B = 1- (0.95)33= 0.816
The non-parametric margin for this level of confidence is 0.01. Therefore, the uppersubcritical limit is:
Kli~it = smallest K.rf value – bias uncertainty – non-parametric margin
27-group:
= 0.9973–~(0.00192 +(0.003)2 -0.01= 0.9839
The upper subcritical limit for the 27-group Plexiglass reflected HEU Solutions is0.983.
5.2.4 Limitations
There are no evaluated experiments presented with an H/U-235 ratio between 530 and1300. Caution should be taken when using the calculated bias and bias uncertaintywithin this range. An attempt to expand the data points in this upper range should beundertaken prior to significant use of the developed bias in situations with HA_Jlargerthan 650 (20V0 extrapolation).
The material data of the experiments used in this evacuation is limited in two fashions.The experimental data is limited to a small range of uranium enrichment (-9370). Thereflector materials are limited to Plexiglas, water and concrete. Further justification isnecessary if other reflectors or uranium enrichments are used with the calculated bias andbias uncertainty.
The evaluated experiments in these reports have concrete and Plexiglas reflectors. Careshould be used to determine the importance of concrete or Plexiglas to the system being
* See Section 5.2.4 before using the concrete reflected results
WSRC-”TR-99-00 19s SCALE 4.-I Validation for the DFS System at SRS Page 5[ 0F99
* r (Rev, O)
modeled. Concrete and Plexiglas compositions vary. For the concrete, water and ironcontent can have significant effect on calculated Keffective values (see Reference 16).For Plexiglas, many older chemical analyses did not measure chlorine, which can alsohave a major effect.
As illustrated in Reference 21, using different SCALE standard concrete compositionscan cause variations of up to 0.005 in Keffective. It is recommended that the bias andbias uncertainty for bare/water reflected systems be used for analysis using SCALEstandard concrete compositions.

kVSRC-”TTl-99-00198 SCALE 4.4 Validation for the DFS System at SRS Page 52 of 99
(Rev. o)
,5.3 RBOF Fuels5.3.1 Explicit MTR
This section presents the SCALE validation analysis for MTR type fuel. The results ofthis analysis present weighted (including statistical and experimental uncertainties) singlesided lower tolerance limits (based on reflector composition) for the SCALE code systemwith the 27-group ENDF/B-IV and 238-group ENDF/B-V cross section libraries.Benchmark experiments selected for validation have been previously evaluated and aredocumented inN-CLC-H-00155 [23].
5.3.1.1 Area of Applicability
Key areas of applicability for these experiments include:
1.2.3.4.5.6.
7.
Fuel: MTR type fuel (uranium-aluminum alloy)Moderation: H/U-235 of about 140 (fully flooded fuel assembly)”Enrichment: High (93.3 wt ?40U-235)Moderating Material: WaterReflecting Material: WaterGeometry Fuel plates with interstitial water gaps arranged in
latticesNeutron Spectrum Thermal; 23< AEG (27)< 24.5
210 <AEG (238) <216.5
5.3.1.2 System Description
Twenty-three critical experiments involving lattices of SPERT-D fuel elements wereperformed at Oak Ridge National Laboratory (ORNL). The SPERT-D fuel elementconsists of a 3-inch square aluminum container 0.062 inches thick and 27.625 incheslong. The container holds a maximum of 22 fiel plates; each containing an average of13.93 g U-235. The fuel is a uranium-aluminum alloy with 23.8 wt.% uranium and theisotopic mixture contains 93.17 wt.70 of U-235.
Of the twenty-three experiments, sixteen were chosen as acceptable for validation. Theremaining experiments were not considered applicable because they involved cadmiumsheets or U02(N03)2 as a moderator. The configuration of the applicable experimentsincluded lattice arrangements of elements with surface to surface spacing ranging from Oto 6.37 inches.
A very detailed area of applicability is presented after the system description of theexperiments used in the validation. These experiments are compared individually to theMTR fuel description.
Problems with Data
The following discrepancies are identified:

WSRC-TR-99-00 198 SCALE 4.-I Validation for the DFS S:stem at SRS Page 53 of 99(Rev. 0),
1. The SCALE 27-group input files of each model published in the report use a unitfuel assembly with a surrounding water boundary equal to half of the surface-to-surface spacing. This gap allows for easy model development of the assemblyarray. However, Table 4 of the report specifies a reflector thickness (water)above the fuel elements. This thickness is defined as the distance from the top ofthe fuel plate to the top of the reflector. Examination of the published input filesshow that this thickness was added to the assembly water gap, thus increasing thereflector thickness ,by one-half surface-to-surface spacing. The benchmarkmodels use the reported reflector thickness and do not add this additional amountof water. This results in less reflector (although it matches the experimentdescription) in the benchmark models.
2. The wording of experiment four in Reference 7 is inconsistent. Section 3.2 of thereferenced report states that the fuel lattice is placed in a cylinder of water with adiameter of 95.885 cm and 90.4875 cm long. The length of reflector exceeds thethickness of reflector specified in Table 4 of the report. Further interpretationleads to the conclusion that the tank had the above dimensions and the experimenthad the water level thickness as specified in Table 4.
Table 46 presents the computer case numbers used for each benchmark calculation.
Table 46, Computer Modeling Case Numbers
HEU-MET-THERM-O06 27-Group Cross Section Library 238-Group Cross Section LibraryExperiment Case Number Case Number
1 HEUMTSO1.27 HEUMTSO1.2382 HEUMTS02.27 HEUMTS02.2383 HEUMTS03.27 HEUMTS03.2384 HEUMTS04.27 HEUMTS04.2385 HEUMTS05.27 HEUMTS05.2386 HEUMTS06.27 HEUMTS06.2387 HEUMTS07.27 HEUMTS07.2388 HEUMTS08.27 HEUMTS08.2389 HEUMTS09.27 HEUMTS09.23810 HEUMTS1O.27 HEUMTS1O.23811 HEUMTS 11.27 ‘HEUMTS 11.23812 HEUMTS12.27 HEUMTS12.23813 HEUMTS13.27 HEUMTS 13.23814 HEUMTS14.27 HEUMTS14.23815 HEUMTS15.27 HEUMTS 15.23816 HEUMTS16.27 HEUMTS16.238
Material Selection
The benchmark experiment models were modified from the original models described inReference 7. The original input files specifi material properties by individual element
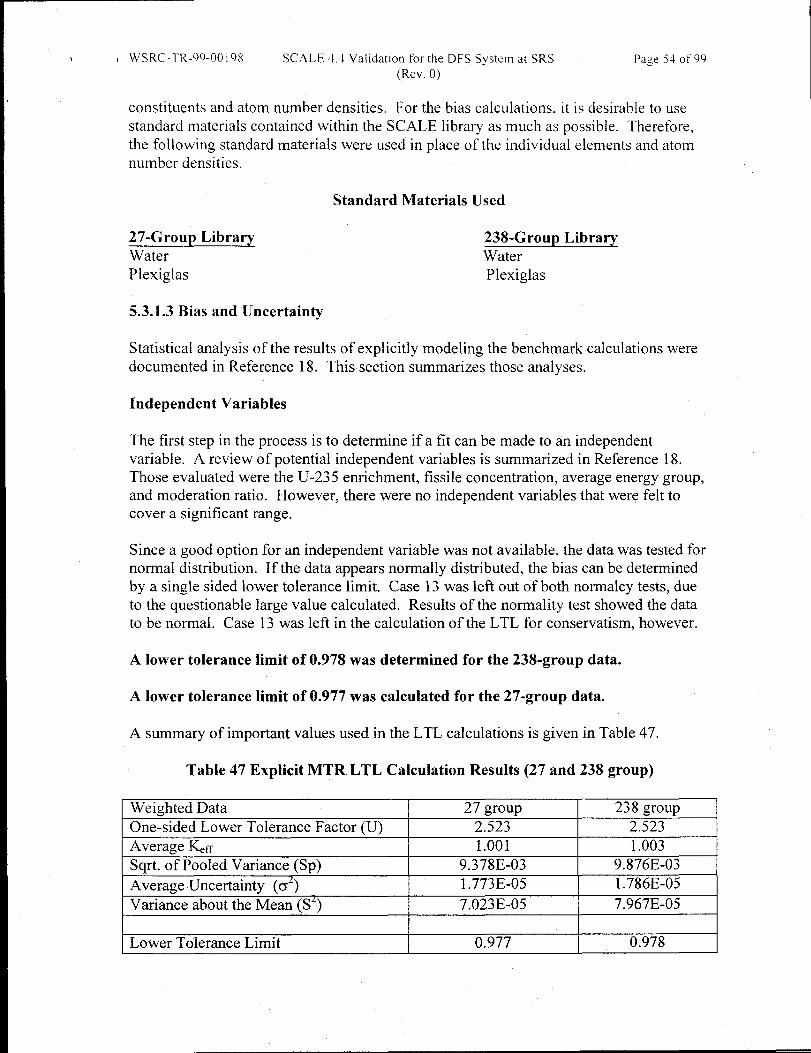
1’ t W’SRC-TR-99-00198 SCALE 4.4 Validation for the DFS System at SRS Page 54 ot’99
I (Rev. O)
Iconstituents and atom number densities. For the bias calculations. it is desirable to use
standard materials contained within the SCALE library as much as possible. Therefore,
the following standard materials were used in place of the individual elements and atom
number densities.
I Standard Materials Used
I27-Group Library 238-Group LibraryWater WaterPlexiglas Plexiglas
I 5.3.1.3 Bias and Uncertainty
I Statistical analysis of the results of explicitly modeling the benchmark calculations weredocumented in Reference 18. This section summarizes those analyses.
I Independent Variables
IThe first step in the process is to determine if a fit can be made to an independentvariable. A review of potential independent variables is summarized in Reference 18.Those evaluated were the U-23 5 enrichment, fissile concentration, average energy group,and moderation ratio. However, there were no independent variables that were felt to
I cover a significant range.
ISince a good option for an independent variable was not available, the data was tested fornormal distribution. If the data appears normally distributed, the bias can be determinedby a single sided lower tolerance limit. Case 13 was left out of both normalcy tests, dueto the questionable large value calculated. Results of the normality test showed the datato be normal. Case 13 was lefl in the calculation of the LTL for conservatism, however.
I A lower tolerance limit of 0.978 was determined for the 238-group data.
I A lower tolerance limit of 0.977 was calculated for the 27-group data.
A summary of important values used in the LTL calculations is given in Table 47.
Table 47 Explicit MTR LTL Calculation Results (27 and 238 group)
Weighted Data 27 group 238 group
One-sided Lower Tolerance Factor (U) 2.523 2.523Average Kff 1.001 1.003
Sqrt. of Pooled Variance (Sp) 9.378E-03 9.876E-03
Average Uncertainty (cr~) 1.773E-05 1.786E-05
Variance about the Mean (Sz) 7.023E-05 7.967E-05
I I
Lower Tolerance Limit 0.977 0.978

WSRC-TR-99-00 I 98 SCALE 4.4 Validation for the DFS System at SRS Page 55 of 99r (Rev. O)
Since only a single set of experiments was used in this validation and the materialloadings and enrichments were constant, an area of applicability margin of at least 0.03may be appropriate for fuel types that fall within the area of applicability tables.
5.3.1.4 Limitations
The lower tolerance limits in 5.3.1.3 were developed for explicitly modeled MTR fuel,and only apply to the range of applicability specified in the Table of Applicability.Although the parameters of the benchmark experiments do not completely envelopeMTR type fuel, the applicability parameters are considered sufficient for analysis ofMTR type ft~el in flooded conditions.
5.3.2 Homogenized MTR Type Fuel
This section presents the SCALE 4.4 validation analysis for use with homogeneouslymodeled MTR type fuel. The results of this analysis present a code bias (includingstatistical and experimental uncertainties) lower tolerance limit for the 27 group cross-section library and the 238 group cross-section library.
5.3.2.1 Area of Applicability
Key areas of applicability for this validation include:
1. Fuel: MTR type fuel (uranium-aluminum alloy)2. Moderation: H/U-235 of about 140 (fully flooded fuel assembly)3. Enrichment: High (93.5 wt’YoU-235)4. Geometry: Fuel plates and interstitial water gaps homogenized
and arranged in lattices (24.6<4 V/S<48.3)5. Moderating Material: Water6. Neutron Spectrum: Thermal; 23<AEG(27)<24.5,
2 10<AEG(238)<2 16.5
5.3.2.2 System Descriptions
The same SPERT-D experiments described in 5.3.1.2 were utilized in this aspect of thevalidation as well. In this case however, they were modeled with the fuel regionshomogenized. Previous analysis has shown that a full homogenization of the fiel regionwill result in a conservative calculation of the ~ff (Ref. 14). Reference 14 alsodemonstrates that the use of this conservative modeling scheme will enable theappropriate and conservative use of the HEU solution bias.

WSRC-TR-99-0019S SCALE 4.4 Validation for the DFS System at SRS pa~~ 56 of 99
(Rev. O),
For the full homogenization approach, all of the aluminum structure. including all of the
aluminum in each plate, the support plate, and the aluminum box, was included in a cell.
This homogenized cell is the length of a fuel plate and includes the aluminum in the fuel
plates and the side boxes. The SPERT-D element has an extension of water andaluminum box at the top extending for 6.35 cm. This was modeled as a separatehomogenized water-aluminum region and included in the lattice model except for cases10, 11, and 12 for which the end boxes were removed. Characteristics of the fullyhomogenized SPERT-D fuel are in Table 48.
Table 48 22-Plate SPERT-D Element, Including all Aluminum Structure
Dimensions 7.6098 X 7.6098 X 63.8175 cm(22 plates)
Volume 3.696 Liters
Uranium 89 dLAluminum 1454 ~/L
Water 451 g/LMixture 1.944 glee
Enrichment 93.17 Wt”h U-235
tO/F 71
(Al + 0)/F 224
5.3.2.3 Bias and Uncertainty
Computed ~t~ values for fully homogenized SPERT assembles and explicitly modeledSPERT assemblies are analyzed in Reference 14. The Shapiro-Wilk test was used toevaluate the normalcy of each distribution. In spite of the fact that the distributions inReference 14 are not normal, a single-sided lower tolerance limit was calculated for eachand the results are shown in Table 49. Although the distributions are not normallydistributed, the computation was made to compare with the results for the uraniumaqueous spheres. These tolerance limits include the bias and bias uncertainty but do notinclude a minimum subcritical margin (MSM).
Table 49 Reference 14 SPERT Lower Tolerance Limits
Explicit Full Horn.k.ff 1.0009 1.0429 Mean Weighted lGM
u 2.523 2.523 One-Sided Tolerance Factor
s 0.0091 0.0154 Variance about Mean
G 0.0042 0.0042 Average Statistical Uncertainty
s 0.0100 0.0159 Pooled Variance
LTL 0.976 1.003 Lower Tolerance Limit
—
WSRC-TR-99-00 I 98 SCALE 4.4 Validation for the DFS System at SRS Page 57 of Qcl(Rev. O)
The lower tolerance limit for the full homogenization is higher than that for the explicitrepresentation by several percent.
The one-sided lower tolerance limit for the uranium aqueous spheres with the 27-grouplibrary is 0.997 and for the full homogenization is 1.003. Implicit in this comparison isthe assumption that the distribution of computed ~tY values for the full homogenizationcases can be treated as a normal distribution. These lower tolerance limits differ by lessthan 1!40, with the uranium aqueous spheres values the lower of the two. Therefore, using
the sphere data for fully homogenized SPERT-like fuels is appropriate and conservative.
The final results are lower tolerance limits of 0.997 for 27 group and 0.992 for 238group for fully homogeneously modeled MTR fuel assemblies. These valuescorrespond with the bare and water reflected uranium solution lower tolerance limitscalculated in Section 5.2.3.
Since only a single set of experiments has been used in this validation, and the materialloadings and enrichments were constant, a subcritical margin of at least 0.03 maybeappropriate for fuel types which fall within the area of applicability tables for MTR fuels.
5.3.2.4 Limitations
The lower tolerance limits in 5.3.2.3 were developed for homogeneously modeled MTRfuel using the full homogenization model, and only apply to the range of applicabilityspecified in the Table of Applicability. Although the parameters of the benchmarkexperiments do not completely envelope MTR type fuel, the applicability parameters areconsidered sufficient for analysis of MTR type fuel in flooded conditions.
The conclusion of this study of the homogenized SPERT D critical experiments is thatthey are bounded by the uranium aqueous spheres and that the lower tolerance limitgenerated for the uranium aqueous spheres is appropriate for the homogenized SPERT Dfuel. It should be noted however, that the full homogenization scheme used in Reference14 must be followed in order to use the uranium solution bias.
Use of albedos for boundary conditions and neutron weighting in reflectors has not beentested or validated in this validation.
6. Acknowledgments
This compilation document is the latest version in a string of past SCALE validationdocuments. The following individuals have contributed to previous documents, on whichthis work was largely based.
D. Biswas J. Justice R. W. Rathbun T.G. WilliamsonR.L. Frost K. Kimball S.M. RevolinskiG.P. Kessler S.Y. Lee E. F. Trumble
WSRC-TR-99-00 I 9S! SCALE 4.4 Validation for the DFS System at SRS Page 58 of99, ,
7.
1.
2.
3.
4.
5.
6.
/
7.
8.
9.
10.
11.
12.
13.
(Rev. 0)
References
ANSI/ANS 8.1-1983, Nuclear Criticality Safety in Operations with FissionableMaterial, 1983.
WSMS-CRT-99-0030 “Software Configuration and Control Guidance forSCALE (U).” O. Rivera, April 30, 1999.
EPD-CTG-950030, “Criticality Code Validation Plan (U)”, E. F. Trumble, April1995.
WSRC Nuclear Criticality Safety Methods Manual (U), WSRC-IM-96- 133,September 1996.
SRT-EMS-96-00 17, “KENO V.a Validation Studies Of Criticality ExperimentsFor Single Unit Plutonium Metal Systems (U)”, Rev. O, Lee, S. Y., March 1996.
N-CLC-H-01 78, “SCALE 4.2 Validation Initiation - Criticality BenchmarkEvaluation of PU-MET-FAST-003, -004, & -017 From NEA/NSC/DOC(95)93/I(U), Rev. O,” Justice, J. B., June 1996.
NEA/NSC/DOC(95) 03/11, International Handbook of Evaluated Criticality SafetyBenchmark Experiments, Volume Ha, Highly Enriched Uranium Systems, NEANuclear Energy Agency, Organization for Economic Co-operation andDevelopment.
N-CLC-F-00064, “Scale 4.2 Validation - Bare and Hydrogenously Reflected Pumetal System”, J. B. Justice, September 1996.
N-CLC-F-00060, “KENO V.a Validation Studies of Criticality Experiments forSingle Unit Plutonium Metal Systems (U), Rev. l“, Rathbun, R. W., July 1996.
SRT-EMS-95-O084, “KENO V.a Validation Studies of Criticality Experimentsfor Single Unit Plutonium Solution System (U), Rev. O”, Lee, S. Y., December1995:
N-CLC-F-00063, “Bare and Water Reflected Single Unit Plutonium NitrateSolutions”, J. B. Justice, September 1996.
H. K. Clark, “Subcritical Limits for Pu Systems”, Nuclear Science andEngineering, 79, pp. 65-84 (1981).
SRT-EMS-96-0015, “KENO V.a Validation Studies Of Criticality ExperimentsFor Highly Enriched Uranium Solution Systems (U), Rev. O“, Lee, S. Y., March1996.

WSRC-TR-99-00 I 98 SCALE 4..4 Validation for the DFS System at SRS Page 59 of99
14.
15.
16.
17.
18.
19.
20.
21.
22.
23.
24.
25.
26.
27.
(Rev. O)
EPD-CTG-950 13, “Validation Of LAW-44, 27-group ENDF/B-IV And MCNPCross Sections For Enriched Uranium Solutions, Rev. 1”, Williamson, T.G.,August 1996.
N-CLC-H-00233, “Bare, Water, Concrete and Plexiglas Reflected HighlyEnriched Solution Systems”, J. B. Justice, October 1996.
EPD-CTG-960054, “Effect of Concrete Reflector on Criticality Safety Analysisof MTR Type Fuels in RBOF/L-Basin”, D. Biswas, September 1996.
Deleted
N-CLC-H-00 155, “SCALE 4.2 Analysis of MIT Type Fuel with 27-group and238-group Cross Section Libraries”, K. D. Kimball, December 1995.
Rutherford (Chair) .’’Forecast of Criticality Experiments and ExperimentalPrograms Needed to Support Nuclear Operation in the United States of America,1994-1 999,’’LA-12683, Appendix E, July 1994.
Chart of the Nuclides, General Electric Co. 1984.
WSRC-IM-97- 17, “Westinghouse Savannah River Company Scale 4.2Workstation Validation.” August 6, 1997.
LA-UR-97-141, “The Relationship Between Keff and the Fraction of CriticalMass.” R. Douglas O’Dell and D. Kent Parsons. June 1997.
N-CLC-H-00 155, “SCALE 4.2 Analysis of MIT Type Fuel with 27-Group and238-Group Cross Section Libraries”, K. D. Kimball, December 1995.
WSMS-CRT-98-0063, “SCALE-4.3 and MCNP-4B Validation – CriticalityBenchmark Evaluation of Uranium Metal Systems.” G. Kessler, September 1998.
WSMS-CRT-99-O031, “SCALE 4.4 Test Report”, O. Rivera, April 30, 1999.
WSRC-RP-99-O0437, “Software Configuration and Control Guidance for SCALEon WSRC Workstation”, O. Rivera, June 30, 1999.
WSRC-RP-99-O0438, “WSRC SCALE 4.4 Test Report”, O. Rivera, July 7, 1999.
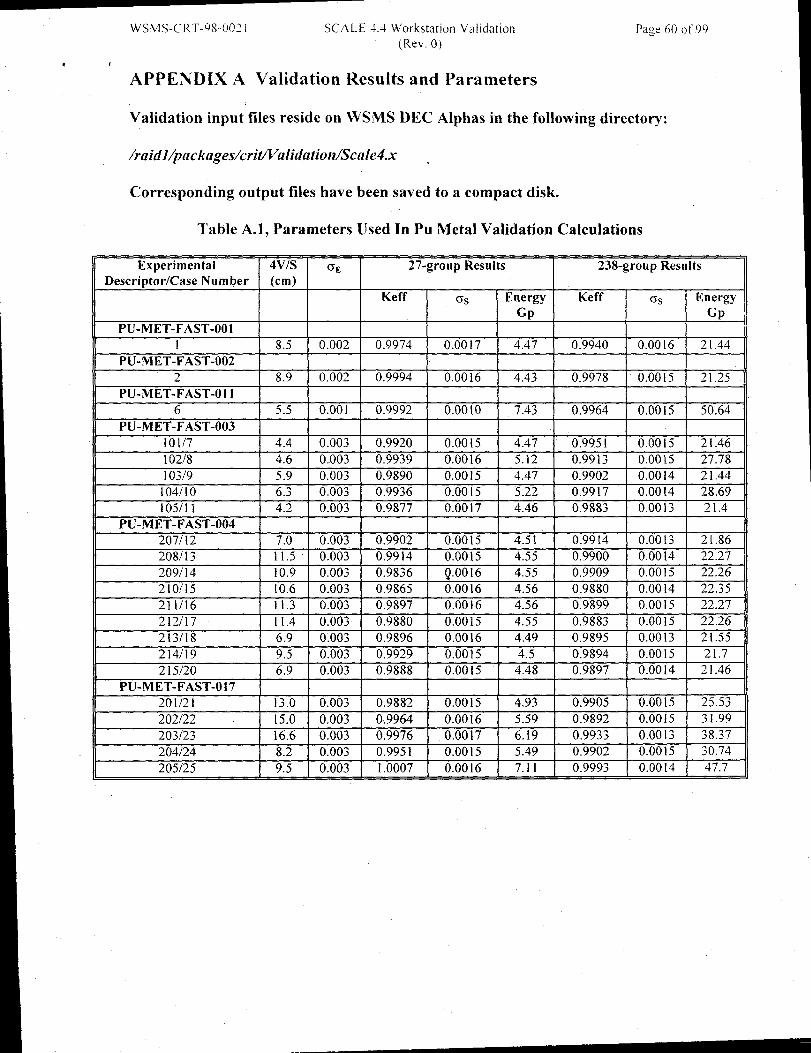
WSMS-CRT-98-002 I SCALE 4.4 Workstation Validation page 60 of 99
(Rev. O)
8 r
APPENDIX A Validation Results and Parameters
Validation input files reside on WSMS DEC Alphas in the following directory:
/i=widl/packages/criWalidation/Sca[e4.x ,
Corresponding output files have been saved to a compact disk.
Table Al, Parameters Used In Pu Metal Validation Calculations
Experimental 4VLS a~ 27-group Results 238-group ResultsDescriptor/Case Number (cm)
Keff q Energy Keff as EnergyGp Gp
PU-MET-FAST-OO11 8.5 0.002 0.9974 0.0017 4.47 0.9940 0.0016 21,44
PU-MET-FAST-O022 8.9 0.002 0.9994 0.0016 4.43 0.9978 0.0015 2],25
PU-MET-FAST-0116 5.5 0.001 0.9992 0.0010 7.43 0.9964 0.0015 50.64
PU-MET-FAST-O03101/7 4.4 0.003 0.9920 0.0015 4.47 ‘0.9951 0.0015 21.46102/8 4.6 0.003 0.9939 0.0016 5.12 0.9913 0.0015 27.78103/9 5.9 0.003 0.9890 0.0015 4,47 0.9902 0.0014 21.44
104/10 6.3 0.003 0.9936 0.0015 5.22 0.9917 0.00[4 28.69105/11 4.2 0.003 0.9877 0.0017 4.46 0.9883 0.0013 21.4
PU-MET-FAST-O04207/12 7.0 0.003 0.9902 0.0015 4.51 0.9914 0.0013 21.86208/13 11,5 0,003 0.9914 0.0015 4.55 0.9900 0.0014 22.27209/14 10.9 0.003 0.9836 Q.0016 4.55 0.9909 0.0015 22.26210/15 10.6 0.003 0.9865 0.0016 4.56 0.9880 0.0014 22.35211/16 11.3 0.003 0.9897 0.0016 4.56 0.9899 0.0015 22.27212/17 11.4 0.003 0.9880 0.0015 4.55 0.9883 0.0015 22.26213/18 6.9 0.003 0.9896 0.0016 4.49 0.9895 0.0013 21.55214/19 9.5 0.003 0.9929 0.0015 4.5 0.9894 0.0015 21.72 15/20 6.9 0.003 0.9888 0.0015 4.48 0.9897 0.0014 ~ 1.46
PU-MET-FAST-017201/21 13.0 0.003 0.9882 0.0015 4.93 0.9905 0.0015 25.53202122 15.0 0.003 0.9964 0.0016 5.59 0.9892 0.0015 31.99203/23 16.6 0.003 0.9976 0.0017 6.19 0.9933 0.0013 38.37204/24 8.2 0.003 0.9951 0.0015 5.49 0.9902 0.0015205/25 9.5 0.003
30.741.0007 0.0016 7.11 0.9993 0.0014 47.7
I

I
1WSMS-CR”~-9S-002 I SCALE -!4 Workstation Validation Page61 of<~9
(Rev.0).
L ,
Table A.2, Parameters Used in Pu Solution Validation Calculations
Exp. Descriptor/ 4vis H/ GE 27 Cr. Results 238 Gr. ResultsCase (cm) Pu-239
Keff. 0s Keff. usN-CLC-F-00060
PU-SOL-THERM-O091 81.3 ~650 0.003 I 1.0266 0.0017 1.0189 0.00102 81.3 278 I 0.0031 1.0321 0.0016 1.0268 0.00083 81.3 2805 0.0031 1.0281 0.0020 1.0219 0.0009
PU-SOL-THERM-01118-[/8 30.5 [~09 0.0052 1.0043 0.0015 0.9997 0.001318-2/9 30.5 1156 0.0052 1.0075 0.0013 1.0074 0.0012
18-3/10 30.5 1101 0.0052 1.0048 0.0015 1.0015 0,001518-4/1 1 30.5 1040 0.0052 1.0143 0.0013 1.0097 0.001318-5/12 30.5 909 0.0052 1.0108 0.0016 1.0082 0.001318-6/13 30.5 1103 0.0052 1.0096 0.0015 1.0056 0.0014
PU-SOL-THERM-0121114 39.3 1724 0.0043 1.0143 0.0012 1.008 I 0.00 [ I J2/15 43.2 1922 0.0043 1.0130 0.0012 1.0129 0.00[ I3/16 45.9 2038 0.0058 1.0187 0.0011 1.0134 0.00114/17 53.6 23t4 0.0058 1.0156 0.0009 1.0146 0.00105/18 65.6 2577 0.0058 1.0217 0.0009 1.0162 0.00096/19 26. I 311 0.0007 --1.0191 0.0015 1.0119 0.00157/20 26.1 396 0.0013 1.0162 0.0016 1.0097 0.00148/~ 1 27.7 634 0.0013 1.0148 0.0016 1.0111 0.00149/22 32.1 1056 0.0043 1.0211 0.0014 1.0183 0.001110/23 34.1 1254 0.0043 1.0169 0.0013 1.0105 0.001511/24 38.3 1569 0.0043 1.0169 0.0013 1.0137 0.001212/25 40.9 1724 0.0043 1.0171 0.0012 1.0139 0.001213/26 66.2 2576 0.0058 1.0209 0.0011 1.0150 0.001014/27 I 29.9 634 0.0013 1.0091 0.0014 1.0074 0.0013!5128 33.9 1056 0.0043 I 1.0189 0.0016 1.0130 0.001316/29 I 35.8 1254 0.0043 1.0118 0.0016 1.0080 0.001417/30 39.9 1569 0.0043 1.0145 0.0013 1.0114 0.001018/3 1 42.4 1724 0.0043 1.0174 0.0012 1.0122 0.001319/32 45.9 1922 0.0043 1.0165 0.0013 1.0141 0.001120/33 48.4 2038 0.0058 1.0175 I 0.0013 1.0143 0.001121/34 55.9 2314 0.0058 1.0175 0.0011 1.0142 0.000922/35 67.2 2576 0.0058 1.0174 I 0.0013 1.0150 I 0.0010
23/36 67.4 2576 0.0058 1.0220 0.0011 1.0153 0.0009
PU-SOL-THERM-OO1 I1/37 19.3 371 0.0050 1.0164 0.0017 1.0132 0.00152/; 8 19.3 272 0.0050 1.0185 0.0016 1.0100 0.00153/39 19.3 216 0.0050 1.0196 0.0017 1.0138 0.0014
4/40 19.3 190 0.0050 1.0107 0.0018 1.0047 0.00185/4 1 19.3 180 0.0050 1.0168 0.0018 1.0117 0.0015
6/42 19,3 91.2 0.0050 1.0209 I 0.0017 1.0095 I 0.0016

WSWIS-CR’T-98-OO? i SC,4LE 4.1 Workstation Validation Page 6? of 99(Rev. O)t r
Table A.2, Parameters Used [n Pu Solution Validation Calculations(continued)
Exp. Descriptor/ 4VIS HI GE 27 Cr. Results 238 G r. ResultsCase (cm) Pu-239
Keff. crs Keff. 0sPU-SOL-THERM-O02
1/43 20.4 524 0.0047 1.0155 0.0015 1.0080 0.00142/44 20.4 504 0.0047 1.0143 0.0016 1.0094 0,00173/45 20.4 451 0.0047 1.0118 0.0016 1.0073 0.00174/46 20.4 420 0.0047 1.0151 0.0016 1.0’108 0.00155/47 20.4 392 0.0047 1,0198 0.0016 1.0122 0.00146/48 20.4 344 0.0047 1.0127 0.0015 1,0058 0.00157/49 20.4 308 0.0047 1.0200 0.0015 1.0109 0.0015
PU-SOL-THERM-O03l/50 22.0 788 0.0035 1.0159 0.0015 1.0074 0.0014~jj 1 22.0 756 0.0035 1.0132 0.0017 1.0070 0.00143/52 22.0 699 0.0035 1.0149 0.0018 1.0092 0.00144153 22.0 68 I 0.0035 1.0145 0.0015 1.0084 0.00145/54 22.0 626 0.0035 1.0175 0.0016 1.0076 0.00146/55 22.0 562 0.0035 1.0178 0.0017 1.0111 0.00147/8 1 22.0 987 0.0035 1.0167 0.0015 1.0131 0.00128/82 22.0 976 0.0035 1.0149 0.0015 1.0094 0.0014
PU-SOL-THERM-O041/56 23.7 934 0.0047 1.0137 0.0015 1.0088 0.00182/57 23.7 888 0.0047 1.0094 0.0014 1.0019 0.00153/58 23.7 942 0.0047 1.0132 0.0016 1.0058 0.00144/59 23.7 927 0.0047 1.0104 0.0016 1.0030 0.00145/60 23.7 892 0.0047 1.0101 0.0015 1.0042 0.00[46/6 I 23.7 869 0.0047 1.0118 0.0015 1.0056 0.00127/62 23.7 804 0.0047 1.0144 0.0015 1.0102 0.00168/63 23.7 688 0.0047 1.0136 0.0015 1.0067 0.00129/64 23.7 590 0.0047 1.0116 0.0014 1.0001 0.001510/65 23.7 892 0.0047 1.0138 0.0016 1.0068 0.001411/66 23.7 903 0.0047 1.0103 0.0018 1.0037 0.001412/67 23.7 903 0.0047 1.0130 0.0015 1.0080 0.001313/68 23.7 868 0.0047 1.0116 0.0015 1.0052 0.0014
PU-SOL-THERM-O051/69 23.7 834 0.0047 1.0126 0.0015 1.0069 0.00132/70 23.7 764 0.0047 1.0138 0.0016 1.0085 0.00143/7 1 23.7 693 0.0047 1.0116 0.0015 1.0070 0.00154/72 23.7 632 0.0047 1.0167 0.0015 I.O1O5 0.00155/73 23.7 600 0.0047 1.0191 0.0015 1.0110 0.00126/74 23.7 868 0.0047 1.0187 0.0016 1.0093 0.00147/75 23.7 825 0.0047 1.0143 0.0016 1.0072 0.00148/76 23.7 1061 0.0047 1.0088 0.0016 1.0022 0.00129/77 23.7 1017 0.0047 1.0128 0.0015 1.0085 0.0013
PU-SOL-THERM-O061/78 25.4 939 0.0035 1.0101 0.0015 1.0056 0.00142/79 25.4 738 0.0035 1.0118 0.0015 1.0072 0.00143/80 25.4 714 0.0035 1.0113 0.0014 1.0059 0.0015

bVSMS-CR r-98-13021 SCALE 4.4 Workstation Validation Page 63 Of 99
t * (Rev. O)
Table A.3, Parameters Used In Uranium Metal Validation Calculations
Experimental 4VIS cr~ 27-group Results 238-group ResultsDescriptor/Case Number (cm)
Keff 6s Energy Keff as EnergyGp Gp
HEU-MET-FAST-OO11 11.7 0.00 I 1.0057 0.0012 4.85 0.9975 0.0012 24.39-) 0.001 1.0040 0.0011 4.86 0.9971 0.0014 24.41
HE U-MET-FAST-0023 8. I 0.003 1.0036 0.0014 4.88 1.0021 0.0013 25.324 7.1 0.003 1.0084 0,0013 4.89 1.0029 0.0012 25.495 6.8 0.003 1.0047 0.0014 4.90 1.0026 0.0015 25.566 6.4 0.003 I.0034 0.0014 4.91 0.9996 0.0014 25.667 6.4 0.003 1.0055 0.0014 4.9 I 1,0009 0.0013 25.768 6.5 0.003 1.0076 0.0014 4.90 1.0016 0.0013 25.67
HEU-MET-FAST-O039 9 0.005 0.9997 0.0012 4.87 0.9931 0.0013 24.83
10 8.6 0.005 0.9998 0.0012 4.87 0.9931 0.0012 24.9311 8.4 0.005 1.0033 0.0012 4.87 0.9978 0.0012 25.0112 8.2 0,003 1.0026 0.0012 4.86 0.9962 0.0013 25.0913 8.1 0.003 1.0056 0.0013 4.87 0.9994 0.0013 25.2514 8.1 0.003 1.0036 0.0014 4.88 1.0021 0.0013 25.3215 8 0.003 1.0067 0.0014 4.89 1.0037 0.0015 25.5116 8.8 0.005 1.0037 0.0012 5.2o 1.0055 0.0014 27.2417 8.3 0.005 1.0012 0.0011 5.30 1.0047 0.00 I 1 28.1418 8.1 0.005 1.0027 0.0011 5.37 1.0096 0.0013 28.8919 8 0.005 1.0066 0.0011 5.40 1.0121 0.0012 29.1320 .005 1.0498 0.0011 5.26 1,0200 0.0013 26.82
HEU-MET-FAST-O0422 8.7 0.002 1.0015 0.0013 8.50 0.9928 0.0013 60.98
HEU-MET-FAST-O0723 10.3 0.001 1.0014 0.0012 4.84 0.9956 0.0011 24.2724 10.9 0.001 1.0057 0.0014 5.39 0.9940 0.0015 28.7525 11 0.001 1.0057 0.0014 5.63 0.9926 0.0013 30.9526 Ill 0.001 1.0084 0.0014 5.73 0.9906 0.0017 31.7827 11.3 0.001 1.0059 0.0014 5.96 0.9905 0.0013 33.8128 11.4 0.001 1.0091 0.0016 6.40 0.9964 0.0013 38.4729 11.4 0.001 1.0076 0.0013 6.17 0.9930 0.0013 35.9330 11.4 0.001 1.0068 0.0014 6.14 0.9916 0.0014 35.5031 11.5 0.001 1.0066 0.0016 6.27 0.9939 0.0014 37,07
32 12.2 0.001 1.0094 0.0014 8.08 0.9902 0.0012 55.9233 12.8 0.001 1.0173 0.0016 9.66 0.9898 0.0014 72.72
34 12.9 0.001 1.0147 0.0016 9.99 0.9921 0.0014 76.54
35 12.8 0.001 1.0116 0.0013 10.66 0.9919 0.0013 83.58
36 12.9 0.001 1.0138 0.0014 10.06 0.9916 0.0016 77.59
37 12.7 0.001 1.0101 0.0013 10.54 0.9900 0.0016 82.20
38 12.7 0.001 1.0082 0.0017 10.57 0.9885 0.0015 82.45
39 13.4 0.001 1.0181 0.0014 12.84 0.9948 0.0014 106.7440 13.5 0.001 1.0172 0.0015 12.88 0.9960 0.0014 107.64
41 10 0.001 1.0040 0.0014 4.84 0.9959 0.0013 24.34
42 11 0.001 1.0036 0.0016 6.13 0.9937 0.0013 35.80
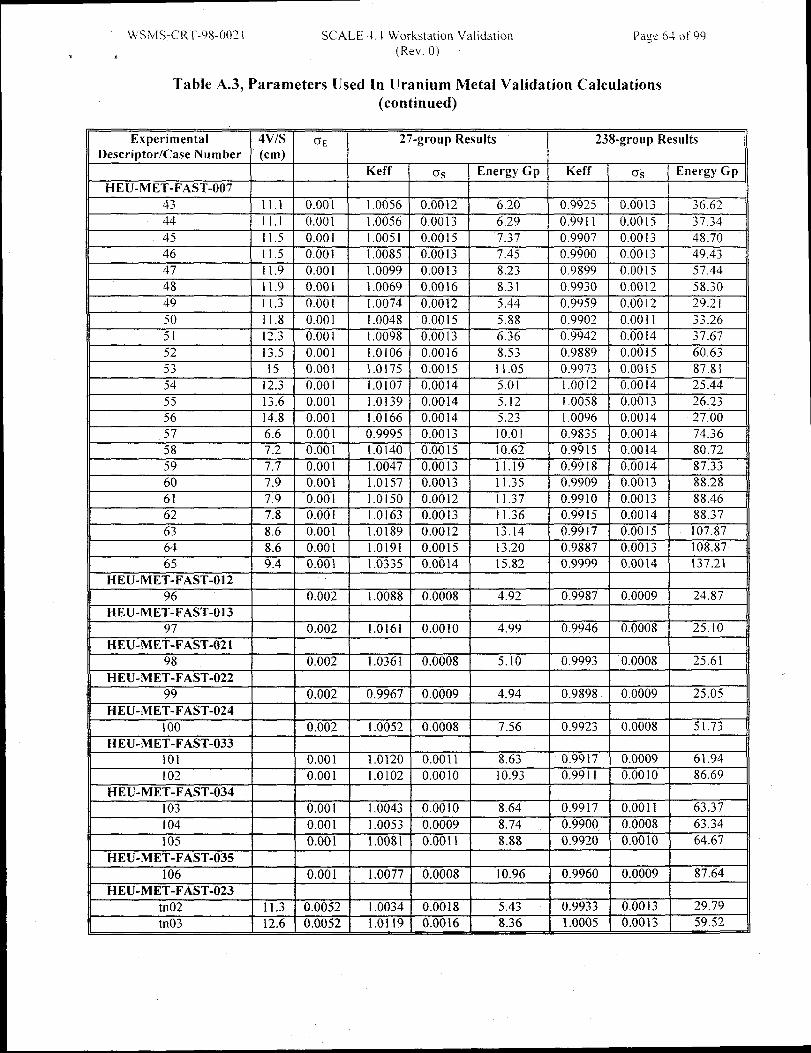
‘A’sMs-c RT-98-oQ?i SC,4LE 4.4 Workstation Validation page 64 of 99
1 (Rev. 0)J
Table A.3, Parameters Used [n Uranium Metal Validation Calculations(continued)
Experimental 4VIS GE 27-group Results 238-group ResultsDescriptor/Case Number (cm)
Keff Crs Energy Gp Keff 0s Energy GpHE U-M ET- FAST-O07
43 11.1 0.001 1.0056 0.0012 6,~o 0.9925 0.0013 36.6244 11.1 0.001 1.0056 0.0013 6,29 0.991 I 0.0015 37.3445 11.5 0.001 1.0051 0.0015 7.37 0.9907 0.0013 48.7046 11.5 0.001 1.0085 0.0013 7.45 0.9900 0,0013 49.4347 11.9 0.001 1,0099 0.0013 8.23 0.9899 0.0015 57.4448 1}.9 0.00 I i .0069 0.0016 8.31 0.9930 0.0012 58.3049 11.3 0.001 1.0074 0.0012 5.44 0.9959 0.0012 ~9.~ 1
50 11.8 0.00 I 1.0048 0.0015 5.88 0.9902 0.00 I I 33.2651 12.3 0.001 1.0098 0.0013 6.36 0.9942 0.0014 37.67j~ 13.5 0.001 1.0106 0.0016 8.53 0.9889 0.0015 60.6353 15 0.001 1.0175 0.0015 11.05 0.9973 0.0015 87.8154 12.3 0.001 1.0107 0.0014 5.01 1.0012 0.0014 25.4455 13.6 0.001 1.0139 0.0014 5.12 1.0058 0.0013 26.2356 14.8 0.001 1.0166 0.0014 5.23 1.0096 0.0014 27.0057 6.6 0.001 0.9995 0.0013 10.OI 0.9835 0.0014 74.3658 7.2 0.001 1.0140 0.0015 10.62 0.9915 0.0014 80.7259 7.7 0.001 1.0047 0.0013 11.19 0.9918 0.0014 87.3360 7.9 0.001 1.0157 0.0013 11.35 0.9909 0.0013 88.2861 7.9 0.001 1.0150 0.0012 11.37 0.9910 0.0013 88.4662 7.8 0.001 1.0163 0.0013 11.36 0.9915 0.0014 88.3763 8.6 0.001 1.0189 0.0012 13.14 0.9917 0.0015 107.8764 8.6 0.001 1.0191 0.0015 13.20 0.9887 0.0013 108.8765 9.4 0.001 1.0335 0.0014 15.82 0.9999 0.0014 137.21
HE U-MET-FAST-01296 0.002 1.0”088 0.0008 4.92 0.9987 0.0009 24.87
HEU-MET-FAST-01397 0.002 1.0161 0.0010 4.99 0.9946 0.0008 25.10
HEU-MET-FAST-02198 0.002 1.0361 0.0008 5.10 0.9993 0.0008 25.61
HEU-MET-FAST-02299 0.002 0.9967 0.0009 4.94 0.9898 0.0009 25.05
HE U-MET-FAST-024100 0.002 1.0052 0.0008 7.56 0.9923 0.0008 51.73
HEU-MET-FAST-033lol 0.001 1.0120 0.0011 8.63 0.9917 0.0009 61.94102 0.001 1.0102 0.0010 10.93 0.9911 0.0010 86.69
HE U-MET-FAST-034103 0.001 1.0043 0.0010 8.64 0.9917 0.0011 63.37104 0.001 1.0053 0.0009 8.74 0.9900 0.0008 63.34
105 0.001 1.0081 0.0011 8.88 0.9920 0.0010 64.67
HEU-MET-FAST-035106 0.001 1.0077 0.0008 10.96 0.9960 0.0009 87.64
HEU-MET-FAST-023tn02 11.3 0.0052 1.0034 0.0018 5.43 0.9933 0.0013 29.79
tn03 12.6 0.0052 1.0119 0.0016 8.36 1.0005 0.0013 59.52

W’SNIS-CRT-98-002I SCALE 4.4 Workstation Validation Page 65 ot’99
I f (Rev. O)
tn04 13,7 0.0052 1.0127 0.0018 10,11 1.0050 0.00[3 76.8900
tn05 13.9 0.0052 1.0108 0.0014 10,26 I .000? 0.0012 79.1700
tn06 19,7 0.0052 0.9989 0.0016 4.86 0.9938 0.0013 24.6200
tn07 21,2 0.0052 0.9989 0.0014 5.46 0.9891 0.0013 30.1200
tn08 25,3 0.0052 1.0067 0.0015 8.67 I .0005 0.0013 62.8300
tn09 28.7 0.005? 1.0084 0.0015 10.50 0.9987 0.0013 81.1700
tn10 29.3 0.0052 1.0038 0.0018 10.77 0.9980 0.0011 83.5000
tn12 12.3 0.0052 1.0023 0.0016 5.42 0.9933 0.0013 29,6100
tn13 13.5 0.0052 1.0189 0.0016 8.30 1.0072 0.0013 58.9000
tn14 14.6 0.0052 1.0117 0.0018 10.01 I .0034 0.0012 76.2000tn15 14.8 0.0052 I.O1O7 0.0016 10.23 1.0049 0.0013 78.5000tn16 21.2 0.0052 1.0055 0.0017 4.87 1.0000 0.0012 24.6100tn17 22.5 0,0052 1.0031 0.0015 5.45 0.9954 0.0012 29.9900tn18 26.7 0.0052 1.0094 0.0017 8.64 0.9988 0.0013 62.0800tn19 29.9 0.0052 1.0078 0.0018 10.40 1.0002 0.0013 80.0600tn20 30.5 0.0052 1.0036 0.0016 10.63 0.9987 0.0012 82.4300tn21 31 0,0057 1.0025 0.0019 4.91 0.9906 0.0013 25,1100tn22 48.6 0.0052 1.0040 0.0015 10.86 0.9975 0.0014 84.6300tn~8 18.7 0.0052 1.0023 0.0017 4.86 0.9952 0.0013 24.5000tn29 27.4 0.0052 1.0034 0.0016 4.89 0.9937 0.0012 24.8300

WSMS-CRT-98-002 I SCALE 4.4 Workstation Validation Page 66 of99(Rev. O)
, *
Table A.4, Parameters Used In Uranium Solution Validation Calculations
Exp. Descriptor/ -lVls H/ o~ 27-group Results 238-group ResultsCase (cm) U-235
Energy Keff. 0s Energy Keff. DsSRT-EMS-96-0015
HE U-SOL-THERM-OOI1/1 19.3 182 0.0025 23.58 1.0069 0.0018 210.19 1,0013 0,00182/2 18.8 71 0.0025 21.69 1.0050 0.0019 195.15 1.0005 0.0017313 19.8 186 0.0025 23.61 1.0106 0.0018 210.4 1.0039 0.00174/4 19.2 68 0.0025 21.59 1.0087 0.0018 194.3 I.0009 0,00195/5 23.2 499 0.0025 24.57 1.0048 0.0018 217.53 1.0008 0.00146/6 22.8 459 0.0025 24.52 1.0113 0.0014 217.14 1.0041 0.00187/7 ]9.6 193 0.0025 23.66 I.0074 0.0018 210.81 1.0013 0.00198/8 19.6 182 0.0025 23.57 1.0043 0.0019 210.13 0.9990 0.00209/9 18.6 68 0.0025 21.58 I.0043 0.0019 194.25 0.9969 0.0018
10/10 22.6 427 0.0025 24.46 0.9993 0.0017 216.75 0.9946 0.0017HEU-SOL-TH ERM-002
1/1 I 19 184 0.0020 23.61 1.0102 0.0019 210.47 1.0053 0.00172/12 17.8 184 0.0020 23.62 1.0128 0.0016 210.56 1.0075 0.00183/13 18.5 74 0.0020 21.85 1.0100 0.0018 196.42 0 99X6 0.0019
4/14 17 74 0.0020 21.89 1.0122 0.0019 .,”.,. , ..””, ” I5/15 19.4 184 0.0020 23.62 1.0102 0.0016 21OAO 1 1 rink 1 0.0017 II6/16 17.8 184 0.0020 23.65 1.0086 0.0019 7107/17 18.8 74 0.0020 21.86 1.0116 0.0020 ..”..” ..”” ,a I
8/18 17.2 74 0.0020 21.94 1.0133 0.0018 197.17 1.0060 0.00169/19 22.2 460 0.0020 24.52 1.0063 0.0016 7177. I 00? 1 I 0.0017
10/20 20.6 459 0.0020 24.53 1.0113 0.0016 -.,.-” ..”. ”,
1 1/21 19.2 184 0.0020 23.62 1.0096 0.0020 210.5 1.0040 0.0018
12/22 17.3 184 0.0020 23.66 1.0154 0.0020 21078 1 of)74 0.0016
13/23 18.6 74 0.0020 21.87 1.0081 0.0018 , ..”1ADA 16A 7A (1 MY7rl ‘?1m 1 nlAo nnnl< I 107.. !-. .“. ” ,, “.” ”-”
HEU-SOL-THERM-O031/7s ?l~ 454 n fmm
I. . -.
I------
1
I 10601 I nn7n 0.0017 II,.7, .. ”””,
I-. J.71 1.0119 0.0018
I 1w ‘% 1 O(-)A5 0.0019
I ----- 1 ------ I71776 1 nlnA 0.0016 il
I —.-.. -----IQ6.52 0.9981 0.0016
I -. .,” I 1.”,-, I “.”” ‘JI
,//’.44 1.0109 0.0016
+ -zm--l7nn75 t nnnl.,-- -.. . .-. “.” ”-., - ,.”< .. ””,- “.””.”- .,
2/26 23.2 454 0.0050 24.52 1.0074 0.0019 I 217
3/27 19 180 0.0050 23.59 1.0085 0.0017 ---
4/28 18 180 0.0050 23.63 1.0087 0.0019 210
5/29 18.6 71 0.0050 21.78 1.0074 0.0018 195
6/30 17.4 71 0.0050 21.89 1.0081 0.0017 .,”
7/3 1 22 454 0.0050 24.54 1.0067 0.0017 217..w , ,.vvu~I
8/32 16.9 180 0.0050 23.6 1.0090 0.0018 71n;l I I 0074 0.0016 It
9/33 18 180 0.0050 23.66 1.0078 0.0016 i e..,
I& ? 17,2.5 1.0036 0.0016
I —-.’.19 1.0060 0.0018? 10.26 1.0021 0.00 I5
1.58 1.0015 0.0016..-.81 0.9969 0.0015
1 1r~~ 1 nrlk? 0.0014I I C)~.82 I 0.9966 0.0016
I ------ ------‘71Q.gg 1.0071 0.0015
;.98 I .(-)(-)0(-) 0,0018I
. . . .[
. . . I1Q7 5’7 1 nn76 0.0017 II
I
10/34 18.8 71 0.0050 21.8 1.0088 0.0020 195
1 1/35 17.4 71 0.0050 21.96 1.0065 0.0018 .,,.a- ..””-”
12/36 22.3 454 0.0050 24.52 1.0061 0.0016 217.19 1.0035 0.0016
13/37 20.6 454 0.0050 24,55 1.0071 0.0013 217 w 1 nm 0.0016
14/38 I 21.7 I 454 0.0050 24.53 1.0055 0.0016 21715/39 19.9 412 0.0050 24.48 1.0012 0.0017 216.. _ , . .. . . I 1{
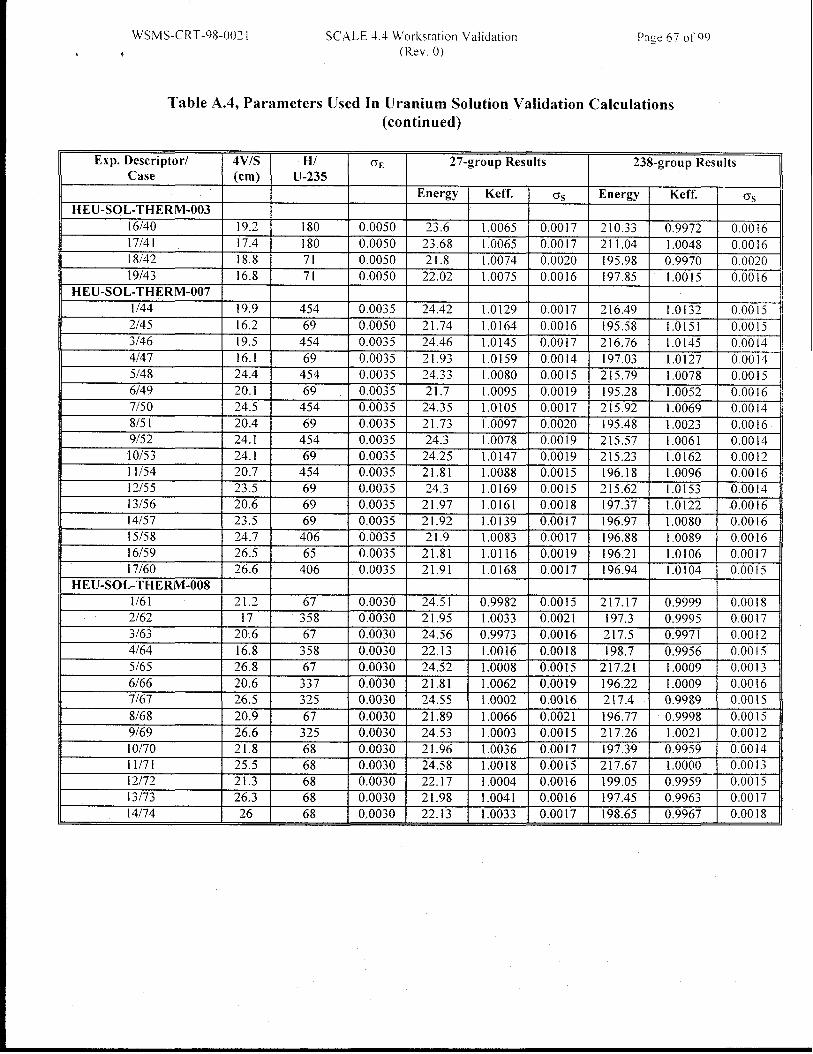
WSMS-CRT-~8-002 I SCALE 4.4 Workstation Validation p~(r~ (57 of 99
x f (Rev. O)
Table AA, Parameters Used In Uranium Solution Validation Calculations(continued)
Exp. Descriptor/ 4VLS HI ~E 27-group Results 238-group ResultsCase (cm) U-235
Energy Keff. 0s Energy Keff. 0sHE U-SOL-T HE RM-O03
16/40 19.2 180 0.0050 23.6 1.0065 0.0017 210.33 0.9972 0.0016I7/4 I 17.4 180 0.0050 23.68 1.0065 0.0017 211.04 1.0048 0.001618/42 18.8 71 0.0050 21.8 1.0074 0.0020 195.98 0.9970 0.002019/43 16.8 71 0.0050 22.02 1.0075 0.0016 197,85 1.0015 0.0016
HEU-SOL-THERM-O071/44 19.9 454 0.0035 24.42 1.0129 0.0017 216.49 1.0132 0.00152/45 16.2 69 0.0050 21.74 1.0164 0.0016 195.58 1.0151 0.00153/46 19.5 454 0.0035 24.46 1.0145 0.0017 216.76 1.0145 0.00144/47 16.1 69 0.0035 21.93 1.0159 0.0014 197.03 1.0127 0.00145/48 24.4 454 0.0035 24,33 1.0080 0.0015 215.79 1.0078 0.00156149 20.1 69 0.0035 21.7 I.0095 0.0019 195.28 1.0052 0.00167/50 24.5 454 0.0035 24.35 1.0105 0.0017 215.92 1.0069 0.00148/5 1 20.4 69 0.0035 21.73 1.0097 0.0020 [95.48 1.0023 0.00169/52 24.1 454 0.0035 24.3 1.0078 0.0019 215.57 1.0061 0.001410/53 24.1 69 0.0035 24.25 1.0147 0.0019 215.23 1.016211/54 20.7 454 0.0035 21.81
0.00121.0088 0.0015 196.18 1.0096 0.0016
12/55 23.5 69 0.0035 24.3 1.0169 0.0015 215.62 1.0153 0.001413/56 20.6 69 0.0035 21.97 1.0161 0.0018 197.37 1.0122 .0.001614/57 23.5 69 0.0035 21.92 1.0139 0.0017 196.97 1.0080 0.001615/58 ~4.7 406 0.0035 21.9 1.0083 0.0017 196.88 1.0089 0.001616/59 26.5 65 0.0035 21.81 1.0116 0.0019 196.21 1.0106 0.001717/60 ~h.e 406 0.0035 21.91 1.0168 0.0017 196.94 1.0104 0,0015
HEU-SOL-THERM-O081/61 21.2 67 0.0030 24.51 0.9982 0.0015 217.17 0.9999 0.00182/62 17 358 0,0030 21.95 1.0033 0.0021 197.3 0.9995 0.00173i63 20.6 67 0.0030 24.56 0.9973 0.0016 217.5 0.9971 0.00[24/64 16.8 358 0.0030 22.13 1.0016 0.0018 198.7 0.9956 0.00155/65 26.8 67 0.0030 24.52 1.0008 0.0015 217.21 1.0009 0.0013
6/66 20.6 337 0.0030 21.81 1.0062 0.0019 196.22 1.0009 0.00167/67 26.5 325 0.0030 24.55 i .0002 0.0016 217.4 0.9989 0.0015
8/68 20.9 67 0.0030 21.89 1.0066 0.0021 196.77 0.9998 0.0015
9/69 26.6 325 0.0030 24.53 1.0003 0.0015 217.26 1.0021 0.001210/70 21.8 68 0.0030 21.96 1.0036 0.0017 197.39 0.9959 0.0014
11/71 25.5 68 0.0030 24.58 1,0018 0.0015 217.67 1.0000 0.0013I2/72 21.3 68 0.0030 22.17 1.0004 0.0016 199,05 0.9959 0.0015I3/73 26.3 68 0.0030 21.98 1.0041 0.0016 197.45 0.9963 0.001714/74 26 68 0.0030 22.13 1.0033 0.0017 198.65 0.9967 0.0018

1 , WSN[S-CR”T-98-002 SCALE -!.4 Workstation Validation
(Rev. O)
Table A.4, Parameters Used In Uranium Solution Validation Calculations(continued)
Exp. Descriptor/Case 4VIS HKJ-235 o~ 27-group Results 238-group Results(cm)
Energy Keff. us Energy Keff. 0sHEU-SOL-THERM-O09
UOZFZExperiments1/75 15.3 36 0.0057 20.72 1.0126 0.0015 186.69 1.0028 0.0019
2d76 15.3 47 0.0057 21.47 1.0091 0.0019 193.23 1.0056 0.00163178 15.3 76 0.0057 22.55 1.0105 0.0015 202.19 I.0035 0.00194/79 15.3 126 0.0057 23.42 1.0059 0.0015 209.04 0.9967 0.0016
HEU-SOL-THERM-O111/80 21.3 523 0.0019 24.69 1.0104 0.0016 218.43 1,0057 0.00172/8 I 21.3 533 0.0019 24.7 1.0066 0.0015 218.5 I ,0043 0.0013
HEU-SOL-THERM-0121/82 37.2 1272 0,0058 24.99 0.9992 0.0013 220.6 1,0039 0.0014
HEU-SOL-THERM-OIO1183 17.6 270 0.0018 24.26 1.0075 0.0018 215.37 1.0047 0.00162/84 17.6 264 0.0018 24.25 1.0096 0.0017 215.23 1.0037 0.00153185 17.6 246 0.0018 24.18 1.0064 0.0017 214.79 1.0028 0.00174/86 17.6 239 0.0018 24.16 1.0082 0.0015 214.59 1.0017 0.0016

WSMS-CRT-98-002 I SCALE 4.4 Workstation Validation
(Rev. O)
Page 69 vf99
Table A.5, Parameters Used In MTR Type Fuel Validation Calculations
Exp. Descriptor/Case 4VIS HIU-235 ~~ 27-group Results 238-group Results \(cm)
Energy Keff. ‘ss Energy Keff. GsHEU-MET-THERM-006
I ~4.j8 140 0.0040 23.53 0.9961 0.00[2 210,04 1.0017 0.00[52 ~5,80 140 0.0040 23.84 0.9997 0.0014 2[2.31 1.0014 0.0015
3 27.00 i 40 0.0040 24.oz I .004 I 0.0013 213.67 1.0073 0,0013
4 ~7,()() 140 0.0040 24.05 0.9941 0.0013 ~13.97 0.9935 0.0014
5 28.17 140 0.0040 24.14 0.9992 0.0014 214.70 1.0023 0.00[5
6 29.32 140 0.0040 24.22 1.0008 0.0012 215.29 I .0009 0.0012
7 36.31 I 40 0.0040 24.27 0.9962 0.0014 215.71 0.9997 0.0014
8 42.94 140 00040 24.32 0.9930 0.0012 216.14 0.9964 0.0015
9 48.28 140 0.0040 24.33 0.9982 0.0013 ~16,21 0.9987 0.0013
10 ~8,39 140 0.0040 23.59 1,0053 0.0014 210.39 1.0077 0.0014
11 27.26 140 0.0040 24.03 1.0047 0.0016 213.91 1.0068 0.0012
12 36.50 140 0.0040 24.26 1.0059 0.0014 215,67 1.0085 0.0013
13 29.55 140 0.0040 23.58 1.0268 0.0012 210.33 1.0315 0.0015
14 38.30 140 0.0040 24.18 0.9948 0.0013 215.08 0.9969 0.0014
15 46.74 140 0.0040 24.2 0.9927 0.0012 215.13 0.9936 0.0014
16 46.39 140 0.0040 24.01 1.0070 0.0013 213.76 1.0071 0.0013
The 4 V/S parameter for arrays was calculated as though the individual parts of the arraycomposed a rectangular solid. A 3 x 3 x 3 array of cylinders is therefore represented by acube composed of 27 cylinders, with appropriate spacing taken into consideration topreserve geometry.
For all subcritical experiments, Appendix A presents the normalized values for Keff.

WsbTs-c RT-98-oo2 1 SCALE 4.4 Workstation Validation
(Rev. O)I c
Appendix B Tally Information by Benchmark Experiment
Page 70 0[99
(238 group)
Benchmark Experiment GEN/NPG/INSKPU-MET-FAST-OO I 700/700/ 100PU-MET-FAST-002 I000/500/l 00PU-MET-FAST-O 11 1200/450/120PU-MET-FAST-003 1200/450/120PU-MET-FAST-O04 1300/400/130PU-MET-FAST-O 17 1100/500/100
PU-SOL-THERM-O09 1I00/500/100PU-SOL-THERM-O 11 1100/500/100PU-SOL-THERM-012 1100/500/100PU-SOL-THERM-OO 1 1100/500/100PU-SOL-THERM-O02 1100/500/100PU-SOL-THERM-003 1100/500/100 2PU-SOL-THERM-O04 1100/500/ 100PU-SOL-THERM-O05 1100/500/100PU-SOL-THERM-O06 1100/500/I 00HEU-MET-FAST-OO 1 6501800/50HEU-MET-FAST-O02 650/800/50HEU-MET-FAST-003 650/800/50HEU-MET-FAST-O04 650/800/50HEU-MET-FAST-O07 650/800/50HEU-MET-FAST-O12 1100/1000/100HEU-MET-FAST-O 13 1000/ I000/100HEU-MET-FAST-02 1 1100/1000/100HEU-MET-FAST-022 1100/1000/100HEU-MET-FAST-024 1100/1000/100HEU-MET-FAST-033 1100/1000/100HEU-MET-FAST-034 1100/1000/100HEU-MET-FAST-035 1I00/1000/100HEU-MET-FAST-023 650/750/50
HEU-SOL-THERM-OO1 1000/500/100HEU-SOL-THERM-O02 1I00/500/100 {HEU-SOL-THERM-003 1100/500/100HEU-SOL-THERM-O07 I 100/500/100HEU-SOL-THERM-008 1loo/5oo/IooHEU-SOL-THERM-009 800/600/1 00HEU-SOL-THERM-O 11 800/600/ 100HEU-SOL-THERM-012 8OOI6OOI1OOHEU-SOL-THERM-O 10 800/600/1 00
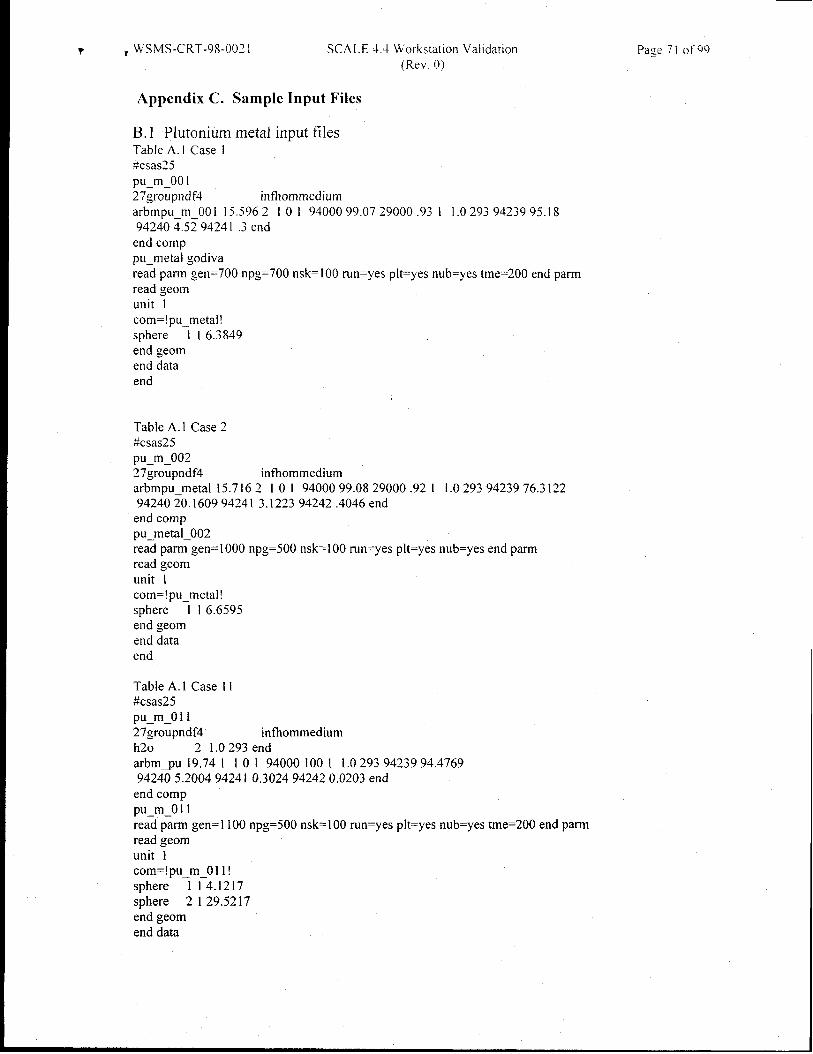
T ~ WSMS-CRT-9S-002 SCALE 4.4 Workstation Validation pa:e 7 [ of 99(Rev. O)
Appendix C. Sample Input Files
B. 1 Plutonium metal input filesTable A.I Case I#csas25pu_m_OOI27groupndf4 infhornmediumarbmpu_m_OO1 I5.5962 10 1 9400099.0729000.921 I I.0 2939423995.18942404,529424 I .3 end
end comppu_metal godivaread parm gen=700 npg=700 risk=100 run=yes plt=yes nub=yes tme=200 end parmread geomunit 1com=!pu metal!sphere ‘1 I 6.3849end geomend dataend
Table A. 1 Case 2#csas25pu_m_O0227groupndf4 infhommediumarbmpu_metal 15.7162 101 9400099.0829000.92 I 1.02939423976.31229424020.1609942413.1223 94242.4046 end
end comppu_metal_O02read parm gen= 1000 npg=500 risk=100 run=yes plt=yes nub=yes end parmread geomunit 1com=!pu metal!sphere ~ 16.6595end geomend dataend
Table A. 1 Case 11#csas25pu_m_O1127groupndf4 infhommediumh20 2 1.0293 endarbmflu 19.741 101 940001001 1.02939423994.4769942405.2004942410.3024 942420.0203 end
end comppu_m_O11read parm gen=1100 npg=500 nsk=l 00 run=yes plt=yes nub=yes tme=200 end parmread geomunit 1com=!pu_m_O 11!sphere 1 14.1217sphere 2129.5217end geomend data

end
Y
WSMS-CRT-98-002 I SCALE 4.4 W’orkstation Validation
(Rev, O)
Table A.1 Case7ticsas2junmoderated pu metal button arr-ay/pu-met-fast-003/j, just ice/3-9627groupndf4 Iatticecellal 2 den=2.70,609727145293 endal 3 den=2.70 .489740449293 endal 4 den=2.70.500124454293 endfe 5 den=7.8012 1.0293 endfe 6 den=7.8012 .07293 endal 8 den=2.70.88293 endal 9 den=2.701.0293 endarbmpu 19.5224 00 I 94242.01 942405.969739423993.5562 94241 .459975 I1.0293 end
arbmhomoshoe 2.03348638 2 00 1 2600035.5312 1302764.4697 1.0293 endend compsquarepitch 7.36.525 1 0 6.5992 endmore data res=l cylinder 3.2625 dan(l)=.57 endcase 101/pu-met-fast-003 /j. justice/3 -96read parmtme=120gen=l 100npg=500 nsk=lOOrun=yes plt=yes nub=yes endpamread geomunit 1com=!single plutonium part in can!zcylinder I I 3.26254.6330zcylinder 9 13.29954.720zcylinder 5 1 3.29954.72-.021zcylinder 2 13.29955.199-.021zcylinder O 13.4255.199-.021zcylinder 913.6095.199-.021cuboid O I 3.609-3.6093.609-3.609 5.199-.021unit 2com=!spacer!zcylinder O 13.104.180zcylinder 9 1 3.326.180zcylinder O 13.425.180zcylinder 913.609.180cuboid O I 3.609-3.6093.609-3.609 .180unit 3com=!z stack!array 1 -3.609-3.6090replicate O 1 .041 .041 .041.04100 1global unit 4com=!xy planar array!array 2 -7’.3-7.30cuboid O 1 23-2366-6645.7340cuboid 81 23-2366-6645.734-2.54cuboid 61 23-2366-6645.734-32.54unit 5corn=!homogenized shoe!zcylinder 7 13.4258.30zcylinder 913.6098.30cuboid O 1 3.609-3.6093.609-3.609 8.30unit 6corn=! lower support tube!zcylinder O 13.1046.2290

w’sNls-c R-r-98 -oo2i SCALE 4.4 Wwkstaticm Validation
Y z(Rev. O)
zcylinder 9 I 3.3266.2290zcylinder O I 3.4256,2290zcylinder 9 I 3.6096.2290cuboid O I 3,609-3.6093.609-3.609 6.2290unit 7com=!upper support tube!zcylinder O 1 3.425 19.950zcylinder 9 13.609 19.950cuboid O 1 3.609-3.6093.609-3.609 19.950unit 8com=!lower heat sink (top of can)!zcylinder 4 I 3.2995.6350
zcylinder O I 3.425.6350
zcylinder 9 I 3.609.6350cuboid O 1 3.609-3.6093.609-3.609 ,6350
end geomread arrayara=l nux=l nuy=l nuz=7com=!z stack!fi115681217end fillara=2 nux=2 nuy=2 nuz= 1corn=! array of units!fill 3333 end fillend arrayread plotttl=!plan view of experiment!plt=yes pic=mixture xul=-10 yul=10 ZUI=l5.2 xh=10 yh=-vax=O wax=O udn=O vdn=- 1 wdn=O nax=80nch=!O123456789 ! endend plotend dataend
Ozlr= 5.2 uax= I
Table A. I Case 12#csas25unmod pu met cyl array-phase ii/pu-met-fast-004/j. justice/3-9627groupndf4 Iatticeceilarbmpu 19.539 001 9423993.5178942405.96728 94241 .4597S68 94242.009995546012.01820000.0126000 .003512000 .00228000.005 1 I.0 293 end
arbmsupporttube 2.7194947 001 24000. I 290004.3526000.5120001 .525055.614000.5 1302792.22 1.0293 end
arbmcanlid 7.96 00 1 6012.0825055.37 15031 ,01516000.025 14000.012600099.23 1.0293 endarbmhomoshoe 5.727720218 001 2900046.98032900029.8028 2600017.6578130272.5043924000.898374 14000.1766016012.072878 42000.2320644 1.0293 end
arbmbotspcrhsink 2.708 00 1 24000.229000.2526000 .7 [2000 125055.1514000.61302796.722000 .155 1.0293 end
arbmtopsink 2.0741333158 001 24000.229000.2526000 .712000 125055.1514000 .622000.1513027 96.76 1.0293 end
arbmtabletop 2.847 001 290006.326000.312000 .0225055 .314000.222000.061302792.757 .881293 end
arbmalframe 2.78 001 24000.229000.2526000 .712000125055 ,1514000.622000 .151302796 .78 .296293 end
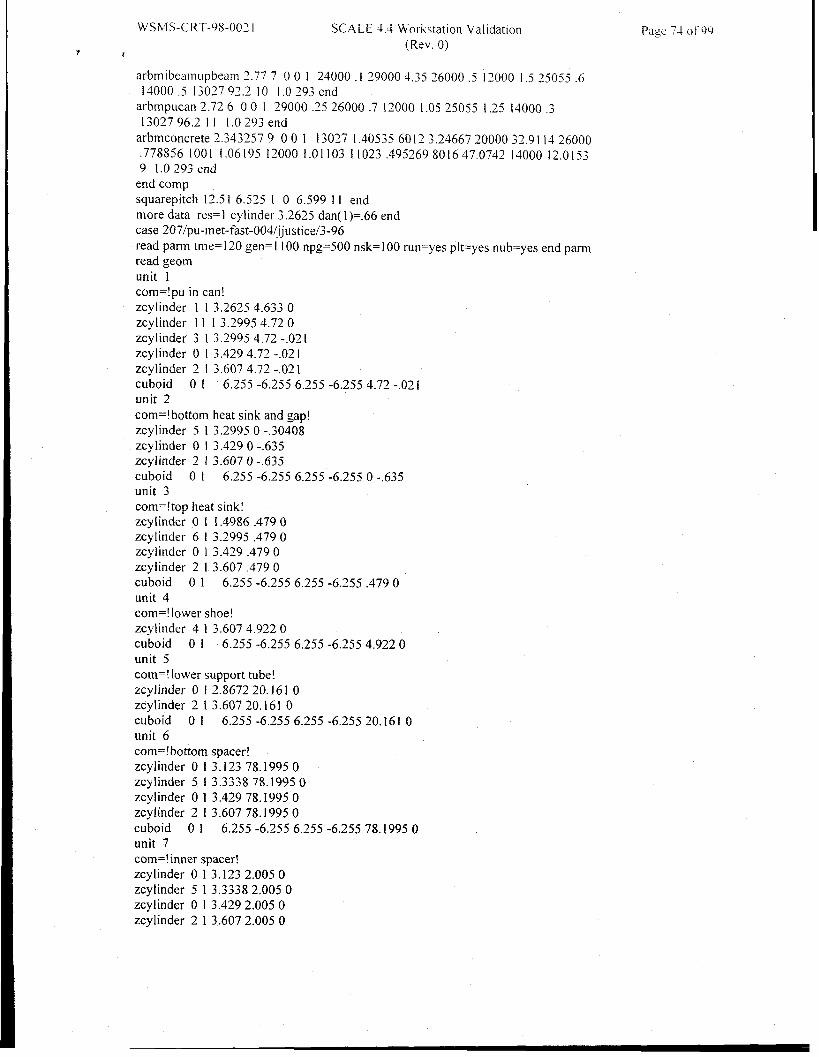
WSMS-CRT-98-002 I
arbmibeamupbeam 2.77
SCALE 4.4 Workstation Validation
(Rev. O)
7 00 I 24000. I 290004 .3526000.5 120001 ,525055.614000,5 1302792,2 10 1,0293 end
arbmpucan 2.726 00 1 29000 .2526000.7 12000 1.0525055 1.25 14000,31302796.2 11 1.0293 end
arbmconcrete 2.3432579 001 1302!71.4053560123.2466720000 32.911426000.778856 1001 1.06 [95 12000 1.01103 I 1023.495269801647,0742 14000 12.01539 1.0293 end
end compsquarepitch 12.51 6.525 I O 6.599 I 1 endmore data res=l cylinder 3.2625 dan(l)=.66 endcase 207/pu-met-fast-004/jjustice/3-96read parm tree= 120 gen=1100 npg=500 risk= 100 run=yes plt==yesnub=yes end parmread geomunit 1corn=! pu in can!zcylinder 1 I 3.26254.6330zcylinder I 1 I 3.29954.720zcylinder 3 1 3.29954,72-.021zcylinder O I 3.4294.72-.021zcylinder 2 I 3.6074.72-.021cuboid O 1 6.255-6.2556.255unit 2corn=! bottom heat sink and gap!zcylinder 5 I 3,29950-.30408zcylinder O 1 3.4290-.635zcylinder 2 I 3.6070-,635cuboid O I 6.255-6.2556.255unit 3com=!top heat sink!zcy[inder O I 1.4986.4790zcylinder 6 1 3.2995 .4790zcylinder O 1 3.429.4790zcylinder 2 1 3.607.4790cuboid O 1 6.255-6.2556.255unit 4corn=! lower shoe!zcylinder 4 1 3.6074.9220cuboid O 1 6.255-6.2556.255unit 5corn=! lower support tube!zcylinder O I 2.867220.161 0zcylinder 213.60720,161 0
-6.2554.72-.02 }
-6.2550-.635
-6.255.4790
.6.2.554 .9220
cuboid O 1 6.255-6.2556.255-6.255 20.1610unit 6com=!bottom spacer!zcylinder O 1 3.12378.19950zcylinder 5 13.333878.19950zcylinder O 13.42978.19950zcylinder 2 13.60778,19950cuboid O I 6.255-6.2556.255-6.255 78.19950unit 7corn=! inner spacer!zcylinder O 13.1232.0050zcylinder 513.33382.0050zcylinder O 13.4292.0050zcylinder 2 13.6072.0050

w’svls-c R”r-9&oo2 I SC44LE44 Workstation(Rev. O)
? 1
cuboid O I 6.255-6.2556.255-6.255 2.0050unit 8corn=! upper support tube and upper shoe void!zcylinder O I 3.42975.69650zcylinder 2 I 3.60775.69650cuboid O [ 6.255-6.2556.255-6.255 83.63450unit 9
com=!upper support beam - unit cell!
cuboid O I 4.3435-4.34356.255-6.255 1.8035-1,8035cuboid 101 5.08-5.086.255-6.255 2,54-2.54
cuboid O I 6.255-6.2556.255-6.255 2.54-2.54unit 10
com=!z stack Of units!array 1 000unit I 1
com=!xy array!
array 2 -25.02-25.020
cuboid O I 106.5-106.596.34-96.34 221.4320unit 12 -
com=!i-beam rail!cuboid 101 106.5-106.5,3175-.3175 4,445-4.445
cuboid O 1 }06.5 -106.55.08-5.084.445 -4.445cuboid 10 I 106.5-106.55.08-5.08 5.08-5.08
cuboid O 1 106.5-106.55.08-5.08 10.16-211.272global unit 13
com=!room!array 3 -106.5-106.50cuboid 7 1 106.5 -106.5106.5-106.5 221.432-2.382
cuboid 81 106.5 -106.5106.5-106.5 221.432-12.542
cuboid O 1 457.2 -457.2457.2-457.2 554.0.58-360.342
cuboid 91 609.6-609.6609.6-609.66 15.018-451.782end geomread arrayara= i nux= 1 nuy= I nuz=20com=!z stack of units!fi1145621372137213721389 end fillara=2 nux=4 nuy=4 nuz= 1corn=! xy array!fill 16r10 end fillara=3 nux= 1 nuy=3 nuz= 1com=!room!fill 1211 12 end fillend arrayread startxsm=-22.372xsp=22.372ysm=-22.372ysp=22.372zsm= 103.895zsp=132. 105nst= 1end startread plotttl=!plan view of experiment!
Validation Page 75 of 99
plt=yes pic=mixture XU1=-25.02yul= 25.02 ZUI=l13,07 xlr=25.02 ylr=-25.02zlr=l 13.07 uax=l

t , W’SMS-CRT-98-002 1 SCALE 4.4 Workstation Validation
(Rev. O)
vax=O~vax=Oudn=O vdn=-1 wdn=O nax=120nch=!O123456789 ! endttl=!elevation view of experiment!plt=yes pic=mixture xul=-25.02 yul=6.255 ZUI=230xlr=O ylr=6.255 zlr=- 14 uax=lvax=O wax=O udn=O vdn=O wdn=- 1 nax= 120nch=!O123456789 ! end
end plotend dataend
Table A, I Case 21#csas25unmod pu met cyl array-phase ii/pu-met-fast-004/j. justice/3-9627groupndf4 latticecellarbmpu 19.539 00 1 9423993.5178942405.96728 94241 .459786894242 .009995546012.01820000.0126000 .003512000 .00228000.005 1 I.0 293 end
arbmsupporttube 2.7194947 00 1 24000.1290004.3526000.5120001 .525055.614000 .51302792.22 1.0293 endarbmcanlid 7.97 00 I 6012.0825055.37 1503 I .015 16000.025 14000.0150000.32600099.23 1.0293 end
arbmhomoshoe 5.727720219 001 2900046.98032900029.8028 2600017.6578130272.504424000.898374 14000.1766016012.072878 50000.58737442000.2320644 1.0293 end
arbmbotspcrhsink 2.708 001 24000.229000.2526000 ,712000125055.1514000.61302796.722000 .155 1.0293 end
arbmtopsink 2.0741333158 001 24000 .229000.2526000.7 12000125055.1514000 .622000.1513027 96.76 1.0293 end
arbmtabletop 2.847 001 290006 .326000.3 12000 .0225055.3 14000.222000.06 1302792.727 .881293 end
arbmalframe 2.78 00 1 24000.229000.2526000 .7 12000125055.1514000.622000 .151302796 .78 .296293 end
arbmibeamupbeam 2.777 00 1 24000.1290004.3526000 .5 12000 1.525055.614000 .51302792.2 10 1.0293 end
arbmpucan 2.726 001 29000 .2526000.7 120001.0525055 1.25 14000.31302796.211 1.0293 end
arbmmiddlesink 1.6678448 001 24000.229000.2526000 .712000125055.15 14000.622000.1513027 96.712 1.0293 end
arbmconcrete 2.3432579 000 130271.4053560123.24667 2000032.911426000.7788561001 1.06195120001.0110311023 .495269801647 .074214000 12.01539 1.0293 end
arbmmoderator 1.5599 001 10013.140034601230.5595 801634.70355010.0000182445011 .000081774 11023.00226000.002519000 .02701431 .5702131.0293 end
end compsquarepitch 17.56.5251 13 6.59911 endmore data res= 1 cylinder 3.2625 dan( 1)=.66 endcase 20 l\pu-met-fast-O 17/jjustice/4-96read parm tme=520 gen= 1100 npg=500 risk=100 run=yes plt=yes nub=yes end parmread geomunit 1com=!pu in can!zcylinder 1 13.26254.6330zcylinder 11 13.29954.720zcylinder 3 13.29954.72-.021

WSMS-CRT-98-002 I SCALE 4.4 Workstation Validation
(Rev. O)
zcylinder O 1 3.4294.72-.021zcylinder 2 I 3.6074.72-.021 .
zcylinder O 23.8141 4.72-.021
zcylinder 13 1 5.08484.72-.021
cuboid O I 8,75-8.758.75-8.754.72 -.021unit 2corn=! bottom heat sink and gap!zcylinder 5 13.29950-.30408zcylinder O 1 3.4290-.635zcylinder 2 I 3.6070-.635zcylinder O I 3.8 [41 O-.635zcylinder 13 I 5.08480-.635cuboid O 1 8.75-8.758.75-8.750-.635
unit 3com=!top heat sink!
zcylinder O 1 I .4986 .4790
zcylinder 6 i 3.2995.4790
zcylinder O I 3.429.4790zcylinder 2 I 3.607.4790
zcylinder O I 3.8141 .4790zcylinder 13 I 5.0848.4790
cuboid O 1 8.75-8.758.75-8.75.479 Ounit 4
corn=! lower shoe!zcylinder 4 I 3.6074.9220
cuboid O 1 8.75-8.758.75-8.754.922 Ounit 5
corn=! lower support tube!zcylinder O 12.867220.1610zcylinder 2 I 3.60720.161 0
cuboid O I 8.75-8.758.75-8.7520.161 Ounit 6corn=! bottom spacer!zcylinder O 1 3.12347.48550zcylinder 5 1 3.333847.48550zcylinder O 13.42947.48550zcylinder 2 I 3.60747.48550cuboid O I 8.75-8.758.75-8.7547.4855 Ounit 7corn=! inner spacer!zcylinder O 13.123 12.2970zcylinder 5 1 3.3338 12.2970zcylinder O 13.42912.2970zcylinder 2 13.607 12.2970cuboid O I 8.75-8.758.75-8.7512.297 Ounit 8corn=! upper support tube and upper shoe void!zcylinder O 13.42944.98250zcylinder 2 13.60744.98250cuboid O 1 8.75-8.758.75-8,7552.9205 Ounit 9com=!upper support beam - unit cell!cuboid O 1 4.3435-4.34358.75-8.75 1.8035-1.8035cuboid 101 5.08-5.088.75-8.752.54 -2.54cuboid O 1 8.75-8.758.75-8.752.54 -2.54unit 10
page 77 0[ 99

r ‘ WSMS-CRT-98-002 I SCALE 4.4 Workstation Validation(Rev. O)
page 7S 0f99
ccm=!z stack of units!
array I 000
unit [ 1com=!xy array!
array ~ -35-35 ()
cuboid O [ 106.5-106.596.34-96.34 221.4320
unit 12
com=!i-beam rail!
cuboid 10 I 106.5-106.5.3175-.3175 4.445-4.445cuboid O I 106.5-106.55.08-5.08 4.445-4.445
cuboid 101 106.5-106.55.08-5.08 5.08-5.08
cuboid O I 106.5-106,55.08-5.08 10.16-211.272
global unit 13
com=!room!
array 3 -106.5 -I O6.5O
cuboid 7 1 106.5 -106.5106.5-106.5 221.432-2.382
cuboid 81 106.5 -106.5106.5-106.5 221.432-12.542
cuboid O 1 457.2 -457.2457.2-457.2 554.058-360,342cuboid 91 609.6 -609.6609.6-609.6 615.018-451.782
unit 14
com=!middle sink!zcylinder O I I.4986 .35560zcylinder 12 I 3.2995.35560zcylinder O 1 3.429.35560zcylinder 2 13.607.35560zcylinder O I 3.8141 .35560zcylinder 13 I 5.0848.35560cuboid O 1 8.75-8.758.75-8.75.3556 Ounit 15corn=! moderator disk!zcylinder 13 1 3.3975 1.27070zcylinder O 1 3.429 1.27070zcylinder 2 I 3.6071.27070zcylinder O I 3.8141 1.27070zcylinder 13 1 5.0848 1.27070cuboid O 1 8,75-8.758.75-8.751.2707 Oend geomread arrayara= 1 nux= 1 nuy= I nuz=36com=!z stack of units!fi1145615211413157152 }14131571521141315715211413158 9endfillara=2 nux=4 nuy=4 nuz= 1com=!xy array!fill 16rI0 end fillara=3 nux= 1 nuy=3 nuz= 1com=!room!fill 121 I 12 end fillend arrayread startxsm=-31xsp=3 Iysm=-31ysp=31zsm=7225P= 164

WSMS-CRT-98-0021 SCALE 4.4 Workstation Validation
(Rev. O)! I
nst= Iend startread plottt[=!plan view of experiment!plt=yes pic=mixture xu[=-35 yul= 35 ZUI=I04.105 xlr=35 ylr=-35 zlr=104. 105 uax=lvax=O wax=O udn=O vdn=- 1 wdn=O nax=80nch=!O123456789 ! endttl=!elevation view of experiment!ph=yes pic=mixture XUI=-35yul=8.75 ZUI=230xlr=O ylr=8.75 zh=-14 uax=lvax=O wax=O udn=O vdn=O wdn=- I nax=80nch=!O 123456789 ! end
end plotend dataend
C.2 Plutonium Solution Input Files
Table A.2 Case I#csas25pu SO](10.02g/1)/pu-sol-therm-sol/r.rathbun/ 1995 pu_slsOl_2727sgroupndf4 intlommediumalalb-10cdcacrgdfemgmnni
Pksinau-235c1fso
2 1.0296.5 end1 den=l .002e-4 1.0296.5 end
1 den=2.59e-8 1.0296.5 end1 den=7.O14-81 .0296.5 end1 den=3 .006e-6 1.0296.5 end1 den=l .503e-5 1.0296.5 end1 den=l .002e-7 1.0296.5 end
1 den=l.148e-4 1.0296.5 endI den=2.003e-6 1.0296.5 end1 den=l.503e-6 1.0296.5 end
11\11
1111
den= 1.002e-5 1.0296.5 endden= 1.002e-5 1.0296.5 endden= 1.002e-6 1.0296.5 endden=5.O1le-6 1.0296.5 endden=3 .006e-6 1.0296.5 end
1 den=3 .006e-6 1.0296.5 endden=2.004e-6 1.0296,5 endden=l .002e-5 1.0296.5 endden= 1.002e-5 1.0296.5 endden=l. 107e-5 1.0296.5 end
solnpu(no3)4 1 10.02 i. 119 spg=l .0551.0296.594238.004 9423997.386942402.52194241.07594242.014 endend comppu sol ( 10.02g/1)/pu-sol-thertn-009/r rathbun/ 1995 pu_slsOl_27read parm g,en=250 npg=450 nsk=25 run=yes plt=yes nub=yes end parmread geomglobal unit 1com=!sol sphere + void+al shell!hemisphe-z } 160.964 chord 15.956sphere 0160.964sphere 2161.734end geomread bnds +xb=vacuum -xb=vacuum +yb=vacuum -yb=vacuum +zb=vacuum -zb=vacuum
end bndsread plot

WSklS-CRT-98-0021 SCALE 4.4 Workstation Validation(Rev. O)
! f
ttl=!y slice!
plt=yes pic=mixture xul=-65 yul=O ZUI=65 xlr=65 ylr=O zlr=-65 uax=l vax=Owax= Oudn=Ovdn=Owdn=-l nax=130rich=! .pa ! endend plot
read mixt eps=l endmixt
end dataend
Table A.2 Case 8#csas2518-1 (22.35 g/1)/pu-sol-therm-O I I/r. rathbun/1 995 pu_sls08_2727groupndf4 infhommediumfe 1 den=O.120e-3 1.0295 endcd 3 den=8.65 1.0295 endarbm-ss347 83 000 260007024000 1828000 122 1.0295 endsolnpu(no3)4 I 22.350.847 spg=I .0662 1.02959423995.894240 4.2 endend comp -pu-sol-therm-01 1...case 18-I..27-groupread parm tree= 100 gen= 1000 npg=600 risk= 100 run=yes plt=yes nub=yes end parmread geomglobal unit 1corn=! 18-inch sph with SS347& cd shells!sphere 1 122.6974sphere 2122.8244sphere 3 122.8752end geomread bnds +xb=vacuum -xb=vacuum +yb=vacuum -yb=vacuum +zb=vacuum -zb=vacuum
end bndsread plotttl=!y cut!plt=yes pic=mixture XUI=-23yul=O zul=23 x1r=23 yh=O zlr=-23 uax=l vax=Owax=O udn=O vdn=O wdn=- 1 nax= 130nch=!.psc ! endend plot
read mixt eps= 1 end mixt
end dataend
Table A.2 Case 14#csas25exp 1 (19.7 g/1)/pu-sol-therm-O 12/r.rathbun/l 996/pu_sls 14_2727groupndf4 intlommediumfe 1 den=O.46e-3 1.0300 endcr 1 den=O.14e-3 1.0300 endni 1 den=O.1le-3 1.0300 endam-24 1 1 den=O.12e-3 1.0300 endh20 2 1.0297 endarbm-sstank 7.93 001 260007224000182800010 3 1.0300 endarbm-lucoflex 1.4203 01 1 6012210013 1700014 1.0297 end

WS,MS-CRT-98-002 I SCALE 4.4
t !
arbm-frcnconc 2.-10133 7 00 1 130272.91625
WOrkstatiOn Validation Page S I of 99(Rev. O)
50 IO .00110920000 17.S038 26000~,94~lj 1oo1 .72 [37 S016 4S.0943 1400027.52026 1.0297 end
arbm-air .00128872 00 1 S016 22.2323 701477.7701 7 1.0297 endarbm-pool-ss 7.90152 00 1 26000 99.S62 6012.1425 1.0297 endsolnpu(no3)4 I 19.72.02 spg=l. 100 1.03009423974.31 S9 94240 1S.9102 942415.629942421.1419 end
end comppu sol ( 19.7g/1)/pu-sol-ther-O12/rrathbun/1996/pu_sls 14_27read parm tme=60 gen= I 100 npg=500 risk=100 run=yes plt=yes nub=yes end parmread geomunit 1cOm=!nitrate solution!cuboid 1 I 130,5 .5130.5.5 2S.17 Ocuboid 3 I 1310131028 .17-0.5unit 2com=!floating box!cuboid 2 I 129.51.5129.51,5191cuboid 41 130.5.5 130.5.5200cuboid 31 I3IO131O2OOglobal unit 3com=!solution+box+water refl!array 1 000replicate 2 I 25252525025 1end geomread arrayara= 1 nux= 1 nuy= 1 nuz=2corn=!solution+ floating box!fill 12 end fillend arrayread bnds +xb=vacuum -xb=vacuum +yb=vacuum -yb=vacuum +zb=vacuum -zb=vacuum
end bnds
read start nst= 1 end start
end dataend
Table A.2 Case 37#csas25pu_sol_oo 1
27groupndf4 infhommediumh20 3 den=.9970 1.0 29S endarbm_ss3041 7.924 00 I 2600069.5240001928000 9.52505522 1.0298endsolnpu(no3)4 1 73.00.2 spg=l .1301.0 29S 9423S .0069423995 .01194240 4.66994241 .30594242 .009 end
end comppu_sol_oo 1
read parm gen=l 100 npg=400 nsk=l 00 run=yes plt=yes nub=yes tree= 100 end parmread geomunit 1com=!pu_sol_OO1!sphere 1 114.5151sphere 21 14.6396sphere 3144.6396end geom

W’SNIS-CRT-98-002 I1 ?
SCALE 4.4 Workstation Validaticm
(Rev, 0)
end data
end
Table A,2 Case 43
#csas25
pu_sol_oo2
27groupndf4 infhommediumfe 1 den=O.0001891.0300 endhzo 3 den=O.9965 1.0300 endarbm_ss_O02 8.03 00 1 260007024000 1828000 122 1.0300 endsolnpu(no3)4 I 49.84 1.41 spg=1.1312 1.03009423996.8894240 3.12 endend comppu_sol_oo2read parm gen= I I00 npg,=400 risk=100 run=yes plt=yes nub=yes tree= 100 end parmread geomunit 1com=!pu SOI 002!sphere -1 1i5.3399sphere 2 i 15.4669sphere 3 145.4669end geomend dataend
Table A.2 Case 50#csas25pll_sol_oo327groupndf4 infhommediumfe 1 den=O.000124 1.0300 endh20 3 den=.9965 1.0300 endarbm_ss 003 S.0 3 00 I 260007024000 1828000 122 1.0300 endsolnpu(n~3)4 1 33.320.846 spg=l .0853 1.03009423998.2494240 1.76 endend comppu_sol_oo3read parm gen= 1I00 npg=400 risk=100 run=yes plt=yes nub=yes tree= 100 end parmread geomunit 1corn=! pu S(sphere ~sphere 2sphere 3end geomend dataend
_oo3!16.5156
16.6426
46.6426
Table A.2 Case 56#csas25pu_sol_oo427groupndf4 inflommediumfe I den=0,000145 1.0300 endh20 3 den=O.9965 1.0300 endarbm_ss 0048.03 001 260007024000182800012 2 1.0300 endsolnpu(n~3)4 1 26.270.825 spg=l .06941 .03009423999 .46 942400.54 end

WSMS-CR”T-98-(J02 I SCALE -I.-I Workstation Validation
r (Rev. O)
end comppu_sol_oo4read parm gen=l 10npg=400 nsk=lOOrun=yes plt=yes nub=yestme=l 00 end parmread geomunit Icom=!pu sol_O06!sphere ‘1 I 17.7865sphere 2 1 17.9135sphere 3 I 47.9135end geomend dataend
Table A.2 Case 69#csas25pu_sol_oo527groupndf4 infhommediumfe 1 den=O.0001281.0300 endh20 3 den=O.9965 1.0300 endarbm_ss_O05 8.03 00 I 2600070240001828000 122 1.0300 endsolnpu(no3)4 I 29.650.922 spg.=1,0777 1.03009423995.9594240 4.05 endend comppu_sol_oo5read pann gen=1100 npg=400 risk=100 run=yes plt=yes nub=yes tree= 100 end parmread geomunit 1com=!pu_sol_O05!sphere 1 1 17.7865sphere 21 17.9135sphere 3 1 47.9135end geomend dataend
Table A.2 Case 78#csas25pu_sol_O0627g,roupndf4 infhommediumfe 1 den=O.000088 1.0300 endh20 3 den=O.9965 1.0300 endarbm_ss_O06 8.03 001 2600070240001828000 122 1.0300 endsolnpu(no3)4 1 24.801.472 spg=l .08991 .03009423996 .88 942403.12 endend comppu_sol_O06read parm gen= 1100 npg=400 risk=100 run=yes plt=yes nub=yes tree= 100 end parmread geomunit 1com=!pu_sol_O06!sphere 1 1 19.0416sphere 21 19.1686sphere 3149.1686end geomend dataend

W’SMS-CRT-98-002 I SCALE 4.4 Workstation Validationt ,(Rev. 0)
C.3 Highly Enrichetl Uranium Metal Input Files
Table A.3 Case 1#csas25heu_m_OOI27groupndf4 infhommediumuranium I den=18.74 1.0300922341.0292235 93.71922385.27 endend compheu_metal godivaread parm gen=650 npg=800 nsk=50 run=yes plt=yes nub=yes tme=200 end parmread geomunit 1com=!heu_metal!sphere 1 18.7407end geomend dataend
Table A.3 Case 3#csas25heu_mts_fast_O02 case 127groupndf4 infhommediumuranium 1 den=l 8.751.0293922341.0292235 93.50922385.48 enduranium 2 den=l 8.901.029392234.0054 92235.7119223899.2836 endend compheu_metalread parm gen=650 npg=800 nsk=50 run=yes plt=yes nub=yes tme=200 end parmread geomunit 1com=!heu metal!sphere ~1 6.0509sphere 2 I 26.3709end geomend dataend
Table A.3 Case 9#csas25heu_mts_fast_O03 case 1 2-inch tuballoy-reflected sphere27groupndf4 infhommediumuranium 1 den=l 8.751.0293922341.0292235 93.50922385.48 enduranium 2 den=18.90 1.029392234.005492235 .7119223899.2836 endend compheu_metalread parm gen=650 npg=800 nsk=50 run=yes plt=yes nub=yes tme=200 end parmread geomunit 1com=!heu_metal!sphere 1 i 6.7820sphere 2111.8620end geomend dataend
Page 84 ot99
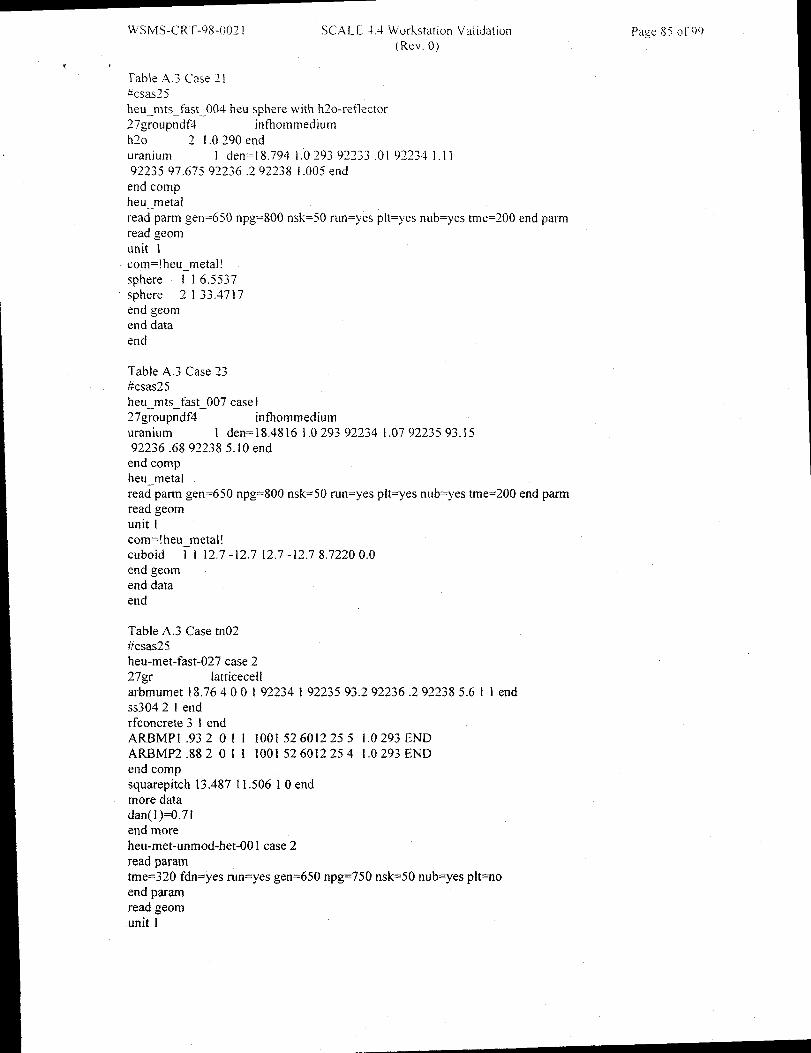
W’.SMS-CRT-98-OO21 SCALE 1.4 Workstation Validation
(Rev. O)
vTable A.3 Case 2 I
~csas25heu_mts_fast_O04 heu sphere with h20-reflector27groupndf4 infhommedium~~o 2 1.0290 enduranium 1 den=18.794 1029392233.01922341.119223597.67592236.292238 1.005 end
end compheu_metalread parrn gen=650 npg,=800 nsk=50 run=yes plt=yes nub=yes tme=200 end parmread geomunit 1com=!heu metal!sphere cl 6.5537sphere 2133.4717end geomend dataend
Table A.3 Case 23#csas25heu_mts_fast_O07 case 127g,roupndf4 infhommediumuranium I den=l 8.48161.0293922341.07 9223593.1592236.68922385.10 end
end compheu_metalread parm gen=650 npg=800 nsk=50 run=yes plt=yes nub=yes tme=200 end parrnread geomunit 1com=!heu_metal!cuboid 1 1 12.7-12.712.7-12.78.7220 0.0end geomend dataend
Table A.3 Case tn02#csas25heu-met-fast-027 case 227gr Iatticecellarbmumet 18.76400 19223419223593.292236 .2922385 .61 1 endSS3042 I endrfconcrete 3 1 endARBMPI .932 01 1 1001526012255 1.0293 ENDARBMP2 .8820 I 1 1001526012254 1.0293 ENDend compsquarepitch 13.48711.50610 endmore datadan( 1)=0.71end moreheu-met-unmod-het-00 1 case 2read paramtme=320 fdn=yes run=yes gen=650 npg=750 nsk=50 nub=yes pknoend paramread geomunit 1

WSMS-CRT-9S-002 I SCALE 4.4 Workstation Validation
(Rev. 0)
t ttom=’stainiess steel support rod in uranium’
zcyl 2 f 0.254 2p2.691cuboid I 1 4p0.254 2p2.691
unit 2
tom=’uranium piece between support rods’cuboid I I 2p4.O195 2p0.254 2p2.691unit 3tom=’uran km cylinder with support rods’array 1 -4.5275-0.254-2.691zcyl 1 I 5,753 2p2.691cuboid O 1 4p5. S675 2p2.691unit 4tom=’inner stainless steel support rod spacer’ZCY] ~ I 0.254 2po. 1145cuboid O 14p0.254 2p0. 1145unit 5tom=’void space between inner support rod spacers’cuboid O I 2p4.O195 2p0.254 2p0. 1145unit 6tom=’void space between uranium cylinders’array 2-4.5275-0.254-0.1145cuboid O I 4p5.8675 2p0. 1145unit 7tom=’void space between uranium array and moderator’cuboid O 1 4p5.8675 2p0.05725unit 8tom=’moderator with gaps’cuboid O I 2p5.8675 2p0.254 2p0.65cuboid 41 4p5.8675 2p0.65unit 9tom=’uranium cOiumn’array 3-5.8675-5.8675-6.91 Iunit 10
tom=’uranium rows’array 4-11.735-5.8675-6.91 1unit 11tom=’lower mom with uranium ar-ray’array 5-11.735-11.735-6.91 1cuboid 41 4p13.035 2p6.91 1cuboid O 1554.99-344.17428,96 -502.92221.1985-144.5615cuboid 3 1600.71-496.57581.36 -624.84221.1985-236.0015unit 12tom=’upper room’cuboid O 1554.99-344.17428.96 -563,88934.9385221.1985cuboid 3 1600.71-496.57581.36 -624.84965.4185221.1985globalunit 13tom=’room’array 6-496.57-624.84-236.0015end g,eomread arrayara= [ nux=3 nuy=l nuz=I fill 12 1 end filiara=2 nux=3 nuy= 1 nuz= 1 fill 454 end fillara=3 nux=l nuy=l nuz=7 fill 8736378 end fillara=4 nux= 1 nuy=2 nuz=l fill # end fll
ara=5 nux=2 nuy= 1 nuz=l fill f10 end fill
Page 86 0f99

, ws&ls-cRT-98-oo2 I SCALE 4.4 Workstation Validation
(Rev. O)
ara=6nux=i nuy=l nuz=2fil] II 12 end fill
end arrayread startnst= 1xsm=- I 1.6205XSP=[ [ .6205ysm=-1 1.6205ySp=i 1.6205zsm=-5.4965zsp=5.4965end startend plotend dataend
C.4 Highly Enriched Uranium Solution Input Files
Table A.4 Case 1#csas25heu-sol-001 easel27groupndf4 infhommediumarbm_ss_3047,9279 001 6012.06614000.81 15031 .025 16000.0192400018.525055 1.292600070 .002280009.2742000.0182 1.0293 end
solnuo2(no3)2 1 145.680.294 spg= 1.20381.029392234 1.0229223593.17292236.434922385.37’2 end
end compheu_sol_l 01read parmtme=lOO gen=1000npg=500 nsk=l OOrun=yes plt=yes nub=yesendparmread geomunit 1com=!heu_sol 101!cylinder 1 1 fi.96 31.20cylinder O 1 13.9641.60cylinder 2 1 14.2841.6-.64end geomend dataend
Table A.4 Case 11#csas25heu-sol-002 case 127groupndf4 inilommediumarbm_ss_304 7.9279 001 6012.06614000.81 15031.02516000.0192400018.5250551.292600070.002 280009.2742000.0182 1.0293 end
arbm_concre 2.321 13001 1001 .7560125 .527014.028016 48.49 11023.63120001 .25130272 .17 1400015.5016000.1919000 1.372000023.022000 .10260001.0 I 3 1.0293 endsolnuo2(no3)2 1 144.380.272 spg=l .2023 1.0293922341.02292235 93.17292236.434922385.372 end
end compheu_sol_201read parm tree= 100 gen= 1100 npg=500 risk=100 run=yes plt=yes nub=yes end parmread geomunit 1corn=!heu_sol_201 !cylinder 1 1 13.9629.790
Page 87 et-99

WSIMS-CRT-98-(M2 I SCALE 4.4 Workstation Validation
(Rev. 0)
cylinder O 1 13.9641.60
cylinder 2 I 14.2841.6-.64
cuboid O I 14.28-14.28 14.28-14.2841.6-0.64
reflector O I 50,3242.9243,1250.52 39.12541.065 1.0
reflector 3 1 25.725 .725.725,70,00.0 1.0
reflector O 1 4*0.O 0.6350.635 1.0
reflector 3 I 0.00.00 .00.025,425.4 1,0
end geomread plot ttl=’ plot’pic=mix plt=yesXUI=-80.I Yd= 0.0 Zlll=+l 10.0xlr=+9 I.0 yh= 0.0 zlr=-5 1.9uax=+ 1.0 wdn=- 1.0 nax= 132 rich=’ uac’ end
end plotend dataend
Table A.4 Case 25#csas25heu-sol-003 case 127groupndf4 infhommediumarbm~l tb 1.2868 00 I 10017.25601253.1967014 .101 801629.68815031 1:555170001,64635079 3.322350813.2424 1.0293 end
arbm_plexi 1.1863 00 1 1001 8.039601259.786801632.175 3 1.0293 endarbm_ss_304 7.9279 00 1 6012.066 14000.8 I 15031 .025 16000.0192400018.5250551.292600070.002 280009.2742000.0182 1.0293 end
solnuo2(no3)2 1 60.320.113 spg=l .0837 1.0293922341.02292235 93.17292236.434922385.372 end
end compheu_sol_301read parm tree= 100 gen=1100 npg=500 risk= 100 run=yes plt=yes nub=yes end parmread geomunit 1com=!heu_sol 301!cuboid O 1 6p~0.39999unit 2cuboid O 1 4p10.39999 10.09999-10.09999globalunit 3cylinder 1 I 13.96550.520cylinder O I 13.96591.50cylinder 2 I 14.28591.5-.64cuboid O 1 104.64-18.2617.71-105.19 121.625-0.64cuboid 3 1 125.44-39.0638.51-125.99 121.625-0.64reflector O 10.00 .00.00.00.6350.0 1.0cuboid 41 125.44-39.0638.51-125.99 142.46-21.44hole I -28.6628.11-11.04hole 1-28.66-115.59-11.04hole 1 +115.04-115.59-11.04hole 1+115.04+28.11 -11.04hole 2-28.6628.11 +132.36hole 2-28.66-115.59 +132.36hole 2 +115.04 -115.59 +132.36hole 2+1 15.04 +28.1 1 +132.36end geomread plot ttl=’ plot’

W’SMS-CRT-98-0(J2 It .
SCALE 4.4 Workstation Validation
(Rev. O)
pic=rn ix plt=yesXUI=-42.Oyul=o, o ZUI=+143,0xlr=+ 143.0 yir=O.Ozlr=-23.Ouax=+ [.0 wdn=- 1.0 nax= 132 rich=’ *x!=’ endttl=’x-y slice plot’pic=m ix pit=yes
XUI=-42.O yul=+40.o ZUI=+47. O
xlr=+ 128.0 ylr=- 128.0 zlr=+47.O
uax=+ 1,0 vdn=- 1.0 nax= 130 rich=’ *x!=’ endend plotend dataend
Table A.4 Case 44#csas25heu-sol-007 case I27groupndf4 infhommediumal 20.0 5.9469e-02 293 endarbm concr 2.321 13 00 1 1001 .7560125 .527014 .02801648 .49 11023.63 1~000 1.25130272.171400015.50 [6000 .19190001 .372000023.022000,10260001.014 1.0293 end
arbm_ss 3047.9279 00 I 6012.06614000.81 I5031.02516000.0192400018.5255551.292600070.002 280009.2742000.0183 1.0293 end
solnuo2(no3)2 1 67,280.128 spg=l .0934 1.0293922341.02292235 93.17292236.434922385.372 end
end compheu_sol_701read parm tree= 10b gen= 1I00 npg,=500 risk=100 run=yes plt=yes nub=yes end parmread geomunit 1corn=! heu_so1_70 I !cylinder 1 I 0.5050.0-0.32cylinder 2 1 10.560.0-0.32cylinder 1 1 10.5628.63-0.32cylinder O I 10.56 119.1 -0.32cylinder 2 1 10.96 119.1 -0,32cylinder O 1 10.96 121.68-0.32cylinder 3 I 1i.28 121.68-0.32cuboid O 1 15.24-15.24 15.24-15.24 123.445-0.32unit 2cylinder 1 10.50525 .40.0cylinder 21 0.6;5 25.40.0cuboid 41 15.24-15.2415.24-15.24 25.40.0unit 3cylinder I 10.5055 .00.0cylinder 2 10.6355 .00.0cuboid O 1 15.24-15.2415.24-15.24 5.00.0unit 4cylinder 1 1 1.140.0-0.32cylinder 2 I 10.560.0-0.32cylinder 1 1 10.5628.63-0.32cyiinder O 1 10.56 119.1-0.32cylinder 21 10.96119.1-0.32cylinder O 1 10.96 121.68-0.32cylinder 3 1 11.28121.68-0.32cuboid O 1 15.24-15.2415.24-15.24 123.445-0.32
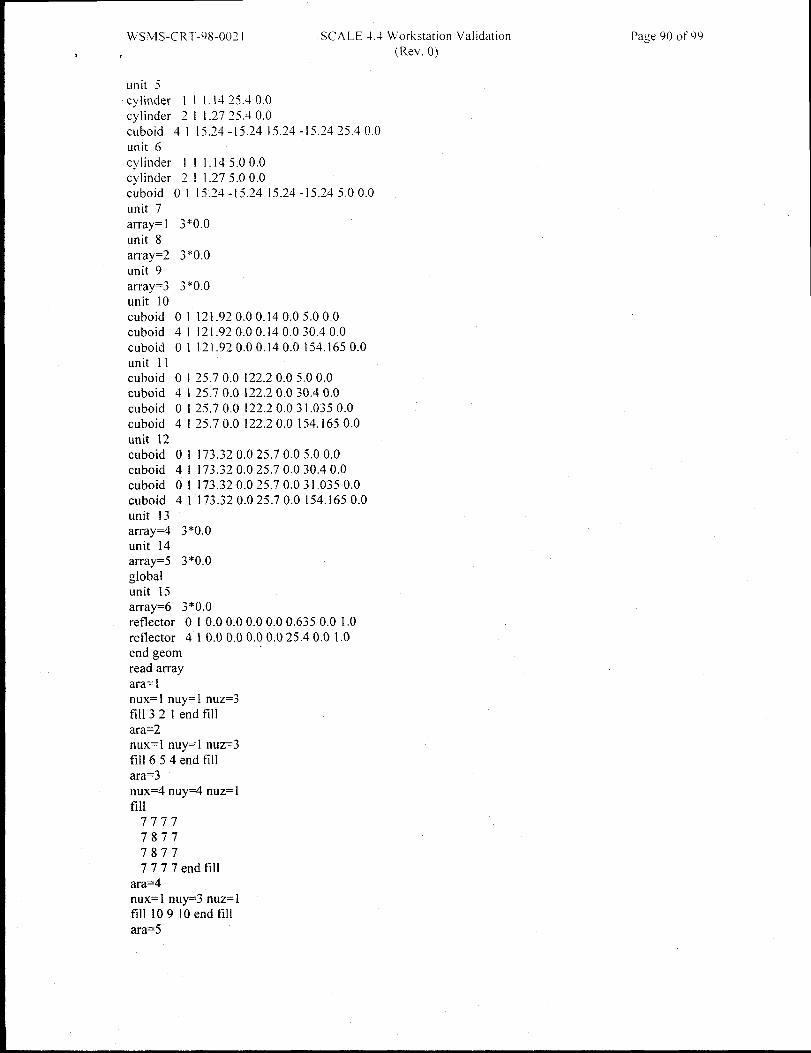
WSMS-CRT-98-002 I SCALE 4.4 Workstation Validation
3 (Rev. O)
unit 5cylinder I I 1.1425 .40.0cylinder 2 1 1.2725 .40.0cuboid 4 I 15.24-15.24 15.24 -15.2425.40.0unit 6cylinder 1 I 1.145 .00.0cylinder 2 1 1.275 .00.0cuboid O 1 15.24-15.24 15.24 -15.245.00.0unit 7array=] 3*0.Ounit 8array=2 3*0,0unit 9array=3 3*0.Ounit 10cuboid O 1 121.920 .00.140.05.00.0cuboid 4 I 121.920 .00.140.030.4 0.0cuboid O I 121.920.00.140.0154.165 0.0unit 11cuboid O 1 25.70.0 122.20 .05.00.0cuboid 4 125.70.0 122.20 .030.40.0cuboid O I 25.70.0 122.20 .031.0350.0cuboid 4 I 25.70.0122.20.0154.165 0.0unit 12cuboid O 1 173.320 .025.70.05.00.0cuboid 4 1 173.320 .025.70,030.4 0.0cuboid O I 173.320.025.70.031.035 0.0cuboid 4 I 173.320.025.70.0154. 1650.0unit 13array=4 3*0.Ounit 14away=5 3+0.0globalunit 15array=6 3*0.Oreflector O 10.00 .00.00.00.6350.0 1.0reflector 410.00 .00.00.025.40.0 1.0end geomread arrayara= inux= 1 nuy= 1 nuz=3fill 32 I end fillara=2nux= 1 nuy=l nuz=3fill 654 end fillara=3nux=4 nuy=4 nuz= 1fill
7777787778777777endtill
ara=4nux=l nuy=3nuz=lfill 109 10 end fillara=5
Page 90 Of 99

r , WSMS-CRT-98-002 I SCALE 4.4 Workstation Validation Page91 of99(Rev. O)
nux=3nuy=l nuz=lfillll 1311 end fillara=6nux=l nuy=3 nuz=lfill 121412 end fillend arrayread plot ttl=’ plot’pic=mix plt=yes
XUI=+25.Oyul=+71 .56 ZU1=+166.Oxlr=+73.O ylr=+71 .56 zh-=-l.Ouax=+l.O wdn=-l.Onax= 132nch=’ 12345’endend plotend dataend
Table A.4 Case 61#csas25heu-sol-008 case 127groupndf4 infhommediumal 2 0.05.9469e-02 293 endarbm_ss_304 7.9279 00 I 6012 .06614000.8 I 15031 .025 16000.0192400018.5250551.292600070.002 280009.2742000.0183 1.0293 end
arbm_pl_tb 1.2868 00 I 10017.25601253.1967014 .1OI 801629.68815031 1.555170001.64635079 3.322350813.2425 1.0293 end
arbm_pl_sd 1.1863 00 1 1001 8.039601259.786801632.175 4 I.O293 endsolnuo2(no3)2 1 60.320.113 spg=l .08371 .0293922341.022 9223593.17292236.434922385.372 end
end compheu_sol_801read parm tree= 100 gen=1100 npg=500 risk=100 rtm=yes plt=yes nub=yes end parmread geomunit 1com=!heu_so[ 801 !cylinder I 1 ~505 0.0-0.32cylinder 2 1 10.560.0-0.32cylinder 1 1 10.5634.82-0.32cylinder O I 10.56 119.1-0.32cylinder 2 1 10.96 119.1 -0.32cylinder O 1 10.96121.68-0.32cylinder 3 1 I 1.28121.68-0.32cuboid O 1 15.24-15.24 15.24-15.24122.945-0.32unit 2cylinder 1 10.50520 .80.0cylinder 210.63520 .80.0cuboid 5 1 15.24-15.2415.24-15.24 20.80.0unit 3cylinder I 10.5059 .60.0cylinder 210.6359 .60.0cuboid O 1 15.24-15.2415.24-15.24 9.60.0unit 4cylinder 1 1 1.140.0-0.32cylinder 21 10.560.0-0.32cylinder 1 1 10.5634.82-0.32cylinder O 1 10.56119.1-0.32cylinder 21 10.96119.1-0.32cylinder O 1 10.96121.68-0.32

WSMS-CRT-9S-OO? I SCALE 4.4 Workstation Validation pa:e~)~ Llf9~)t ., (Rev, O)
cylinder 3 1 I 1.28 121.6S -0,32cuboid O I 15.24-15.24 15.24-15.24 122.945-0.32unit 5cylinder 1 I 1.1420 .80.0cylinder 2 I I .2720 .80.0cuboid 5 I 15.24-15.24 15.24 -15.2420,80.0unit 6cylinder I I 1.149 .60.0cylinder 2 I I.279.60.0cuboid O 1 15.24-15.24 15.24 -15.249.60.0unit 7array=l 3*0.Ounit Sarray=2 3*0.Ounit 9array=3 3*0.Ounit 10cuboid O 10,490.0 121.920 .05.00.0cuboid 5 I 0.490.0 121.920 .030.40.0cuboid O I 0.490.0121.920.0153.665 0.0unit 11cuboid O I 20.80 .0122.90.05.00.0cuboid 5 i 20.80 .0122.90.030.40.0cuboid 4 I 20.80.0 122.90.0 153.665 .0.0unit 12cuboid O I 122.90 .00.490.09.60.0cuboid 5 1 122.90 .00.490.030.40.0cuboid O 1 122.90.00.490.0153.665 0.0unit 13cuboid O 1 10.3998-10.399810.3998 -10.399810.3998-10.3998unit 14cuboid O I 164.50 .020.80.09.60.0cuboid 5 1 164.50 .020.80.030.40.0hole 1310.410 .420.0hole 13154.1 10.420.0cuboid 4 1 164.50.020.80.0153.665 0.0unit 15array=4 3*0.Ounit 16array=5 3*0.Ounit 17array=6 3*0.Ounit 18cuboid O 1 I0.3999-10.399910.3999 -10.399910.0999-10.0999globalunit 19array=7 3*0.Oreflector O 10.00 .00.00.00.6350.0 1.0reflector 5 I 0.00.00 .00.020.20.01.0hole 1810.410 .4164.4hole 1810.4154.1 164.4hole 18 154.I 10.4164.4hole 18154.1 154.1164.4end geomread arrayara= 1

WSMS-CRT-98-002 I SCALE 4.4 Workstation Validation. (Rev. O)
nux=l nuy=l nuz=~fi11321 endtillara=2nux=l nuy=l nuz=3fill 6 54 end fillara=3nux=4 nuy=4 nuz= 1fill
7777
7877
7877
7777endfi11ara=4nux=3 nuy=l nuz=lfill 10910 endtlllara=5nux=l nuy=3 nuz=lfill 1215 12end fill
ara=6
nux=3nuy=l nuz=l
fill]] 1611 encl fillara=7nux=l nuy=3nuz=lfill 1417 14 end fill
end arrayread plot ttl=’ plot’pic=mixplt=yes
xul=+30.0yul=+66.52 ZU1=+166.0xlr=+70.9 ylr=+66.52 zlr=- 1.0uax=+l.O wdn=-1.0nax=132 rich=’ 12345’endttl=’x-y slice at 2=50 plot’pic=mix plt=yes
XUI=-21.8yul=+165.5 ZUI=+50.Ox1r=+165.5 ylr=-2 1.8 ZUI=+50.Ouax=+l.O vdn=-l.Onax= 130nch=’ 12345’ endend plotend dataend
Table A.4 Case 75#csas25HEU-SOL-THERM-009 easel 696gm/l solution sphere27groupndf4 multiregionh20 3 den=.99702 1.0293 endarbmal 2.71 4 000 1302798.7 14000.99529000.325055 .0052 1.0293 endsolnuo2f2 1 696.420 spg=t.79495 1.029392234.989223593.18 92236.5922385.34 end
end compspherical vacuum reflected O end1 11.5177 2 11.6764 3 35 end zone
solution 696 g/127 gp xsecread parm gen=800 npg=600 risk=100 run=yes plt=yestme=600 nub=yes end parmread geomunit 1corn=!solution sphere !
Page 93 ot’99

W’SNIS-CRT-98-OO? I SCALE 4.4 Workstation Validation). r
sphere 1
sphere 2
sphere 3
end geomread plotttl=!solutio]
(Rev. O)
11.51771I.676435
sphere!plt=yes pic=[n’ixture XUI=-36 yul=O ZUI=36xlr=36 ylr=O zlr=-36 uax= 1 vax=Owax=O udn=O vdn=O wdn=- 1 nax=75rich=!. ~w ! endend plotend dataend
Table A.4 Case 80#csas25HEU-SOL-THERM-O I I case I 53 gin/l solution sphere27groupndf4 multiregionh20 3 den=.99702 1.0293 endarbmal 2.714 000 1302798.7 14000.99529000.325055 .0052 1.0293 endsolnuo2f2 I 53.0200 spg= 1.0597 1.029392234.989223593.18 92236.5922385.34 end
end compspherical vacuum reflected O end1 15.9572 2 16.0842 3 35 end zone
more data endsolution 696 g/127 gp xsecread parm gen=800 npg=600 risk= 100 run=yes plt=no tme=600 nub=yes end parmread geomunit 1com=!solution sphere!sphere 1 1 15.9572sphere 21 I6.0842sphere 3135end geomread plotttl=! solution sphere!plt=yes pic=mixture XUI=-36yul=O ZUI=36xh-=36 yh=O zlr=-36 uax= 1 vax=Owax=O udn=O vdn=O wdn=- 1 nax=75nch=!.~w ! end
end plotend dataend
Table A.4 Case 82#csas25HEU-SOL-THERM-O 12 case 122 gin/l solution sphere27groupndf4 multiregionh20 3 den=.99702 1.0293 endarbmal 2.714 000 1302798.714000.99529000 .325055 .0052 1.0293 endsolnuo2f2 1 21.9700 spg= 1.02651.029392234.98 9223593.1892236.5922385.34 end
end compspherical vacuum reflected O end1 27.9244 2 28.1244 3 43.1244 end zone
more data endsolution 22 g/127 gp xsec

W“SMS-CRT-9S-002 I SCALE -I.-IWorkstation Validation, r(Rev. O)
read pann gen=800 npg=600 nsk=100 run=yesplt=no tme=600 nub=yesendparrnread geomunit Icom=!solution sphere!sphere I 127.9244sphere 2 I 28.1244sphere 3 1 43.1244end geomread plotttl=!solution sphere!plt=yes pic=mixture XUI=-36yul=O ZUI=36xlr=36 ylr=O zh=-36 uax=l vax=Owax=O udn=O vdn=O wdn=- 1 nax=75nch=!.~w ! end
end plotend dataend
Table A.4 Case 83#csas25HEU-SOL-THERM-O 10 case I 102 gin/l solution sphere 27.50 f27groupndf4 multiregionh20 3 den=.99702 1.0293 endarbmal 2.71 4 000 1302798.7 14000.99529000.325055 .0052 1.0293 endsolnuo2t2 1 102.060 spg=l.1 159 1.029392234 1.1 9223593.1392236.5922385.27 end
end compspherical vacuum reflected O end1 13.2123 2 13.3393 3 35 end zone
more data endsolution 22 g/127 g,pxsecread parm gen=800 npg=600 risk= 100 nm=yes plt=no tme=600 nub=yes end parmread geomunit 1corn=! solution sphere!sphere 1 I 13.2123sphere 21 !3.3393sphere 3135end geomread plotttl=!solution sphere!plt=yes pic=mixture XUI=-36yul=O ZUI=36xh-=36 ylr=O zlr=-36 uax= 1 vax=O .wax=O udn=O vdn=O wdn=- 1 nax=75rich=!.Fw ! endend plotend dataend

W’SMS-CRT-98-002 I SCALE 4.4 Workstation Validation
(Rev. O), 9
page 96 “f 99
APPENDIX D 27 Group Comparison Results
Discussion and analysis of the data contained in Table D-1 follows in Appendix E.
Table D-1. Results From SRS and WSMS SCALE 4.4 (27grp) Comparison.file DFS DFS WSMS WSMS
k,fi G keff o Ak
1 HEUMTSO [out 1.0060 0.0012 I.0057 0.0012 0.00032 HEUMTS22.out 1.0052 0.0013 1.0035 0.0013 0.00173 HEUMTS31 out I .0090 0.0016 1,0083 0.0016 0.00074 HEUMTS6 I.Out 1.0196 0.0012 1.0168 0.0012 0.00285 HEUMTS65.out 1.0329 0.0015 1.0333 0.0014 -0.00046 HEUMTS09.out 0.9976 0.0012 0.9997 0.0012 -0.00217 ‘HEUMTS23.out 1.0016 0.0012 0.9985 0.0012 0.003 I8 HEUMTS67.out 0.9859 0.0013 0.9885 0.0012 -0.00269 HEUMTS71.out 0.9796 0.0013 0.9808 0.0016 -0.001210 HEUMTS99.out 0.9956 0.0009 0.9967 0.0009 -0.001111 tn15 out 1.0101 0.0014 [.0107 0.0016 -0.000512 HEUSLS05.out 1.0062 0.0018 1.0048 0.0018 0.001413 HEUSLS13.out 1.0106 0.0023 1.0100 0.0018 0.000614 HEUSLS27.out 1.0109 0.0017 1.0085 0.0017 0.002415 HEUSLS66.out 1.0090 0.0019 1.0062 0.0019 0.002816 HEUSLS67.out 1.0021 0.0015 1.0002 0.0016 0.002017 HEUSLSIO.out 0.9971 0.0018 0.9993 0.0017 -0.002218 HEUSLS33.out 1.0102 0.0018 1.0078 0.0016 0.002419 HEUSLS43.out 1.0062 0.0015 1.0075 0.0016 -0.0013Z() HEUSLS63.out 0.9973 0.0015 0,9973 0.0016 0.000021 HEUSLS72.out 1.0000 0.00 I5 I.0004 0.0016 -0.000422 HEUSLS75.out 1.0123 0.0017 1.0126 0.001523
-0.0003HEUSLS78.out 1.0056 0.0017 1,0105 0.0015 -0.0049
24 HEUSLS79.out 1.0021 0.0019 I.0059 0.0015 -0.003925 HEUSLS81 .Out 1.0074 0.0015 1.0066 0.0015 0.000826 HEUSLS82.out 1.0003 0.0012 0,9992 0.0013 0.001227 HEUSLS84.out 1.0096 0.0015 1.0096 0.0017 0.000028 PU_MTS02,0ut 0.9997 0.0014 0.9994 0.0016 0.000329 PU_MTS06.out 0.9965 0.0010 0.9992 0.0010 -0.002830 PU_MTS08.out 0.9922 0.0016 0.9939 0.0016 -0.001731 PU_MTS23.0ut 0.9997 0.0015 0.9976 0.0017 0.002132 PU_MTS25.out 1.0005 0.0018 1.0007 0.0016 -0.000233 PU_MTSIO.out 0.99208 0.00173 0.9936 0.00149 -0.001534 PU_MTS07.out 0.9967 0.0015 0.9920 0.0015 0.004735 PU_MTSl 7,0ut 0.9870 0.00 I5 0.9880 0.0015 -0.001036 PU_MTS20.out 0.9862 0.0016 0.9888 0.0015 -0.002537 Pu_MTs21 .Out 0.9915 0.0014 0.9882 0.0015 0.003338 PU_SLS03.out 1.0257 0.0017 1.0281 0.0020 -0.002439 PU_SLS 14.out 1.0145 0.0011 1.0143 0.0012 0.000240 PU_SLS33.out 1.0174 0.00 I 1 1.0175 0.0013 -0.000141 PU_SLS42.out 1.0202 0.0018 1.0209 0.00 I7 -0.000842 PU_SLS21 out 1.0141 0.0018 1.0148 0.0016 -0.000743 PU_SLS08.out 1.0037 0.0015 1.0043 0.0015 -0.000644 PU_SLS 13.out 1.0103 0.0014 1.0096 0.0015 0.0007

W’SMS-CRT-9S-M)2 I SCALE -t.-! Workstation Validation‘ # (Rev. O)
Table D-1. Results From SRS and WSMS SCALE 4.4 (27grp) Comparison (Continued).
file DFS DFS WSMS WSMSkcff G k,ff . 0 Aii
45 PU_SLS27.out 1.0102 0.0015 1.009 I 0,0014 0.001 I46 PU_SLS57.out 1.0088 0.00 I5 1.0094 0,0014 -0.000647 PU_SLS76.out 1.0096 0.0016 i .0088 0.0016 0.000848 HEUMTSO1.out 0.9975 0.00 I5 0.9961 0.0012 0.001449 HEUMTS04.out 0.9943 0.0014 0.9941 0.0013 0.000250 HEUMTS06.out 0.9993 0.0014 1.0008 0.0012 -0.001451 HEUMTSIO.out 1.0064 0,0013 1,0053 0.0014 0.0011j~ HEUMTS15.out 0.9919 0.0012 0.9927 0.0012 -0.0009
1.0038 0.0015 1.0038 0.0015
Mean
Std. Deviation 0.0103 0.0003 0.0101 0.0002
About Mean
Page 91 of99

W’SiMS-CRT-9S-002 \ SCALE 4.4 Workstation Validation Page 98 of99(Rev. O)
4 ,
APPENDIX E 238 Group Comparison Results
Table E-1. Results From SRS and WSMS SCALE 4.4 (238grp) Comparison.
file DFS DFS WSMS WSMSk,~~ a k,~~ 0 Ak
1 HEUMTS02.out 0.9979 0.0012 0.9971 0,0014 0.00082 HEUMTS22.out 0.9979 0.0013 0.9948 0.0013 0.003 I3 HEUMTS31 out 0.9918 0.0015 0.9956 0,0014 -0.00384 HEUMTS61.out 0.9945 0.0015 0.9928 0.0013 0.00185 HEUMTS65.out 1.0009 0.0015 0.9997 0.0014 0.001 I6 HEUMTS09.out 0.9913 0,0011 0.993 I 0.0013 -0,00187 HEUMTS23.out 0.9919 0.0014 0.9927 0.0011 -0.00088 HEUMTS40.out 0.9949 0.0014 0.9951 0.0014 -0,00029 HEUMTS60.out 0.9899 0.0014 0.9909 0.0013 -0.00 Io10 HEUMTS99.out 0.9902 0.0008 0.9898 0.0009 0.000411 tr?15.out [.00188 0.00123 1.00486 0.00129 -0.003012 HEUSLS05.out 1.0031 0.0015 1.0008 0.0014 0.002313 HEUSLS13.out I .0030 0.0016 0.9986 0.0019 0.004414 HEUSLS27.out 1.0019 0.0017 1.0021 0,0015 -0.000315 HEUSLS66.out 1.0037 0.0015 1.0009 0.0016 0.002916 HEUSLS67.out 0.9980 0.0013 0.9989 0.0015 -0.000917 HEUSLSIO.out 0.9918 0.0018 0.9946 0.0017 -0.002918 FIEUSLS33.out 1,0024 0.0020 1.0071 0.0015 -0.004719 HEUSLS43.out 1.0018 0.0017 1.0015 0.0016 0.000320 HEUSLS63.out 0.9984 0.0014 0.9971 0.0012 0.001321 HEUSLS72.out 0.9956 0.0016 0,9959 0.0015 -0.000322 HEUSLS75.out 1.0060 0.0017 1.0028 0.0019 0.003123 HEUSLS78.out 1.0028 0.0018 1.0035 0.0019 -0,000624 HEUSLS79.out 0.9988 0.0017 0,9967 0.0016 0.002125 HEUSLS8 1.Out 1.0037 0.0015 1.0043 0.0013 -0.000626 HEUSLS82.out 1.0014 0.0011 1.0039 0.0014 -0.002527 HEUSLS84.out 1.0027 0.0017 1.0037 0.0015 -0.001028 PU_SLS03.out 1.0227 0.0010 1.0219 0.0009 0.000829 PU_SLS14.out 1.0111 0.0011 1.0081 0.001 I 0.003030 PU_SLS21.out 1.0124 0.0014 1.0081 0.0011 0.004331 PU_SLS27.out 1.0050 0.0015 1.0074 Q.0013 -0.002432 PU_SLSZ3,0ut 1.0i28 0.0011 1.0143 0.0011 -0.001533 PU_SLS42.out 1.0077 0.0014 1.0095 0.0016 -0.00 [734 PU_SLS08.out 0.9981 0.0014 0.9997 0.0013 -0.001635 PU_SLS13.out 1.0041 0.0015 1.0056 0.0014 -0.001636 PU_SLS57.out 1.0009 0.0014 1.0019 0.0015 -0.001037 PU_SLS76.out 1.0040 0.0015 1,0022 0.0012 0.001938 PU_MTS02.out 0.9949 0.0015 0.9978 0.0015 -0.002939 PU_MTS07.out 0.9933 0.0015 0,995 [ 0.0015 -0.001840 PU_MTS08.out 0.9912 0.0013 0.9913 0.0015 -0.000141 PU_MTSIO.out 0.994 0.0015 0.9917 0.0014 0.002342 PU_MTS14.out 0.9897 0.0014 0.9909 0.0015 -0.001143 PU_MTS 17.out 0.9906 0.0013 0.9883 0.0015 0.002244 PU_MTS20.out 0.9915 I 0.0014 0.9897 0.0014 0.001845 PU MTS22.out 0.9921 0.0015 0.9892 0.0015 0.0029
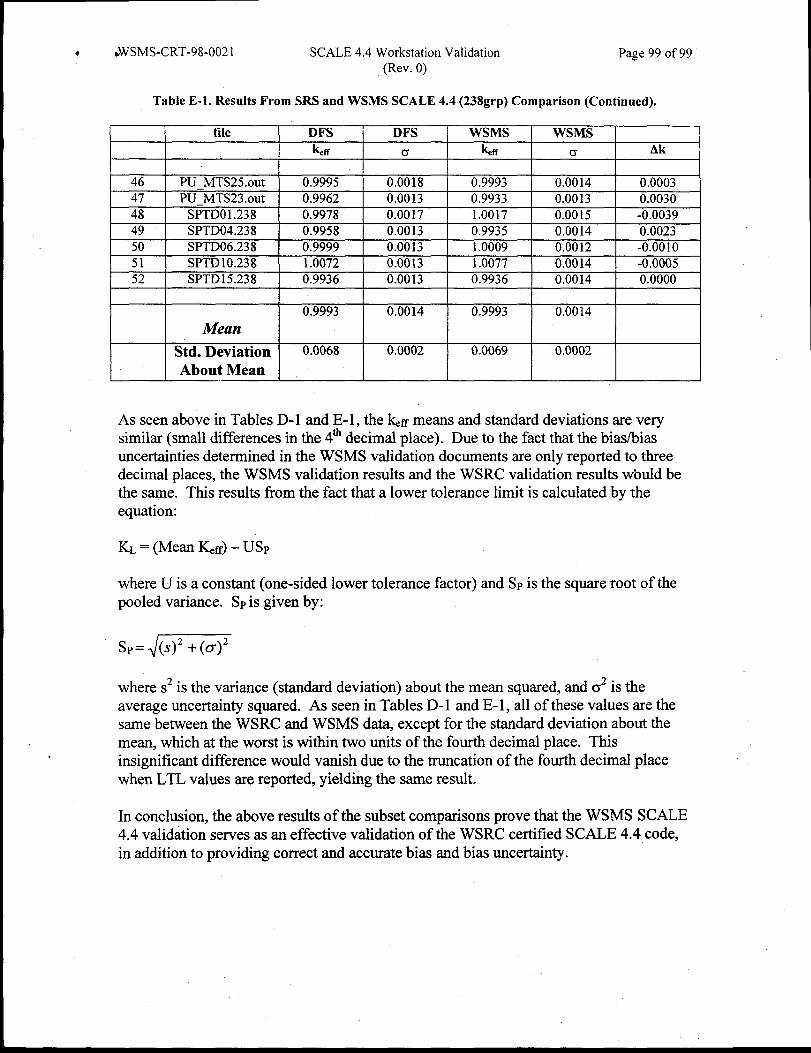
? *WSMS-CRT-98-0021 SCALE 4.4 Workstation Validation page 99 Of99(Rev. O)
Table E-L Results From SRS and WSMS SCALE 4.4 (238grp) Comparison (Continued).
file DFS DFS WSMS WSMS
b Cr br a Ak
46 PU_MTS25.out 0.9995 0.0018 0.9993 0.0014 0.000347 PU_MTS23 out 0.9962 0.0013 0.9933 0.0013 0.003048 SPTDO1.238 0.9978 0.0017 1.0017 0.0015 -0.003949 SPTD04.238 0.9958 0.0013 0.9935 0.0014 0.002350 SPTD06.238 0.9999 0.0013 1.0009 0.0012 -0.001051 SPTD 10.238 1.0072 0.0013 1.0077 0.0014 -0.000552 SPTD15.238 0.9936 0.0013 0.9936 0!0014 0.0000
0.9993 0.0014 0.9993 0.0014
Mean
Std. Deviation 0.0068 0.0002 0.0069 0.0002About Mean
As seen above in Tables D-1 and E-1, the km means and standard deviations are verysimilar (small differences in the 4ti decimal place). Due to the fact that the biadbiasuncertainties determined in the WSMS validation documents are only reported to threedecimal places, the WSMS validation results and the WSRC validation results wbuld bethe same. This results from the fact that a lower tolerance limit is calculated by theequation:
KL = (Mean IQr) – USP
where U is a constant (one-sided lower tolerance factor) and Sp is the square root of thepooled variance. Sp is given by:
Sp= J(s)’+ (cr)2
where S2is the variance (standard deviation) about the mean squared, and a2 is theaverage uncertainty squared. As seen in Tables D-1 and E-1, all of these values are thesame between the WSRC and WSMS data, except for the standard deviation about themean, which at the worst is within two units of the fourth decimal place. Thisinsignificant difference would vanish due to the truncation of the fourth decimal placewhen LTL values are reported, yielding the same result.
In conclusion, the above results of the subset comparisons prove that the WSMS SCALE4.4 validation serves as an effective validation of the WSRC certified SCALE 4.4 code,in addition to providing correct and accurate bias and bias uncertainty.