scale-free neural and physiological dynamics in ... · pdf filescale-free neural and...
TRANSCRIPT

Cognition and Behavior
Scale-Free Neural and Physiological Dynamics inNaturalistic Stimuli ProcessingAmy Lin,1,2 Brian Maniscalco,1,3 and Biyu J. He1,3,4
DOI:http://dx.doi.org/10.1523/ENEURO.0191-16.2016
1National Institute of Neurological Disorders and Stroke, National Institutes of Health, Bethesda, MD 20892, USA,2Semel Institute for Neuroscience and Human Behavior, University of California-Los Angeles, Los Angeles, California90095, 3Neuroscience Institute, New York University Langone Medical Center, New York, NY 10016, USA,4Departments of Neurology, Neuroscience and Physiology, and Radiology, New York University Langone MedicalCenter, New York, NY 10016
Abstract
Neural activity recorded at multiple spatiotemporal scales is dominated by arrhythmic fluctuations without acharacteristic temporal periodicity. Such activity often exhibits a 1/f-type power spectrum, in which power falls offwith increasing frequency following a power-law function: P�f� � 1/f�, which is indicative of scale-free dynamics.Two extensively studied forms of scale-free neural dynamics in the human brain are slow cortical potentials(SCPs)—the low-frequency (�5 Hz) component of brain field potentials—and the amplitude fluctuations of �oscillations, both of which have been shown to carry important functional roles. In addition, scale-free dynamicscharacterize normal human physiology such as heartbeat dynamics. However, the exact relationships amongthese scale-free neural and physiological dynamics remain unclear. We recorded simultaneous magnetoencepha-lography and electrocardiography in healthy subjects in the resting state and while performing a discriminationtask on scale-free dynamical auditory stimuli that followed different scale-free statistics. We observed thatlong-range temporal correlation (captured by the power-law exponent �) in SCPs positively correlated with thatof heartbeat dynamics across time within an individual and negatively correlated with that of �-amplitudefluctuations across individuals. In addition, across individuals, long-range temporal correlation of both SCP and�-oscillation amplitude predicted subjects’ discrimination performance in the auditory task, albeit throughantagonistic relationships. These findings reveal interrelations among different scale-free neural and physiologicaldynamics and initial evidence for the involvement of scale-free neural dynamics in the processing of naturalstimuli, which often exhibit scale-free dynamics.
Key words: � oscillations; arrhythmic brain activity; heart rate variability; natural stimuli; scale-free dynamics;slow cortical potentials
Significance Statement
Many time-varying natural stimuli such as natural soundscapes, speech, and music exhibit scale-freedynamics characterized by a 1/f-type power spectrum. In parallel, scale-free neural dynamics are prominentacross observational levels in the brain. Two well-established forms of scale-free neural activity are slowcortical potentials and amplitude fluctuations of � oscillations. However, it is unknown whether they arerelated. In addition, the interbeat interval fluctuation of the healthy human heart follows scale-free dynamics,but its relationship with scale-free neural dynamics is not fully characterized. We observed novel relation-ships between these different scale-free neural and physiological dynamics. Moreover, naturalistic stimuliexhibiting scale-free dynamics modulate scale-free neural dynamics, and baseline characteristics ofscale-free neural dynamics predict an individual’s ability to process naturalistic stimuli.
New Research
September/October 2016, 3(5) e0191-16.2016 1–13

IntroductionMany natural stimuli exhibit scale-free temporal or spa-
tial patterns, such that no particular temporal or spatialperiodicity predominates (Mandelbrot, 1999). In the spa-tial domain, it is well documented that natural imagesfollow a P�f� � 1/f� spatial power spectrum, where f is thespatial frequency (Field, 1987). In the temporal domain,scale-free dynamics are characterized by a P�f� � 1/f�
temporal power spectrum, where f is the temporal fre-quency and the power-law exponent � captures thestrength of autocorrelation in the signal over time. Indynamics with a larger �, trends tend to persist overlonger periods of time (Fig. 1A–C). Time-varying naturalimages (i.e., natural movies) typically follow a P�f� � 1/f�
-type temporal power spectrum (Dong and Atick, 1995).Loudness and pitch fluctuations of natural soundscapes,such as urban and rural environmental noise (De Coenselet al., 2003), speech, and music (Voss and Clarke, 1975),also exhibit 1/f-type temporal power spectra.
In the brain, scale-free dynamics are prominent acrossmultiple observational levels (He, 2014) and manifest inhuman behavioral output (Gilden, 2001). Two well-studiedforms of scale-free neural dynamics are the slow corticalpotentials (SCPs; He et al., 2010) and amplitude fluctua-tions of brain oscillations (Linkenkaer-Hansen et al.,2001). The SCPs are the low-frequency (�5 Hz) compo-nent of broadband field potentials that exhibit a 1/f-typepower spectrum. Changes in arousal state and task per-formance alter the power-law exponent in the SCP rangerecorded by electrocorticography in humans (He et al.,2010). In addition, the SCP correlates with functional MRI(fMRI) signals in both spontaneous fluctuations andstimulus-driven responses (He et al., 2008; He andRaichle, 2009; Kahn et al., 2013; Pan et al., 2013), and thespontaneous fMRI signals exhibit prominent scale-freedynamics (He, 2011).
A parallel line of research has established that ampli-tude fluctuations of brain � oscillations also follow scale-free dynamics (Linkenkaer-Hansen et al., 2001). Itspower-law exponent has been shown to vary with taskperformance (Linkenkaer-Hansen et al., 2004), have agenetic contribution (Linkenkaer-Hansen et al., 2007), in-crease during development (Smit et al., 2011), and differ
between patients with Alzheimer’s disease and controls(Montez et al., 2009). Moreover, the power-law exponentof �-oscillation amplitude predicts that of behavioral fluc-tuations across individuals (Palva et al., 2013; Smit et al.,2013), indicating a link between neural and behaviorallong-range temporal correlation.
Although existing data suggest that SCP phase modu-lates �-oscillation amplitude (He, 2014), whether scale-free dynamics in the SCP and �-amplitude fluctuationsare related remains unknown. In addition, a rich literatureestablishes that the healthy human heart is characterizedby scale-free dynamics in its interbeat interval, and failurethereof accompanies heart disease or aging (Goldbergeret al., 2002). Currently, the literature remains mixed aboutwhether and how scale-free dynamics in the SCP and �amplitude interact with heartbeat dynamics (Palva et al.,2013; Zhigalov et al., 2015). This question is especiallyintriguing in light of recent data showing that afferentsignals from the heart interact with not only the limbicsystem but also perceptual and cognitive systems in thebrain (Park et al., 2014).
We recorded simultaneous magnetoencephalography(MEG) and electrocardiography (ECG) in human subjectsin the resting state and while listening to auditory tonesequences whose pitch fluctuations constituted scale-free dynamics with varying degrees of autocorrelation.These auditory stimuli captured second-order statistics innatural stimuli, since their temporal power spectra fol-lowed a power-law distribution. Subjects discriminatedtone sequences with different degrees of autocorrelation,as captured by the power-law exponent �. We investi-gated the relationships among scale-free neural andheartbeat dynamics across sensors and individuals andover time within an individual. We further examinedwhether the degree of autocorrelation in scale-free audi-tory stimuli modulated scale-free neural and heartbeatdynamics, and whether scale-free neural dynamics pre-dicted an individual’s ability to discriminate stimuli withdifferent degrees of autocorrelation. We hypothesized,first, that scale-free dynamics in the SCP, �-amplitudefluctuations, and heartbeat dynamics are interrelated, andsecond, that scale-free neural dynamics are involved inthe processing of dynamic, scale-free stimuli.
Materials and MethodsSubjects
The experiment was approved by the Institutional Re-view Board of the National Institute of Neurological Dis-orders and Stroke. All subjects were right-handed andneurologically healthy with normal hearing. Nineteen sub-jects between 19 and 30 years old (mean age 24.7; 12females) participated in a �3-h long MEG session withsimultaneous ECG recording. Two subjects did not haveECG data because one subject was tested beforethe ECG recording was implemented, and the other sub-ject’s ECG data was too noisy to reliably extract R peaks.All subjects provided written informed consent.
Received June 20, 2016; accepted October 5, 2016; First published October13, 2016.Authors report no conflict of interestAuthor Contributions: B.M. and B.J.H. designed research together with A.L.;
A.L. and B.M. performed research; A.L. analyzed data together with B.M. andB.J.H.; A.L., B.M., and B.J.H. wrote the paper.
This research was supported by the Intramural Research Program of theNational Institutes of Health/National Institute of Neurological Disorders andStroke. B.J.H. also acknowledges support by Leon Levy Foundation.
Acknowledgments: We thank Patrice Abry for advice on stimulus creation,Tom Holroyd for help with setting up head position self-correction software,and Richard Hardstone for feedback on a previous version of the manuscript.
Correspondence should be addressed to Biyu J. He, 550 1st Avenue, MSB460, New York, NY 10016. E-mail: [email protected].
DOI:http://dx.doi.org/10.1523/ENEURO.0191-16.2016Copyright © 2016 Lin et al.This is an open-access article distributed under the terms of the CreativeCommons Attribution 4.0 International, which permits unrestricted use, distri-bution and reproduction in any medium provided that the original work isproperly attributed.
New Research 2 of 13
September/October 2016, 3(5) e0191-16.2016 eNeuro.org

Stimulus creationWe created auditory tone sequences whose pitch fluc-
tuations had five levels of autocorrelation strength, span-ning from fractional Gaussian noise (fGn) to fractionalBrownian motion (fBm). We used a circulant embeddingalgorithm (Helgason et al., 2011) to create fGn time serieswith Hurst exponents of 0.5, 0.6, and 0.75 (correspondingto power-law exponent � � 0, 0.2, and 0.5, respectively,where � � 2H – 1), as well as fBm time series with Hurstexponents of 0.25 and 0.5 (corresponding to power-lawexponent � � 1.5 and 2, where � � 2H � 1). We createdsix unique 600-element long series for each level of �,
x_� � �x1, x2, �, x600�, � � �0, 0.2, 0.5, 1.5, 2�,1 � i � 6 ,
where each element xj of x�,i is taken to represent thepitch of the jth tone in the sequence. We verified that eachsynthesized x�,i indeed had the desired � by computingthe autocorrelation function and performing power spec-tral analysis for each sequence (Fig. 1A and 1B, respec-tively). Each auditory sequence i was unique to ensurethat subjects would respond to statistical properties of thesequence rather than memorizing particular features.
After verifying the autocorrelation properties of the se-quences, we translated and scaled each x�,i so that its
elements ranged from log(220) to log(880) and discretizedthe series such that each element took on one of 25values evenly spaced on the log scale. Let us refer to thescaled, translated, and discretized series as p�,i . Each p�,i
thus represents a time series of tone pitches, where pitchvaries in semitone steps between 220 and 880 Hz andexhibits autocorrelation prescribed by �. This range ofpitch values was chosen to span the isoloudness regionof human hearing (i.e., with identical amplitude, subjectiveloudness varies minimally with changing pitch in thisrange).
To produce an auditory stimulus for each tone se-quence, we first computed the time series of tone fre-quencies as f_�, i � exp�p_�, i�, in Hz. For each fj�f_�, i, weconstructed a sinusoidal sound wave of duration 300 msat a 44,100-Hz sampling frequency (thus yielding 13,230samples for each tone) according to
y_ j,s � Acos�2�fj�s/SR� � j�, 1 � s � 13, 230 ,
where s denotes sample number, fj denotes tone fre-quency, SR denotes the sampling frequency of 44,100 Hz,and A � 1. The amplitude of the tones was kept identicalthroughout the sequence, i.e., the tones were notamplitude-modulated. The 300-ms duration was chosenfor ease of listening (Patel and Balaban, 2000). Because
Figure 1. Stimuli characteristics and behavioral performance. A, Lagged autocorrelation function for each class of stimulussequences, averaged across the six examples at each � level. B, Power spectra of stimulus sequences, averaged across the sixexamples at each � level. C, Visual instruction presented to the subjects, showing example stimulus sequences at different � levels.Sequences of two different overall range were presented (two left columns, large fluctuation range; two right columns, small range),to demonstrate that trend strength (i.e., autocorrelation) is independent from overall range. D, Group-average (n � 19) conditionalprobability of behavioral response given stimulus �, color-coded by the proportion of response � at each stimulus-� level. Each rowsums to 1.
New Research 3 of 13
September/October 2016, 3(5) e0191-16.2016 eNeuro.org

each tone was 300 ms and each sequence contained 600tones, each sequence had a total duration of 180 s.
Cosine waves y_ j, s for each tone j were concatenated,such that there was no silence period between consecu-tive tones. For the first tone j � 1, the phase was set to0. For subsequent tones j � 1, the absolute value of wasset to the arccosine of the final sample of tone j – 1. Thesign of for tone j was set such that the first-order timederivative was continuous across the transition from theend of tone j – 1 to the start of tone j. This ensured thatthere was a smooth and continuous transition betweencosine waves in the junctions where tone frequencychanged.
Auditory sequences were presented using the Psych-PortAudio function of the Psychophysics Toolbox (Brain-ard, 1997) in Matlab (Mathworks, Natick, MA). The audiowas delivered through specialized ear tubes that werecustom fitted to work within the MEG scanner. We usedEtymotic ER-3 Insert Headphones, in which the frequencyresponse is flat to 5 kHz. The plastic tubing from thetransducer to the earpiece had a speed-of-sound delay ofaround 10 ms, which was corrected in MEG data analy-ses.
Experimental designAfter presentation of each auditory tone sequence (3
min long), subjects were asked to judge its “trendstrength” on a scale of 0 to 4. Higher “trend strength” wasexplained to the subjects as the tendency for a trend topersist over longer period of time, which captured thestrength of autocorrelation in the time series. Ascendingentries on the “trend strength” scale corresponded toascending levels of stimulus �. Visual performance feed-back was presented after every trial to assist subjects inlearning how to use the scale to accurately characterizestimulus �. The feedback indicated what trend strengthrating had been entered by the subject, what the truetrend strength of the sequence was, and whether thesubject’s trend strength rating was correct, close to cor-rect (off by one level of trend strength), or incorrect (off bytwo or more levels of trend strength). To ensure adequatetask performance, all subjects were trained during aninitial behavioral session that took place at least a fewdays previously in which shortened versions of stimulisequences were used. Subjects who performed ade-quately (behavioral � 0.2, see below) were invited backfor the MEG/ECG experiment (82.4% of all subjectstested). At the start of the initial behavioral session as wellas the main MEG/ECG experiment, subjects were visuallypresented with shortened examples of each level of trendstrength, as exemplified in Fig. 1C, which shows thattrend strength was independent of overall range. Subjectsalso completed one practice block at the start of the mainexperiment.
Stimulus sequences were initially created with the in-tention of having � values of 0, 0.5, 1.01, 1.5, and 2, andfeedback presented to the subject was consistent withthis scheme. However, because of an aliasing artifact,stimuli with an intended � � 1.01 had an empirical �closer to 0.2 (Fig. 1A,B), and so we treat these stimuli as
having � � 0.2 in all analyses. Because of this complica-tion, the implicit mapping between trend strength ratingand stimulus � communicated to subjects via visual feed-back was erroneous for the � � 0.2 case. Nonetheless,subjects demonstrated an ability to accurately detect thatpitch autocorrelation was weaker for stimulus � � 0.2than for � � 0.5 (Fig. 1D). This suggests that subjectswere able to accurately classify stimulus � in spite of thefeedback error and further justifies our treatment of thesestimuli as � � 0.2 rather than � � 1.01. Additionally, weverified that no analysis presented herein yielded differentstatistical inference if using the originally intended value ofstimulus � � 1.01 rather than the empirically derived valueof � � 0.2.
We also included a rest condition (3-min long trials) inwhich no auditory stimulus was presented. Throughoutthe experiment—during both auditory task and restingstate—subjects were asked to keep their gaze fixed on across presented at the center of the screen to minimizeeye movement. Each subject completed 36 trials in total,which included six trials per condition (five stimulus �levels plus rest condition). The stimulus sequences dif-fered across trials within the same � level. The trials weregrouped in blocks of three, resulting in 12 blocks in total.Stimulus � was randomized across blocks, whereas resttrials were evenly dispersed throughout the experiment(always presented as the second trial of even numberedblocks). The head position of the subject was measuredwith respect to the MEG sensor array using coils placedon the left and right preauricular points and the nasion.Before each block subsequent to the first block, the sub-ject self-corrected the head position to the same positionrecorded at the start of the first block using a customvisual-feedback program to minimize head displacementacross the experiment. Video monitoring of the subjectduring the experiment ensured that subjects stayed alertand did not close their eyes for extended periods of time.After excluding trials that had failure of behavioral re-sponse or drowsiness as shown by eye closure, 14 sub-jects had all 36 trials, two subjects had 35 trials, twosubjects had 33 trials, and one subject had 30 trials.
Data acquisition and preprocessingExperiments were conducted in a whole-head 275-
channel CTF MEG scanner (VSM MedTech, Coquitlam,BC, Canada). MEG data were collected with a samplingrate of 600 Hz and an anti-aliasing filter at �150 Hz.Analyses were performed on 271 sensors after excludingfour malfunctioning sensors. The Fieldtrip package (Oost-enveld et al., 2011) implemented in Matlab was used fordata preprocessing, and analyses were conducted usingFieldtrip and custom-written code. We used independentcomponent analysis to remove artifacts related to eyeblinks, eye movements, heartbeat, breathing, and slowmovement drift. Empty-room recording was collected in aprior experiment to verify that instrument noise was or-ders of magnitude lower than the signal we analyzed.
Measuring scale-free parametersVarious scale-invariance measures are mathematically
related and thus can be reasonably compared (Eke et al.,
New Research 4 of 13
September/October 2016, 3(5) e0191-16.2016 eNeuro.org

2002). Power-law exponents of SCP and �-oscillationamplitude fluctuations were estimated using the commonpower spectral analysis. To estimate the power-law ex-ponent � of the SCP, a fast Fourier transform was appliedto the MEG signal from each sensor in each trial (3 minlong) to compute its power spectrum. The power spec-trum was plotted in double-logarithmic scale (Fig. 2A).Because a power spectrum following P�f� � 1/f� can berewritten as log�P�f�� � �log�f�, the negative slope in thelog–log plot provides a convenient measure of the power-law exponent �. In line with previous studies (He et al.,2008, 2010), the SCP � was estimated in the range of0.005–5 Hz (power spectra were calculated on each triallasting 180 s; thus the lowest frequency visible was0.0056 Hz).
To estimate the power-law exponent � of �-oscillationamplitude fluctuations, we first extracted � oscillationsfrom continuous MEG signal in each trial using a third-order Butterworth filter between 6.7 and 13.3 Hz andcomputed its instantaneous amplitude envelope by ap-plying the Hilbert transform. A fast Fourier transform wasthen applied to the �-oscillation amplitude fluctuation tocreate a power spectrum for each sensor in each trial. The�-oscillation amplitude � was estimated from the log-logplot of power spectrum using the 0.1- to 1-Hz range (Fig.2B).
Following previously established methodology, we ap-plied detrended fluctuation analysis (DFA) on heartbeatdynamics (Goldberger et al., 2002; Hardstone et al.,2012). This computation was applied to the time variationin interbeat interval, measured as the interval in secondsbetween adjacent R peaks (Fig. 2C, left). DFA analysiswas conducted as follows. First, the interbeat interval timeseries from each trial was integrated, and the mean wassubtracted. We then estimated the local trend in nonover-lapping windows of equal length using a least-squares fitand determined the fluctuation as variance on the localtrend for a given window. Five different window lengthswere used: 4, 8, 16, 32, and 64. The log-log plot of meanfluctuation (F) against window length (l) constitutes theDFA plot (Fig. 2C, right), and its slope estimates the DFAexponent �, following the relation: F�l� � l�, or log�F�l�� ��log�l�. Theoretically, the power-law exponent � is relatedto the DFA exponent �, following � � 2� � 1 (Eke et al.,2002).
Interrelations between scale-free neural andheartbeat dynamics
To qualitatively assess the relationship between SCP �and �-oscillation amplitude � across sensors, we firstgenerated grand-average scalp topography for SCP �and �-amplitude � across subjects and trials (Fig. 2A,B,
Figure 2. Characterization of neural and physiological dynamics. A, Left, MEG signal power spectra from an example subject in eachtask condition (averaged across all sensors and trials within a condition). Middle, example MEG signal power spectrum from a singletrial in one subject. The red lines indicate the frequency range for extracting SCP power-law exponent �: 0.005–5 Hz. Right,grand-average topographic map of SCP � across the scalp. B, As in A, but for �-oscillation amplitude. � Oscillation was filtered inthe 6.7- to 13.3-Hz range, and its amplitude time series was extracted using the Hilbert transform. �-Amplitude � was extracted inthe 0.1- to 1-Hz range (red lines in the middle panel). C, For analysis on heartbeat dynamics, the interbeat interval was calculated asthe difference in time (s) between adjacent R-peaks in the ECG recording (left panel). The interbeat interval time series was subjectedto DFA to extract the DFA exponent �, which describes the power-law relationship between fluctuation magnitude and the length ofobservation in scale-free dynamics (right panel).
New Research 5 of 13
September/October 2016, 3(5) e0191-16.2016 eNeuro.org

right). No formal statistical test was performed for therelationship between SCP � and �-amplitude � across allsensors due to the difficulty in accurately accounting forthe degrees of freedom associated with the sensors.However, a scatterplot of SCP � and �-amplitude �across sensors is included for descriptive purposes (Fig.3A).
To investigate the relationship between SCP � and�-amplitude � across subjects, we first defined two clus-ters of sensors based on the topographic map of SCP �(Fig. 3C) and then averaged SCP � and �-amplitude �,respectively, across sensors within each cluster. Pear-son’s correlation was calculated between SCP � and�-amplitude � across subjects for each of the two clus-ters.
To assess the relationship between any two of our threescale-free parameters (SCP �, �-amplitude �, or ECG �)over time, we calculated Pearson’s correlation betweenthem across all 36 trials within each subject. Pearson’s rvalues were transformed into Fisher’s z-values, whichwere subjected to a one-sample t-test across subjects.Statistical significance was assessed by a cluster-based
nonparametric permutation test (Nichols and Holmes,2002; Maris and Oostenveld, 2007). To this end, we shuf-fled one variable across trials for 1,000 iterations. Foreach iteration, Pearson’s correlation between the twovariables was recomputed, and the r-value was trans-formed into Fisher’s z-value and submitted to a one-sample t-test across subjects as with the original data.Clusters were defined for both the original and shuffleddata as contiguous groups of sensors with p-values lessthan 0.05 and t-values of the same sign. Summing thet-values created a summary measure of each cluster. Tobuild the null distribution, the absolute value of thesummed t-statistic of the largest magnitude was ex-tracted from each iteration. Finally, the absolute magni-tude of the summed t-statistic in each cluster from theoriginal data was compared to the null distribution. Acluster survived cluster-based correction if 2.5% or fewerof observations in the null distribution surpassed the ab-solute value of the cluster’s summed t-statistic (corre-sponding to p � 0.05 in a two-tailed test). Correlationbetween MEG signal power and � was tested similarly.
Figure 3. Interrelations between scale-free neural and physiological dynamics. A, Scatterplot of SCP � against �-amplitude � acrossall MEG sensors (averaged across subjects and stimulus conditions). The inset shows the grand-average topographical plots of SCP� and �-amplitude �, reproduced from Fig. 2. B, Top, nested-frequency analysis between SCP phase and � amplitude. Group-average MI z-score topography plot is shown (middle), along with the phase-amplitude histogram for the two dominant clusters (seeinsets). Bottom, scatterplot between empirically measured SCP � and simulated �-oscillation amplitude � across all sensors. C, Left,scatterplot across subjects between SCP � and �-amplitude � in a posterior sensor cluster (see inset). Right, scatterplot acrosssubjects between SCP � and �-amplitude � in an anterior sensor cluster (see inset). D, Correlation between SCP � and SCP poweracross trials within an individual. Pearson correlation values were Fisher’s z transformed and subjected to a group-level one-samplet-test. t Values are plotted in the topography plot, with a single cluster encompassing all sensors surviving cluster-based correction.The group-level mean and SEM of Fisher z values (averaged across all sensors) are shown in the bar graph to the right (p � 0.001,one-sample t-test across subjects). E, Similar to D, but for within-subject, across-trial correlation between SCP � and ECG �. Twoclusters of sensors survived cluster-based correction. The group-level mean and SEM of Fisher z values (averaged across allsignificant sensors) are shown in the bar graph to the right (p � 0.001, one-sample t-test across subjects).
New Research 6 of 13
September/October 2016, 3(5) e0191-16.2016 eNeuro.org
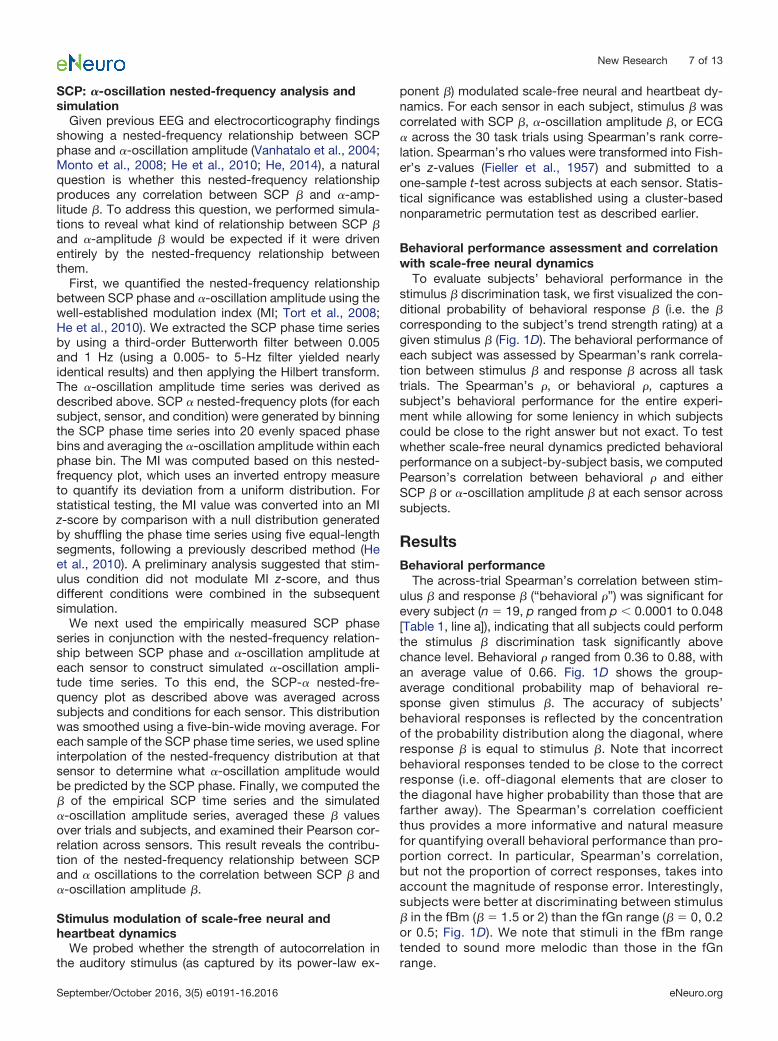
SCP: �-oscillation nested-frequency analysis andsimulation
Given previous EEG and electrocorticography findingsshowing a nested-frequency relationship between SCPphase and �-oscillation amplitude (Vanhatalo et al., 2004;Monto et al., 2008; He et al., 2010; He, 2014), a naturalquestion is whether this nested-frequency relationshipproduces any correlation between SCP � and �-amp-litude �. To address this question, we performed simula-tions to reveal what kind of relationship between SCP �and �-amplitude � would be expected if it were drivenentirely by the nested-frequency relationship betweenthem.
First, we quantified the nested-frequency relationshipbetween SCP phase and �-oscillation amplitude using thewell-established modulation index (MI; Tort et al., 2008;He et al., 2010). We extracted the SCP phase time seriesby using a third-order Butterworth filter between 0.005and 1 Hz (using a 0.005- to 5-Hz filter yielded nearlyidentical results) and then applying the Hilbert transform.The �-oscillation amplitude time series was derived asdescribed above. SCP � nested-frequency plots (for eachsubject, sensor, and condition) were generated by binningthe SCP phase time series into 20 evenly spaced phasebins and averaging the �-oscillation amplitude within eachphase bin. The MI was computed based on this nested-frequency plot, which uses an inverted entropy measureto quantify its deviation from a uniform distribution. Forstatistical testing, the MI value was converted into an MIz-score by comparison with a null distribution generatedby shuffling the phase time series using five equal-lengthsegments, following a previously described method (Heet al., 2010). A preliminary analysis suggested that stim-ulus condition did not modulate MI z-score, and thusdifferent conditions were combined in the subsequentsimulation.
We next used the empirically measured SCP phaseseries in conjunction with the nested-frequency relation-ship between SCP phase and �-oscillation amplitude ateach sensor to construct simulated �-oscillation ampli-tude time series. To this end, the SCP-� nested-fre-quency plot as described above was averaged acrosssubjects and conditions for each sensor. This distributionwas smoothed using a five-bin-wide moving average. Foreach sample of the SCP phase time series, we used splineinterpolation of the nested-frequency distribution at thatsensor to determine what �-oscillation amplitude wouldbe predicted by the SCP phase. Finally, we computed the� of the empirical SCP time series and the simulated�-oscillation amplitude series, averaged these � valuesover trials and subjects, and examined their Pearson cor-relation across sensors. This result reveals the contribu-tion of the nested-frequency relationship between SCPand � oscillations to the correlation between SCP � and�-oscillation amplitude �.
Stimulus modulation of scale-free neural andheartbeat dynamics
We probed whether the strength of autocorrelation inthe auditory stimulus (as captured by its power-law ex-
ponent �) modulated scale-free neural and heartbeat dy-namics. For each sensor in each subject, stimulus � wascorrelated with SCP �, �-oscillation amplitude �, or ECG� across the 30 task trials using Spearman’s rank corre-lation. Spearman’s rho values were transformed into Fish-er’s z-values (Fieller et al., 1957) and submitted to aone-sample t-test across subjects at each sensor. Statis-tical significance was established using a cluster-basednonparametric permutation test as described earlier.
Behavioral performance assessment and correlationwith scale-free neural dynamics
To evaluate subjects’ behavioral performance in thestimulus � discrimination task, we first visualized the con-ditional probability of behavioral response � (i.e. the �corresponding to the subject’s trend strength rating) at agiven stimulus � (Fig. 1D). The behavioral performance ofeach subject was assessed by Spearman’s rank correla-tion between stimulus � and response � across all tasktrials. The Spearman’s , or behavioral , captures asubject’s behavioral performance for the entire experi-ment while allowing for some leniency in which subjectscould be close to the right answer but not exact. To testwhether scale-free neural dynamics predicted behavioralperformance on a subject-by-subject basis, we computedPearson’s correlation between behavioral and eitherSCP � or �-oscillation amplitude � at each sensor acrosssubjects.
ResultsBehavioral performance
The across-trial Spearman’s correlation between stim-ulus � and response � (“behavioral ”) was significant forevery subject (n � 19, p ranged from p � 0.0001 to 0.048[Table 1, line a]), indicating that all subjects could performthe stimulus � discrimination task significantly abovechance level. Behavioral ranged from 0.36 to 0.88, withan average value of 0.66. Fig. 1D shows the group-average conditional probability map of behavioral re-sponse given stimulus �. The accuracy of subjects’behavioral responses is reflected by the concentrationof the probability distribution along the diagonal, whereresponse � is equal to stimulus �. Note that incorrectbehavioral responses tended to be close to the correctresponse (i.e. off-diagonal elements that are closer tothe diagonal have higher probability than those that arefarther away). The Spearman’s correlation coefficientthus provides a more informative and natural measurefor quantifying overall behavioral performance than pro-portion correct. In particular, Spearman’s correlation,but not the proportion of correct responses, takes intoaccount the magnitude of response error. Interestingly,subjects were better at discriminating between stimulus� in the fBm (� � 1.5 or 2) than the fGn range (� � 0, 0.2or 0.5; Fig. 1D). We note that stimuli in the fBm rangetended to sound more melodic than those in the fGnrange.
New Research 7 of 13
September/October 2016, 3(5) e0191-16.2016 eNeuro.org
Scale-free dynamics in neural activity and heart ratevariability
Consistent with earlier reports (Dehghani et al., 2010;He, 2014), the power spectrum of MEG signals followedpower-law scaling, with peaks at discrete frequenciescorresponding to various brain oscillations (see Fig. 2A,left, for example power spectra from a single subject). Weextracted power-law exponent � for SCP from the 0.005-to 5-Hz frequency range (Fig. 2A, middle). The grandaverage (across stimulus conditions and subjects) topo-graphical distribution of SCP � across MEG sensors isshown in Fig. 2A (right). SCP � ranged from 0.87 to 1.12across sensors (mean 0.97), and exhibited an anterior-posterior gradient with frontal sensors displaying higher �,and hence longer temporal autocorrelation in the SCP.This finding is consistent with previous MEG (Dehghaniet al., 2010) and fMRI (He, 2011) observations.
We extracted instantaneous amplitude fluctuations of �oscillations (filtered in the 6.7- to 13.3-Hz range), andcomputed its power spectrum (see Fig. 2B, left, for resultfrom an example subject). In line with previous reports(Linkenkaer-Hansen et al., 2001), �-oscillation amplitudefluctuations exhibit power-law scaling in the power spec-trum. We extracted the power-law exponent � of � am-plitude in the range of 0.1–1 Hz (Fig. 2B, middle).�-Amplitude � ranged from 0.32 to 0.61 across sensors(mean 0.51) and displayed an anterior-posterior gradientopposite to that of SCP, such that posterior sensors hadhigher �, and accordingly, stronger autocorrelation (Fig.2B, right).
Finally, following established procedures for analyzingheartbeat dynamics (Goldberger et al., 2002), we defined
R-peaks from ECG recordings and constructed an inter-beat interval time series, which was subjected to DFAanalysis to extract the DFA exponent � (Fig. 2C). Theo-retically, the DFA exponent � is directly related to thepower-law exponent � (see Materials and Methods), bothof which capture the strength of autocorrelation in a timeseries, one using a time-domain approach (DFA exponent�), the other a frequency-domain approach (power-lawexponent �). Across 17 subjects with simultaneous ECG-MEG recordings, ECG � ranged from 0.57 to 1.2, with amean of 0.82 across subjects, consistent with previousreports (Goldberger et al., 2002).
Anticorrelation between SCP and �-oscillationamplitude power-law exponents
We next explored the relationship between scale-freedynamics in SCP and �-oscillation amplitude fluctuationsacross the scalp and subjects. Because stimulus condi-tion minimally modulated power-law exponent of SCP or�-oscillation amplitude (see below), for this analysis, wepooled data across all conditions (including five stimulus� levels and resting condition).
The scalp topography of SCP � and �-oscillation amplitude� (Fig. 2A,B, right) display opposite anterior-posterior gradients,indicating that as the strength of autocorrelation in SCP in-creases, the strength of �-oscillation amplitude fluctuationstends to decrease. To qualitatively assess this relationship, weplotted the two measures, each averaged over 19 subjects,against each other across all sensors (Fig. 3A). This revealed anegative relationship between SCP � and �-oscillation ampli-tude � across MEG sensors.
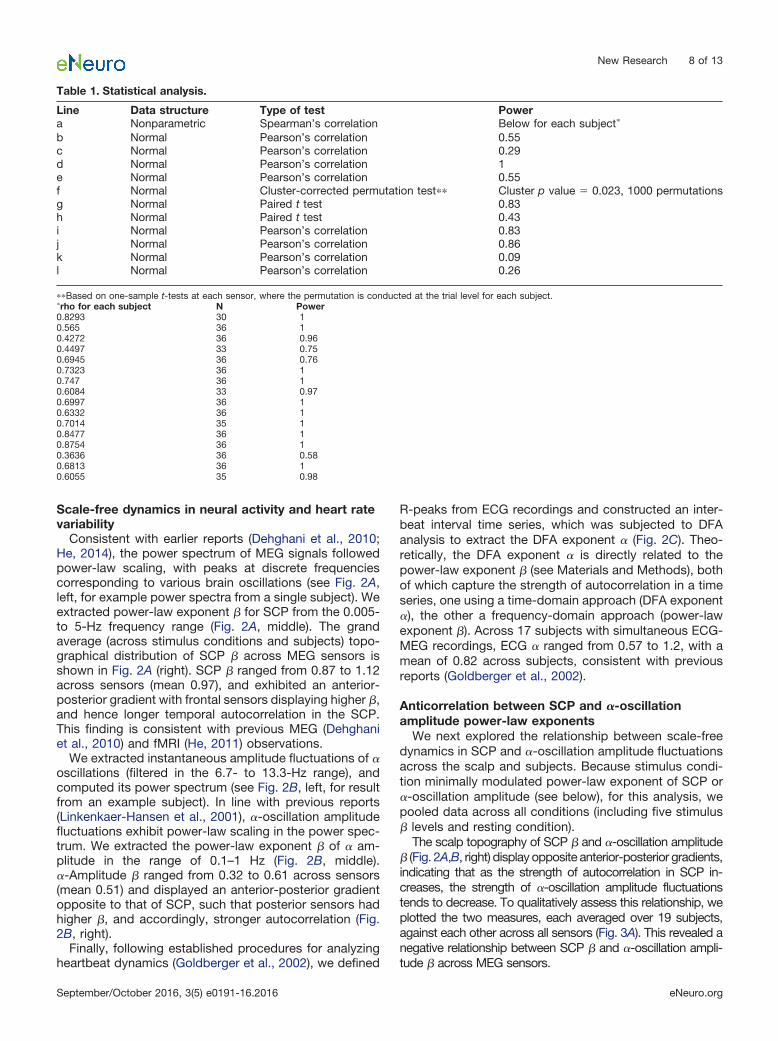
Table 1. Statistical analysis.
Line Data structure Type of test Powera Nonparametric Spearman’s correlation Below for each subject�
b Normal Pearson’s correlation 0.55c Normal Pearson’s correlation 0.29d Normal Pearson’s correlation 1e Normal Pearson’s correlation 0.55f Normal Cluster-corrected permutation test�� Cluster p value � 0.023, 1000 permutationsg Normal Paired t test 0.83h Normal Paired t test 0.43i Normal Pearson’s correlation 0.83j Normal Pearson’s correlation 0.86k Normal Pearson’s correlation 0.09l Normal Pearson’s correlation 0.26
��Based on one-sample t-tests at each sensor, where the permutation is conducted at the trial level for each subject.�rho for each subject N Power0.8293 30 10.565 36 10.4272 36 0.960.4497 33 0.750.6945 36 0.760.7323 36 10.747 36 10.6084 33 0.970.6997 36 10.6332 36 10.7014 35 10.8477 36 10.8754 36 10.3636 36 0.580.6813 36 10.6055 35 0.98
New Research 8 of 13
September/October 2016, 3(5) e0191-16.2016 eNeuro.org

We then assessed whether there might also be ananticorrelation between SCP � and �-amplitude � acrosssubjects. To this end, we first defined two clusters ofsensors based on the scalp topography of SCP �, distrib-uted over frontal and posterior regions, with relatively highand low �, respectively. We then assessed across-subjectcorrelation between SCP � and �-oscillation amplitude �for each cluster of sensors. In the posterior cluster, weobserved a significant negative correlation between SCP� and �-amplitude � across subjects (Fig. 3C; r � –0.48,p � 0.037 [Table 1, line b], n � 19). In the frontal cluster,there was a negative trend that was not significant (Fig.3C, inset; r � –0.34, p � 0.16 [Table 1, line c]). Couldthe significant anticorrelation between SCP � and �-oscillation amplitude � in the posterior cluster acrosssubjects be driven by a relation between their respectivepower? Two pieces of evidence suggest that this is notthe case. First, SCP power and �-oscillation power werefound to correlate positively across subjects (r � 0.91, p� 8.5 � 10–8 [Table 1, line d]; but note that this finding initself could be due to measurement variation across sub-jects). Second, a partial correlation analysis revealed thatafter controlling for the effects of SCP and �-oscillationpower, the anticorrelation between SCP � and �-ampli-tude � across subjects in the posterior sensor cluster wasunchanged (r � –0.48, p � 0.05 [Table 1, line e]).
The above results reveal an intriguing negative relation-ship between SCP � and �-amplitude � across the scalpand subjects, such that stronger autocorrelation in theSCP is accompanied by weaker autocorrelation in theamplitude fluctuations of � oscillations. In light of previousobservations of a nested-frequency relationship betweenSCP phase and �-oscillation amplitude (Vanhatalo et al.,2004; He, 2014), these findings raise a natural question: isthe anticorrelation between SCP � and �-amplitude �driven by the nested-frequency relationship betweenthem? To test this hypothesis, we quantified the nested-frequency pattern between SCP phase and �-oscillationamplitude in each MEG sensor (Fig. 3B, top) and simu-lated �-oscillation amplitude time series for each sensor ineach subject, based on the sensor-specific nested-frequency pattern and the empirically measured SCPphase time series. We then computed the power-lawexponent � of the simulated �-oscillation amplitude timeseries and plotted it against the measured SCP � acrossall sensors (Fig. 3B, bottom). This simulation reveals apositive relationship between SCP � and �-amplitude �,suggesting that the negative relationship observed in theempirical data cannot be explained by the nested-frequency relationship between SCP and � oscillations.
Finally, we investigated whether the amount of power inthe SCP or � range was related to their respective �across time within an individual (see Methods). We founda robust positive correlation between SCP power and �:after cluster-based correction for multiple comparisons,all MEG sensors across the entire scalp demonstrated asignificant positive correlation (Fig. 3D). By contrast,�-oscillation power had no significant correlation with itsamplitude � after cluster-based correction. This result isconsistent with previous findings showing that SCP �
changes by modulating the power in the lowest frequencyranges, thereby causing a positive correlation between itspower and � (He et al., 2010).
Relationship between scale-free neural andphysiological dynamics
We further investigated whether the strength of auto-correlation in scale-free neural and heartbeat dynamicscomodulated across time within an individual. To this end,we computed correlations between SCP � and the DFAexponent � of heartbeat dynamics measured by ECG.This analysis revealed two significant clusters, one overthe left central cortex, and the other over the right centralcortex extending into frontal areas (Fig. 3E). No significantcorrelation was found between �-amplitude � and ECG �after correction for multiple comparisons.
Stimulus condition modulates scale-free dynamics in�-oscillation amplitude
Does the strength of autocorrelation in the stimulus se-quence (“stimulus �”) modulate the strength of autocorrela-tion within scale-free neural or physiological dynamics? Toanswer this question, we computed Spearman’s rank cor-relation between stimulus � and the autocorrelation param-eter from neural or heartbeat dynamics (respectively, SCP �,�-oscillation amplitude �, and ECG �) across all trials duringthe auditory task (30 trials in total) for each subject.
We found that as stimulus � increased, �-amplitude �progressively decreased in a posterior sensor clusteroverlying visual cortex at a corrected p � 0.023 (Table 1,line f; Fig. 4A, top). For the sensors within this cluster, themean �-amplitude � across subjects in each condition isplotted in Fig. 4A (bottom). Interestingly, white noise input(� � 0) enhanced �-amplitude � compared to the rest(p � 0.0065 [Table 1, line g], paired t-test across sub-jects), and there was a trend effect of stimuli with strongautocorrelation (� � 2) reducing �-amplitude � comparedto the rest (p � 0.0774 [Table 1, line h]). A control analysisindicated that stimulus � did not significantly influenceMEG signal power in the � range. No significant correla-tion between stimulus � and SCP � was found, nor be-tween stimulus � and ECG �, suggesting that the strengthof autocorrelation within SCP and heartbeat dynamicswas robust to the range of scale-free stimuli used in thisexperiment.
Scale-free neural dynamics predicted behavioralperformance
Finally, we investigated whether scale-free neural orphysiological dynamics predicted a subject’s behavioralperformance in the auditory task. Behavioral performancewas assessed by Spearman’s correlation between stim-ulus � and response � as described above (behavioral ).We found that behavioral performance correlated nega-tively with SCP � (averaged across all conditions) in agroup of sensors distributed over frontocentral areas (Fig.4B; r � –0.62, p � 0.0044 [Table 1, line i]), and positivelywith �-amplitude � in a group of sensors over left fronto-temporal cortices (Fig. 4C; r � 0.64, p � 0.0030 [Table 1,line j]). These results suggest that higher autocorrelationwithin �-oscillation amplitude fluctuations, and lower au-
New Research 9 of 13
September/October 2016, 3(5) e0191-16.2016 eNeuro.org

tocorrelation within the SCP, predict better discriminationperformance on scale-free auditory stimuli. Importantly,neither SCP power nor �-oscillation power correlated withbehavioral performance, suggesting that signal powerwas not a mediating factor between scale-free neuraldynamics and behavioral performance. A control analysisfurther suggested that the above effects are regionallyspecific: �-amplitude � in the frontocentral area (Fig. 4B,left) did not significantly correlate with behavioral perfor-mance (r � 0.15, p � 0.55 [Table 1, line k]), nor did SCP� in the left frontotemporal area (Fig. 4C, left; r � –0.32, p� 0.19 [Table 1, line l]).
DiscussionIn this study, we investigated the interrelations among
scale-free dynamics in the SCP, �-oscillation amplitudefluctuations, and heartbeat dynamics across MEG sen-sors and subjects and over time within an individual. Wefurther explored their modulation by scale-free dynamicstimuli and tested whether an individual’s scale-free neu-ral dynamics predicted the ability to tell scale-free stimuliapart based on autocorrelation property. Below, we sum-marize our findings in turn and discuss their implications.
Interrelations among scale-free neural andphysiological dynamics
Across the scalp, a qualitative pattern emerged suchthat sensors exhibiting stronger autocorrelation (hence,larger power-law exponent �) in the SCP tended to haveweaker autocorrelation in the �-oscillation amplitude fluc-tuations. In addition, SCP � and �-amplitude � wereanticorrelated across subjects within a large posteriorsensor cluster. This anticorrelation could not be explained
by the nested-frequency coupling between SCP and �oscillations, as a control analysis based on simulationsuggested that the phase-amplitude coupling betweenSCP and � oscillations contributes to a positive correla-tion between their power-law exponents instead. To-gether, these results suggest that not only do scale-freedynamics exist within both arrhythmic brain activity andamplitude fluctuations of brain oscillations, but these dif-ferent scale-free neural dynamics are related and follow asystematic antagonistic pattern. Functionally, this anticor-relation may be important for preventing excessive long-range temporal correlation in the brain, such that strongautocorrelation in one type of neural signals impedes thegeneration of strong autocorrelation in another. Becauseproper brain functioning requires a balance of sufficientorder and flexibility, such anticorrelation may be evi-dence of a negative feedback mechanism whereby self-organized brain activity is regulated across levels to avoidexcessive regularity or overly random fluctuation. Thecurrent study does not address the mechanism giving riseto the anticorrelation between SCP � and �-amplitude �across subjects. In particular, it remains unknown whetherthese two measures have a common mechanism or dif-ferent mechanisms under common influence, or alterna-tively, whether one measure influences the other directlyor indirectly. Nonetheless, developmental and geneticcontributions that have been shown to influence �-amplitude � (Linkenkaer-Hansen et al., 2007; Smit et al.,2011) indicate possible starting points for future investi-gations to probe.
We further observed that SCP power positively corre-lated with SCP � across time within an individual, indicat-
Figure 4. Stimulus modulation of scale-free neural dynamics and prediction of behavioral performance. A, Spearman rank correlationwas calculated between stimulus � and �-amplitude � across the 30 task trials for each subject, and the group average is plotted forall sensors (top left panel). A posterior sensor cluster survived cluster-based correction at p � 0.05 (top right panel). For this significantsensor cluster, �-amplitude � averaged across sensors was plotted for each stimulus � level and rest condition (bottom panel), whichshows the mean and SEM across subjects. B, Left, Pearson’s correlation value between behavioral performance (measured asbehavioral ) and SCP � (averaged across all conditions) across subjects, thresholded at a p � 0.05 level. Nonsignificant sensors areshown as a uniform green background. Right, SCP � averaged across significant sensors is plotted against behavioral for allsubjects. C, Same as B, but for the correlation between �-amplitude � and behavioral performance.
New Research 10 of 13
September/October 2016, 3(5) e0191-16.2016 eNeuro.org
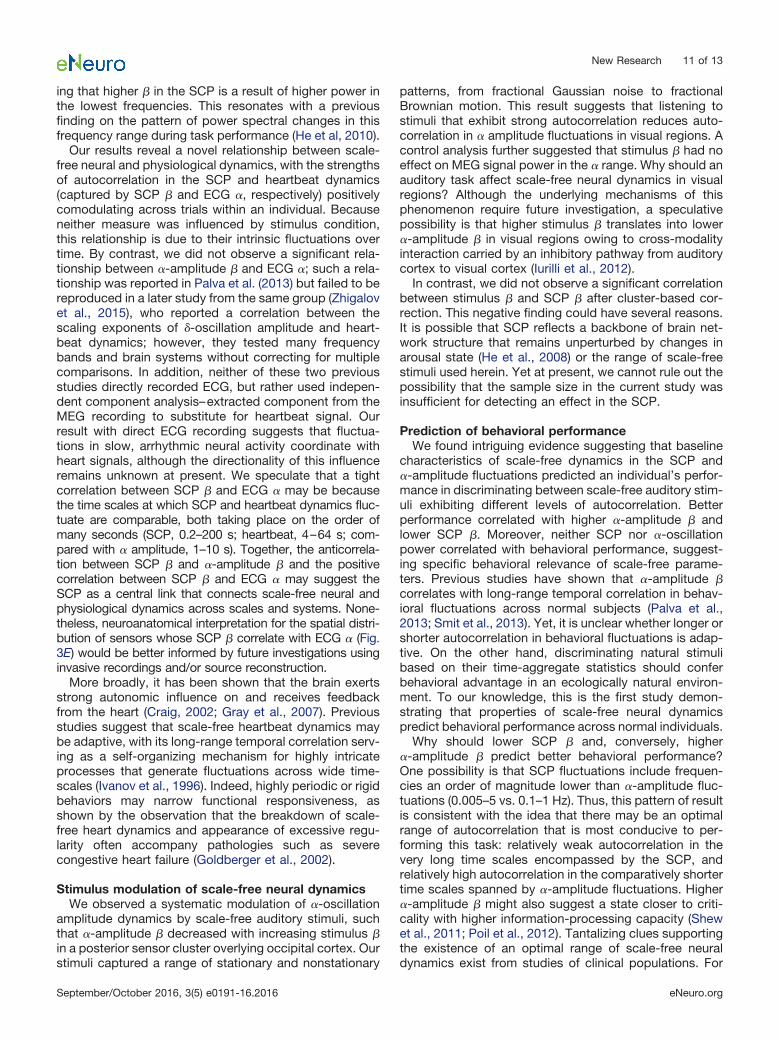
ing that higher � in the SCP is a result of higher power inthe lowest frequencies. This resonates with a previousfinding on the pattern of power spectral changes in thisfrequency range during task performance (He et al, 2010).
Our results reveal a novel relationship between scale-free neural and physiological dynamics, with the strengthsof autocorrelation in the SCP and heartbeat dynamics(captured by SCP � and ECG �, respectively) positivelycomodulating across trials within an individual. Becauseneither measure was influenced by stimulus condition,this relationship is due to their intrinsic fluctuations overtime. By contrast, we did not observe a significant rela-tionship between �-amplitude � and ECG �; such a rela-tionship was reported in Palva et al. (2013) but failed to bereproduced in a later study from the same group (Zhigalovet al., 2015), who reported a correlation between thescaling exponents of �-oscillation amplitude and heart-beat dynamics; however, they tested many frequencybands and brain systems without correcting for multiplecomparisons. In addition, neither of these two previousstudies directly recorded ECG, but rather used indepen-dent component analysis–extracted component from theMEG recording to substitute for heartbeat signal. Ourresult with direct ECG recording suggests that fluctua-tions in slow, arrhythmic neural activity coordinate withheart signals, although the directionality of this influenceremains unknown at present. We speculate that a tightcorrelation between SCP � and ECG � may be becausethe time scales at which SCP and heartbeat dynamics fluc-tuate are comparable, both taking place on the order ofmany seconds (SCP, 0.2–200 s; heartbeat, 4–64 s; com-pared with � amplitude, 1–10 s). Together, the anticorrela-tion between SCP � and �-amplitude � and the positivecorrelation between SCP � and ECG � may suggest theSCP as a central link that connects scale-free neural andphysiological dynamics across scales and systems. None-theless, neuroanatomical interpretation for the spatial distri-bution of sensors whose SCP � correlate with ECG � (Fig.3E) would be better informed by future investigations usinginvasive recordings and/or source reconstruction.
More broadly, it has been shown that the brain exertsstrong autonomic influence on and receives feedbackfrom the heart (Craig, 2002; Gray et al., 2007). Previousstudies suggest that scale-free heartbeat dynamics maybe adaptive, with its long-range temporal correlation serv-ing as a self-organizing mechanism for highly intricateprocesses that generate fluctuations across wide time-scales (Ivanov et al., 1996). Indeed, highly periodic or rigidbehaviors may narrow functional responsiveness, asshown by the observation that the breakdown of scale-free heart dynamics and appearance of excessive regu-larity often accompany pathologies such as severecongestive heart failure (Goldberger et al., 2002).
Stimulus modulation of scale-free neural dynamicsWe observed a systematic modulation of �-oscillation
amplitude dynamics by scale-free auditory stimuli, suchthat �-amplitude � decreased with increasing stimulus �in a posterior sensor cluster overlying occipital cortex. Ourstimuli captured a range of stationary and nonstationary
patterns, from fractional Gaussian noise to fractionalBrownian motion. This result suggests that listening tostimuli that exhibit strong autocorrelation reduces auto-correlation in � amplitude fluctuations in visual regions. Acontrol analysis further suggested that stimulus � had noeffect on MEG signal power in the � range. Why should anauditory task affect scale-free neural dynamics in visualregions? Although the underlying mechanisms of thisphenomenon require future investigation, a speculativepossibility is that higher stimulus � translates into lower�-amplitude � in visual regions owing to cross-modalityinteraction carried by an inhibitory pathway from auditorycortex to visual cortex (Iurilli et al., 2012).
In contrast, we did not observe a significant correlationbetween stimulus � and SCP � after cluster-based cor-rection. This negative finding could have several reasons.It is possible that SCP reflects a backbone of brain net-work structure that remains unperturbed by changes inarousal state (He et al., 2008) or the range of scale-freestimuli used herein. Yet at present, we cannot rule out thepossibility that the sample size in the current study wasinsufficient for detecting an effect in the SCP.
Prediction of behavioral performanceWe found intriguing evidence suggesting that baseline
characteristics of scale-free dynamics in the SCP and�-amplitude fluctuations predicted an individual’s perfor-mance in discriminating between scale-free auditory stim-uli exhibiting different levels of autocorrelation. Betterperformance correlated with higher �-amplitude � andlower SCP �. Moreover, neither SCP nor �-oscillationpower correlated with behavioral performance, suggest-ing specific behavioral relevance of scale-free parame-ters. Previous studies have shown that �-amplitude �correlates with long-range temporal correlation in behav-ioral fluctuations across normal subjects (Palva et al.,2013; Smit et al., 2013). Yet, it is unclear whether longer orshorter autocorrelation in behavioral fluctuations is adap-tive. On the other hand, discriminating natural stimulibased on their time-aggregate statistics should conferbehavioral advantage in an ecologically natural environ-ment. To our knowledge, this is the first study demon-strating that properties of scale-free neural dynamicspredict behavioral performance across normal individuals.
Why should lower SCP � and, conversely, higher�-amplitude � predict better behavioral performance?One possibility is that SCP fluctuations include frequen-cies an order of magnitude lower than �-amplitude fluc-tuations (0.005–5 vs. 0.1–1 Hz). Thus, this pattern of resultis consistent with the idea that there may be an optimalrange of autocorrelation that is most conducive to per-forming this task: relatively weak autocorrelation in thevery long time scales encompassed by the SCP, andrelatively high autocorrelation in the comparatively shortertime scales spanned by �-amplitude fluctuations. Higher�-amplitude � might also suggest a state closer to criti-cality with higher information-processing capacity (Shewet al., 2011; Poil et al., 2012). Tantalizing clues supportingthe existence of an optimal range of scale-free neuraldynamics exist from studies of clinical populations. For
New Research 11 of 13
September/October 2016, 3(5) e0191-16.2016 eNeuro.org

example, breakdown of long-range temporal correlationin - and �-oscillation amplitude fluctuations has beenobserved in depression (Linkenkaer-Hansen et al., 2005),Alzheimer’s disease (Montez et al., 2009), and schizo-phrenia (Nikulin et al., 2012). On the other hand, abnor-mally high long-range temporal correlation in �-bandamplitude fluctuations is found in seizure-onset areas(Monto et al., 2007).
Finally, in our experiment, the auditory stimuli wereconstructed such that the scale-free statistic, embodiedin the power-law exponent �, is the only difference be-tween categories of auditory tone sequences. All otherstatistics, including tone duration, pitch range, sequencelength, and higher-order statistics (which are random),were identical across stimulus categories (� � [0, 0.2, 0.5,1.5, 2]). Moreover, behavioral discrimination was carriedout on power-law exponent �, not the specific sequencepresented; this was ensured by presenting six uniquesequences at each � level and asking subjects to makediscrimination about � only. Hence, in our task, subjects’ability to discriminate different auditory tone sequenceswas specifically related to their ability to process thescale-free statistic of the stimuli, and our findings estab-lish the role of scale-free brain activity in processingscale-free statistics of naturalistic stimuli. On the other hand,our results do not imply that the function of scale-free brainactivity is specific to the processing of scale-free or naturalstimuli. It is possible that similar correlations may be ob-served for tasks that do not explicitly require the evaluationof scale-free stimulus statistics. Future studies investigatingperformance in such tasks will delineate the functional spec-ificity (or generality) of scale-free neural activity.
In summary, we observed novel relationships amongscale-free dynamics in distinct components of neuraland physiological activity, including the SCP, �-os-cillation amplitude fluctuations, and heartbeat dynam-ics. We further demonstrate that scale-free neuraldynamics can be systematically perturbed by scale-free dynamical stimuli that capture second-order sta-tistics (i.e. autocorrelation or power spectrum) of thenatural environment. Moreover, the baseline character-istics of scale-free neural dynamics in an individualpredict their ability to discriminate scale-free dynamicalstimuli based on their autocorrelation property. Theseresults shed light on the complex interrelations amongscale-free neural and physiological dynamics at differ-ent levels and how they may contribute to adaptivebehavior in the natural environment.
ReferencesBrainard DH (1997) The psychophysics toolbox. Spat Vis 10:433–
436. MedlineCraig AD (2002) How do you feel? Interoception: the sense of the
physiological condition of the body. Nat Rev Neurosci 3:655–666.CrossRef
De Coensel B, Botterdooren D, De Muer T (2003) 1/f noise in ruraland urban soundscapes. Acta Acustica 89:287–295.
Dehghani N, Bedard C, Cash SS, Halgren E, Destexhe A (2010)Comparative power spectral analysis of simultaneous electroen-cephalographic and magnetoencephalographic recordings in hu-mans suggests non-resistive extracellular media: EEG and MEG
power spectra. J Comput Neurosci Advance online publication.Retrieved October 13, 2016. CrossRef.
Dong DW, Atick JJ (1995) Statistics of natural time-varying images.Network Comput Neural Sys 6:345–358. CrossRef
Eke A, Herman P, Kocsis L, Kozak LR (2002) Fractal characterizationof complexity in temporal physiological signals. Physiol Meas23:R1–38. Medline
Field DJ (1987) Relations between the statistics of natural imagesand the response properties of cortical cells. J Opt Soc Am A4:2379–2394. CrossRef
Fieller EC, Hartley HO, Pearson ES (1957) Tests for rank correlationcoefficients. I. Biometrika 44:470–481. CrossRef
Gilden DL (2001) Cognitive emissions of 1/f noise. Psychol Rev108:33–56. Medline
Goldberger AL, Amaral LA, Hausdorff JM, Ivanov P, Peng CK, Stan-ley HE (2002) Fractal dynamics in physiology: alterations withdisease and aging. Proc Natl Acad Sci U S A 99 Suppl 1:2466–2472. CrossRef Medline
Gray MA, Taggart P, Sutton PM, Groves D, Holdright DR, BradburyD, Brull D, Critchley HD (2007) A cortical potential reflecting car-diac function. Proc Natl Acad Sci U S A 104:6818–6823. CrossRefMedline
Hardstone R, Poil SS, Schiavone G, Jansen R, Nikulin VV, Mans-velder HD, Linkenkaer-Hansen K (2012) Detrended fluctuationanalysis: a scale-free view on neuronal oscillations. Front Physiol3:450. CrossRef
He BJ (2011) Scale-free properties of the functional magnetic reso-nance imaging signal during rest and task. J Neurosci 31:13786–13795. CrossRef Medline
He BJ (2014) Scale-free brain activity: past, present, and future.Trends Cogn Sci 18:480–487. CrossRef Medline
He BJ, Raichle ME (2009) The fMRI signal, slow cortical potential andconsciousness. Trends Cogn Sci 13:302–309. CrossRef Medline
He BJ, Snyder AZ, Zempel JM, Smyth MD, Raichle ME (2008)Electrophysiological correlates of the brain’s intrinsic large-scalefunctional architecture. Proc Natl Acad Sci U S A 105:16039–16044. CrossRef Medline
He BJ, Zempel JM, Snyder AZ, Raichle ME (2010) The temporalstructures and functional significance of scale-free brain activity.Neuron 66:353–369. CrossRef Medline
Helgason H, Pipiras V, Abry P (2011) Fast and exact synthesis ofstationary multivariate Gaussian time series using circulant em-bedding. Signal Processing 91(5),1123–1133. CrossRef
Iurilli G, Ghezzi D, Olcese U, Lassi G, Nazzaro C, Tonini R, Tucci V,Benfenati F, Medini P (2012) Sound-driven synaptic inhibition inprimary visual cortex. Neuron 73:814–828. CrossRef Medline
Ivanov PC, Rosenblum MG, Peng CK, Mietus J, Havlin S, Stanley HE,Goldberger AL (1996) Scaling behaviour of heartbeat intervalsobtained by wavelet-based time-series analysis. Nature 383:323–327. CrossRef
Kahn I, Knoblich U, Desai M, Bernstein J, Graybiel AM, Boyden ES,Buckner RL, Moore CI (2013) Optogenetic drive of neocorticalpyramidal neurons generates fMRI signals that are correlated withspiking activity. Brain Res 1511:33–45.
Linkenkaer-Hansen K, Monto S, Rytsälä H, Suominen K, Isometsä E,Kähkönen S (2005) Breakdown of long-range temporal correla-tions in theta oscillations in patients with major depressive disor-der. J Neurosci 25(44), 10131–10137. CrossRef Medline
Linkenkaer-Hansen K, Nikouline VV, Palva JM, Ilmoniemi RJ (2001)Long-range temporal correlations and scaling behavior in humanbrain oscillations. J Neurosci 21:1370–1377. Medline
Linkenkaer-Hansen K, Nikulin VV, Palva JM, Kaila K, Ilmoniemi RJ(2004) Stimulus-induced change in long-range temporal correla-tions and scaling behaviour of sensorimotor oscillations. Eur JNeurosci 19:203–211. CrossRef
Linkenkaer-Hansen K, Smit DJ, Barkil A, van Beijsterveldt TE, Brus-saard AB, Boomsma DI, van Ooyen A, de Geus EJ (2007) Geneticcontributions to long-range temporal correlations in ongoing os-cillations. J Neurosci 27:13882–13889. CrossRef Medline
New Research 12 of 13
September/October 2016, 3(5) e0191-16.2016 eNeuro.org

Mandelbrot, BB (1999). Multifractals and 1/f noise: wild self-affinity inphysics. New York: Springer.
Maris E, Oostenveld R (2007) Nonparametric statistical testing ofEEG- and MEG-data. J Neurosci Methods 164:177–190. CrossRefMedline
Montez T, Poil SS, Jones BF, Manshanden I, Verbunt JP, van DijkBW, Brussaard AB, van Ooyen A, Stam CJ, Scheltens P, et al.(2009) Altered temporal correlations in parietal alpha and prefrontaltheta oscillations in early-stage Alzheimer disease. Proc Natl AcadSci U S A 106:1614–1619. CrossRef
Monto S, Palva S, Voipio J, Palva JM (2008) Very slow EEG fluctuationspredict the dynamics of stimulus detection and oscillation amplitudes inhumans. J Neurosci 28:8268–8272. CrossRef Medline
Monto S, Vanhatalo S, Holmes MD, Palva JM (2007) Epileptogenicneocortical networks are revealed by abnormal temporal dynamicsin seizure-free subdural EEG. Cereb Cortex 17:1386–1393. Cross-Ref Medline
Nichols TE, Holmes AP (2002) Nonparametric permutation tests forfunctional neuroimaging: a primer with examples. Hum BrainMapp 15:1–25. Medline
Nikulin VV, Jönsson EG, Brismar T (2012) Attenuation of long-rangetemporal correlations in the amplitude dynamics of alpha and betaneuronal oscillations in patients with schizophrenia. Neuroimage61:162–169. CrossRef Medline
Oostenveld R, Fries P, Maris E, Schoffelen JM (2011) FieldTrip: opensource software for advanced analysis of MEG, EEG, and invasiveelectrophysiological data. Comput Intell Neurosci 2011:156869.CrossRef
Palva JM, Zhigalov A, Hirvonen J, Korhonen O, Linkenkaer-HansenK, Palva S (2013) Neuronal long-range temporal correlations andavalanche dynamics are correlated with behavioral scaling laws.Proc Natl Acad Sci U S A 110:3585–3590. CrossRef Medline
Pan WJ, Thompson GJ, Magnuson ME, Jaeger D, Keilholz S (2013)Infraslow LFP correlates to resting-state fMRI BOLD signals. Neu-roimage 74:288–297. CrossRef Medline
Park HD, Correia S, Ducorps A, Tallon-Baudry C (2014) Spontaneousfluctuations in neural responses to heartbeats predict visual de-tection. Nat Neurosci 17:612–618. CrossRef Medline
Patel AD, Balaban E (2000) Temporal patterns of human corticalactivity reflect tone sequence structure. Nature 404:80–84. Cross-Ref Medline
Poil SS, Hardstone R, Mansvelder HD, Linkenkaer-Hansen K (2012)Critical-state dynamics of avalanches and oscillations jointlyemerge from balanced excitation/inhibition in neuronal networks. JNeurosci 32:9817–9823. CrossRef
Shew WL, Yang H, Yu S, Roy R, Plenz D (2011) Information capacityand transmission are maximized in balanced cortical networkswith neuronal avalanches. J Neurosci 31:55–63. CrossRef Medline
Smit DJ, de Geus EJ, van de Nieuwenhuijzen ME, van BeijsterveldtCE, van Baal GC, Mansvelder HD, Boomsma DI, Linkenkaer-Hansen K (2011) Scale-free modulation of resting-state neuronaloscillations reflects prolonged brain maturation in humans. J Neu-rosci 31:13128–13136. CrossRef
Smit DJ, Linkenkaer-Hansen K, de Geus EJ (2013) Long-range tem-poral correlations in resting-state alpha oscillations predict humantiming-error dynamics. J Neurosci 33:11212–11220. CrossRef
Tort AB, Kramer MA, Thorn C, Gibson DJ, Kubota Y, Graybiel AM,Kopell NJ (2008) Dynamic cross-frequency couplings of local fieldpotential oscillations in rat striatum and hippocampus during per-formance of a T-maze task. Proc Natl Acad Sci U S A 105(51),20517–20522. Medline
Vanhatalo S, Palva JM, Holmes MD, Miller JW, Voipio J, Kaila K(2004) Infraslow oscillations modulate excitability and interictalepileptic activity in the human cortex during sleep. Proc Natl AcadSci U S A 101:5053–5057. CrossRef
Voss RF, Clarke J (1975) ‘1/f noise’ in music and speech. Nature258:317–318. CrossRef
Zhigalov A, Arnulfo G, Nobili L, Palva S, Palva JM (2015) Relationshipof fast- and slow-timescale neuronal dynamics in human MEG andSEEG. J Neurosci 35:5385–5396. CrossRef Medline
New Research 13 of 13
September/October 2016, 3(5) e0191-16.2016 eNeuro.org